
Achieving Intensity Distributions of 6 February 2023 Kahramanmaraş (Türkiye) Earthquakes from Peak Ground Acceleration Records


Abstract
1. Introduction
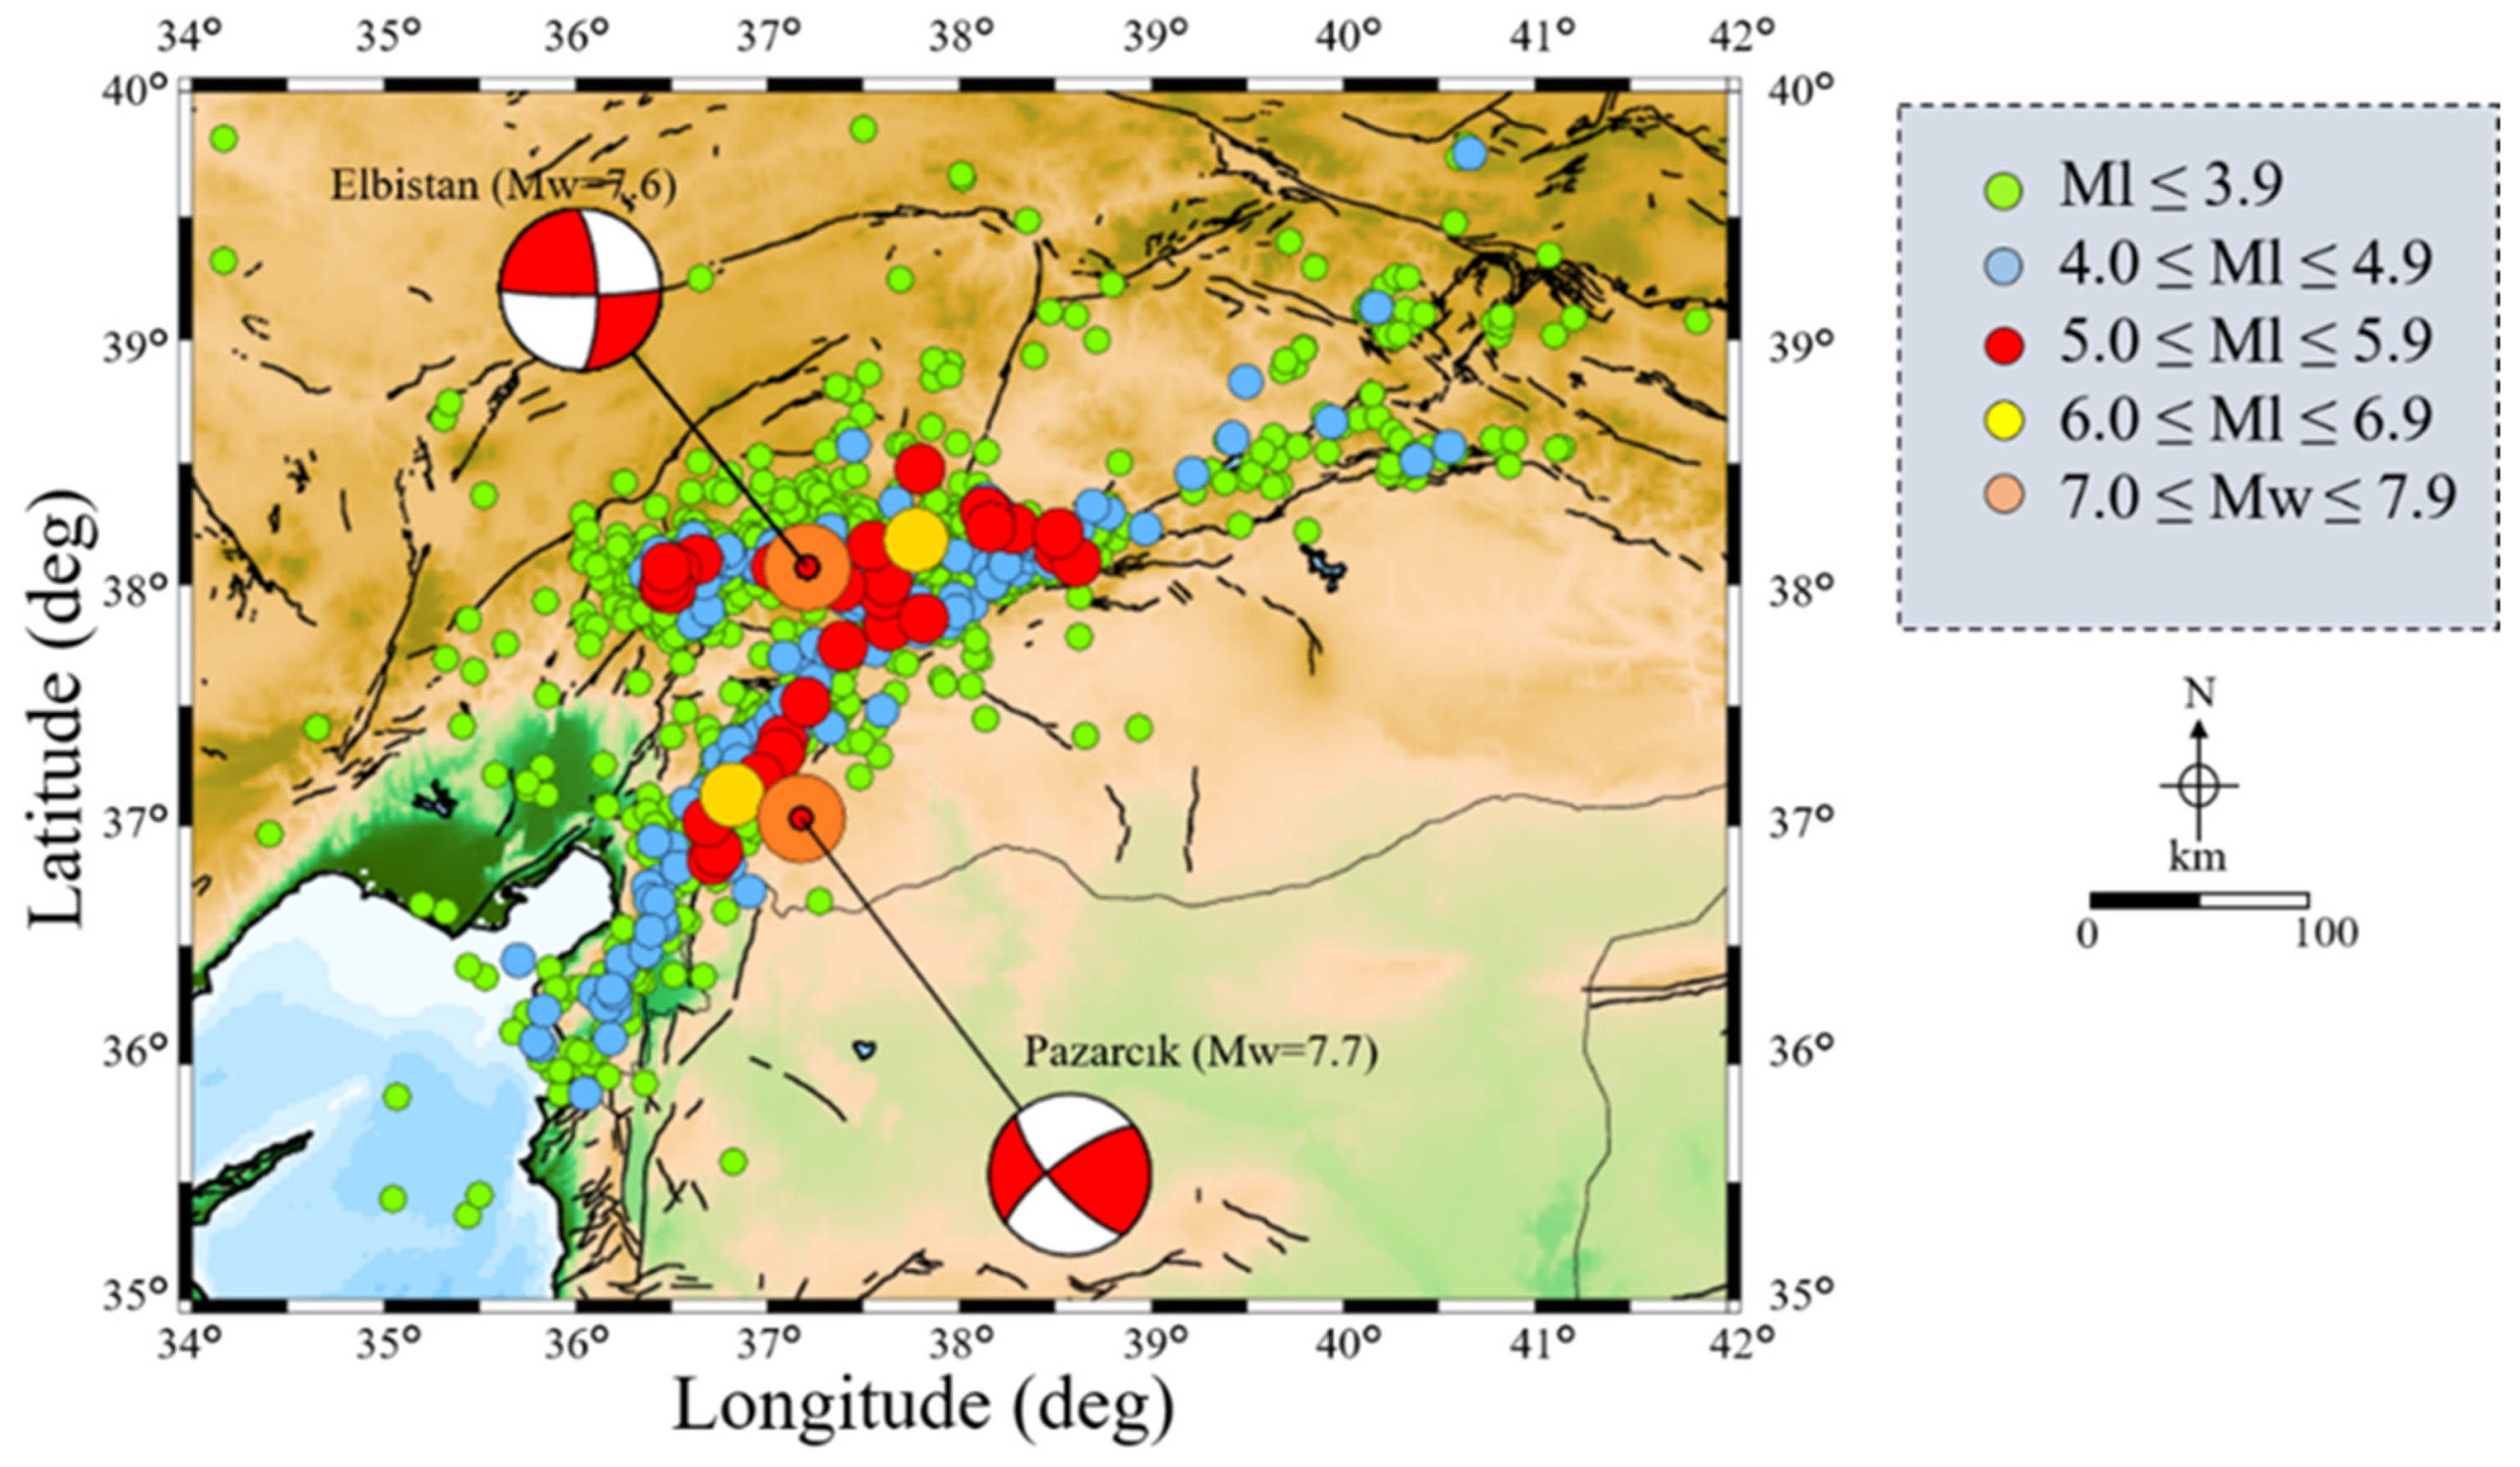
2. Kahramanmaraş Earthquakes on 6 February 2023
3. Method
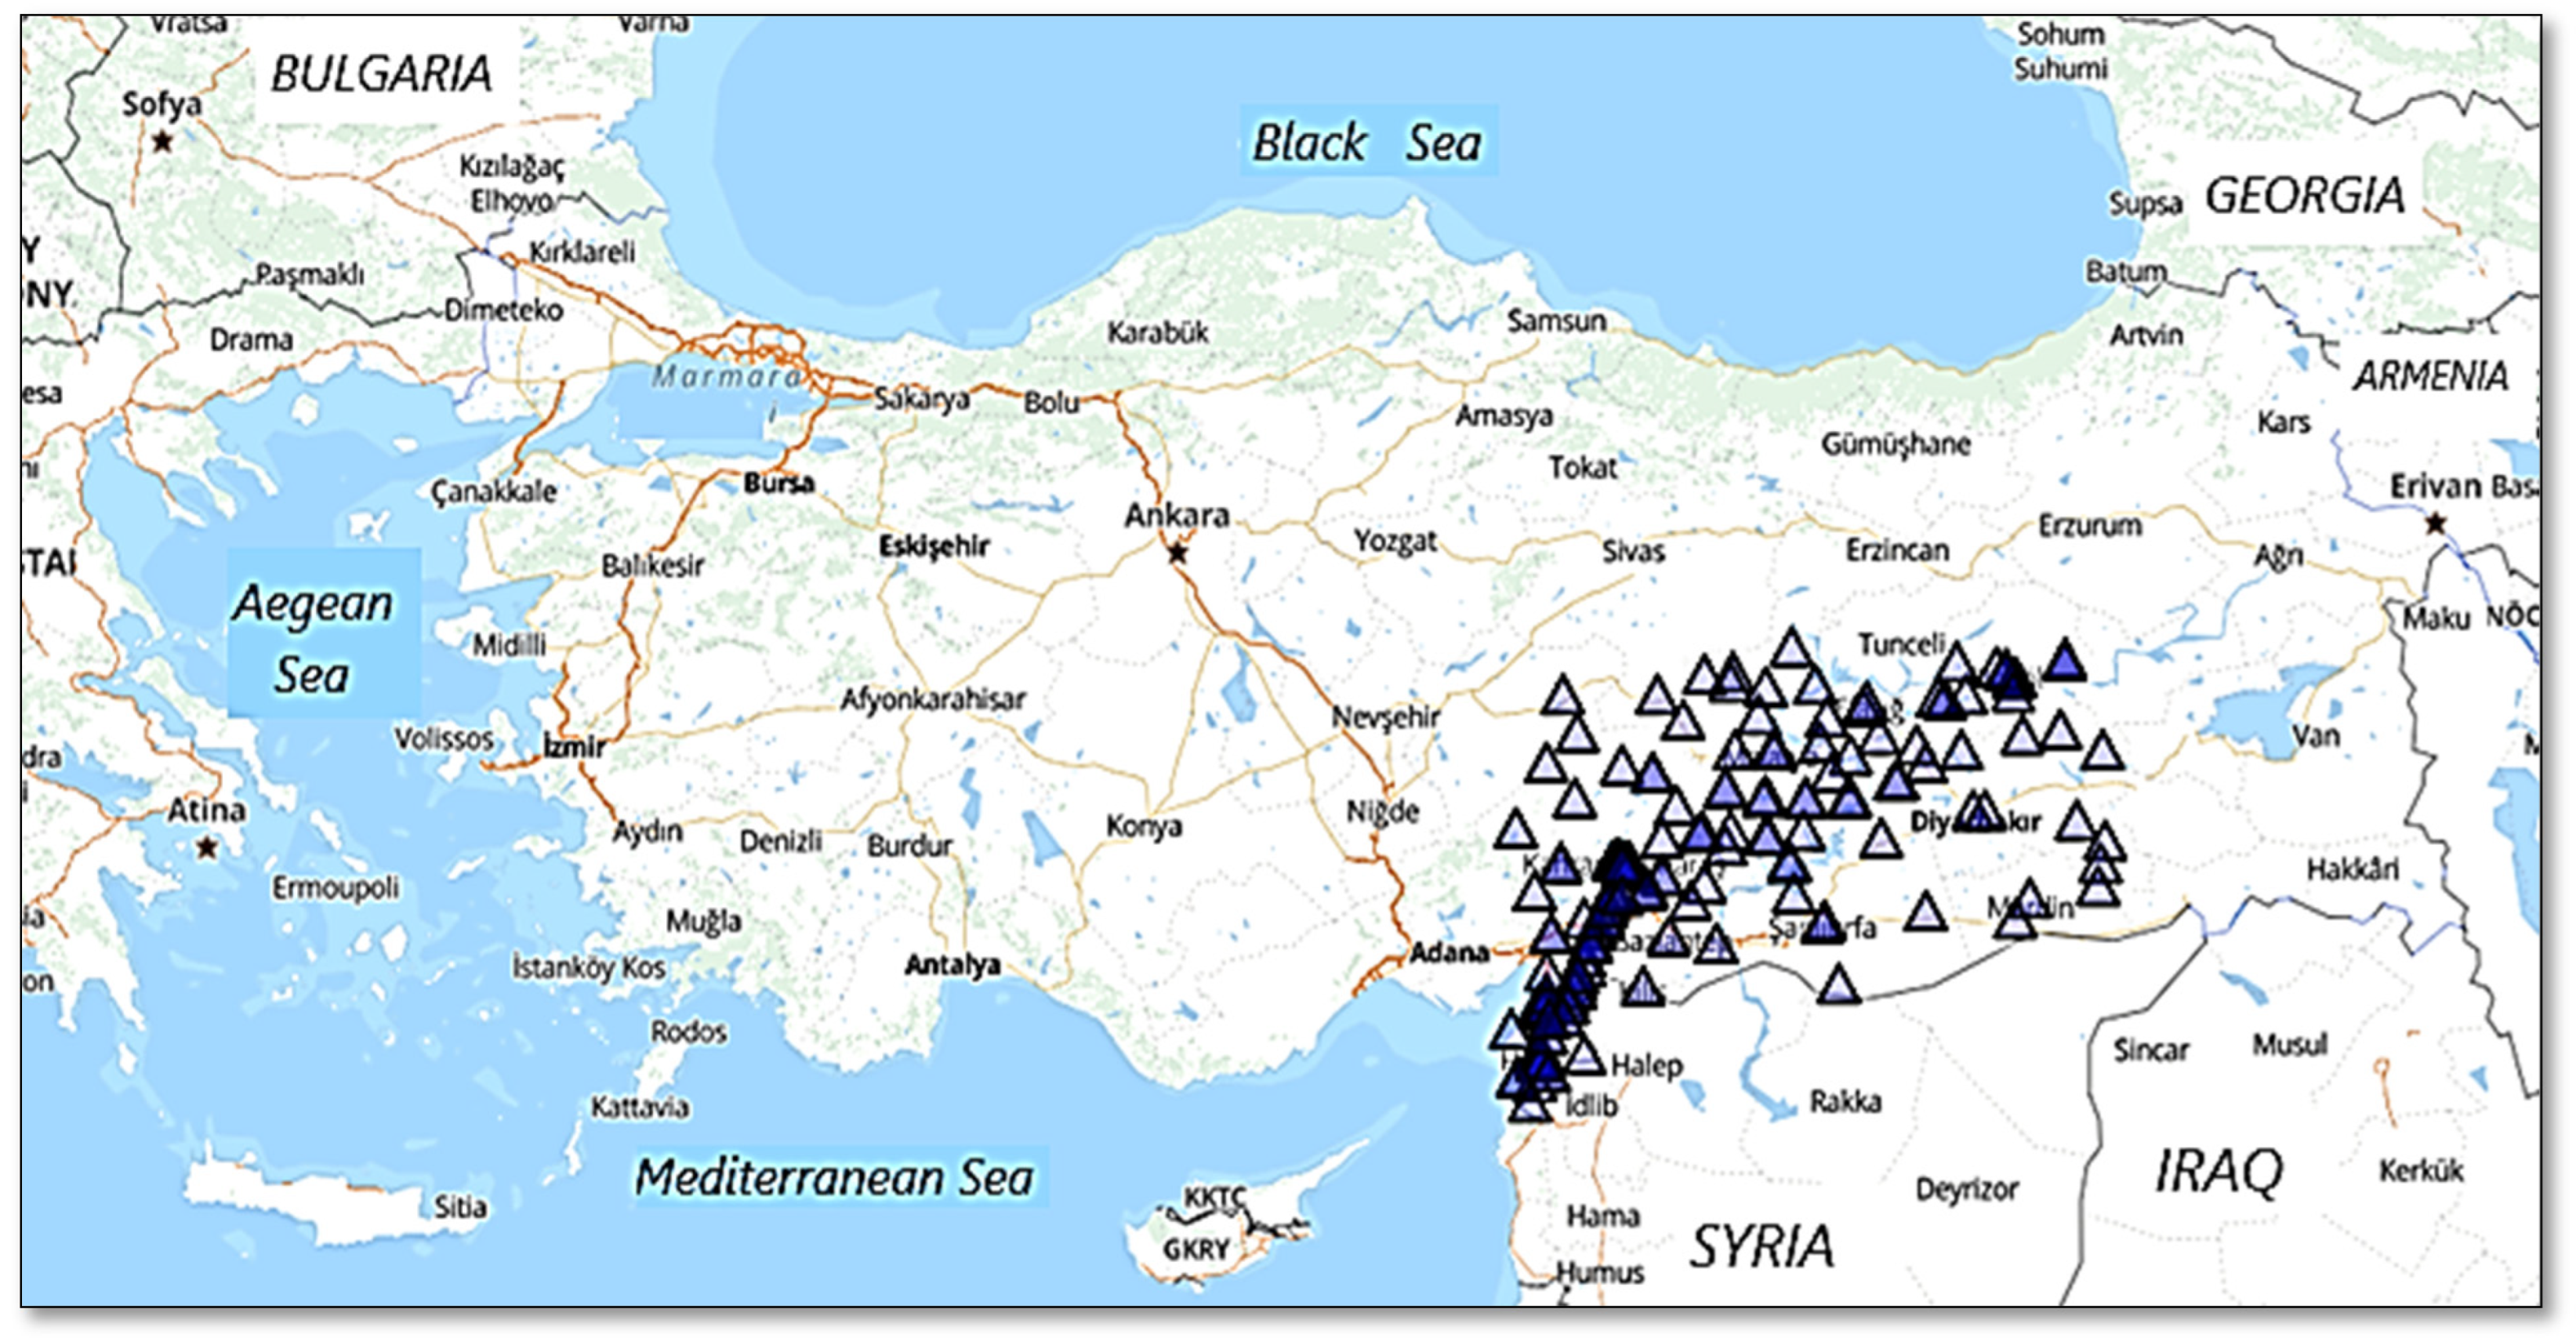
3.1. Strong Motion Database
3.2. Strong-Ground-Motion-to-Intensity Conversion Equations
4. Discussion
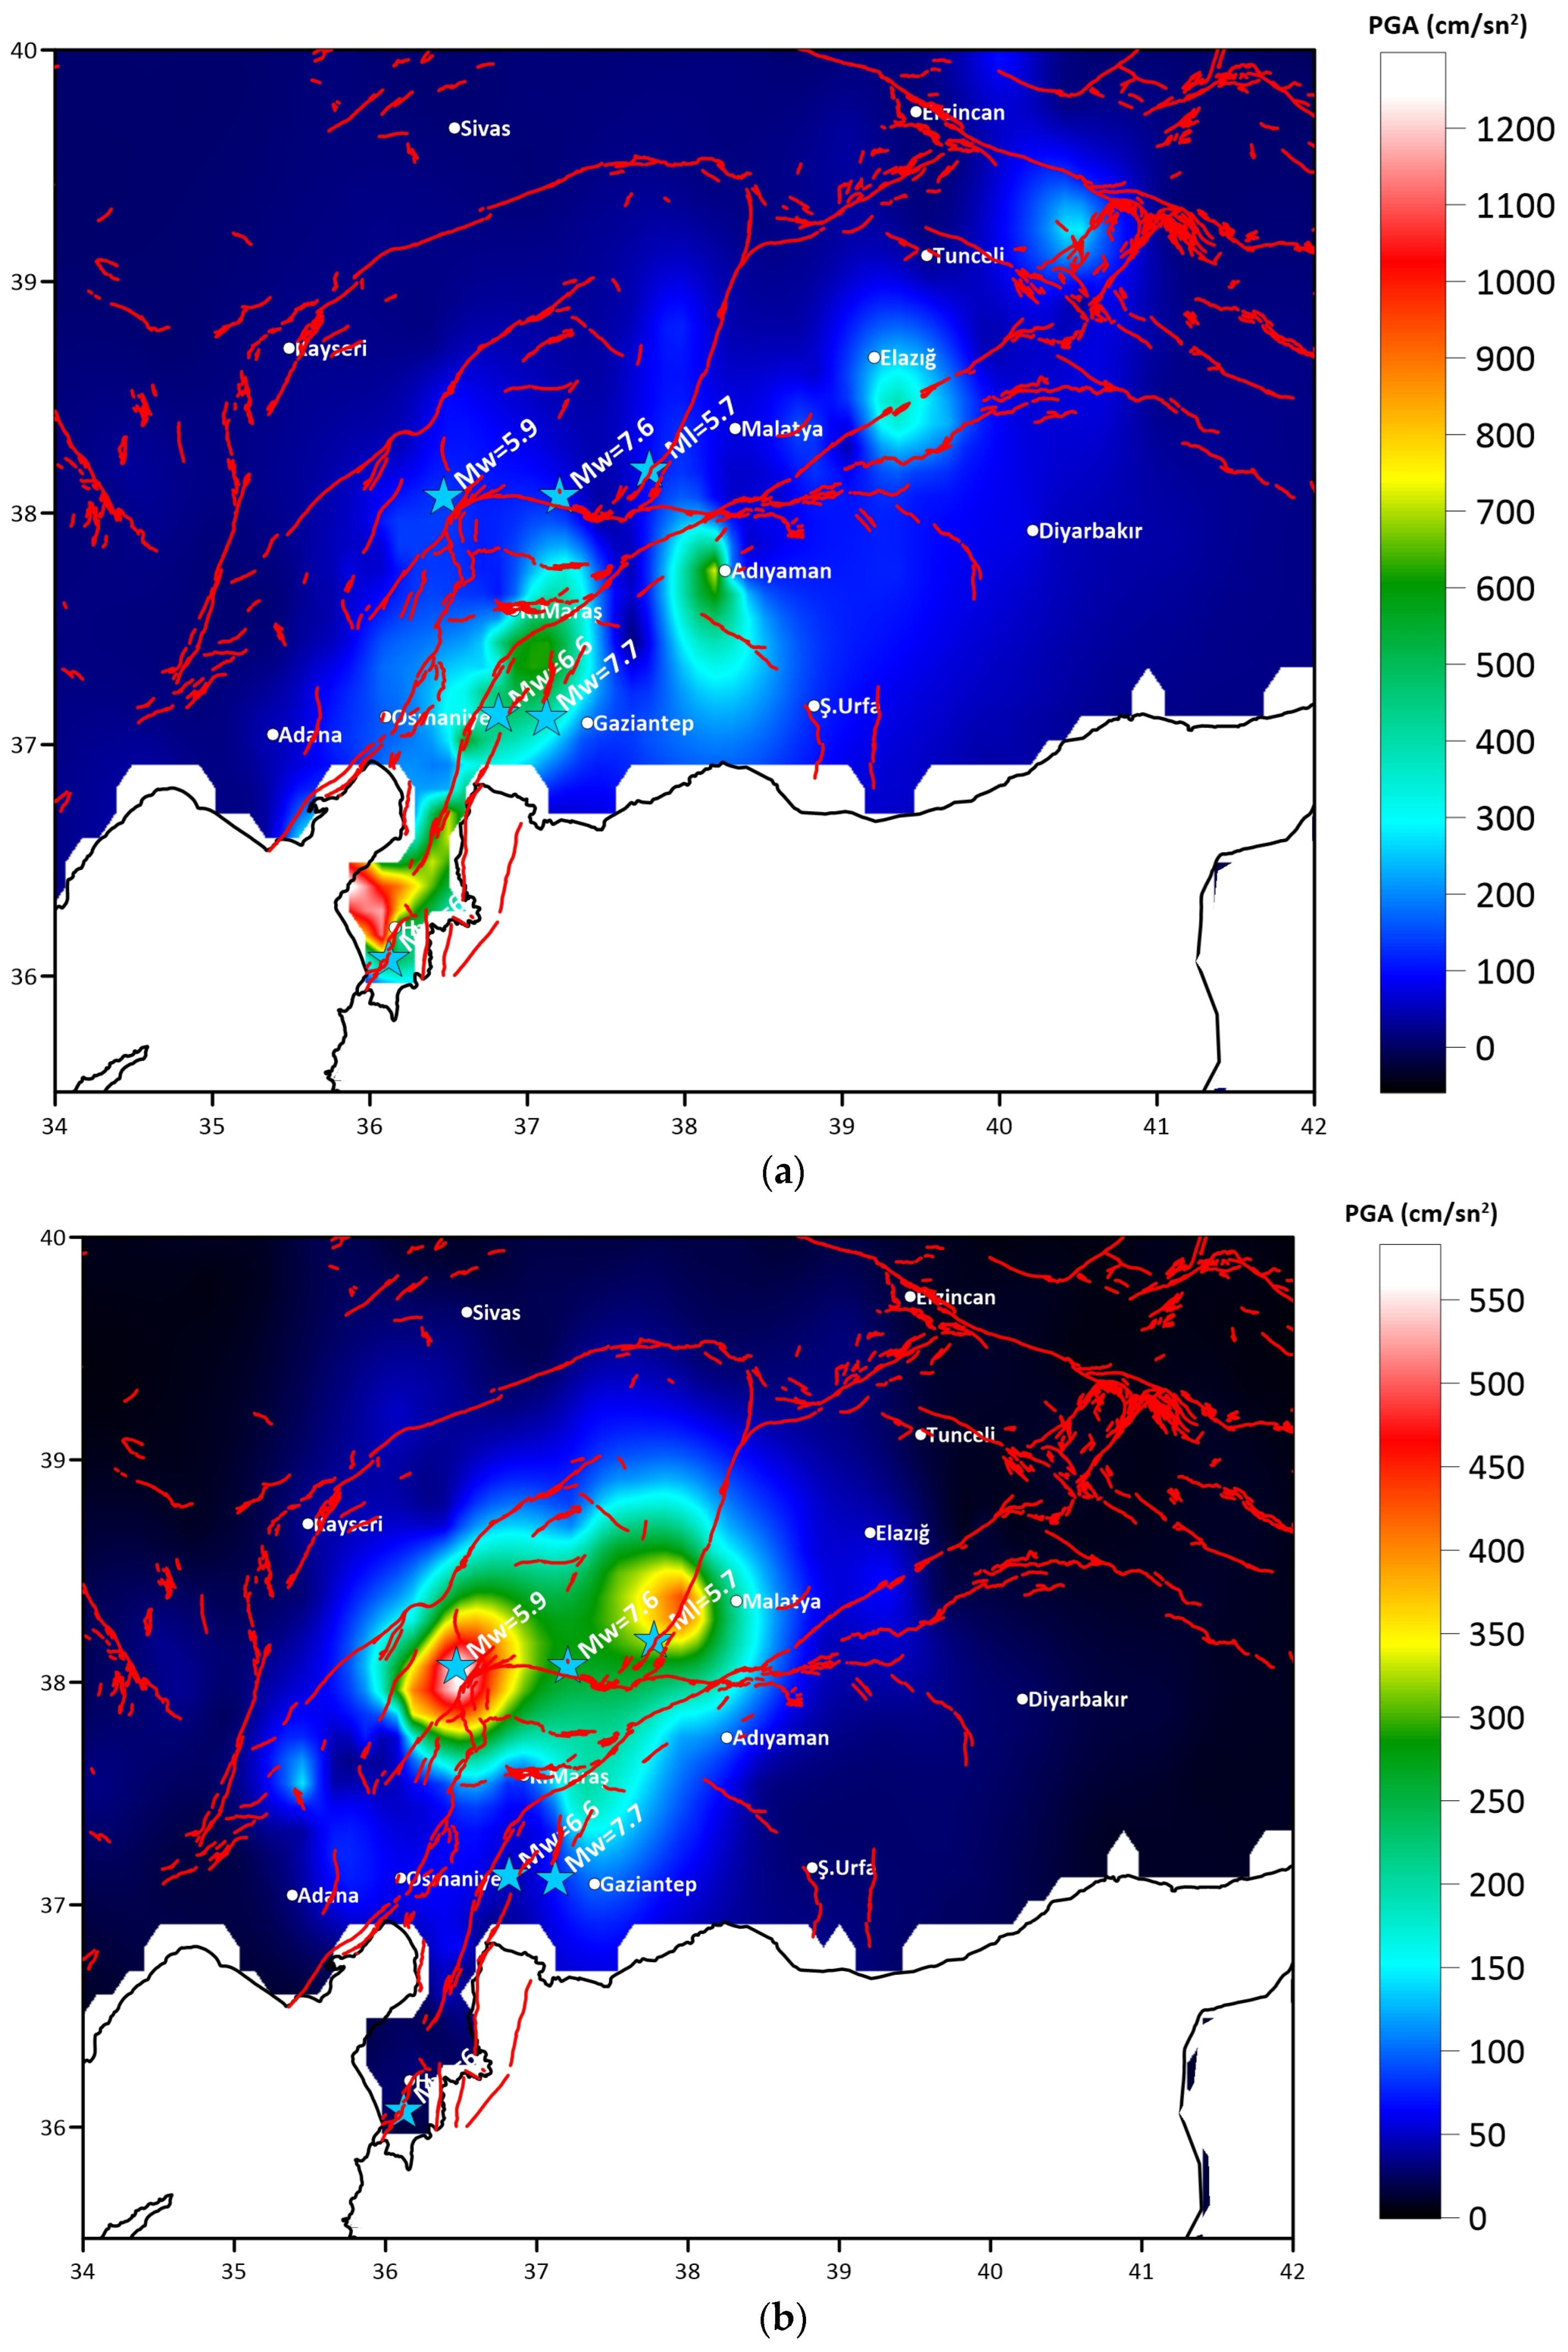
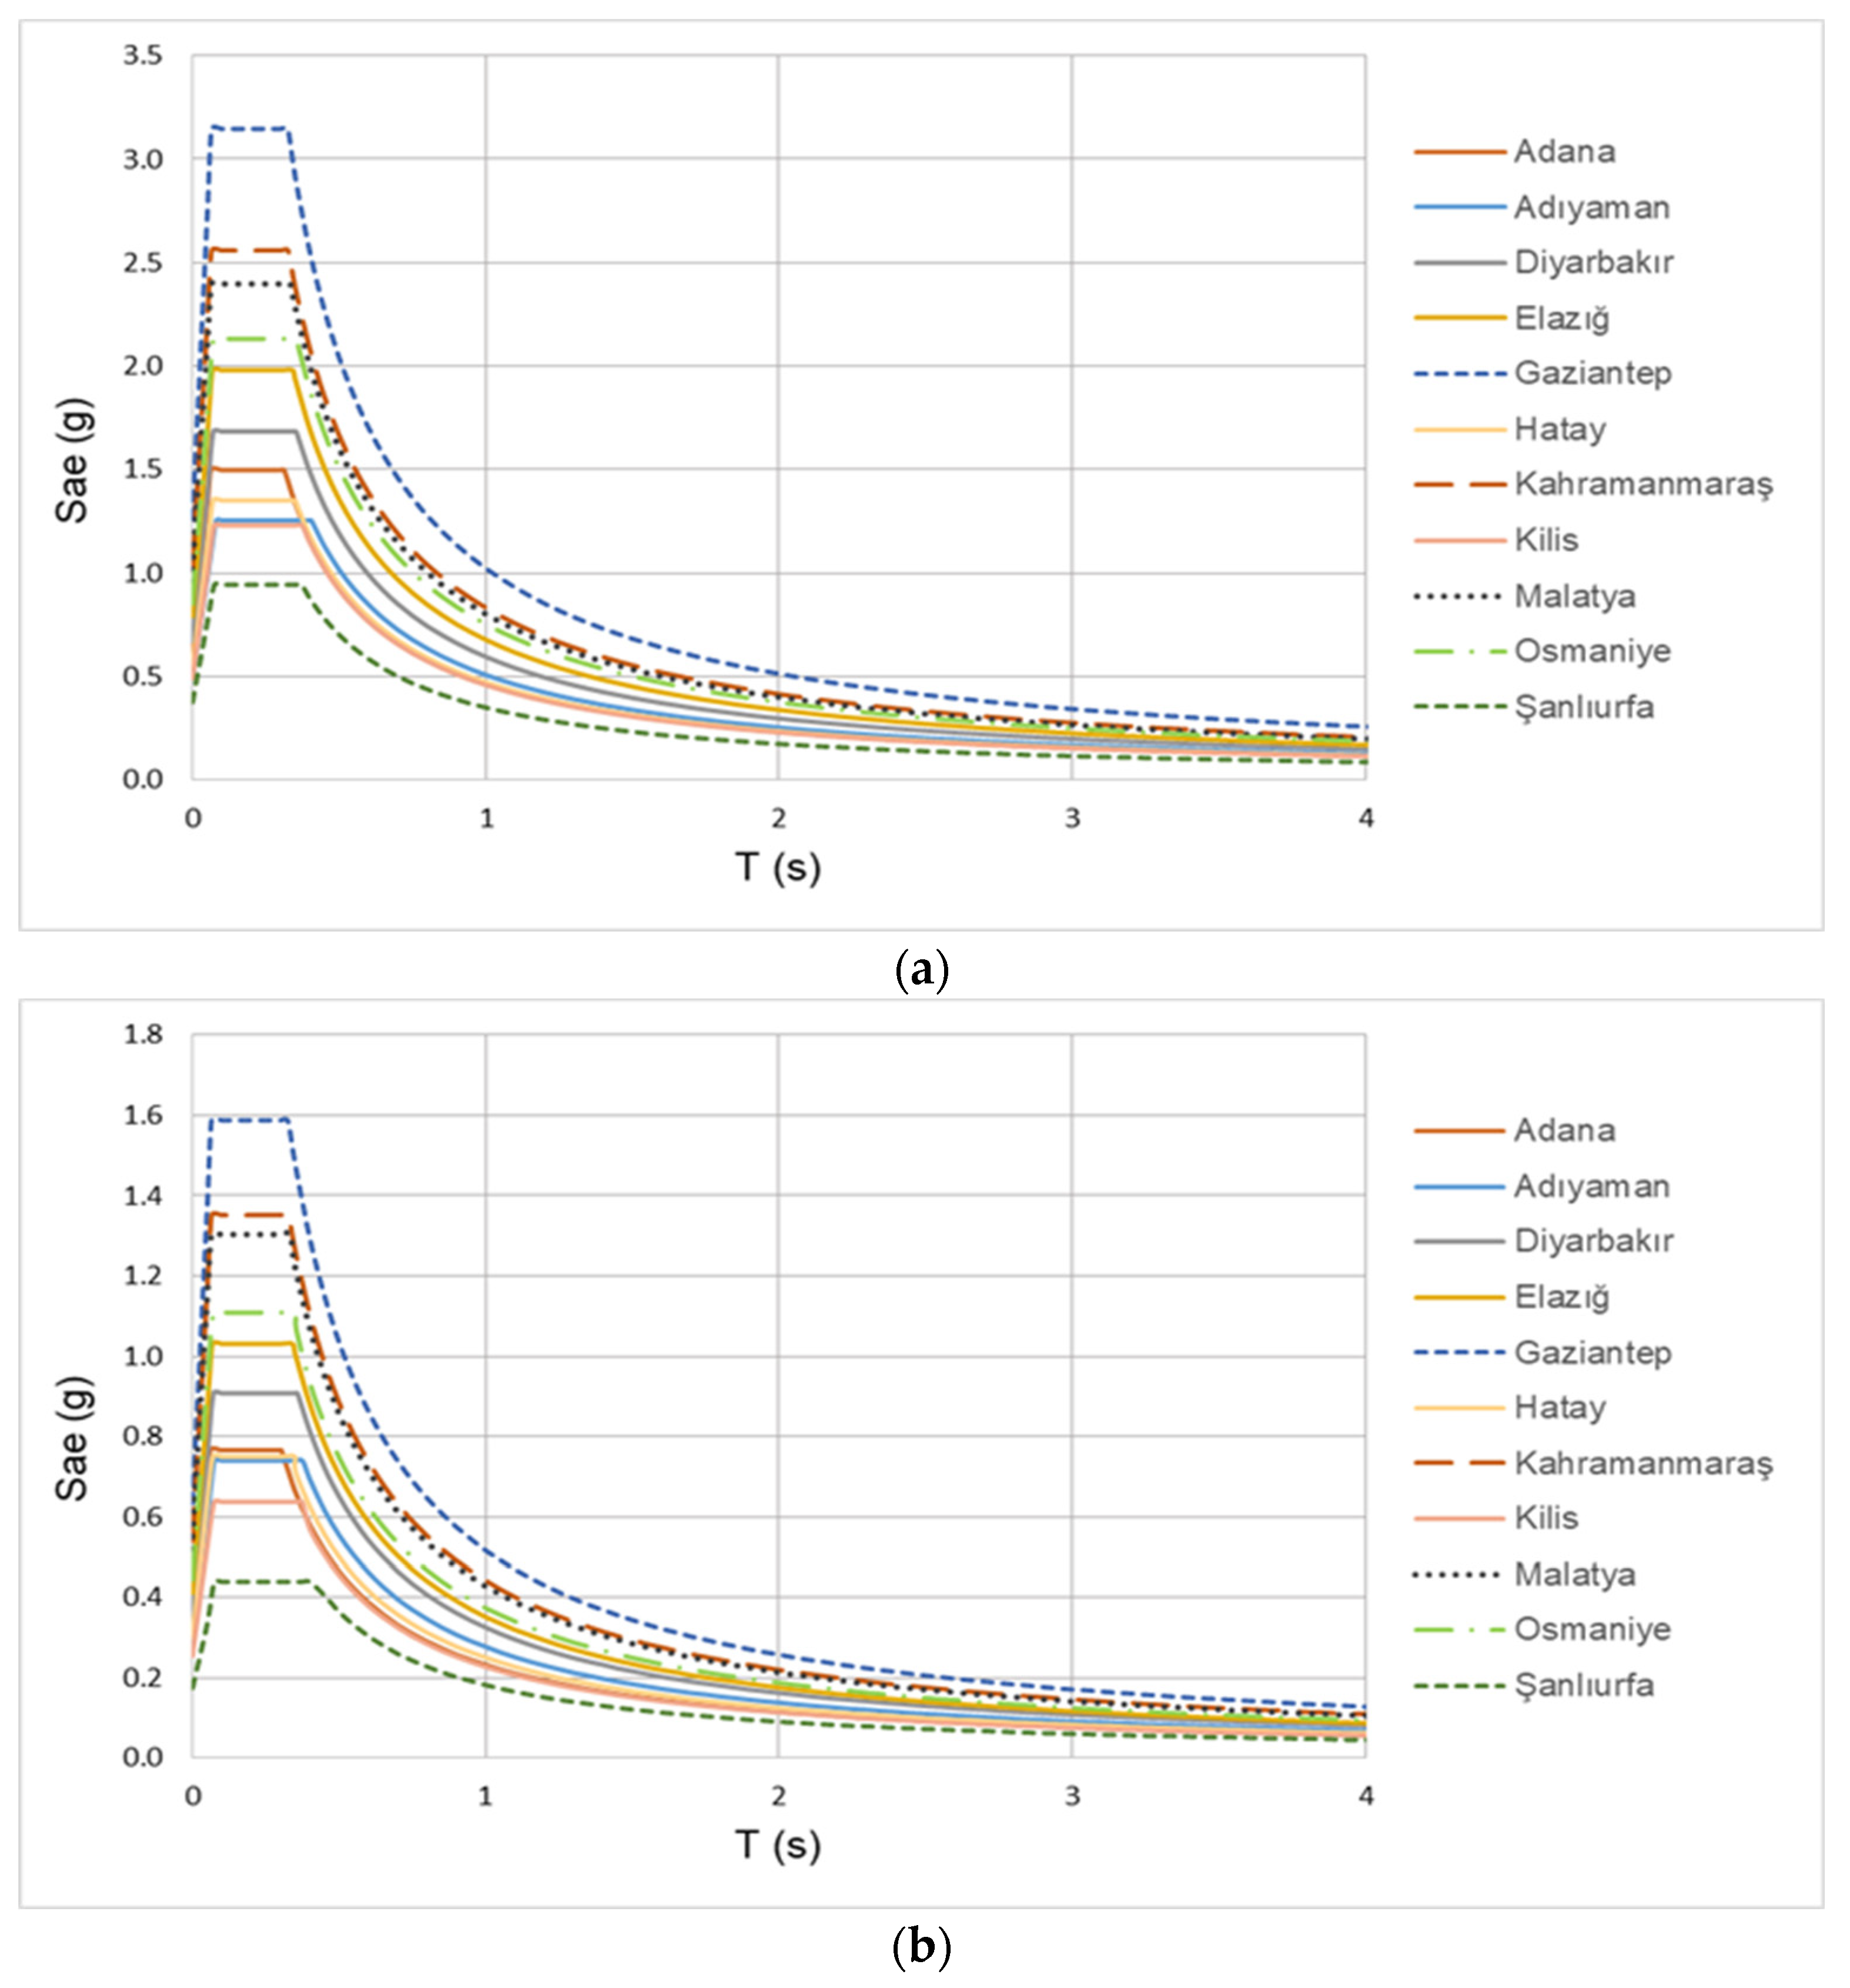
5. Results
6. Conclusions
Author Contributions
Funding
Institutional Review Board Statement
Informed Consent Statement
Data Availability Statement
Acknowledgments
Conflicts of Interest
References
- Florido, E.; Aznarte, J.L.; Morales-Esteban, A.; Martínez-Álvarez, F. Earthquake magnitude prediction based on artificial neural networks: A survey. Croat. Oper. Res. Rev. 2016, 7, 159–169. [Google Scholar]
- Hadzima-Nyarko, M.; Pavić, G.; Lešić, M. Seismic vulnerability of old confined masonry buildings in Osijek, Croatia. Earthq. Struct. 2016, 11, 629–648. [Google Scholar] [CrossRef]
- Strukar, K.; Sipos, T.K.; Jelec, M.; Hadzima-Nyarko, M. Efficient damage assessment for selected earthquake records based on spectral matching. Earthq. Struct. 2019, 17, 271–282. [Google Scholar]
- Grünthal, G.; Musson, R.M. Earthquakes, intensity. In Encyclopedia of Solid Earth Geophysics; Springer: Cham, Switzerland, 2020; pp. 1–7. [Google Scholar]
- Bilgin, H.; Leti, M.; Shehu, R.; Özmen, H.B.; Deringol, A.H.; Ormeni, R. Reflections from the 2019 Durrës Earthquakes: An Earthquake Engineering Evaluation for Masonry Typologies. Buildings 2023, 13, 2227. [Google Scholar] [CrossRef]
- Drei, A.; Milani, G.; Sincraian, G. DEM numerical approach for masonry aqueducts in seismic zone: Two valuable Portuguese examples. Int. J. Mason. Res. Innov. 2017, 2, 1–29. [Google Scholar] [CrossRef]
- Valente, M. Seismic vulnerability assessment and earthquake response of slender historical masonry bell towers in South-East Lombardia. Eng. Fail. Anal. 2021, 129, 105656. [Google Scholar] [CrossRef]
- Wood, H.O.; Newman, F. Modified Mercalli intensity of 1931. Bull. Seismol. Soc. Am. 1931, 21, 277–283. [Google Scholar] [CrossRef]
- Richter, C.F. Elementary Seismology; Freeman: San Francisco, CA, USA, 1958; 168p. [Google Scholar]
- Shebalin, N.V. Seismic Scale and Methods of Measuring Earthquake Intensity. In Foci of Strong Earthquakes in the USSR; IPE AS USSR Publ.: Moscow, Russia, 1978; pp. 87–109. (In Russian) [Google Scholar]
- Trifunac, M.D.; Brady, A.G. On the correlation of seismic intensity scale with the peaks of recorded strong ground motion. Bull. Seismol. Soc. Am. 1975, 65, 139–162. [Google Scholar]
- Murphy, J.R.; O’Brien, L.J. The correlation of peak ground acceleration amplitude with seismic intensity and other physical parameters. Bull. Seismol. Soc. Am. 1977, 67, 877–915. [Google Scholar] [CrossRef]
- Trifunac, M.D.; Westermo, B. A note on the correlation of frequency-dependent duration of strong earthquake ground motion with the modified Mercalli intensity and the geologic conditions at the recording stations. Bull. Seismol. Soc. Am. 1977, 67, 917–927. [Google Scholar]
- Hsu, M.T. Seismology; Lee-Ming Publication Company: Taipei, Taiwan, 1979; pp. 16–26. [Google Scholar]
- McCann, M.; Sauter, F.; Shah, H.C. A technical note on the PGA-intensity relations with applications to damage estimation. Bull. Seismol. Soc. Am. 1980, 70, 631–637. [Google Scholar] [CrossRef]
- Krinitzsky, E.L.; Chang, F.K. Intensity-related earthquake ground motion. Bull. Int. Assoc. Eng. Geol. 1988, 4, 425–435. [Google Scholar] [CrossRef]
- Schenk, V.; Mantlík, F.; Zhizhin, M.N.; Tumarkin, A.G. Relation between macroseismic intensity and instrumental parameters of strong motion –a statistical approach. Nat. Hazards 1990, 3, 111–124. [Google Scholar] [CrossRef]
- Margottini, C.; Molin, D.; Serva, L. Intensity versus ground motion: A new approach using Italian data. Eng. Geol. 1992, 33, 45–58. [Google Scholar] [CrossRef]
- Theodulidis, N.P.; Papazachos, B.C. Dependence of strong ground motion on magnitude-distance, site geology and macroseismic intensity for shallow earthquakes in Greece: I, peak horizontal acceleration, velocity and displacement. Soil. Dyn. Earthq. Eng. 1992, 11, 387–402. [Google Scholar] [CrossRef]
- Theodulidis, N.P.; Papazachos, B.C. Dependence of strong ground motion on magnitude-distance, site geology and macroseismic intensity for shallow earthquakes in Greece: II, horizontal pseudovelocity. Soil. Dyn. Earthq. Eng. 1994, 13, 317–343. [Google Scholar] [CrossRef]
- Panza, G.F.; Cazzaro, R.; Vaccari, F. Correlation between macroseismic intensities and seismic ground motion parameters. Ann. Geophys. 1997, 40, 1371–1382. [Google Scholar] [CrossRef]
- Atkinson, G.M.; Sonley, E. Empirical relationships between Modified Mercalli intensity and response spectra. Bull. Seismol. Soc. Am. 2000, 90, 537–544. [Google Scholar] [CrossRef]
- Boatwright, J.; Thywissen, K.; Seekins, L. Correlation of ground motion and intensity for the 17 January 1994 Northridge, California earthquake. Bull. Seismol. Soc. Am. 2001, 91, 739–752. [Google Scholar] [CrossRef]
- Trifunac, M.D.; Todorovska, M.I. Northridge, California, earthquake of 1994; density of red-tagged buildings versus peak horizontal velocity and intensity of shaking. Soil Dyn. Earthq. Eng. 1994, 16, 209–222. [Google Scholar] [CrossRef]
- Wald, D.J.; Quintoriano, V.; Heaton, T.H.; Kanamori, H. Relationships between peak ground acceleration, peak ground velocity, and Modified Mercalli intensity in California. Earthq. Spectra 1999, 15, 557–564. [Google Scholar] [CrossRef]
- Wald, D.J.; Quintoriano, V.; Heaton, T.H.; Kanamori, H.; Scrivner, C.W.; Worden, C.B. TriNet “ShakeMaps”: Rapid generation of peak ground motion and intensity maps for earthquakes in southern California. Earthq. Spectra 1999, 15, 537–555. [Google Scholar] [CrossRef]
- Kaka, S.I.; Atkinson, G.M. Relationships between felt intensity and instrumental ground motion in the central United States and California. Bull. Seismol. Soc. Am. 2007, 97, 497–510. [Google Scholar]
- Worden, C.B.; Gerstenberger, M.C.; Rhoades, D.A.; Wald, D.J. Probabilistic relationships between ground-motion parameters and modified Mercalli intensity in California. Bull. Seism. Soc. Am. 2012, 102, 204–221. [Google Scholar] [CrossRef]
- Karim, K.R.; Yamazaki, F. Correlation of JMA instrumental seismic intensity with strong motion parameters. Earthq. Eng. Struct. Dyn. 2002, 31, 1191–1212. [Google Scholar] [CrossRef]
- Wu, Y.; Teng, T.; Shin, T.; Hsiao, N. Relationship between peak ground acceleration, peak ground velocity, and intensity in Taiwan. Bull. Seismol. Soc. Am. 2003, 93, 386–396. [Google Scholar] [CrossRef]
- Kaka, S.; Atkinson, G. Relationships between instrumental ground-motion parameters and Modified Mercalli intensity in eastern North America. Bull. Seismol. Soc. Am. 2004, 94, 1728–1736. [Google Scholar] [CrossRef]
- Tselentis, G.A.; Danciu, L. Empirical Relationships between Modified Mercalli Intensity and Engineering Ground-Motion Parameters in Greece. Bull. Seismol. Soc. Am. 2008, 98, 1863–1875. [Google Scholar] [CrossRef]
- Gama Garcia, A.; Gomez Bernal, A. Relationships between instrumental ground motion parameters, and modified Mercalli intensity in Guerrero, Mexico. In Proceedings of the 14th World Conference Earthquake Engineering, Beijing, China, 12–17 October 2008. [Google Scholar]
- Sørensen, M.B.; Stromeyer, D.; Grünthal, G. Estimation of macroseismic intensity—New attenuation and intensity versus ground motion relations for different parts of Europe. In Proceedings of the 14th World Conference on Earthquake Engineering, Beijing, China, 12–17 October 2008. [Google Scholar]
- Linkimer, L. Application of the kriging method to draw isoseismal maps of the significant 2002–2003 Costa Rican earthquakes. Rev. Geol. Am. Cent. 2008, 38, 119–134. [Google Scholar] [CrossRef]
- Faenza, L.; Michelini, A. Regression analysis of MCS intensity and ground motion parameters in Italy and its application in ShakeMap. Geophys. J. Int. 2010, 180, 1138–1152. [Google Scholar] [CrossRef]
- Bayrak, E.; Nas, M.; Bayrak, Y. New macroseismic intensity predictive models for Turkey. Acta Geophys. 2019, 67, 1483–1513. [Google Scholar] [CrossRef]
- Ardeleanu, L.; Neagoe, C.; Ionescu, C. Empirical relationships between macroseimic intensity and instrumental ground motion parameters for the intermediate-depth earthquakes of Vrancea region, Romania. Nat. Hazards 2020, 103, 2021–2043. [Google Scholar] [CrossRef]
- Cilia, M.; Baker, M.L. Ground Motion to Intensity Conversion Equations (GMICEs) for Chilean Megathrust Earthquakes. In Proceedings of the LACSC-SSA 2018 Meeting, Miami, FL, USA, 14–17 May 2018. [Google Scholar]
- Hariyanto, T.; Bioresita, F.; Pribadi, C.B.; Safitri, C.N. Determination of Earthquake Intensity Based on PGA (Peak Ground Acceleration) Using Multi-Event Earthquake Data. IOP Conf. Ser. Earth Environ. Sci. 2021, 731, 012027. [Google Scholar] [CrossRef]
- Konovalov, A.; Orlin, I.; Stepnov, A.; Stepnova, Y. Physically Based and Empirical Ground Motion Prediction Equations for Multiple Intensity Measures (PGA, PGV, Ia, FIV3, CII, and Maximum Fourier Acceleration Spectra) on Sakhalin Island. Geosciences 2023, 13, 201. [Google Scholar] [CrossRef]
- Anugrayanti, A.; Arsyad, M.; Tiwow, V.A. Analysis of susceptible disaster region based on the peak ground acceleration and earthquake intensity in Mamasa 2018. J. Phys. Conf. Ser. 2021, 1816, 012014. [Google Scholar] [CrossRef]
- Tian, X.; Wen, Z.; Zhang, W.; Yuan, J. New Ground Motion to Intensity Conversion Equations for China. Shock Vib. 2021, 2021, 5530862. [Google Scholar] [CrossRef]
- Available online: https://earthquake.usgs.gov/earthquakes/eventpage/us6000jlqa/shakemap/intensity (accessed on 23 November 2023).
- Işık, E.; Avcil, F.; Arkan, E.; Büyüksaraç, A.; İzol, R.; Topalan, M. Structural Damage Evaluation of Mosques and Minarets in Adıyaman due to the 06 February 2023 Kahramanmaraş Earthquakes. Eng. Fail. Anal. 2023, 151, 107345. [Google Scholar] [CrossRef]
- Kahya, V.; Genç, A.F.; Sunca, F.; Roudane, B.; Altunişik, A.C.; Yilmaz, S.; Günaydin, M.; Dok, G.; Kirtel, O.; Demir, A.; et al. Evaluation of earthquake-related damages on masonry structures due to the 6 February 2023 Kahramanmaraş-Türkiye earthquakes: A case study for Hatay Governorship Building. Eng. Fail. Anal. 2024, 156, 107855. [Google Scholar] [CrossRef]
- Işık, E. Structural Failures of Adobe Buildings during the February 2023 Kahramanmaraş (Türkiye) Earthquakes. Appl. Sci. 2023, 13, 8937. [Google Scholar] [CrossRef]
- Avcil, F. Investigation of Precast Reinforced Concrete Structures during the 6 February 2023 Türkiye Earthquakes. Sustainability 2023, 15, 14846. [Google Scholar] [CrossRef]
- Karasin, I.B. Comparative Analysis of the 2023 Pazarcık and Elbistan Earthquakes in Diyarbakır. Buildings 2023, 13, 2474. [Google Scholar] [CrossRef]
- İnce, O. Structural damage assessment of reinforced concrete buildings in Adıyaman after Kahramanmaraş (Türkiye) Earthquakes on 6 February 2023. Eng. Fail. Anal. 2024, 156, 107799. [Google Scholar] [CrossRef]
- Ozturk, M.; Arslan, M.H.; Korkmaz, H.H. Effect on RC buildings of 6 February 2023 Turkey earthquake doublets and new doctrines for seismic design. Eng. Fail. Anal. 2023, 153, 107521. [Google Scholar] [CrossRef]
- Zengin, B.; Aydin, F. The Effect of Material Quality on Buildings Moderately and Heavily Damaged by the Kahramanmaraş Earthquakes. Appl. Sci. 2023, 13, 10668. [Google Scholar] [CrossRef]
- Işık, E.; Shendkar, M.R.; Avcil, F.; Büyüksaraç, A.; Deshpande, S.S. A Study on the Determination of Damage Levels in Reinforced Concrete Structures during the Kahramanmaraş Earthquake on February 06, 2023. E3S Web Conf. 2023, 405, 04029. [Google Scholar] [CrossRef]
- Işık, E.; Büyüksaraç, A.; Avcil, F.; Arkan, E.; Ulu, A.E.; Aydin, M.C. Damage evaluation of masonry buildings during Kahramanmaraş (Türkiye) earthquakes on February 06, 2023. Earthq. Struct. 2023, 25, 209. [Google Scholar]
- Zhu, J.; Li, S.; Wei, Y.; Song, J. On-site instrumental seismic intensity prediction for China via recurrent neural network and transfer learning. J. Asian Earth Sci. 2023, 248, 105610. [Google Scholar] [CrossRef]
- Hershberger, J. A comparison of earthquake accelerations with intensity ratings. Bull. Seismol. Soc. Am. 1956, 46, 317–320. [Google Scholar] [CrossRef]
- Sauter, F.; Shah, H.C. Estudio de Seguro contra Terremoto; Franz Sauter y Asociados Ltd.: San José, Costa Rica, 1978; 250p. [Google Scholar]
- Gallipoli, M.R.; Calamita, G.; Tragni, N.; Pisapia, D.; Lupo, M.; Mucciarelli, M.; Stabile, T.A.; Perrone, A.; Amato, L.; Izzi, F.; et al. Evaluation of soil-building resonance effect in the urban area of the city of Matera (Italy). Eng. Geol. 2020, 272, 105645. [Google Scholar] [CrossRef]
- Gallipoli, M.R.; Mucciarelli, M.; Ponzo, F.; Dolce, M.; D’Alema, E.; Maistrello, M. Buildings as a seismic source: Analysis of a release test at Bagnoli, Italy. Bull. Seismol. Soc. Am. 2006, 96, 2457–2464. [Google Scholar] [CrossRef]
- Gutenberg, B.; Richter, C.F. Earthquake magnitude, intensity, energy, and acceleration. Bull. Seismol. Soc. Am. 1942, 32, 163–191. [Google Scholar] [CrossRef]
- Gutenberg, B.; Richter, C.F. Earthquake magnitude, intensity, energy, and acceleration (second paper). Bull. Seismol. Soc. Am. 1956, 46, 105–145. [Google Scholar] [CrossRef]


| Date/Time | Coordinates | Location | Magnitude (Mw) | Depth (km) | Source | Eq. Intensity |
|---|---|---|---|---|---|---|
| 6 February 2023 04:17:34 (TSI) | 37.288° N 37.043° E | Pazarcık (Kahramanmaraş) | 7.7 | 8.60 | AFAD | XI (11.28) |
| 37.225° N 37.021° E | 7.8 | 10.0 | USGS | XI (11.2) | ||
| 6 February 2023 13:24:47 (TSI) | 38.089° N 37.239° E | Ekinözü, Elbistan (Kahramanmaraş) | 7.6 | 7.0 | AFAD | XI (11.44) |
| 38.024° N 37.203° E | 7.5 | 10 | USGS | X–XI (10.75) |
| Mw = 7.7 | ||||||||
|---|---|---|---|---|---|---|---|---|
| Station | Province/District | PGA (cm/s2) | Repi | TBEC-2018 | 1996 | |||
| DD1 | DD2 | DD3 | DD4 | 10% | ||||
| 0131 | Adana /Saimbeyli | 159.77 | 103.35 | 0.519 | 0.262 | 0.086 | 0.057 | 0.1 |
| 0213 | Adıyaman/Tut | 242.28 | 96.48 | 0.809 | 0.440 | 0.147 | 0.094 | 0.4 |
| 2104 | Diyarbakır/Ergani | 116.47 | 262.22 | 0.572 | 0.320 | 0.137 | 0.100 | 0.4 |
| 2310 | Elazığ/Baskil | 60.46 | 211.7 | 0.676 | 0.360 | 0.138 | 0.092 | 0.3 |
| 2718 | Gaziantep/Islahiye | 654.43 | 48.3 | 1.061 | 0.563 | 0.166 | 0.107 | 0.4 |
| 3135 | Hatay/Arsuz | 1372.07 | 142.15 | 0.468 | 0.256 | 0.106 | 0.076 | 0.4 |
| 4414 | Malatya/Kale | 163.84 | 195.07 | 0.809 | 0.451 | 0.175 | 0.115 | 0.4 |
| 4614 | Kahramanmaraş/Pazarcık | 2039.20 | 31.42 | 0.853 | 0.470 | 0.157 | 0.100 | 0.4 |
| 6304 | Şanlıurfa/Bozova | 238.23 | 130.27 | 0.339 | 0.151 | 0.055 | 0.037 | 0.2 |
| 7901 | Kilis/Centre | 53.11 | 64.7 | 0.427 | 0.210 | 0.079 | 0.057 | 0.1 |
| 8002 | Osmaniye/Bahçe | 242.95 | 43.91 | 0.719 | 0.391 | 0.140 | 0.095 | 0.4 |
| Mw = 7.6 | ||||||||
|---|---|---|---|---|---|---|---|---|
| Station | Province/District | PGA (cm/s2) | Repi | TBEC-2018 | 1996 | |||
| DD1 | DD2 | DD3 | DD4 | 10% | ||||
| 0131 | Adana/Saimbeyli | 402.30 | 101.83 | 0.519 | 0.262 | 0.086 | 0.057 | 0.1 |
| 0213 | Adıyaman/Tut | 126.62 | 68.73 | 0.809 | 0.440 | 0.147 | 0.094 | 0.4 |
| 2107 | Diyarbakır/Çermik | 47.61 | 196.48 | 0.566 | 0.316 | 0.132 | 0.095 | 0.4 |
| 2308 | Elazığ/Sivrice | 69.80 | 185.23 | 1.101 | 0.622 | 0.230 | 0.145 | 0.4 |
| 2703 | Gaziantep/Şahinbey | 93.68 | 115.06 | 0.340 | 0.175 | 0.072 | 0.052 | 0.2 |
| 3144 | Hatay/Hassa | 78.11 | 156.81 | 1.134 | 0.603 | 0.173 | 0.109 | 0.4 |
| 4406 | Malatya/Akçadağ | 467.20 | 70.17 | 0.857 | 0.395 | 0.111 | 0.073 | 0.3 |
| 4612 | Kahramanmaraş/Göksun | 635.45 | 66.68 | 0.624 | 0.296 | 0.086 | 0.056 | 0.3 |
| 6306 | Şanlıurfarfa/Akçakale | 36.00 | 213.7 | 0.159 | 0.075 | 0.028 | 0.020 | 0.1 |
| 7901 | Kilis/Centre | 50.91 | 153.88 | 0.427 | 0.210 | 0.079 | 0.057 | 0.1 |
| 8003 | Osmaniye/Centre | 66.60 | 140.65 | 0.597 | 0.311 | 0.115 | 0.079 | 0.4 |
| No | Location | Equation | Intensity Range | References |
|---|---|---|---|---|
| 1 | Western USA | MMI = 3.00 log (PGAave) + 1.50 | All | [9,50,51] |
| 2 | Western USA | MMI = 2.33 log (PGAave) + 2.1 | All | [56] |
| 3 | Western USA | MMI = 3.33 log (PGAave) − 0.47 | IV < MMI < X | [11] |
| 4 * | Western USA, Japan, Southern Europe | MMI = 2.86 log (PGAave) + 1.24 MMI = 4.00 log (PGAmax) − 1.00 | IV < MMI < X IV < MMI < VIII | [12] |
| 5 | Costa Rica | MMI = 3.62 log (PGAave) − 0.90 | All | [57] |
| 6 * | California | MMI = 2.20 log (PGAmax) + 1.00 MMI = 3.66 log (PGAmax) − 1.66 | MMI < V V < MMI < VIII | [25] |
| 7 | California | MMI = (4.36 + 0.71) log (PGA) − (3.88 − 1.76) | All | [23] |
| 8 | Taiwan | MMI = 2.00 log (PGA) + 0.7 | All | [14,30] |
| 9 * | Costa Rica | MMI = 2.30 log (PGAmax) + 0.92 MMI = 3.82 log (PGAmax) − 1.78 MMI = 2.33 log (PGAave) + 0.76 MMI = 4.60 log (PGAave) − 3.38 | II > MMI > V V > MMI > VII II > MMI > V V > MMI > VII | [35] |
| 10 | Türkiye | MMI = log (PGA) + 0.427/0.3392 | All | [37] |
| 11 | This Study | MMI = 3.02 log (PGA) + 1.62 | MMI > IX |
Disclaimer/Publisher’s Note: The statements, opinions and data contained in all publications are solely those of the individual author(s) and contributor(s) and not of MDPI and/or the editor(s). MDPI and/or the editor(s) disclaim responsibility for any injury to people or property resulting from any ideas, methods, instructions or products referred to in the content. |
© 2024 by the authors. Licensee MDPI, Basel, Switzerland. This article is an open access article distributed under the terms and conditions of the Creative Commons Attribution (CC BY) license (https://creativecommons.org/licenses/by/4.0/).
Share and Cite
Büyüksaraç, A.; Işık, E.; Bektaş, Ö.; Avcil, F. Achieving Intensity Distributions of 6 February 2023 Kahramanmaraş (Türkiye) Earthquakes from Peak Ground Acceleration Records. Sustainability 2024, 16, 599. https://doi.org/10.3390/su16020599
Büyüksaraç A, Işık E, Bektaş Ö, Avcil F. Achieving Intensity Distributions of 6 February 2023 Kahramanmaraş (Türkiye) Earthquakes from Peak Ground Acceleration Records. Sustainability. 2024; 16(2):599. https://doi.org/10.3390/su16020599
Chicago/Turabian StyleBüyüksaraç, Aydın, Ercan Işık, Özcan Bektaş, and Fatih Avcil. 2024. "Achieving Intensity Distributions of 6 February 2023 Kahramanmaraş (Türkiye) Earthquakes from Peak Ground Acceleration Records" Sustainability 16, no. 2: 599. https://doi.org/10.3390/su16020599
APA StyleBüyüksaraç, A., Işık, E., Bektaş, Ö., & Avcil, F. (2024). Achieving Intensity Distributions of 6 February 2023 Kahramanmaraş (Türkiye) Earthquakes from Peak Ground Acceleration Records. Sustainability, 16(2), 599. https://doi.org/10.3390/su16020599