Abstract
The stoichiometric characteristics of carbon (C), nitrogen (N), and phosphorus (P) in soil can directly reflect the level of soil fertility. In this study, a secondary forest, two kinds of plantation forests (Dacrycarpus imbricatus and Pinus caribaea Morelet), and a primary forest in tropical areas were selected for soil sample collection and analysis. We found that the soil [leucine aminopeptidase (LAP) + β-N-acetylglucosidase (NAG)]/acid phosphatase (APho) value was less than 1, indicating that there was P limitation. In addition, we also found that compared with primary forest, the β-glucosidase (BG) activity and (LAP + NAG) activity of the secondary forest were lower, and the microbial biomass carbon (MBC) and microbial biomass nitrogen (MBN) contents were higher. The contents of total nitrogen (TN) and MBN in the Dacrycarpus imbricatus forest soil were significantly higher than those in the primary forest, but the activity of (LAP + NAG) was lower. The structural equation model showed that the factors that significantly affected the total nutrients were the available nutrients (0.396**) and the enzyme activities (0.600**). For the long-term requirements of sustainable development, ecological adjustment and soil nutrient optimization of plantations should be carried out scientifically.
1. Introduction
As a focus of research on forest carbon (C) sequestration capacity, tropical forests occupy 7–10% of the Earth’s land surface but store 25% of the world’s aboveground and subsurface forest C and account for 34% of land primary productivity [1]. There are approximately 45,000 species of trees worldwide, 96% of which grow in tropical forests [2]. As a result, tropical forests are rich in tree species diversity, providing rich economic and ecological benefits to humanity [3].
As ancient and large C sinks, tropical forests are being degraded worldwide by climate change, deforestation, and fires [2]. The researchers’ statistical observations of the Amazon forest show that human activities have caused approximately 17% of forest loss in the Amazon region over the past 40 to 50 years. This has led to forest degradation, increased fires, and increased C emissions in the region [4]. Therefore, we should pay more attention to the conservation of tropical forests and the impact of forest type change on the environment.
Carbon (C), nitrogen (N), and phosphorus (P) are not only the basic elements that constitute plants and significantly affect plant growth and development but are also important indicators to measure soil fertility and soil ecological functions [5]. The stoichiometric characteristics of soil C, N, and P can directly reflect the level of soil fertility and indirectly reflect the nutritional status of plants [6]. Although the distribution of soil elements is highly spatially heterogeneous under the action of many complex soil-forming factors, studies at the global, regional, and ecosystem levels have shown that soil C, N, and P cycles are often closely coupled with each other [7]. For example, the C:N of soil is inversely proportional to the rate of decomposition. The C:P ratio is a good indicator of soil P availability [8]. Specific ratios of C, N, and P have been shown to be effective tools for analyzing ecosystem material balance and life processes [9].
On the other hand, soil available nutrients refer to those nutrients that can be directly utilized by plants from soil. As a part of the soil organic carbon (SOC) pool, dissolved organic carbon (DOC) is easily affected by the external environment and moves quickly in the soil, so it has a significant impact on soil nutrient cycling [10]. Dissolved organic nitrogen (DON) and available phosphorus (AP) adjust the structure and function of ecosystems by affecting species diversity, thus regulating the C cycle of terrestrial ecosystems [11,12]. Soil microbial biomass carbon (MBC) accounts for approximately 1–5% of SOC and is regarded as an important indicator of soil fertility and biological quality [13]. Soil microbial biomass is not only a part of nutrients in terrestrial ecosystems but also plays an important role in soil nutrient cycling and is an unstable reservoir of available nutrients for terrestrial plants. The response of soil microbial biomass elements to the soil environment, especially the relationship between C, N, and P and the soil status, is expressed as the C:N:P of soil microbial biomass, which is crucial for the study of nutrient restriction of soil microbial biomass [13]. Various extracellular enzymes are produced by soil microorganisms, whose function is to regulate soil nutrient cycling. Almost all biochemical reactions require enzymes as catalysts, so soil extracellular enzymes participate in the cycling process of nutrients (i.e., C, N, P, etc.) in soil [14]. The results of soil extracellular enzyme activity and its stoichiometric characteristics are closely related to soil nutrient cycling processes [15]. Xiao et al. demonstrated that, at a regional scale, the stoichiometric characteristics of extracellular enzymes can change significantly depending on soil texture and environmental conditions [16].
Cleveland and Liptzin showed that the contents of C, N, and P changed significantly on a global scale, but C:N:P in soil was relatively constant, and its atomic ratio was 186:13:1 [17]. The microbial biomass in grassland and forest soil had a C:N:P atomic ratio of 60:7:1, and the contents of C, N and P were positively correlated. Kirkby et al. found that the ratio of C, N, and P in soil humus in Australia was close to that in other study areas by comparing the research results of other countries worldwide [18]. However, the research results of Bui et al. [19] were different from those of Kirkby et al. [18], who showed that different vegetation types would lead to significant variability in soil C:N and C:P. According to statistics, the average atomic C:N:P of the 0–20 cm surface soil of 1069 paddy fields and dryland in southern China was 80:7.9:1 and 70.2:6:1, respectively [20]. In different regions, economic and social development and human production activities lead to changes in forest types, which in turn affect the C, N, and P contents and cycling characteristics of different forest types [21]. Other scholars have studied the ecological stoichiometric characteristics of herbaceous and woody plant communities in different regions and the distribution of and changes in basic nutrient elements to clarify the impact and adaptability of plant communities to local environmental changes [22]. At present, studies on the ecological stoichiometric characteristics of soil C, N, and P and their regulatory factors mainly focus on marine, wetland, grassland, and some forest ecosystems. There are few studies on the effects of different tropical forest types on soil C, N, and P nutrient and ecological stoichiometric characteristics [21]. Therefore, it is necessary to study the soil nutrients of tropical forests, analyze the differences in the soil total nutrients, available nutrients, microbial biomass nutrients and ecoenzymatic stoichiometry characteristics of different tropical forest types and to identify the effects of changes in tropical forest types on soil fertility. These efforts are important for the protection of the environment and the sustainable development of society.
Jianfengling National Nature Reserve is a forest ecosystem nature reserve located on southwestern Hainan Island, China. The protection object is the tropical primary forest ecosystem, which covers an area of approximately 600 km2. Jianfengling Forestry Bureau was established in October 1958, and commercial logging lasted for 34 years until 1992. Since 1993, the commercial logging of tropical forests in Jianfengling has ceased completely, and Jianfengling National Forest Park has been established to protect and restore existing forest resources and carry out ecological tourism.
2. Materials and Methods
2.1. The Description of the Study Site
The study site is located in Jianfengling Branch of Hainan Tropical Rainforest National Park Administration (18°23′–18°50′ N, 108°36′–109°05′ E), which is located in Ledong County at the southwestern part of Hainan Province (Hainan province is the southernmost part of China. The north is delimited from Guangdong Province by the Qiongzhou Strait), China. The total forested area is approximately 600 km2, of which mountain rain forest covers about 163 km2 [23]. The Jianfengling tropical mountain rainforest is affected by the alternation of land, sea, and terrain, has a typical tropical monsoon climate, and dry and wet seasons are obvious. The dry season is from November to April, and the wet season is from May to October. The average annual temperature is 19.7 °C, and the average temperature in the coldest and warmest months is 10.8 °C and 27.5 °C, respectively. The average precipitation is 2198 mm. The air humidity in this region maintains a high level throughout the year, with an average relative humidity of 88%, and the climate type is very humid [24]. Approximately 80–90% of the annual precipitation falls during the wet season, between May and October, and rainfall comes mainly from typhoons, thunderstorms, and topographic rain. The main type of soil in this area is lateritic yellow soil [25].
Through logging records and interviews with loggers, the formation history of the secondary forest, Dacrycarpus imbricatus, and Pinus caribaea Morelet due to commercial logging demand was established (Figure 1). In this study, the vegetation in the sampling points of the secondary forest was formed after the primary forest was cut down in 1958–1960, and the forest age was 63 years. The Dacrycarpus imbricatus sampling site was planted after the primary forest was cut down in 1975, and the forest age was 48 years. The Pinus caribaea Morelet sampling site was planted in 1995 after the secondary forest was felled, and the forest age was 28 years.
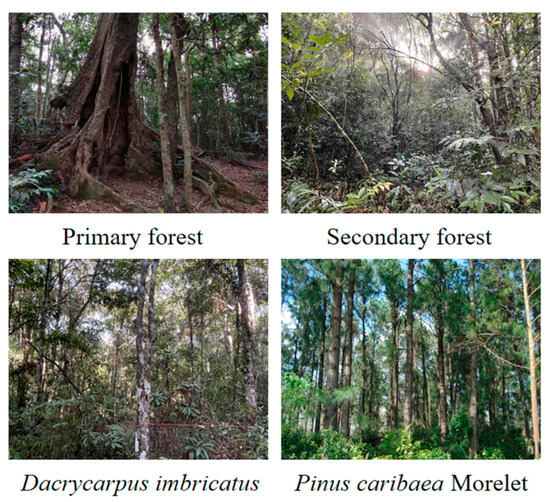
Figure 1.
Photos of different forest types.
2.2. Soil Sampling and Analysis
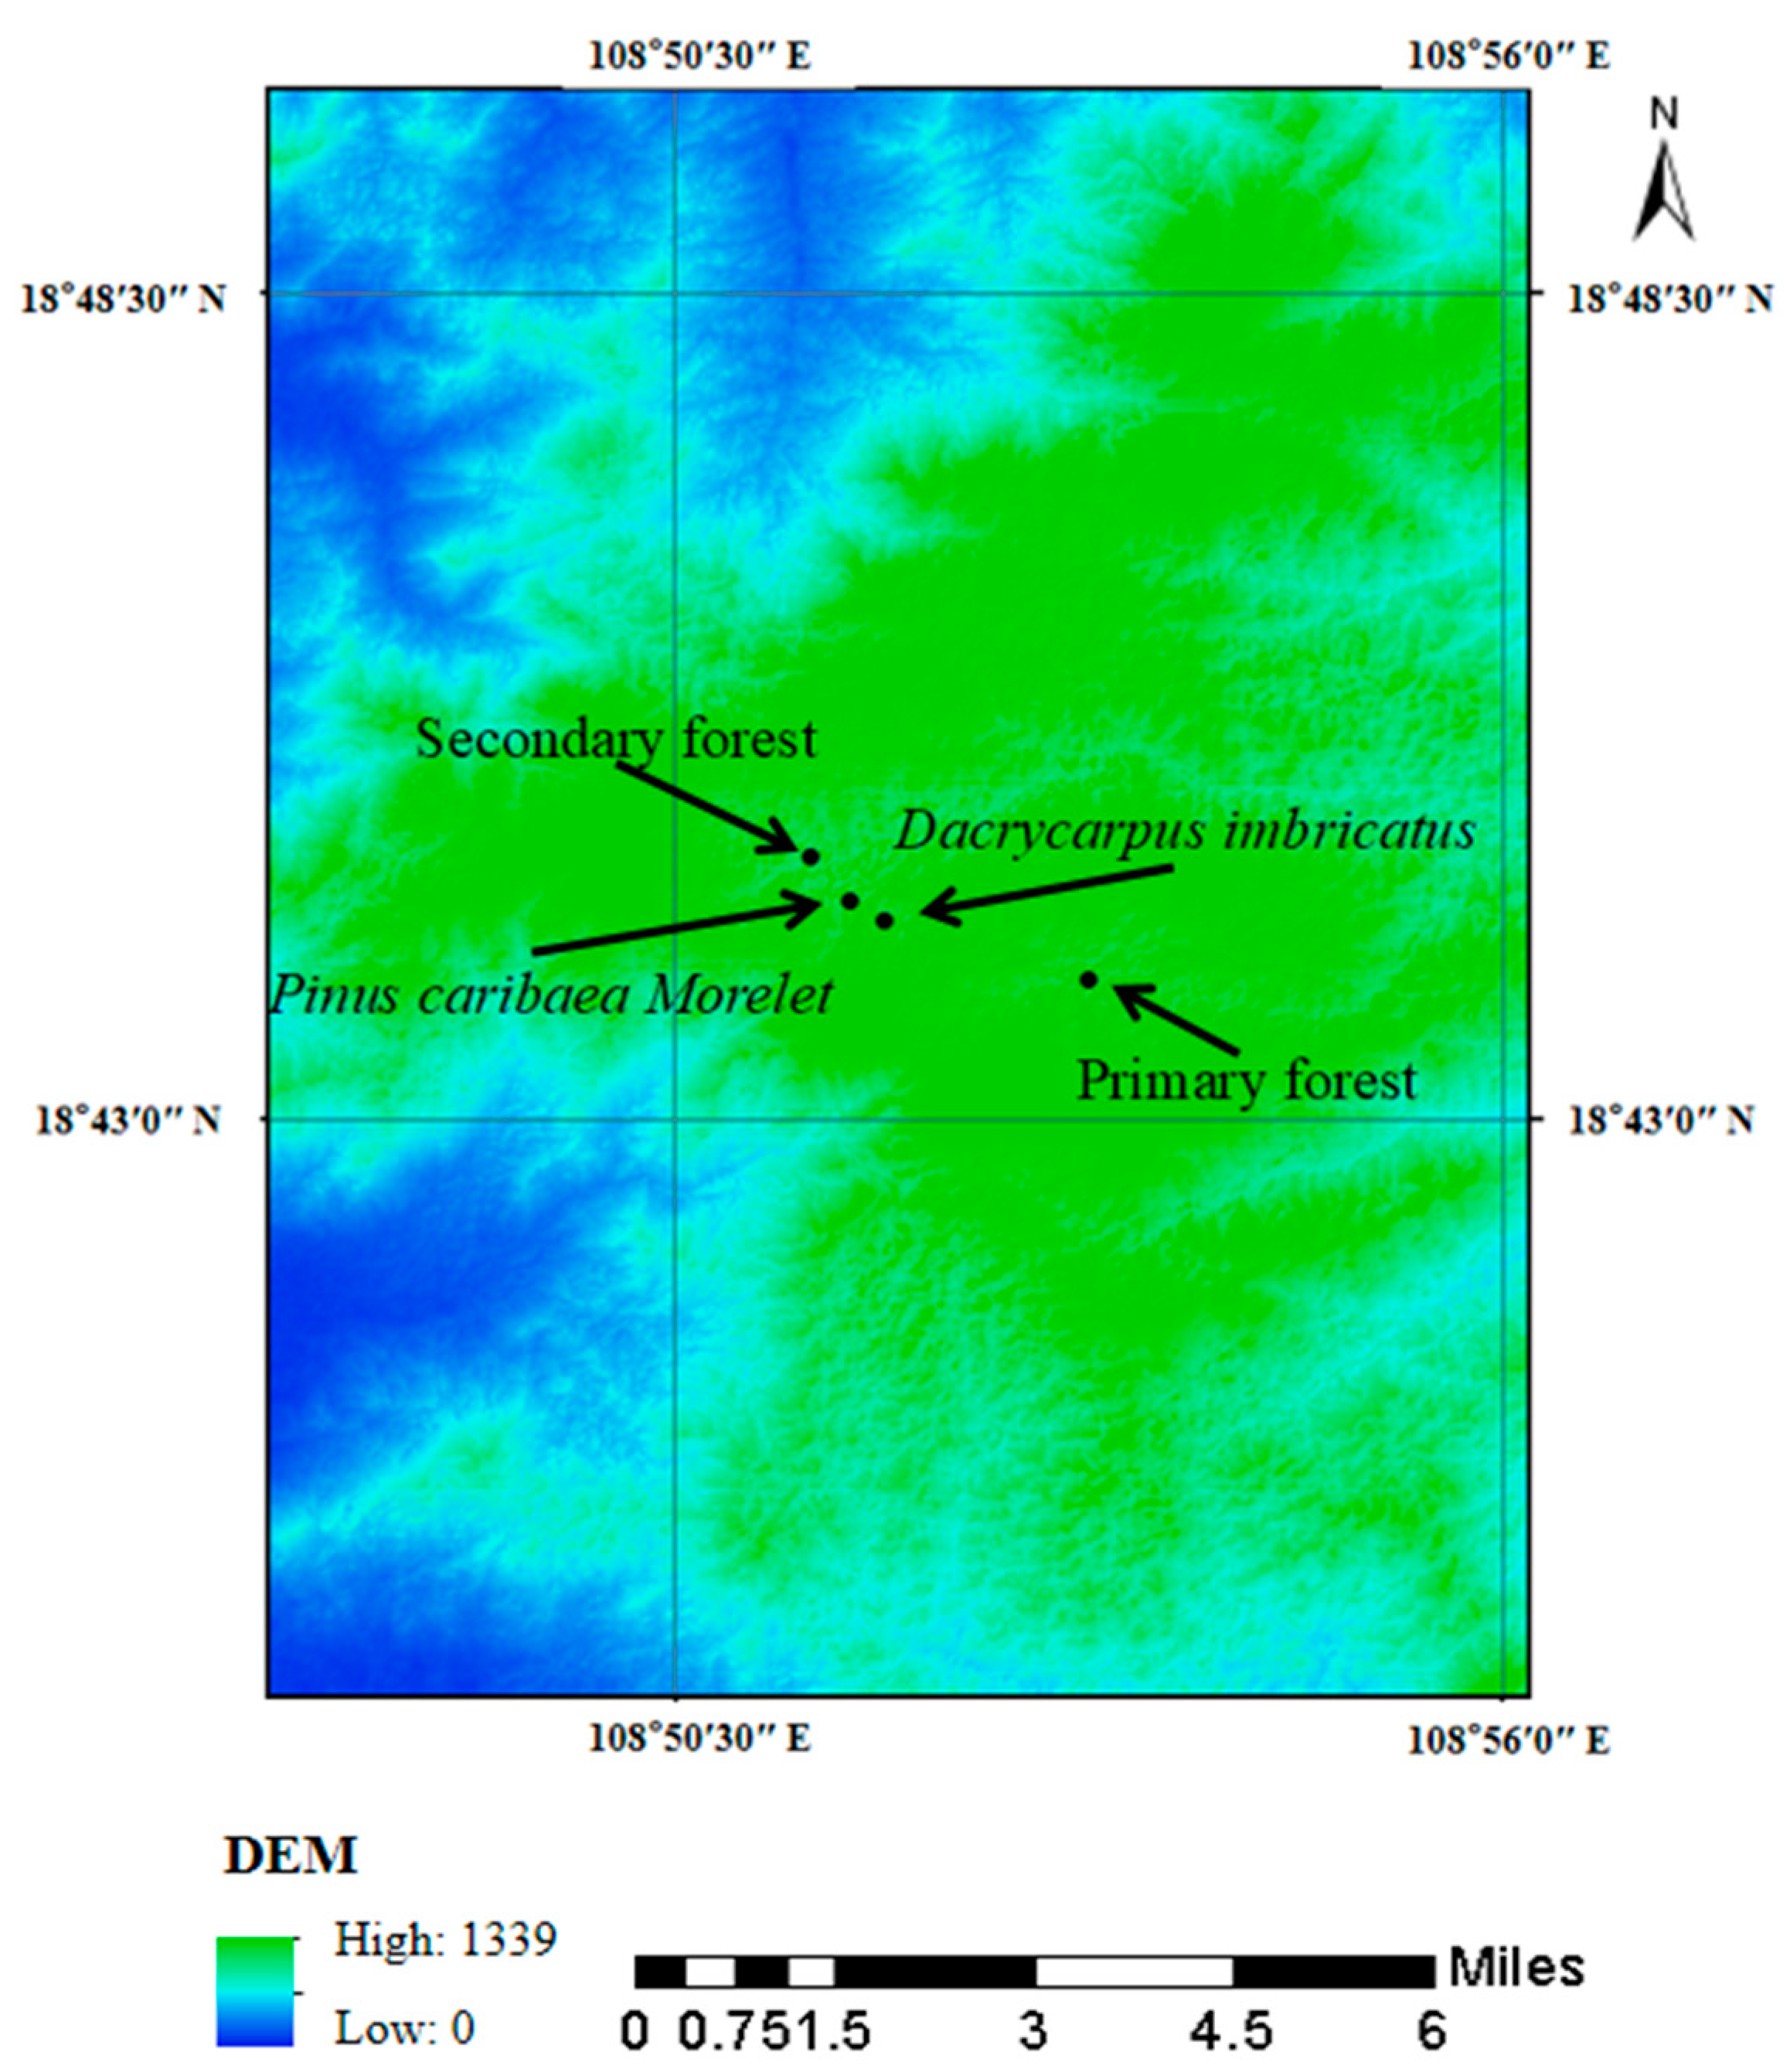
From the end of July to the beginning of August 2022, the secondary forest (18°44′45″ N, 108°51′25″ E, 1089 m a.s.l) and two kinds of plantation forests (Dacrycarpus imbricatus (18°44′27″ N, 108°51′40″ E, 1209 m a.s.l) and Pinus caribaea Morelet (18°44′27″ N, 108°51′40″ E, 1219 m a.s.l)) in the tropical area were selected in Jianfengling National Nature Reserve and compared with the primary forest (18°43′56″ N, 108°53′12″ E, 1241 m a.s.l), and a total of four forest stands were carried out (Figure 2). A sample plot of 30 m × 30 m was selected in each forest stand, and three subsamples of 10 m × 10 m were randomly selected in the sample plot as three replicates.

Figure 2.
Location diagram of sampling points.
Within each repeat, 5 separate spots were sampled using a soil auger with an internal diameter of 5 cm. The sampling depth of each spot was 0–10 cm, 10–20 cm, and 20–30 cm, respectively. Five samples from the same repeat at the same depth were then mixed into one complete sample. Each complete soil sample was divided into two parts: one part (fresh soil) was stored in a low-temperature fresh-keeping box and transported to the laboratory, and the other part was ground and sealed after natural air drying for use (Table 1).

Table 1.
Soil basic physical and chemical properties of different forest types.
SOC was calculated using the external heating method with potassium dichromate and sulfuric acid solution [26]. The soil TN content was determined using a Futura AMS-Alliance continuous flow analyzer [26]. The content of total phosphorus (TP) in soil was determined by molybdenum-antimony resistance colorimetry [27]. The soil AP content was extracted by the NH4F-HCl method, and determined by the molybdenum-antimony resistance colorimetric method [28].
Soil microbial biomass nutrients were determined by chloroform fumigation [29], and the soil C content was determined by an automatic TOC analyzer (TOC-L CPH CN 200). A coefficient of 0.38 was used to convert the difference in organic C between fumigated and unfumigated soil samples into soil MBC [30], and the value of unfumigated soil samples was the amount of DOC. Soil microbial biomass nitrogen (MBN) was determined by the chloroform fumigation method using a Futura AMS-Alliance continuous flow analyzer. The difference in the N content between fumigated and nonfumigated soil samples was converted into soil MBN using a coefficient of 0.45, and the value of the nonfumigated soil samples was the DON. Soil microbial biomass phosphorus (MBP) was determined by chloroform fumigation and ammonium molybdate spectrophotometry [31], and the difference in the P content between fumigated and unfumigated soil samples was converted into soil MBP using a coefficient of 0.40.
Soil ecological enzymes include β-glucosidase (BG), β-N-acetylglucosidase (NAG), leucine aminopeptidase (LAP), and acid phosphatase (APho). The APho was cultured by phenylene disodium phosphate, and the activities of the other enzymes were determined by microplate fluorescence [32].
2.3. Data Analysis
To evaluate the effects of different forest types on the stoichiometric characteristics of tropical soil C, N and P, univariate and multivariate analysis of variance was performed using IBM SPSS Statistics 26. Duncan’s method was used for multiple comparisons, and the significance level was set at 0.05. Origin 2021 was used to produce graphics, and SPSS Pro was used to construct structural equation models (SEM).
3. Results
3.1. SOC, TN, TP, and Stoichiometric Characteristics
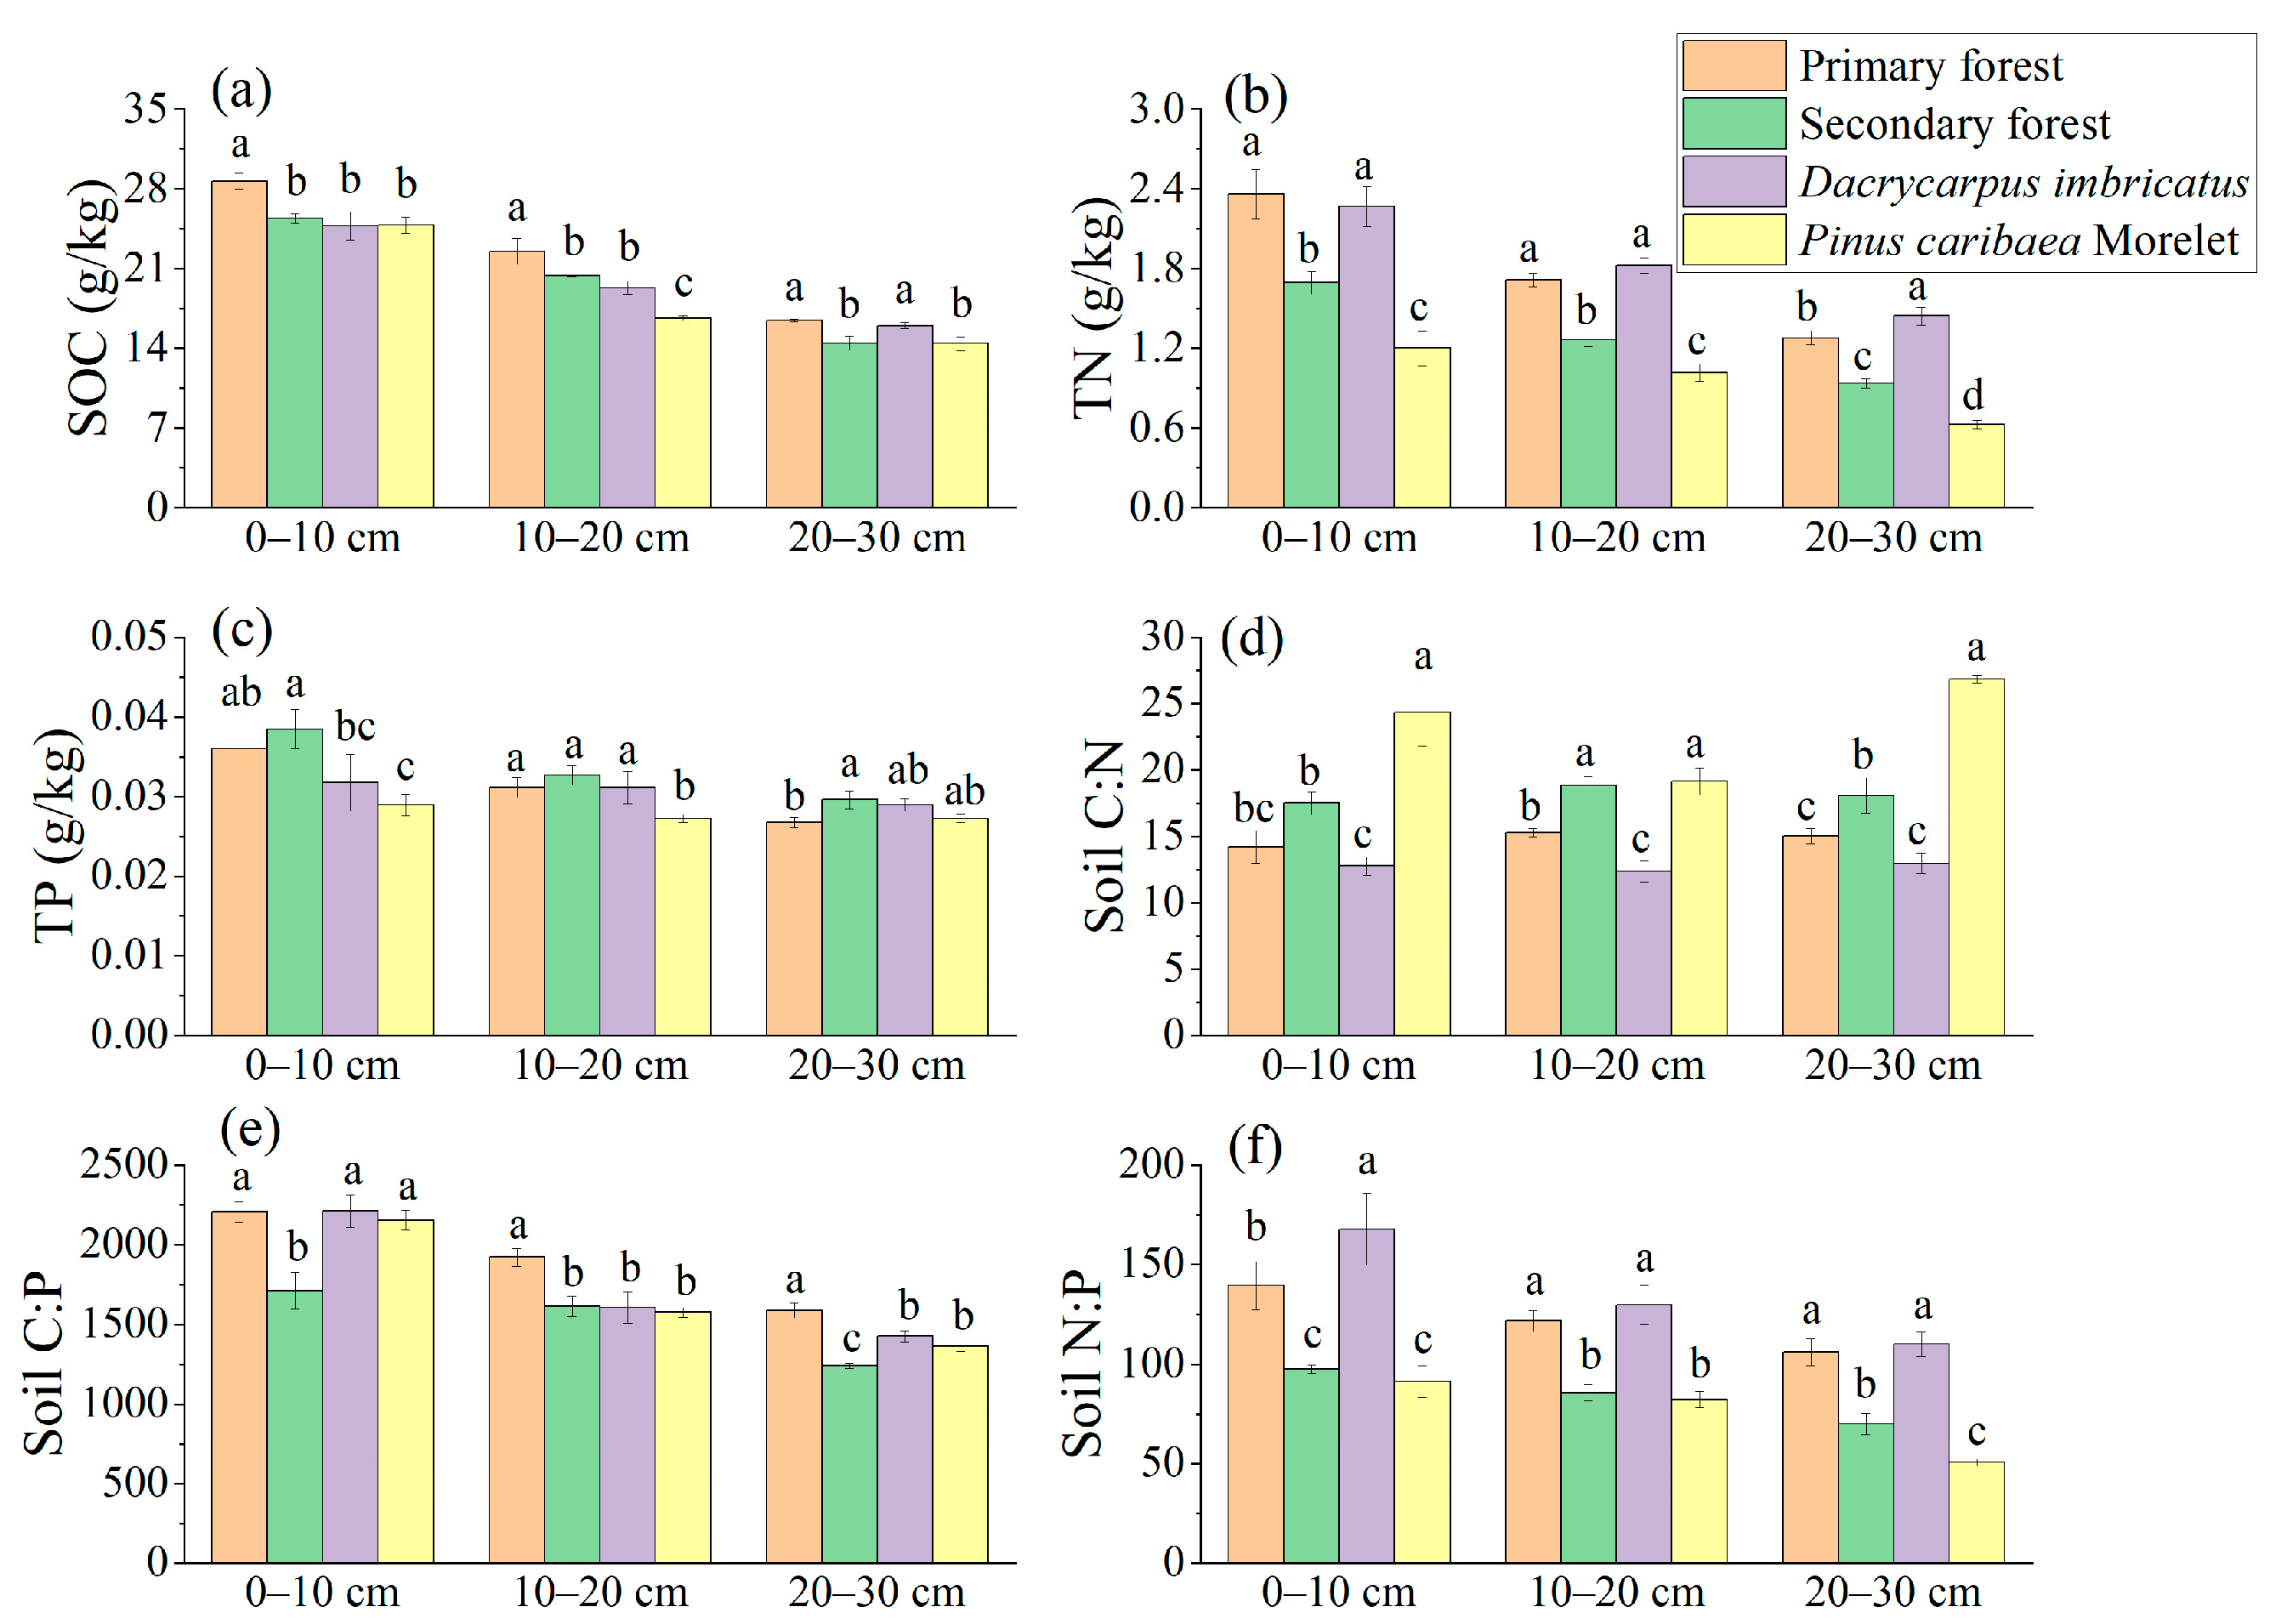
The SOC, TN, and TP contents showed a decreasing trend with the increase in soil depth (Figure 3a–c). At 0–10 cm and 10–20 cm soil depths, the SOC content of the primary forest was significantly higher than that of the secondary forest (12.9% and 10.4%, respectively), which was also significantly different from Dacrycarpus imbricatus and Pinus caribaea Morelet (Figure 3a). The TN content of the primary forest and the Dacrycarpus imbricatus forest at 0–10 cm, 10–20 cm, and 20–30 cm soil depths was significantly higher than that of the secondary forest and Pinus caribaea Morelet forest (Figure 3b). In the 0–10 cm soil layer, the TP content of the secondary forest was the highest (0.38 g/kg), and that of the Pinus caribaea Morelet forest was the lowest (0.29 g/kg) (Figure 3c).
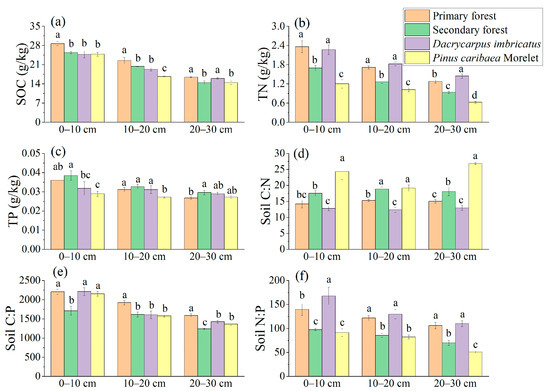
Figure 3.
Total nutrients in soil. SOC (a), TN (b), TP (c), C:N (d), C:P (e), and N:P (f). The stoichiometric characteristic ratio between nutrients is the atomic ratio, and different lowercase letters represent significant differences between plots (p < 0.05).
The soil C:N atomic ratio ranged from 12.38 to 26.85, and the three soil depths (0–10 cm, 10–20 cm, and 20–30 cm) showed a pattern of Pinus caribaea Morelet forest > secondary forest > primary forest > Dacrycarpus imbricatus forest (Figure 3d). The soil C:P atomic ratio ranged from 1241.51 to 2211.37, and the C:P atomic ratio in 0–10 cm soil layer (1710.41) of the secondary forest was significantly lower than that of the primary forest by 22.49%. In the 10–20 cm soil layer, the C:P atomic ratio of the primary forest (1921.62) was significantly higher than that of the secondary forest, Dacrycarpus imbricatus forest and Pinus caribaea Morelet forest by 19.20%, 19.77%, and 21.94%, respectively. In the 20–30 cm soil layer, the primary forest had the highest C:P atomic ratio (1588.96), and the secondary forest had the lowest C:P atomic ratio (1241.52) (Figure 3e). The soil N:P atomic ratio ranged from 50.77 to 167.83, and the three soil depths (0–10 cm, 10–20 cm, and 20–30 cm) showed a pattern of Dacrycarpus imbricatus forest > primary forest > secondary forest > Pinus caribaea Morelet forest (Figure 3f).
3.2. DOC, DON, AP, and Stoichiometric Characteristics
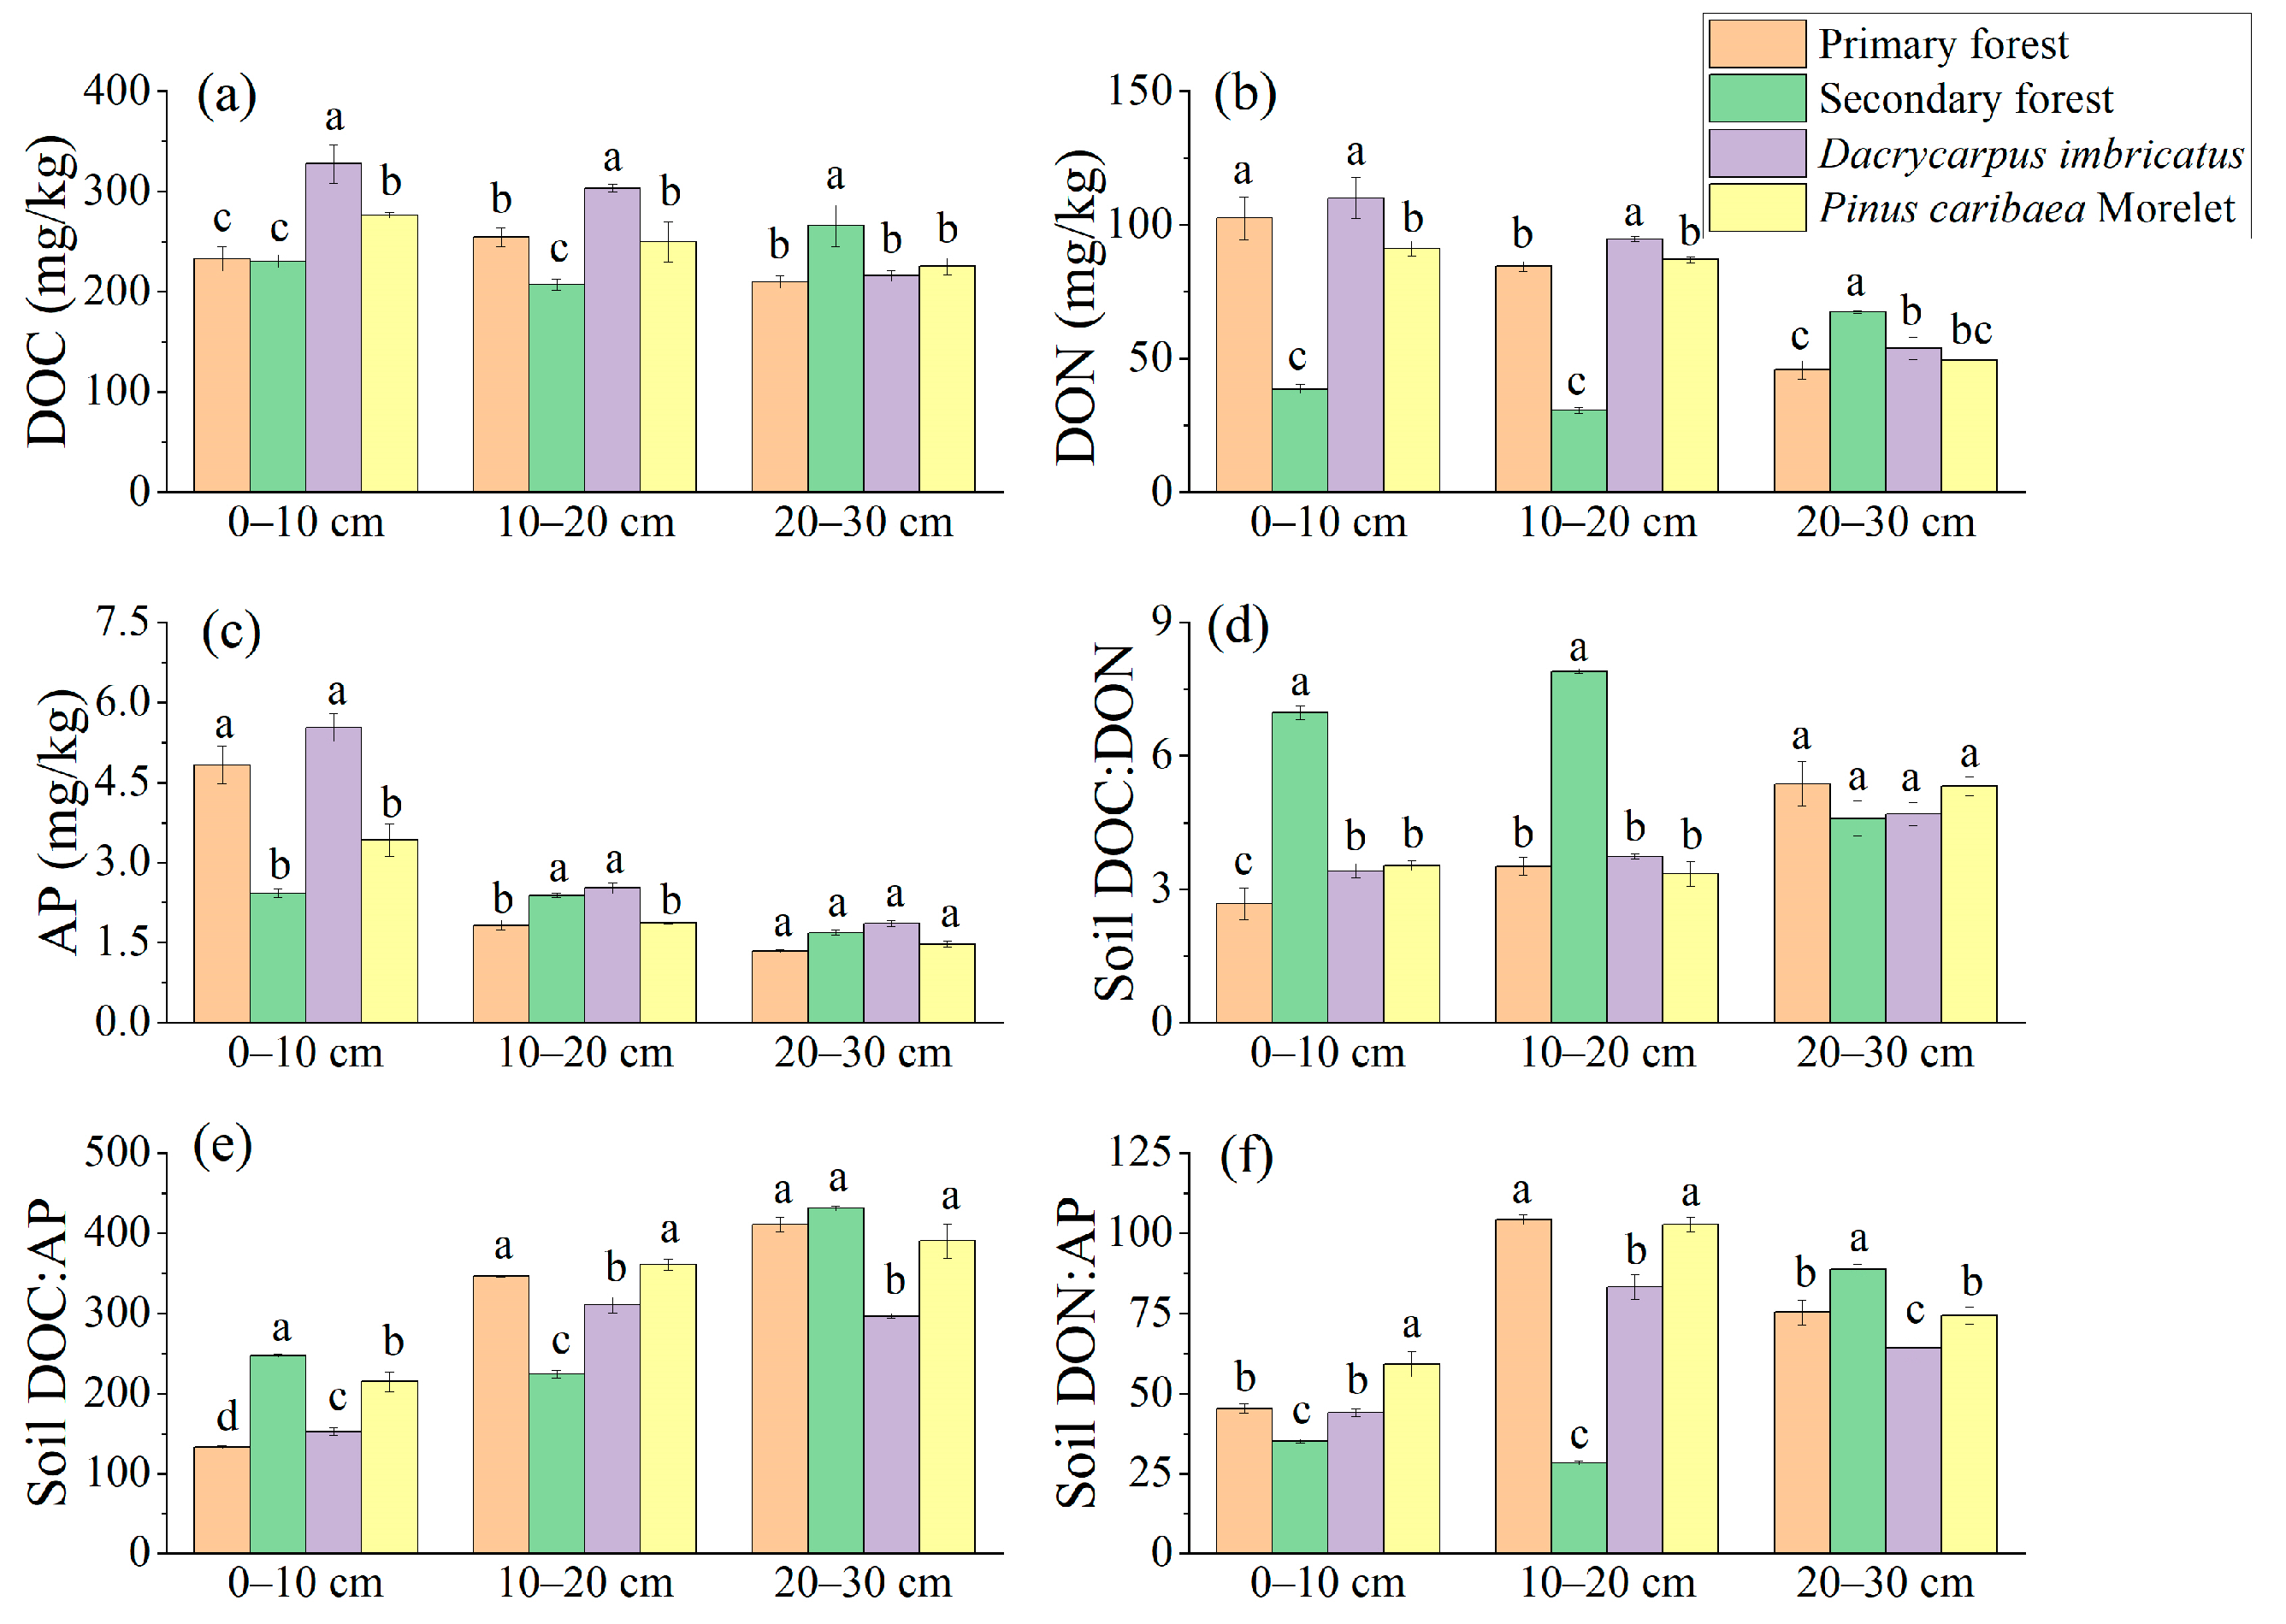
The DOC content of the Dacrycarpus imbricatus forest in the 0–10 cm soil layer was significantly higher than that in the primary forest by 40.4%. The DOC content of the Dacrycarpus imbricatus forest in the 10–20 cm soil layer (302.99 mg/kg) was significantly higher than that of the primary forest (19.1%). In the 20–30 cm soil layer, the DOC content of the secondary forest was the highest (265.66 mg/kg), which was significantly higher than that of the primary forest by 26.7% (Figure 4a). The DON content in the 0–10 cm and 10–20 cm soil layers had a similar pattern, and the highest was in the Dacrycarpus imbricatus forest (109.99 mg/kg and 94.59 mg/kg, respectively), and the lowest was in the secondary forest (38.56 mg/kg and 30.54 mg/kg, respectively). In the 20–30 cm soil layer, the DON content of the secondary forest was the highest (67.53 mg/kg), which was significantly higher than that of the primary forest (47.6%) (Figure 4b). The AP content of the primary forest in the 0–10 cm soil layer was significantly higher than that in the secondary forest (99.5%) and Pinus caribaea Morelet forest (41.2%). In the 10–20 cm soil layer, the AP content of the primary forest was significantly lower than that of the secondary forest and the Dacrycarpus imbricatus forest by 23.5% and 27.7%, respectively (Figure 4c).

Figure 4.
Available nutrients in soil. DOC (a), DON (b), AP (c), DOC:DON (d), DOC:AP (e), and DON:AP (f). The stoichiometric characteristic ratio between nutrients is the atomic ratio, and different lowercase letters represent significant differences between plots (p < 0.05).
The DOC:DON atomic ratio ranged from 2.67 to 7.90. The secondary forest’s DOC:DON atomic ratios in the 0–10 cm and 10–20 cm soil layers were the highest (6.96 and 7.90, respectively) and significantly higher than those in the primary forest (160.6% and 124.4%, respectively) (Figure 4d). The soil DOC:AP atomic ratio ranged from 133.18 to 431.01. In the 0–10 cm soil layer, the DOC:AP atomic ratio of the secondary forest was the highest (247.17), which was 85.5% higher than that of the primary forest. In the 10–20 cm soil layer, there were significant differences in the DOC:AP atomic ratios between the primary forest, secondary forest, and Dacrycarpus imbricatus forest. The DOC:AP atomic ratio in the 20–30 cm soil layer of the Dacrycarpus imbricatus forest (296.74) was the lowest and was significantly lower than that of the primary forest (27.7%) (Figure 4e). The soil DON:AP atomic ratio ranged from 28.34 to 104.24. In the 0–10 cm soil layer, the DON:AP atomic ratio of the Pinus caribaea Morelet forest was the highest (59.11), which was 30.3% higher than that of the primary forest. The DON:AP atomic ratios in the 10–20 cm soil layer of the primary forest and Pinus caribaea Morelet forest were significantly different from those of the secondary forest and Dacrycarpus imbricatus forest. In the 20–30 cm soil layer, the DON:AP atomic ratio of the secondary forest was the highest (88.68), which was significantly higher than that of the primary forest (17.7%) (Figure 4f).
3.3. MBC, MBN, MBP, and Stoichiometric Characteristics
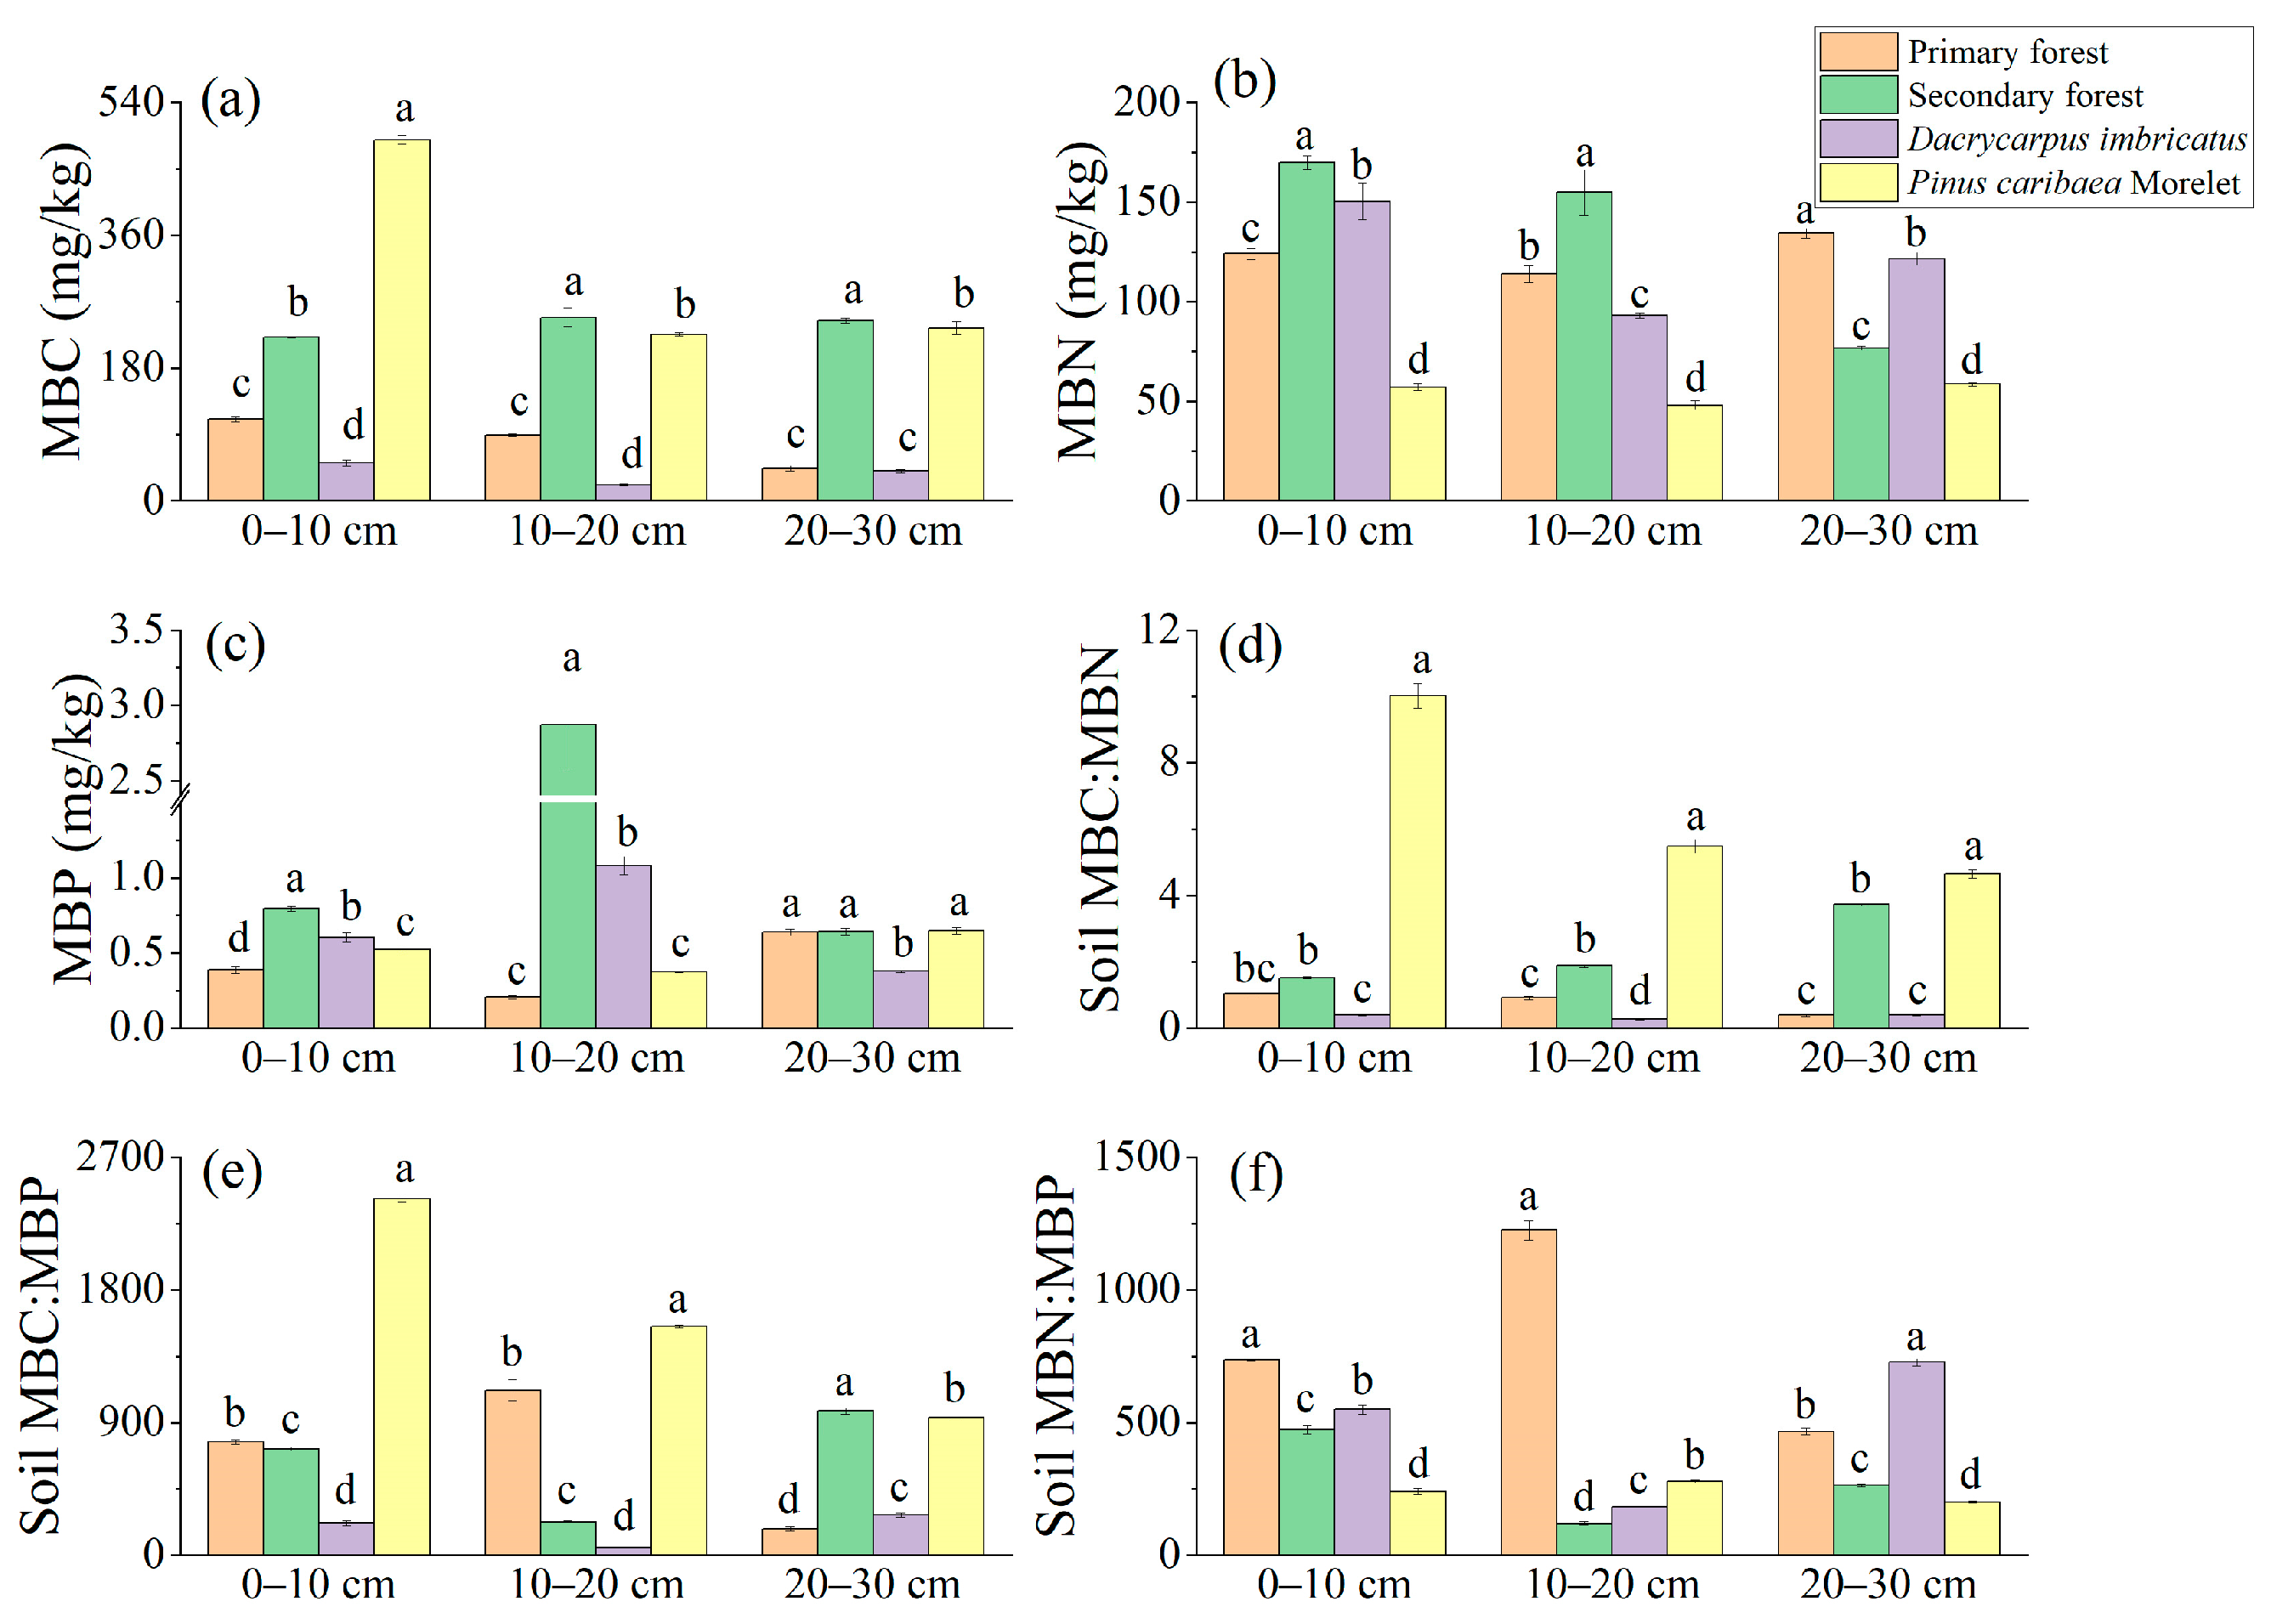
The MBC content in the 0–10 cm soil layer was the highest in the Pinus caribaea Morelet forest (489.30 mg/kg) and the lowest in the Dacrycarpus imbricatus forest (51.09 mg/kg). In the 10–20 cm and 20–30 cm soil layers, a pattern of secondary forest > Pinus caribaea Morelet forest > primary forest > Dacrycarpus imbricatus forest was found (Figure 5a). In the 0–10 cm and 10–20 cm soil layers, the MBN content in the secondary forest was the highest (169.98 mg/kg and 154.90 mg/kg, respectively), and the MBN content in the Pinus caribaea Morelet forest was the lowest (56.97 mg/kg and 48.05 mg/kg, respectively). In the 20–30 cm soil layer, the MBN content of the primary forest was the highest (134.44 mg/kg), and there were significant differences among different plots (Figure 5b). The content of MBP in the 0–10 cm soil layer in the secondary forest was the highest (0.79 mg/kg), which was significantly higher than that in the primary forest by 107.8%. In the 10–20 cm soil layer, the MBP content of the secondary forest was the highest (2.87 mg/kg), which was significantly higher than that of the primary forest (1335%). The MBP content in the 20–30 cm soil layer was the lowest (0.38 mg/kg) in the Dacrycarpus imbricatus forest (Figure 5c).

Figure 5.
Microbial biomass nutrients in soil. MBC (a), MBN (b), MBP (c), MBC:MBN (d), MBC:MBP (e), and MBN:MBP (f). The stoichiometric characteristic ratio between nutrients is the atomic ratio, and different lowercase letters represent significant differences between plots (p < 0.05).
The soil MBC:MBN atomic ratio ranged from 0.27 to 10.03, and the MBC:MBN atomic ratios of the Pinus caribaea Morelet forest in the 0–10 cm, 10–20 cm, and 20–30 cm soil layers (10.03, 5.49 and 4.66, respectively) were significantly higher than those of the primary forest. The MBC:MBN atomic ratio in the 20–30 cm soil layer of the secondary forest was significantly higher than that of the primary forest by 878.9% (Figure 5d). The soil MBC:MBP atomic ratio ranged from 51.23 to 2421.56, and the MBC:MBP atomic ratios of the Pinus caribaea Morelet forest were the highest in the 0–10 cm and 10–20 cm soil layers (2421.57 and 1553.73, respectively). In the 20–30 cm soil layer, the MBC:MBP atomic ratio of the secondary forest soil was the highest (981.18), and there were significant differences among different plots (Figure 5e). The soil MBN:MBP atomic ratio ranged from 119.63 to 1226.25, and the MBN:MBP atomic ratios in the 0–10 cm and 10–20 cm soil layers of the primary forest were the highest (737.47 and 1226.26, respectively). In the 20–30 cm soil layer, the MBN:MBP atomic ratio of the Dacrycarpus imbricatus forest was the highest (727.92) (Figure 5f).
3.4. Soil Ecological Enzyme Activity and Stoichiometric Characteristics
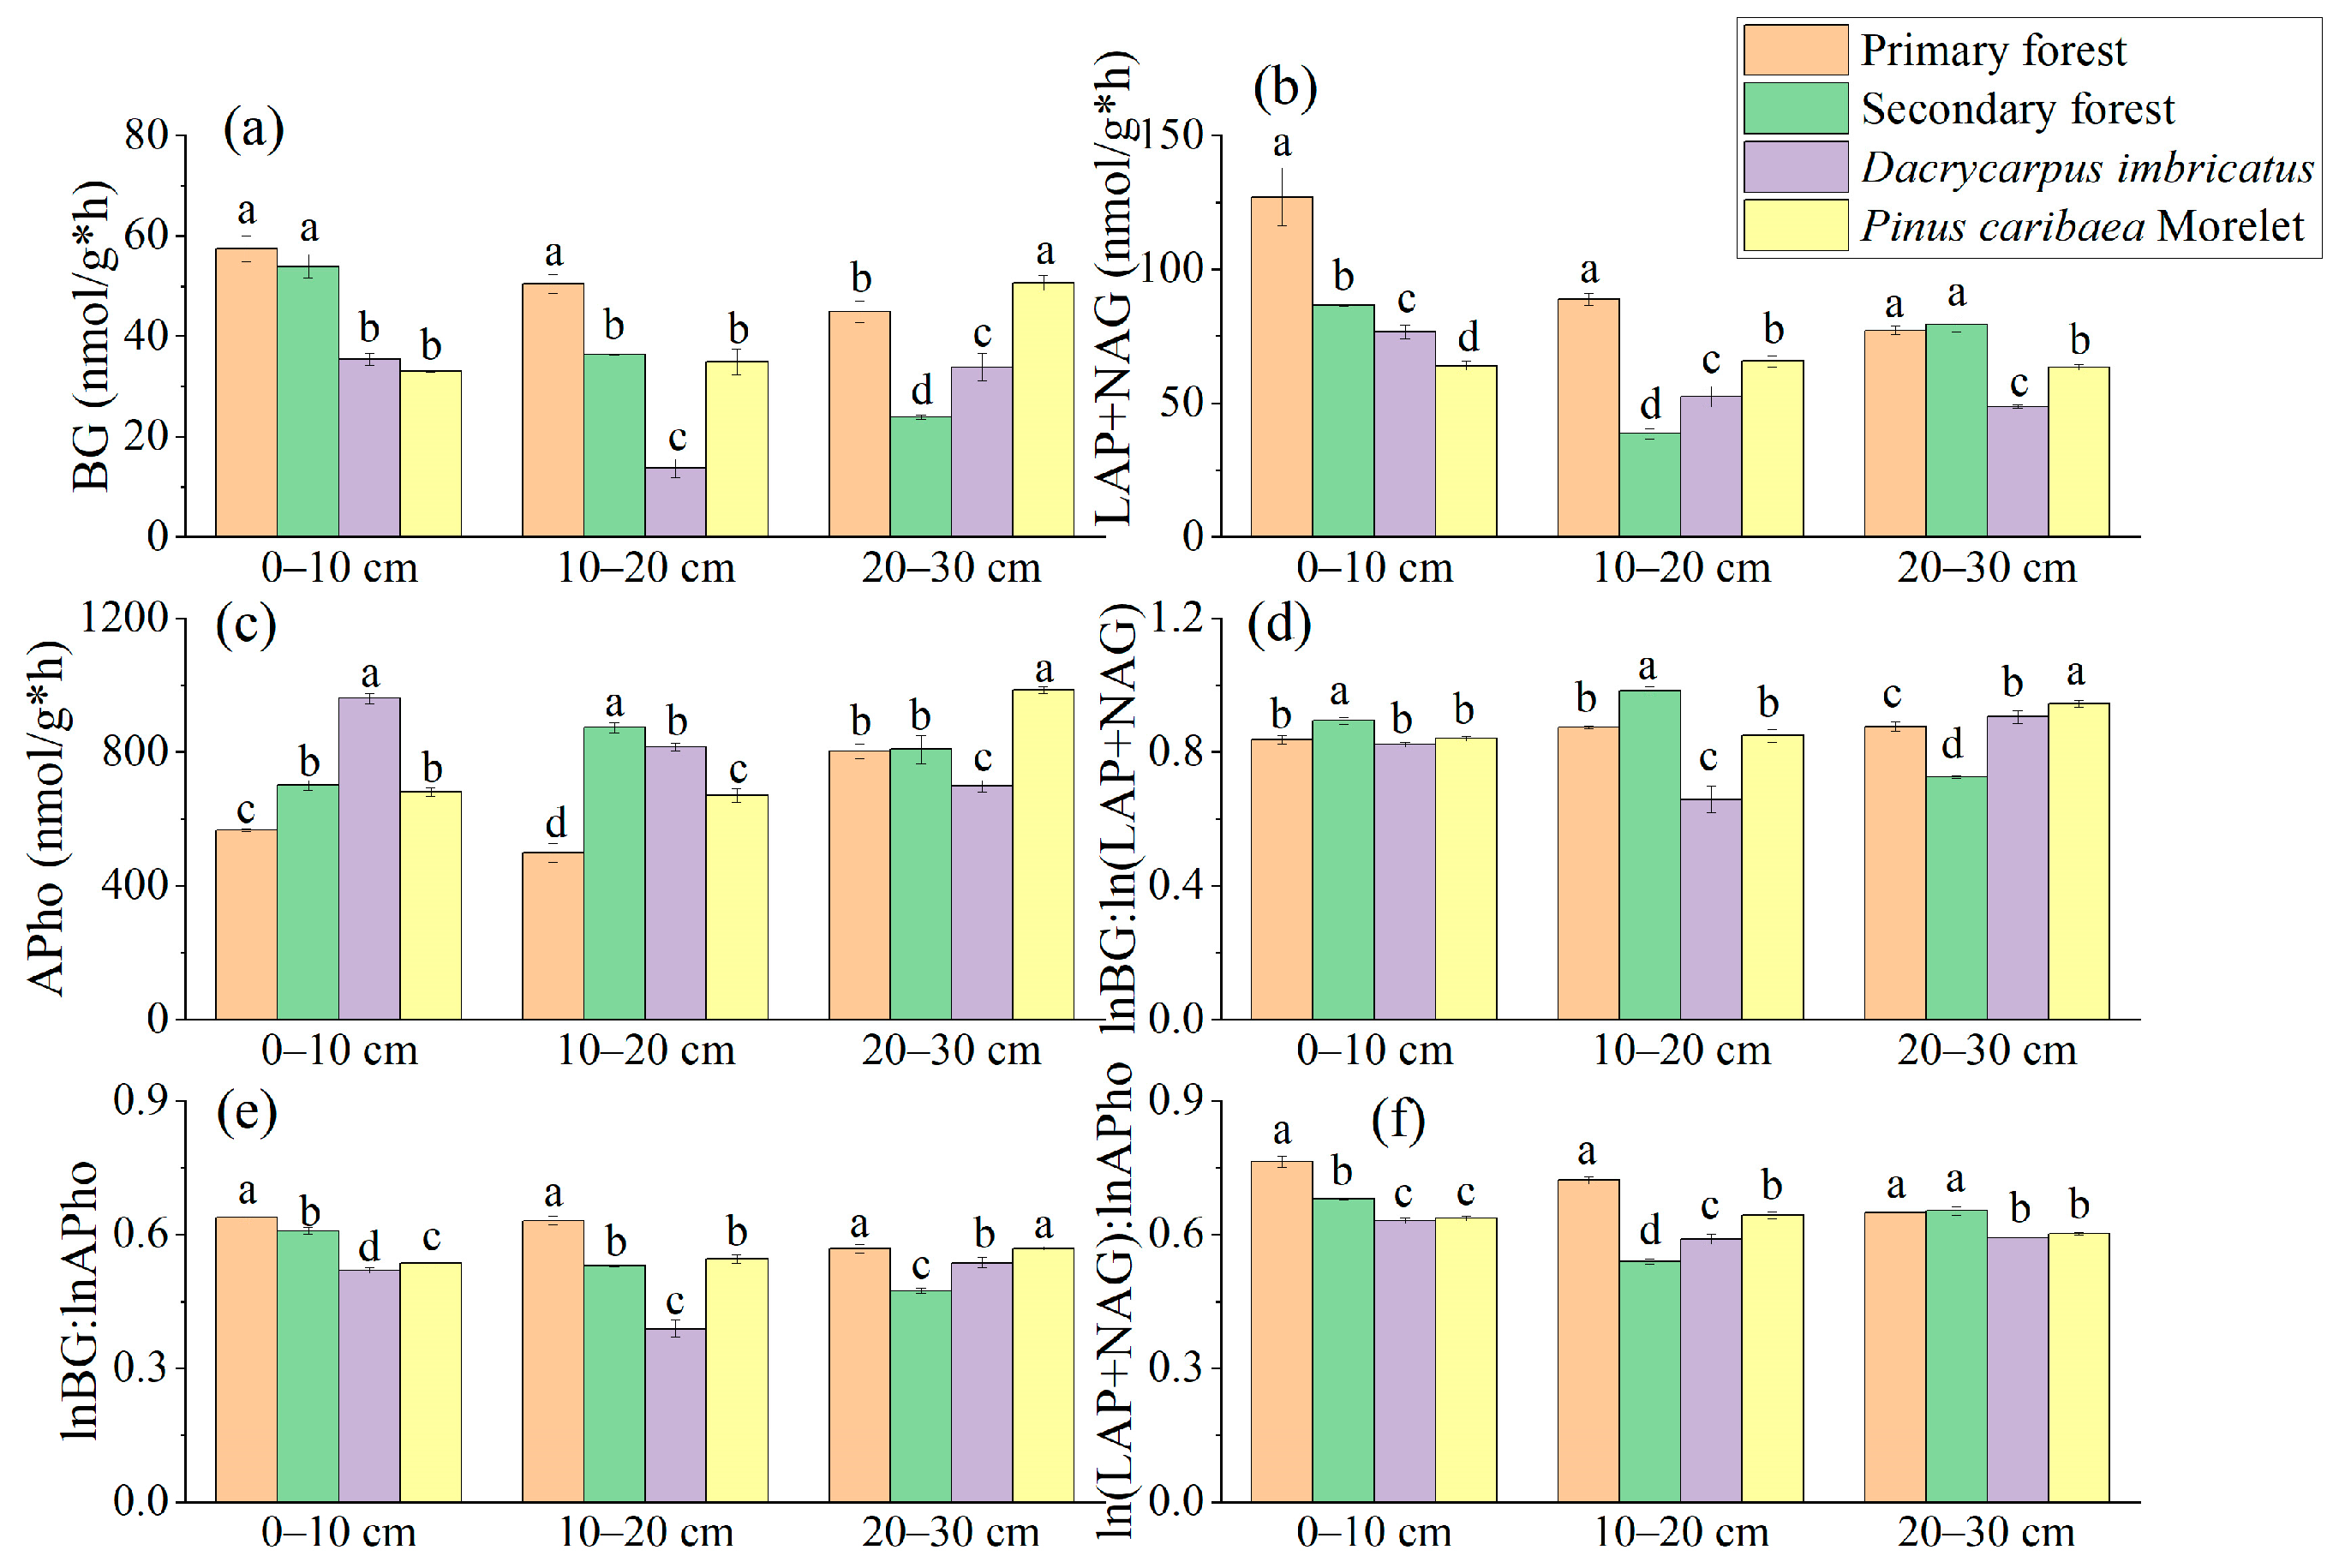
The BG activity in the 0–10 cm soil layer of the primary forest was significantly higher than that of the Dacrycarpus imbricatus forest (62%) and Pinus caribaea Morelet forest (73.8%). In the 10–20 cm soil layer, the BG activity of the primary forest was the highest (57.45 nmol/g*h), and the BG activity of the Dacrycarpus imbricatus forest was the lowest (35.46 nmol/g*h) (Figure 6a). In the 0–10 cm soil layer, the (LAP + NAG) activity of the primary forest was the highest (127.02 nmol/g*h), which was significantly higher than that of the secondary forest (46.8%), Dacrycarpus imbricatus forest (65.8%) and Pinus caribaea Morelet forest (98.6%). In the 10–20 cm soil layer, the (LAP + NAG) activity of the primary forest was the highest (88.82 nmol/g*h), which was significantly higher than that of the secondary forest (129.8%), Dacrycarpus imbricatus forest (69.4%) and Pinus caribaea Morelet forest (35.4%). In the 20–30 cm soil layer, the (LAP + NAG) activity of the Dacrycarpus imbricatus forest was 58.5% lower than that of the primary forest. In addition, the activity of (LAP + NAG) in the Pinus caribaea Morelet forest soil was significantly lower than that of the primary forest soil by 21.7% (Figure 6b). In the 0–10 cm soil layer, the APho activity of the Dacrycarpus imbricatus forest was significantly higher than that of the primary forest by 69.5%. In the 10–20 cm soil layer, the APho activity of the secondary forest was the highest (873.39 nmol/g*h), which was significantly higher than that of the primary forest by 75%. In the 20–30 cm soil layer, the APho activity of the Pinus caribaea Morelet forest was the highest (986.66 nmol/g*h) and was significantly higher than that of the primary forest by 23%, while the APho activity value of the Dacrycarpus imbricatus forest was the lowest (698.57 nmol/g*h) and was significantly lower than that of the primary forest by 14.7% (Figure 6c).
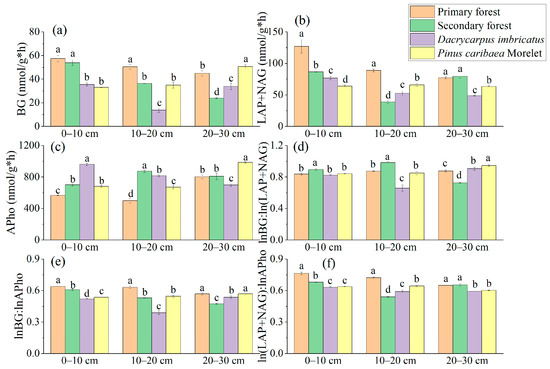
Figure 6.
Enzyme activity in soil. BG (a), LAP + NAG (b), APho (c), lnBG:ln(LAP + NAG) (d), lnBG:lnAPho (e), and ln(LAP + NAG):lnAPho (f). The natural logarithm of the stoichiometric characteristic ratio is taken and then the ratio is calculated. Different lowercase letters represent significant differences between plots (p < 0.05).
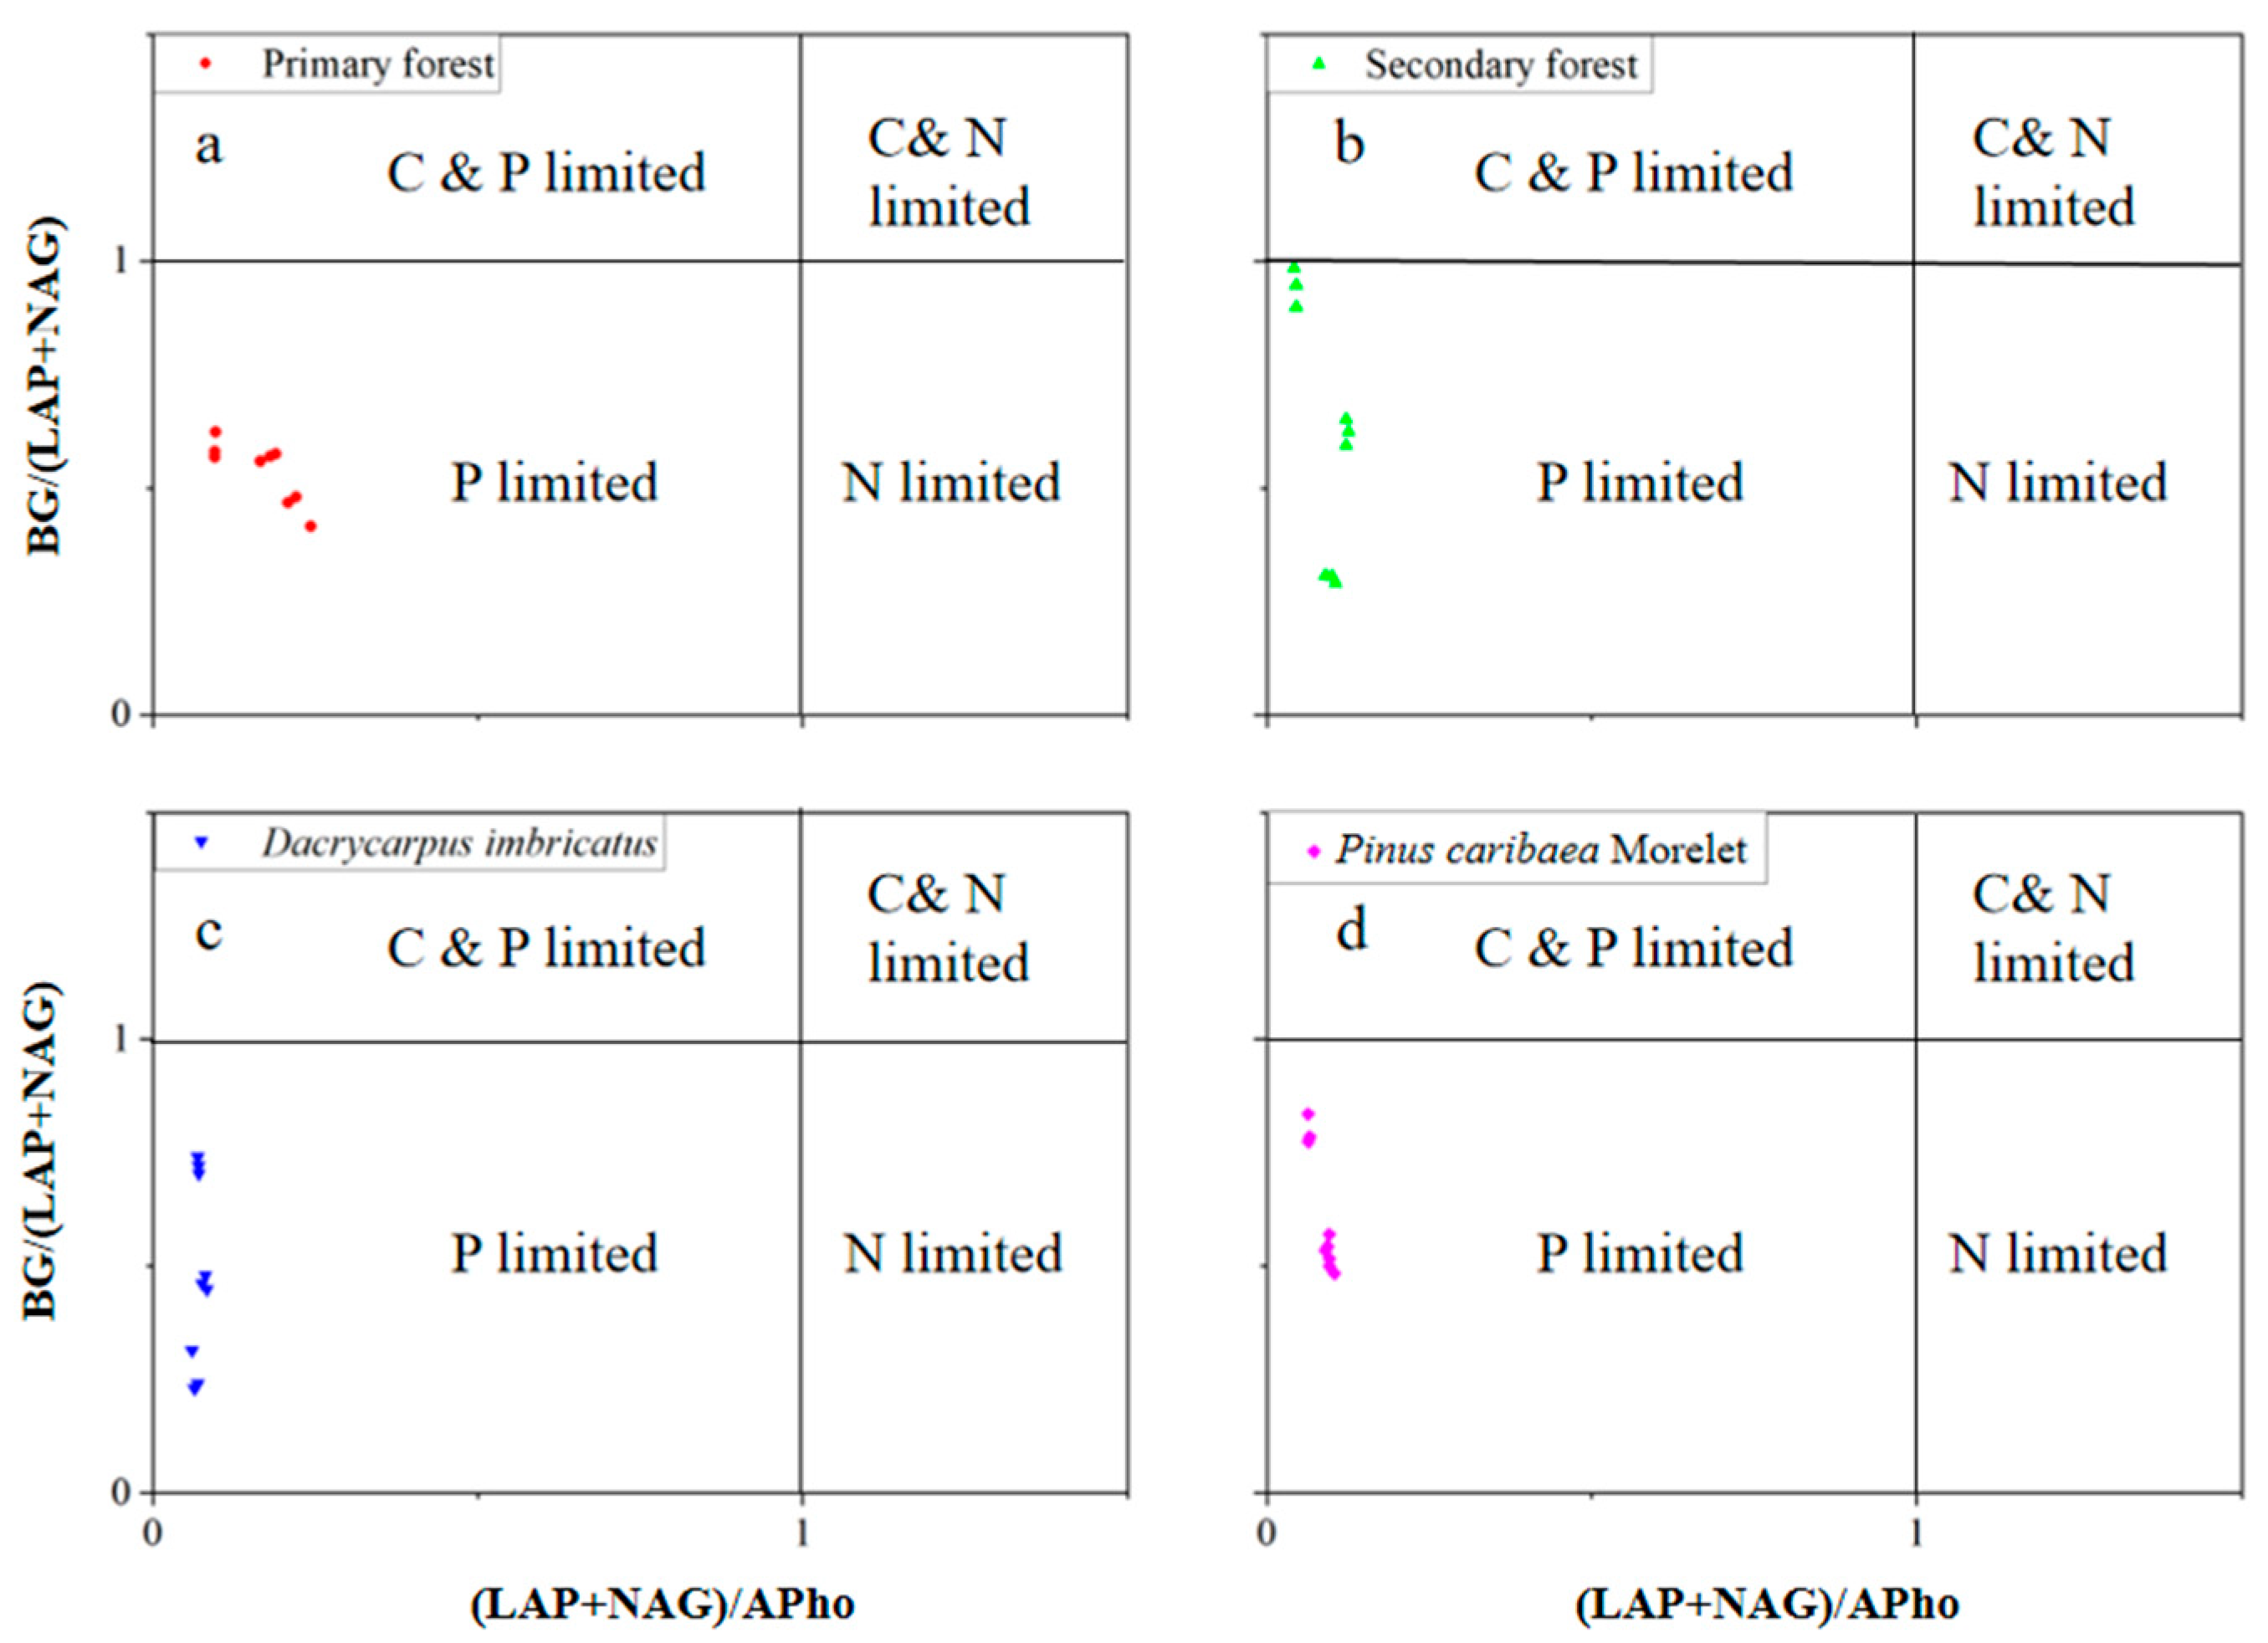
The lnBG:ln(LAP + NAG) value ranged from 0.66–0.98. In the 0–10 cm soil layer, the lnBG:ln(LAP + NAG) value of the secondary forest was the highest (0.89). In the 10–20 cm soil layer, the lnBG:ln(LAP + NAG) value of the secondary forest was the highest (0.98). The lnBG:ln(LAP + NAG) value of the Dacrycarpus imbricatus forest was the lowest (0.66), which was significantly lower than that of the primary forest by 32.4%. In the 20–30 cm soil layer, the lnBG:ln(LAP + NAG) value of the Pinus caribaea Morelet forest was the highest (0.95) (Figure 6d). The lnBG:lnAPho value ranged from 0.39–0.63. In the 0–10 cm and 10–20 cm soil layers, the lnBG:lnAPho values of the primary forest were the highest (0.64 and 0.63, respectively). In the 20–30 cm soil layer, the lnBG:lnAPho value of the secondary forest was the lowest (0.47) and was significantly lower than that of the primary forest by 19.1% (Figure 6e). The ln(LAP + NAG):lnAPho value ranged from 0.54–0.76. In the 0–10 cm soil layer, the ln(LAP + NAG):lnAPho value of the primary forest was the highest (0.76), which was significantly higher than that of the secondary forest by 12.2%, the Dacrycarpus imbricatus forest by 20.9% and the Pinus caribaea Morelet forest by 19.7%. In the 10–20 cm soil layer, the ln(LAP + NAG):lnAPho value of the primary forest was the highest (0.72) and was significantly higher than that of the secondary forest (33.9%), Dacrycarpus imbricatus forest (22.3%) and Pinus caribaea Morelet forest (12.2%) (Figure 6f). In addition, in the scatter plot, we found that the values of soil BG/(LAP + NAG) and (LAP + NAG)/APho in the study area were both less than 1 (Figure 7).
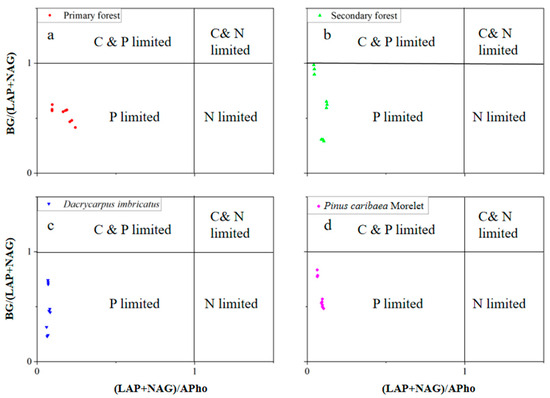
Figure 7.
Scatterplot of soil enzyme stoichiometry. Primary forest (a), Secondary forest (b), Dacrycarpus imbricatus (c), and Pinus caribaea Morelet (d).
3.5. SEM of Each Index
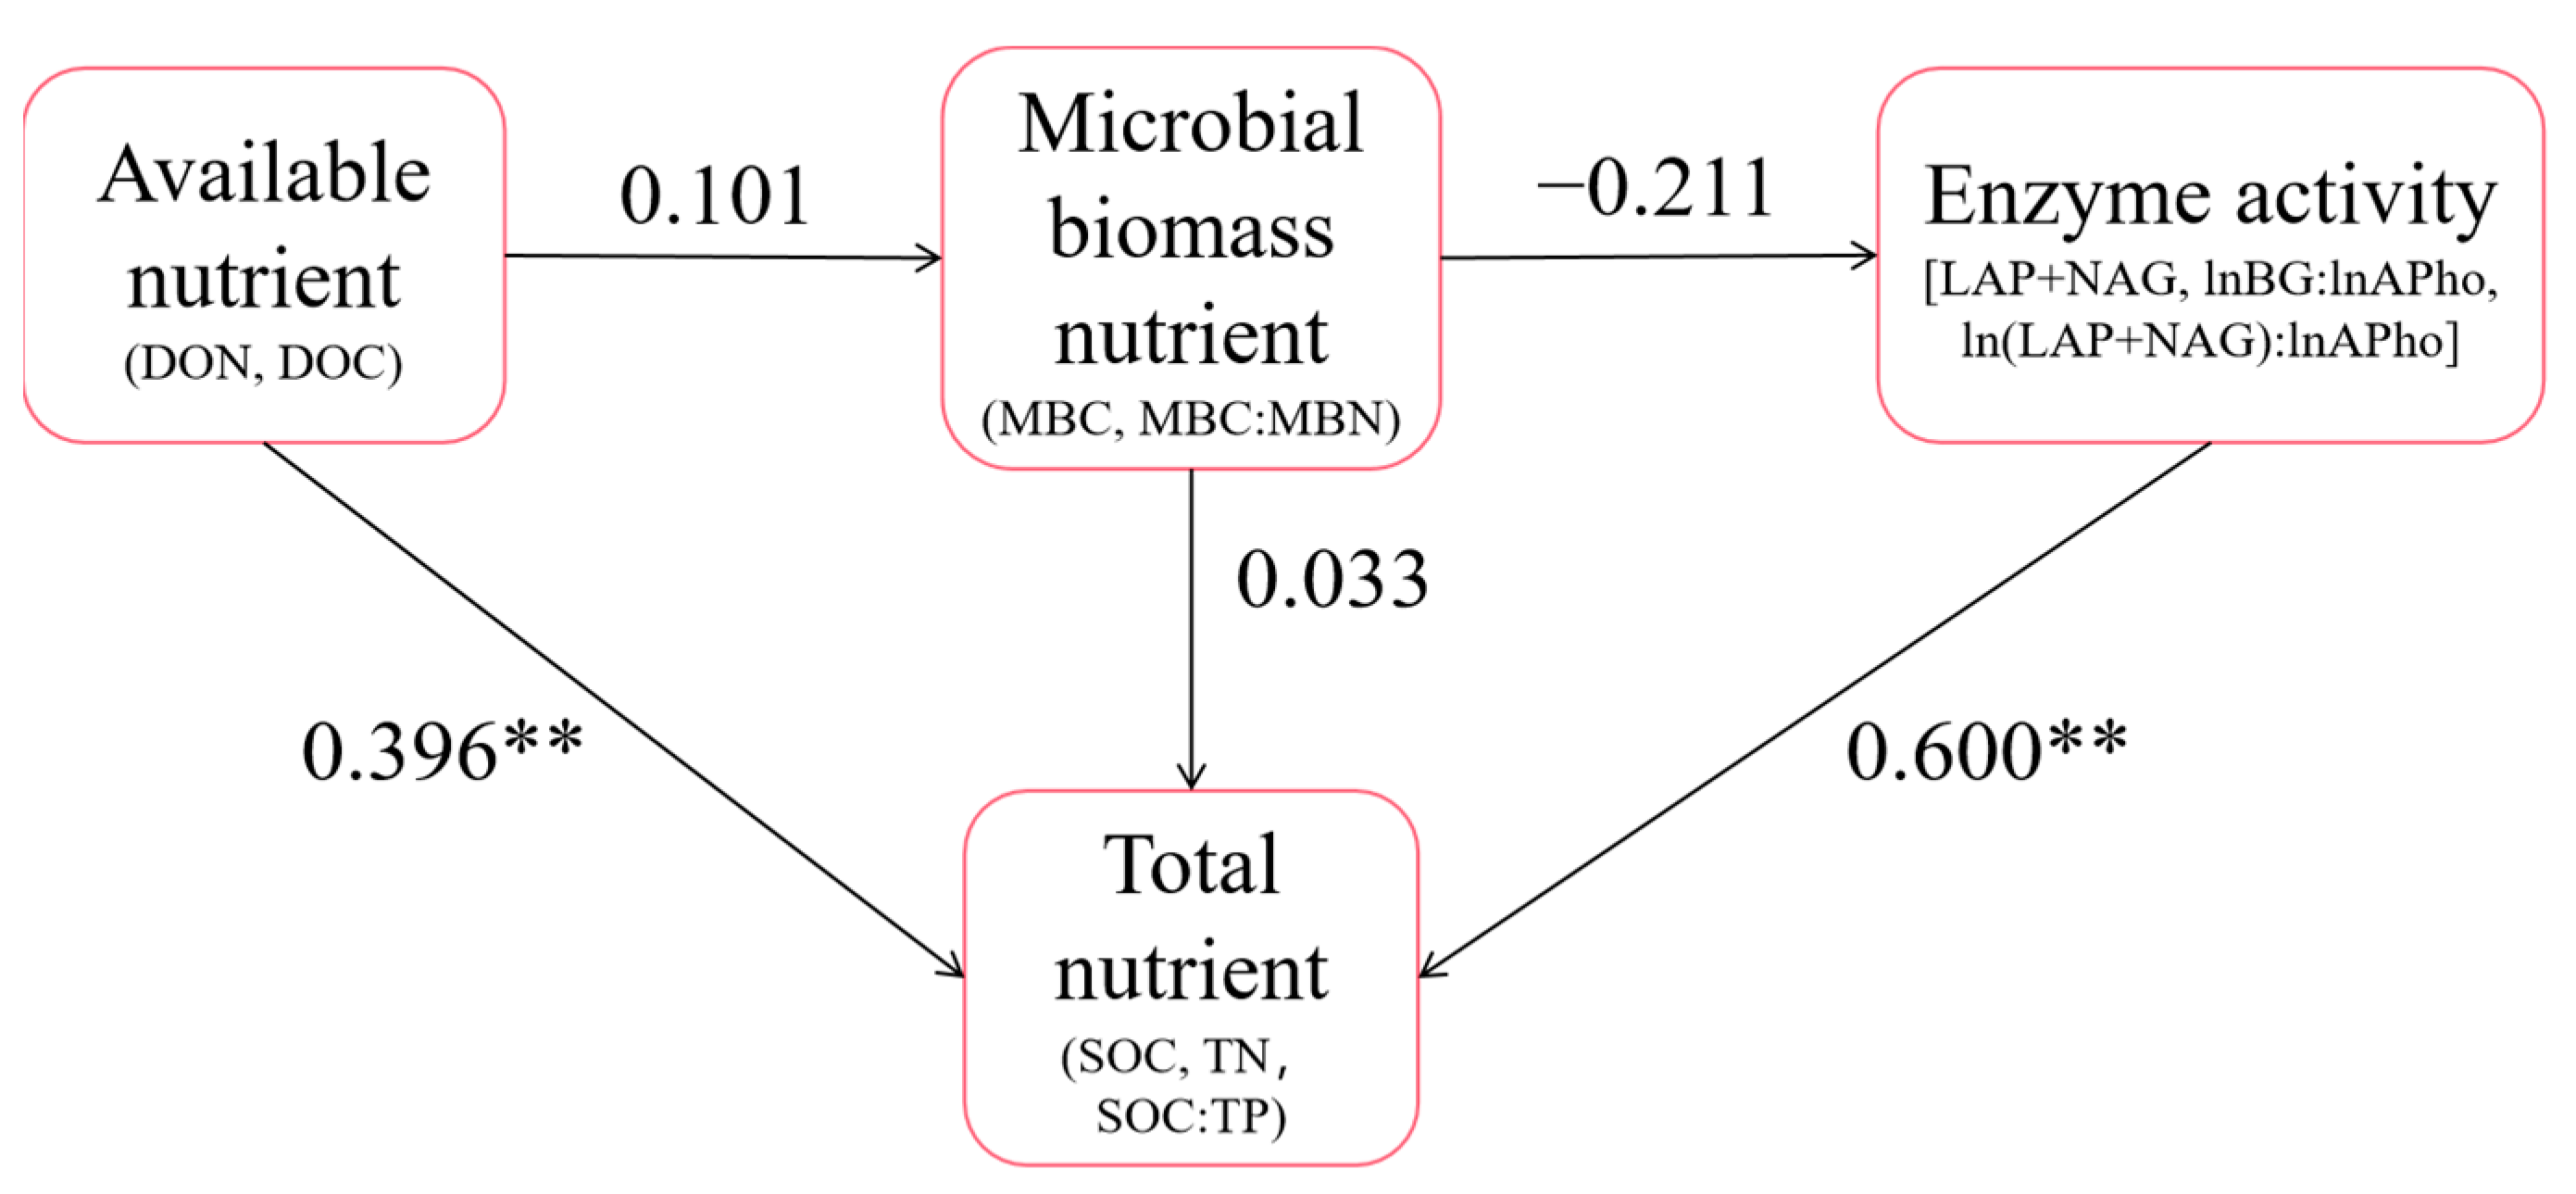
The results of the SEM are shown in Figure 8. There was a significant positive correlation between available nutrients and total nutrients; the standardized coefficient was 0.396**. There was significant positive correlation between soil enzymes and total nutrients; the standardized coefficient was 0.600**. The GFI of the model was 0.586. The fitting effect was good. In addition, Figure S1 shows that the analysis results between different forest types are basically consistent with the overall analysis results in Figure 8. The difference was that soil microbial biomass nutrients in primary forest were significantly positively correlated with enzyme activities, while soil available nutrients in secondary forest were significantly negatively correlated with microbial biomass nutrients and total nutrients.
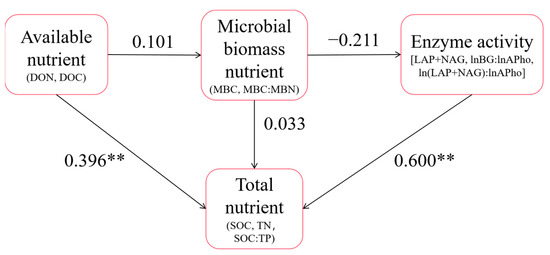
Figure 8.
SEM diagram. The nutrient indices and stoichiometric characteristics measured in this study were divided into four categories: total nutrient, available nutrient, microbial biomass nutrient and enzyme activity. On this basis, the SEM was constructed, and the index with a standardized load coefficient less than 0.6 was eliminated. Finally, the results of the structural equation model were obtained and ** represents p < 0.01.
3.6. The Results of Linear Regression Analysis and the F Values of the Effect of Forest Type on the Ratio of C, N, and P
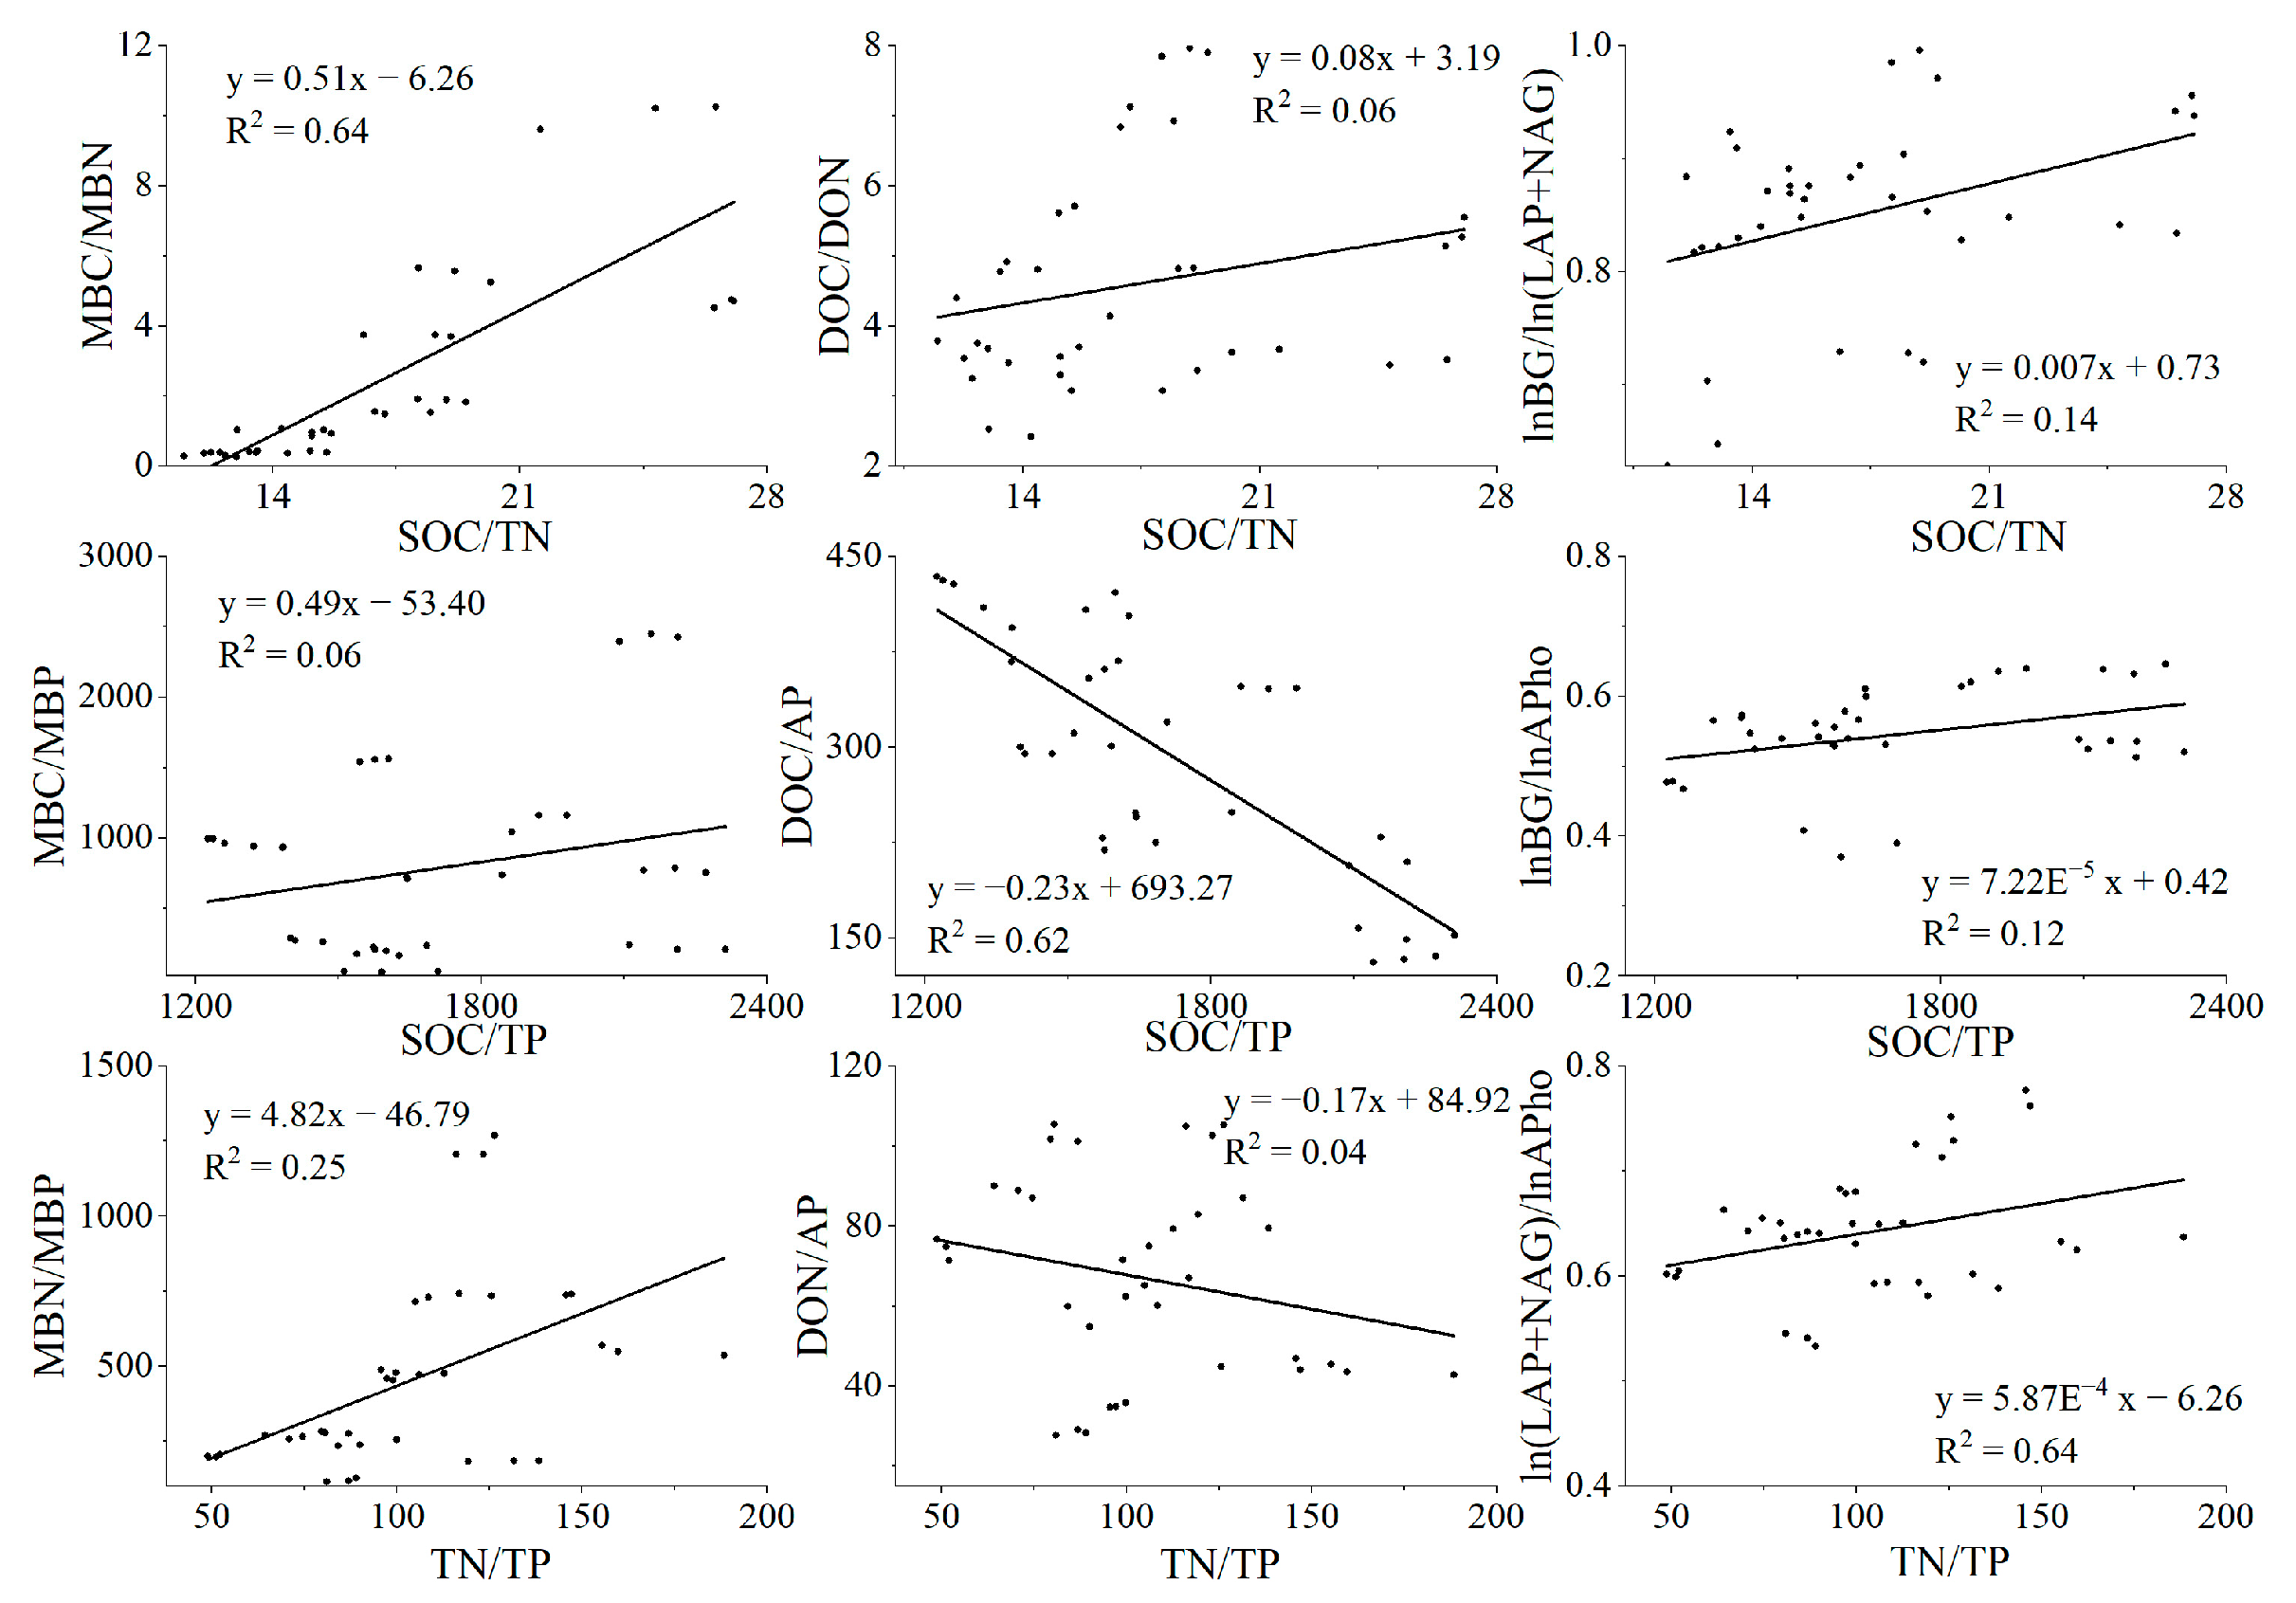
From the results of linear regression, we can conclude that when the soil C:N:P value increases, the microbial biomass C:N:P value and the enzyme activity ratio also increase (Figure 9). At the same time, we found a downward trend in DOC/AP and DON/AP. In addition, from Table 2, we found that forest type has a wide and significant influence on soil stoichiometric characteristics.
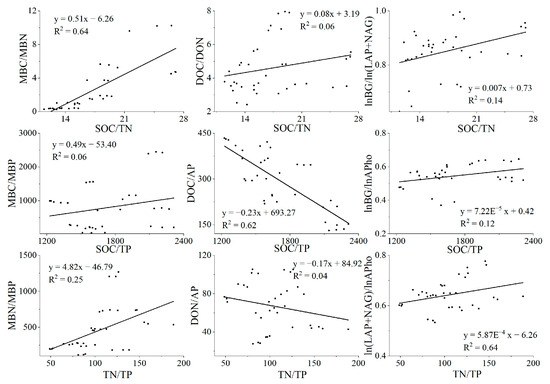
Figure 9.
Linear regression diagram. Linear regression results of soil C:N:P to microbial biomass C:N:P, rapid availability C:N:P, and enzyme activity.
Table 2.
Table of F values. The F values of the effect of forest type on the ratio of C, N and P, ** represents p < 0.01.
4. Discussion
4.1. Effects of Different Forest Types on Soil SOC, TN, TP, and Stoichiometric Characteristics
In 0–10 cm, 10–20 cm, and 20–30 cm soil layers, the TN content of Dacrycarpus imbricatus forest soil was not significantly different from that of primary forest soil but significantly higher than that of secondary forest soil (Figure 3b). In the Pinus caribaea Morelet forest, we found that the TN content decreased significantly compared with that of the primary forest. The TN content of the Dacrycarpus imbricatus forest soil was probably related to the N fixation of bacteria in the nodules located on the roots of Dacrycarpus imbricatus [33]. The decrease in the soil TN content in the Pinus caribaea Morelet forest may be related to the fact that there was a certain degree of clearing before the planting, the vegetation was relatively short, and the ability of forest organisms to return was reduced, which led to the decline in soil fertility [34].
In addition, we also found that the SOC:TP values (1710.41–2211.37) of shallow soil (0–10 cm) in different forest types (Figure 3e) were all higher than the average atomic ratio of soil observation data (134) in China [35], indicating that significant P restriction has become a major factor limiting soil fertility and plant growth in this region. The nutrient status of tropical forest soil showed a lack of P, mainly due to soil weathering and P loss caused by high temperature and strong precipitation [7]. In addition, N deposition in southern China has led to faster plant growth than in the past, which requires plants to absorb more P. Therefore, P limitation in soil is further intensified [36]. From the results of the study of total nutrients, we found that the soil nutrients usually showed a downward trend after the conversion of tropical primary forest to other forest types. P deficiency due to climate impacts and human activities is a more critical issue in this transition.
4.2. Effects of Different Forest Types on Soil DOC, DON, AP, and Stoichiometric Characteristics
In the primary forest area, the vegetation is dense, the shading is strong, and the soil nutrients are less affected by precipitation leaching than the secondary forest. The vegetation in the secondary forest area is sparse after felling and regeneration, and the leaching phenomenon caused by precipitation is significant. After the primary forest was felled and regenerated into the secondary forest, the soil DOC:DON and DOC:AP values increased, showing a limiting trend of DON and AP (Figure 4d,e). The contents of DOC, DON, and AP in the soil of the Dacrycarpus imbricatus forest were higher than others, which is speculated to be related to the microbial activity of root nodulation (Figure 4a–c). The DON and AP in the Pinus caribaea Morelet forest decreased to a certain extent compared with the primary forest, which may be caused by the decrease in biodiversity and soil fertility after clearing the forestland and planting a single tree species (Figure 4a–c).
In addition, the study of Shi Yuanyuan et al. indicated that a soil AP content below 1.60 mg/kg is a very low level, 1.61–4.00 mg/kg is a low level, and 4.01–5.70 mg/kg is a medium level [37]. Except in the 0–10 cm soil layer of the primary forest and Dacrycarpus imbricatus forest, the AP content in the soil of the other study plots was at a low or extremely low level, which may be caused by the humid and rainy climate and stronger weathering and leaching into the soil [36]. The low content of AP is consistent with TP in soil, which proves again the problem of P limitation in tropical forest soil. In general, the changes in soil available nutrients were consistent with the changes in the total nutrients. The results of the SEM also showed that available nutrients in soil can directly and significantly affect total nutrients (standardized coefficient 0.396**).
4.3. Effects of Different Forest Types on Soil MBC, MBN, MBP, and Stoichiometric Characteristics
We found that the MBC, MBN, and MBP in the secondary forest soil were higher than that in the primary forest soil (Figure 5a–c). Due to the presence of nodulation in roots, the soil microbial content of the Dacrycarpus imbricatus forest was relatively high, so it had relatively high MBN and MBP values, while the low MBC may have been caused by the high content of elemental N in the soil (Figure 5a–c). Due to deforestation and the planting of new tree species, the plant diversity and microbial biomass of the Pinus caribaea Morelet forest have been reduced. After the primary forest was cut down, the secondary forest formed again on the bare land, and the community species were more rich and the plant diversity was higher. Differences in the composition of above-ground vegetation are considered one of the pivotal factors affecting soil microbial biomass, and plant diversity has a significant impact on both the metabolic activity and diversity of microorganisms [38].
In addition, we found that the MBC:MBN values of the plots of different forest types were all lower than the mean value of 8.6 [17] except in the 0–10 cm soil layer in the Pinus caribaea Morelet forest. Meanwhile, MBC:MBP and MBN:MBP were much higher than the mean values of 60 and 6.9 [17], indicating a strong restriction of soil MBP. The results of soil MBP also correspond to TP and AP.
4.4. Effects of Different Forest Types on Soil BG, (LAP + NAG), APho Activities, and Stoichiometric Characteristics
In our study, we found that soil BG activity decreased after the forest type changed from primary forest to secondary forest (Figure 6a). This result corresponded with the increase in soil MBC, and similar results were found in the Pinus caribaea Morelet forest (Figure 6a). The interaction between soil BG activity and MBC was also reflected in the relationship between (LAP + NAG) activity and MBN in 0–10 cm and 10–20 cm soil layers of the primary forest, secondary forest, and Dacrycarpus imbricatus forest (Figure 6b). The lower BG activity in the Dacrycarpus imbricatus forest may be due to N accumulation caused by mycorrhizal activity. In the case of insufficient soil nutrients, soil microorganisms will secrete more corresponding element-acquisition enzymes to “compensate” to a certain extent [39]. In our study, the lower P content and higher enzyme activity of the soil also support the above idea. In other words, the high APho activity reflects the low P status in the soil.
The results of enzyme stoichiometry deviated from the international average lnBG:ln(LAP + NAG):lnAP results of Zhou et al., i.e., 1:1:1 [40]. The lnBG:ln(LAP + NAG) of secondary forest (0.89, 0.98, 0.72) closer to 1:1 showed better C and N cycling (Figure 6d). In addition, we found that the values of (LAP + NAG)/AP in the soil of the study area deviated from 1:1 (Figure 7). This suggests that after the transition from primary forest to other forest types, microorganisms attempted to produce more P-harvesting enzymes in response to lower P levels in the soil. This result is also consistent with the compensation mechanism mentioned above. The results of the SEM showed that soil enzyme activity significantly affected the soil total nutrients (standardization coefficient was 0.600**). Notably, microbial biomass nutrients were negatively correlated with soil enzyme activities. We believe that this reflects the antagonism between the microbial biomass in the soil and the related nutrient-harvesting enzymes; that is, the microorganisms do not continue to secrete excessive enzymes to further utilize the soil nutrients at high microbial biomass. This corresponds to the nutrient results obtained in our study.
5. Conclusions
All plots in this study showed lower AP contents than the average in China. The SOC:TP ratios were higher than the average in China, and the soil (LAP + NAG)/APho value was less than 1. The nutrients in the area showed a P-limited state. In addition, different forest types had noteworthy influences on soil chemical properties and stoichiometric characteristics. In our results, the primary forest showed relatively good nutrient cycling. Compared with the primary forest, the secondary forest showed a decrease in SOC, TN, BG activity, (LAP + NAG) activity, and the contents of available nutrients and an increase in the MBC, MBN, and MBP contents. The contents of TN, MBN, DOC, DON, and AP in the soil of the Dacrycarpus imbricatus forest was significantly higher than those of the primary forest, while the (LAP + NAG) activity was lower. The SOC, TN, TP, DON, AP, MBN, BG, and (LAP + NAG) activities in the soil of the Pinus caribaea Morelet forest were significantly lower than those in the primary forest soil. The results of the SEM showed that the factors that significantly affected the total soil nutrients were available nutrients and the corresponding nutrient-acquisition enzyme activities. Therefore, more attention should be paid to the protection of the ecological environment of the primary forest. For better benefits and long-term requirements of sustainable development, the plantation forests should be scientifically adjusted and soil nutrients optimized.
Supplementary Materials
The following supporting information can be downloaded at: https://www.mdpi.com/article/10.3390/su16020480/s1, Figure S1: Structural equation model supplement diagram. SEM analysis was carried out according to forest type. Primary forest (a), Secondary forest (b), Dacrycarpus imbricatus (c), Pinus caribaea Morelet (d).
Author Contributions
H.L.: Methodology, Investigation, Data collecting, Writing—original draft. J.Q.: Investigation, Data collecting, Writing—review and editing. D.L.: Investigation, Software, Data collecting, Writing—review and editing. J.Y.: Data collecting, Writing—review and editing. M.C.: Data collecting, Writing—review and editing. S.L.: Data collecting, Writing—review and editing. C.L. (Changjiang Li): Conceptualization, Funding acquisition, Writing—review and editing. C.L. (Changzhen Li): Conceptualization, Funding acquisition, Writing—review and editing. All authors have read and agreed to the published version of the manuscript.
Funding
This work was financially supported by the National Natural Science Foundation of China (Grant No. 32160307).
Institutional Review Board Statement
Not applicable.
Informed Consent Statement
Not applicable.
Data Availability Statement
The data of this study have been reflected in the article. If necessary, the corresponding author can be contacted to obtain raw data on demand.
Conflicts of Interest
The authors declare no conflict of interest.
References
- Wang, W.; Peng, Y.; Chen, Y.; Lei, S.; Wang, X.; Farooq, T.H.; Liang, X.; Xhang, C.; Yan, W.; Chen, X. Ecological Stoichiometry and Stock Distribution of C, N, and P in Three Forest Types in a Karst Region of China. Plants 2023, 12, 2503. [Google Scholar] [CrossRef] [PubMed]
- Heinrich, V.H.A.; Vancutsem, C.; Dalagnol, R.; Rosan, T.M.; Fawcett, D.; Silva-Junior, C.H.L.; Cassol, H.L.G.; Achard, F.; Jucker, T.; Silva, C.A.; et al. The carbon sink of secondary and degraded humid tropical forests. Nature 2023, 615, 436–442. [Google Scholar] [CrossRef] [PubMed]
- Mitchard, E. The tropical forest carbon cycle and climate change. Nature 2018, 559, 527–534. [Google Scholar] [CrossRef] [PubMed]
- Gatti, L.V.; Basso, L.S.; Miller, J.B.; Gloor, M.; Gatti Domingues, L.; Cassol, H.L.G.; Tejada, G.; Aragão, L.E.O.C.; Nobre, C.; Peters, W.; et al. Amazonia as a carbon source linked to deforestation and climate change. Nature 2021, 595, 388–393. [Google Scholar] [CrossRef]
- Lu, J.; Feng, S.; Wang, S.; Zhang, B.; Ning, Z.; Wang, R.; Chen, X.; Yu, L.; Zhao, H.; Lan, D.; et al. Patterns and driving mechanism of soil organic carbon, nitrogen, and phosphorus stoichiometry across northern China’s desert-grassland transition zone. Catena 2023, 220, 106695. [Google Scholar] [CrossRef]
- Qi, D.; Feng, F.; Lu, C.; Fu, Y. C:N:P stoichiometry of different soil components after the transition of temperate primary coniferous and broad-leaved mixed forests to secondary forests. Soil Tillage Res. 2022, 216, 105260. [Google Scholar] [CrossRef]
- Zhang, J.; Li, M.; Xu, L.; Zhu, J.; Dai, G.; He, N. C:N:P stoichiometry in terrestrial ecosystems in China. Sci. Total Environ. 2021, 795, 148849. [Google Scholar] [CrossRef]
- Tao, Y.; Zhou, X.-B.; Zhang, S.-H.; Lu, H.-Y.; Shao, H. Soil nutrient stoichiometry on linear sand dunes from a temperate desert in Central Asia. Catena 2020, 195, 104847. [Google Scholar] [CrossRef]
- Wei, X.; Zhu, Z.; Liu, Y.; Luo, Y.; Deng, Y.; Xu, X.; Liu, S.; Richter, A.; Shibistova, O.; Guggenberger, G.; et al. C:N:P stoichiometry regulates soil organic carbon mineralization and concomitant shifts in microbial community composition in paddy soil. Biol. Fertil. Soils 2020, 56, 1093–1107. [Google Scholar] [CrossRef]
- Guo, Z.; Wang, Y.; Wan, Z.; Zuo, Y.; He, L.; Li, D.; Yuan, F.; Wang, N.; Liu, J.; Song, Y.; et al. Soil dissolved organic carbon in terrestrial ecosystems: Global budget, spatial distribution and controls. Glob. Ecol. Biogeogr. 2020, 29, 2159–2175. [Google Scholar] [CrossRef]
- He, Y.; Sun, J.; Xiong, J.; Shang, H.; Wang, X. Patterns, Dynamics, and Drivers of Soil Available Nitrogen and Phosphorus in Alpine Grasslands across the QingZang Plateau. Remote Sens. 2022, 14, 4929. [Google Scholar] [CrossRef]
- Terrer, C.; Jackson, R.B.; Prentice, I.C.; Keenan, T.F.; Kaiser, C.; Vicca, S.; Fisher, J.B.; Reich, P.B.; Stocker, B.D.; Hungate, B.A.; et al. Nitrogen and phosphorus constrain the CO2 fertilization of global plant biomass. Nat. Clim. Chang. 2019, 9, 684–689. [Google Scholar] [CrossRef]
- Wang, X.; Zheng, M.; Zhang, Y.; Chen, Y.; Zhao, L.; Chai, B.; Jia, T. Stoichiometric Soil Microbial and Enzymatic Characteristics under Three Different Plantation Types in China’s Luya Mountain. Forests 2023, 14, 558. [Google Scholar] [CrossRef]
- Zhou, Z.; Wang, C.; Luo, Y. Response of soil microbial communities to altered precipitation: A global synthesis. Glob. Ecol. Biogeogr. 2018, 27, 1121–1136. [Google Scholar] [CrossRef]
- Zheng, H.F.; Vesterdal, L.; Schmidt, I.K.; Rousk, J. Ecoenzymatic stoichiometry can reflect microbial resource limitation, substrate quality, or both in forest soils. Soil Biol. Biochem. 2022, 167, 108613. [Google Scholar] [CrossRef]
- Xiao, X.Q.; Zhang, H.K.; Feng, Y.S.; Wang, J.P.; Liang, C.F.; Chen, Y.C.; Zhu, G.D.; Cai, Y.J. Effects of plant residues on C:N:P of soil, microbial biomass, and extracellular enzyme in an alpine mea-dow on the Qinghai-Tibetan Plateau, China. Ying Yong Sheng Tai Xue Bao = J. Appl. Ecol. 2023, 34, 58–66. [Google Scholar] [CrossRef]
- Cleveland, C.C.; Liptzin, D. C:N:P stoichiometry in soil: Is there a “Redfield ratio” for the microbial biomass? Biogeochemistry 2007, 85, 235–252. [Google Scholar] [CrossRef]
- Kirkby, C.A.; Kirkegaard, J.A.; Richardson, A.E.; Wade, L.J.; Blanchard, C.; Batten, G. Stable soil organic matter: A comparison of C:N:P:S ratios in Australian and other world soils. Geoderma 2011, 163, 197–208. [Google Scholar] [CrossRef]
- Bui, E.N.; Henderson, B.L. C:N:P stoichiometry in Australian soils with respect to vegetation and environmental factors. Plant Soil 2013, 373, 553–568. [Google Scholar] [CrossRef]
- Li, Y.; Wu, J.; Liu, S.; Shen, J.; Huang, D.; Su, Y.; Wei, W.; Syers, J.K. Is the C:N:P stoichiometry in soil and soil microbial biomass related to the landscape and land use in southern subtropical China? Glob. Biogeochem. Cycles 2012, 26, GB4002. [Google Scholar] [CrossRef]
- Yu, Z.; Wang, M.; Huang, Z.; Lin, T.C.; Vadeboncoeur, M.A.; Searle, E.B.; Chen, H.Y. Temporal changes in soil C-N-P stoichiometry over the past 60 years across subtropical China. Glob. Chang. Biol. 2018, 24, 1308–1320. [Google Scholar] [CrossRef] [PubMed]
- Zhang, W.; Liu, W.; Xu, M.; Deng, J.; Han, X.; Yang, G.; Feng, Y.; Ren, G. Response of forest growth to C:N:P stoichiometry in plants and soils during Robinia pseudoacacia afforestation on the Loess Plateau, China. Geoderma 2019, 337, 280–289. [Google Scholar] [CrossRef]
- Zhou, Z.; Jiang, L.; Du, E.; Hu, H.; Li, Y.; Chen, D.; Fang, J. Temperature and substrate availability regulate soil respiration in the tropical mountain rainforests, Hainan Island, China. J. Plant Ecol. 2013, 6, 325–334. [Google Scholar] [CrossRef]
- Jiang, L.; Ma, S.; Zhou, Z.; Zheng, T.; Jiang, X.; Cai, Q.; Li, P.; Zhu, J.; Li, Y.; Fang, J. Soil respiration and its partitioning in different components in tropical primary and secondary mountain rain forests in Hainan Island, China. J. Plant Ecol. 2016, 10, 791–799. [Google Scholar] [CrossRef]
- Chen, D.; Li, Y.; Liu, H.; Xu, H.; Xiao, W.; Luo, T.; Zhou, Z.; Lin, M. Biomass and carbon dynamics of a tropical mountain rain forest in China. Sci. China Life Sci. 2010, 53, 798–810. [Google Scholar] [CrossRef]
- Richard, H.L.; Donald, L.S. Soil Science of America and American Society of Agronomy; Book Series No. 5; Madison, WI, USA, 1996; Available online: https://acsess.onlinelibrary.wiley.com/doi/book/10.2136/sssabookser5.3 (accessed on 10 December 2023).
- Parkinson, J.; Allen, S. A Wet Oxidation Procedure for Determination of Nitrogen and Mineral Nutrients in Biological Material. Commun. Soil Sci. Plant Anal. 1975, 6, 1–11. [Google Scholar] [CrossRef]
- Schoenau, J.; Huang, W. Anion-exchange membrane, water, and sodium bicarbonate extractions as soil tests for phosphorus. Commun. Soil Sci. Plant Anal. 1991, 22, 465–492. [Google Scholar] [CrossRef]
- Vance, E.; Brookes, P.C.; Jenkinson, D.S. Microbial biomass measurements in forest soils: Determination of kC values and tests of hypotheses to explain the failure of the chloroform fumigation-incubation method in acid soils. Soil Biol. Biochem. 1987, 19, 689–696. [Google Scholar] [CrossRef]
- Anderson, J.P.; Domsch, K.H. A physiological method for the quantitative measurement of microbial biomass in soils. Soil Biol. Biochem. 1978, 10, 215–221. [Google Scholar] [CrossRef]
- Burns, R.G. Soil Biology & Biochemistry Citation Classics. Soil Biol. Biochem. 2004, 36, 3. [Google Scholar] [CrossRef]
- Saiya-Corka, K.R.; Sinsabaugha, R.L.; Zakb, D.R. The effects of long term nitrogen deposition on extracellular enzyme activity in an Acer saccharum forest soil. Soil Biol. Biochem. 2002, 34, 1309–1315. [Google Scholar] [CrossRef]
- Zhuang, P. Studies on Diversity of Endophytic Bacteria in the Nodule of Podocarpus imbricatus. Master’s Thesis, Guangxi University, Nanning, China, 2006. Available online: https://www.xueweilunwen.com/doc/512927 (accessed on 10 December 2023).
- Li, Z.; Chen, S.; Zhou, Y.; Zhong, X. Study on soil fertility change of Pinus caribaea Morelet after afforestation. Guangdong For. Technol. 2005, 21, 30–33. Available online: https://xueshu.baidu.com/usercenter/paper/show?paperid=195c0m20ur0j08x0vh6f0670j6313904&site=xueshu_se (accessed on 10 December 2023).
- Tian, H.; Chen, G.; Zhang, C.; Melillo, J.M.; Hall CA, S. Pattern and variation of C:N:P ratios in China’s soils: A synthesis of observational data. Biogeochemistry 2009, 98, 139–151. [Google Scholar] [CrossRef]
- Zhang, J.; Zhao, N.; Liu, C.; Yang, H.; Li, M.; Yu, G.; Wilcox, K.; Yu, Q.; He, N. C:N:P stoichiometry in China’s forests: From organs to ecosystems. Funct. Ecol. 2018, 32, 50–60. [Google Scholar] [CrossRef]
- Shi, Y.Y.; Deng, M.J.; Jian, T.; Song, X.C.; Wang, H.L.; Qin, Q.Y. Forest soil nutrient classification method based on spatial analysis. Pratacult. Sci. 2016, 33, 1112–1117. [Google Scholar] [CrossRef]
- Li, J.; Lan, G.Y.; Li, Y.-W. Comparative Studies on Soil Microbial Biomass Carbon in Rubber Forest and Secondary Forest in Danzhou, Hainan Province. 2016. Available online: https://xueshu.baidu.com/usercenter/paper/show?paperid=2ef1c7b294322475fcfe06e303823c09&site=xueshu_se&hitarticle=1 (accessed on 10 December 2023).
- Zhang, W.; Xu, Y.; Gao, D.; Wang, X.; Liu, W.; Deng, J.; Han, X.; Yang, G.; Feng, Y.; Ren, G. Ecoenzymatic stoichiometry and nutrient dynamics along a revegetation chronosequence in the soils of abandoned land and Robinia pseudoacacia plantation on the Loess Plateau, China. Soil Biol. Biochem. 2019, 134, 1–14. [Google Scholar] [CrossRef]
- Zhou, L.; Liu, S.; Shen, H.; Zhao, M.; Xu, L.; Xing, A.; Fang, J. Soil extracellular enzyme activity and stoichiometry in China’s forests. Funct. Ecol. 2020, 34, 1461–1471. [Google Scholar] [CrossRef]

Disclaimer/Publisher’s Note: The statements, opinions and data contained in all publications are solely those of the individual author(s) and contributor(s) and not of MDPI and/or the editor(s). MDPI and/or the editor(s) disclaim responsibility for any injury to people or property resulting from any ideas, methods, instructions or products referred to in the content. |
© 2024 by the authors. Licensee MDPI, Basel, Switzerland. This article is an open access article distributed under the terms and conditions of the Creative Commons Attribution (CC BY) license (https://creativecommons.org/licenses/by/4.0/).