Abstract
Digital infrastructure plays a crucial role in shaping household energy consumption behaviors, especially in the context of achieving carbon peaking and carbon neutrality goals in China. In this study, we explored the impact of broadband infrastructure on household energy consumption and clean fuel choices, using data from the China Health and Retirement Longitudinal Study (CHARLS). In a difference-in-differences (DID) framework, our findings indicate that the promotion of broadband infrastructure significantly increases rural household energy consumption and facilitates a transition to cleaner energy sources. Notably, households with better socioeconomic status, particularly those with higher education and income levels, benefit more from enhanced broadband internet access. Mechanism analysis reveals that the “Broadband China” policy can positively influence household consumption through several potential channels: fostering technological innovation, enhancing energy efficiency in cities, and improving overall environmental awareness. These findings contribute to our understanding of the role of broadband infrastructure in shaping household energy consumption patterns and have important implications for policymakers, particularly in the context of sustainable development and energy transition efforts.
1. Introduction
Residential energy consumption is a crucial component of overall energy usage [1]. Residential energy consumption not only affects individual households but also contributes to broader energy challenges and environmental concerns. China has been actively engaged in global climate change governance efforts. China, as a state party to the Paris Agreement, promised to peak its carbon dioxide emissions by 2030 and achieve carbon neutrality by 2060. However, China is facing challenges in achieving carbon neutrality while reducing energy poverty. Eliminating energy poverty requires the improvement in the living conditions of low-income households, which leads to higher carbon emissions and may undermine climate change mitigation efforts. It is worth noting that, in China, particularly in rural areas [2], some households still do not have access to affordable, reliable, and sustainable modern energy services [3]. The Sustainable Development Goals Report 2024 released by the United Nations shows that, in 2022, 2.1 billion people still lacked access to clean cooking fuels.
Addressing the challenges associated with residential energy consumption requires a multifaceted and comprehensive strategy, including the accessibility and affordability of energy, the promotion of energy efficiency, the adoption of renewable energy sources, etc. Therefore, the government should support energy access and energy efficiency practices for households through incentives for clean energy adoption [4]. This would foster a collaborative approach to address energy poverty while meeting broader environmental goals, especially in rural areas.
The development of Information and Communications Technology (ICT) and broadband infrastructure is already playing an important role in energy conservation, carbon reduction, and green transformation. These advancements create a more inclusive and connected society, particularly benefiting those in underserved or remote regions [5]. The development of broadband infrastructure improves access to information, e-commerce, and financial inclusion. This helps eliminate geographical barriers, enhance market information flow, reduce information asymmetry, and lower the costs of collecting information [6]. From a household perspective, the influence of ICT and broadband infrastructure on energy consumption is becoming increasingly significant. Numerous studies have sought to investigate the connection between broadband development and energy-related factors, particularly addressing issues such as energy accessibility, affordability, cleanliness, and energy poverty [7,8].
We explored the impact of broadband infrastructure on household energy consumption and clean fuel choices. Addressing the endogeneity issue is crucial, as certain unobserved household characteristics, such as higher digital literacy, may drive the adoption of high-speed broadband, which, in turn, affects energy consumption decisions. Additionally, regions with better energy services may naturally attract more broadband providers. To mitigate these endogeneity concerns, we introduced the “Broadband China” policy reform, and employed the difference-in-differences research method. The “Broadband China” program was introduced to accelerate the deployment of broadband infrastructure and support the digital transformation of various sectors. The program identified 117 “Broadband China” demonstration cities (groups) from 2014 to 2016 to serve as demonstrations of broadband implementation. The program involves substantial investments in broadband infrastructure, including the expansion of fiber-optic networks, the upgrade of internet speeds, and the improvement of network reliability. Therefore, the implementation of the “Broadband China” policy offers a quasi-natural experiment for identifying the causal relationship between broadband infrastructure and energy consumption behaviors.
Using the data from the China Health and Retirement Longitudinal Study (CHARLS) from 2011 to 2018, our results suggest that the promotion of broadband infrastructure significantly increases rural household energy consumption and further facilitates the transition to cleaner energy sources. Moreover, larger households living in multi-story buildings, particularly those with higher levels of education and income, tend to benefit more from the implementation of the “Broadband China” policy.
This paper makes several contributions to the literature. First, we used a multi-period DID approach to identify the causal effects of digital infrastructure development on household energy consumption based on the “Broadband China” policy. This method helps to control for potential confounding factors and strengthens the internal validity. Second, the majority of studies concentrate on energy consumption at the city or province level, often overlooking household-level consumption, which is intricately connected to our daily lives. Examining energy consumption at the household level offers valuable insights into household consumption behaviors, lifestyle choices, and the effectiveness of energy-related interventions, contributing to a more comprehensive and actionable approach to energy sustainability. Third, our study focuses on residents aged above 45 in rural China. Compared to urban residents, rural residents have relatively lower energy consumption levels and an inefficient energy consumption structure. By specifically examining the impact of broadband infrastructure on energy consumption of the elderly in rural areas, this analysis aims to bridge the digital and socio-economic gaps between urban and rural areas.
The remainder of the paper is organized as follows. Section 2 briefly describes the background of the “Broadband China” policy and research hypothesis. Section 3 describes our data used in analysis and the description. Section 4 describes the empirical strategy. Section 5 presents the baseline empirical results and robustness checks. Section 6 analyzes the impact of “Broadband China” policy on household clean energy choices. Section 7 reports the heterogeneity analyses and mechanism analyses. Section 8 provides concluding remarks and policy implications.
2. Policy Background and Research Hypothesis
2.1. Institutional Background: “Broadband China” Strategy
In 2013, the State Council in China issued the “Notice on the Issuance of the ‘Broadband China’ Strategy and Implementation Plan” (the “Notice”). The “Broadband China” strategy aims to address challenges in China’s broadband networks. This strategy emphasizes strategic guidance and systematic deployment, promoting the development of broadband infrastructure in China. Key goals include overcoming issues such as increasing internet speed, achieving more equitable urban–rural deployment, enhancing technological innovation capabilities, and clarifying the positioning of public infrastructure. This strategy reflects a commitment to advancing broadband technology to enhance connectivity and address infrastructure-related challenges.
The “Broadband China” strategy introduced three development phases. These phases collectively outline a strategic progression, starting with infrastructure reinforcement and user experience improvement, followed by an extensive push for broadband network expansion and popularization, and concluding with a focus on optimization, technological upgrading, and quality improvement in the following years. A total of 117 cities (groups) were designated as “Broadband China” demonstration cities (groups) in the years 2014, 2015, and 2016 (see Table 1 for all the broadband demonstration cities). As a national strategy supported by the government, the implementation of the “Broadband China” policy is anticipated to significantly accelerate broadband development within these cities (groups).

Table 1.
List of “Broadband China” demonstration cities from 2014 to 2016.
According to the “Notice”, the “Broadband China” policy strategically integrates the construction of internet infrastructure and the application of digital technologies across residential and industrial sectors. The “Broadband China” policy plays a crucial role in enhancing household internet access capabilities and, thus, cultivating new residential behaviors, including household energy consumption behaviors [6,7].
To confirm the exogeneity of the “Broadband China” strategy, we followed the approach of Liu [9]. Specifically, we regressed the year of implementation of the “Broadband China” policy on a range of observed city characteristics from the year of 2011. These characteristics include the average values of the following variables: the age of the household head, marital status (whether the head is married), employment status of the household head in the past year, the number of children in the household, family size, the natural logarithm of the total value of cash and deposits in financial institutions, and the natural logarithm of the value of the primary residence. The results are shown in Table 2. None of the coefficients significantly differ from zero, showing that the most observable factors have no significant effect on the timing of the reform of the “Broadband China” policy. The results confirmed the validity of the study design.
Table 2.
Characteristics of cities and the timing of reform.
2.2. Research Hypothesis
Energy plays a crucial role in both the daily lives of individuals and the operational processes of companies. The household sector is indeed a significant sector of energy consumption. Residential energy consumption directly impacts environmental sustainability, influences household finances, plays a role in shaping energy policies, and reflects broader trends in societal energy use [10]. Insufficient energy supply can significantly diminish the overall quality of life for residents [11]. Therefore, considerable attention has been given to the reasonable energy utilization of households [12]. Understanding residential energy consumption is essential for achieving sustainability goals, ensuring energy affordability, and fostering a more resilient and efficient energy landscape [13]. Previous studies have extensively analyzed the factors affecting household energy consumption including energy intensity [14], urbanization [15], household environmental awareness [16], income [17], household size [18], etc.
Based on the Life Cycle Hypothesis [19], the consumption behavior of rational individuals is not influenced by their current income, but by their expected lifetime income or overall wealth. This suggests that rising household income exerts a positive impact on consumption levels. Internet usage and digitization facilitate greater access to off-farm employment opportunities, thereby increasing household income [20], which subsequently leads to higher energy consumption. Moreover, according to the Liquidity Constraint Theory [21], individuals tend to increase savings and reduce consumption when borrowing costs, reflected in higher loan interest rates, exceed returns on savings. However, advancements in digital technology facilitate the development of financial services, which helps to alleviate consumers’ liquidity constraints. This, in turn, increases consumption demand [22]. Recent literature has attempted to investigate the impact of enhancing Information and Communication Technology (ICT), particularly technologies such as the internet and digitization, on energy consumption [23,24]. Some empirical results indicated that the promotion of internet technology has a negative effect on energy consumption [24], while others suggested that such development increases energy consumption [7].
Based on the Energy Ladder Hypothesis [25], as economic conditions improve, households tend to transition to more sophisticated energy sources. This theory suggests that energy choices shift progressively from primary energy sources (such as wood) to transitional fuels (such as kerosene) and eventually to higher-quality energy sources (such as electricity). Thus, with rising income levels, households are more likely to opt for cleaner energy alternatives. Notably, recent literature agrees that digital technology has a positive effect on the use of clean or renewable energy [26,27].
There is no doubt that digital information technology has had a significant impact on energy consumption. However, a research gap exists, as most studies have focused on the macro level, neglecting household-level consumption, and more targeted research and policy interventions are needed. In particular, many rural households still rely on traditional biomass energy sources such as crop straw and firewood, which are detrimental to the environment, highlighting the importance of finding measures to address this issue. Therefore, we wanted to explore the impacts of digital development on rural households and proposed the following hypothesis:
Hypothesis 1.
The promotion of digital development has a positive effect on rural household energy consumption.
Hypothesis 2.
The promotion of digital development encourages residents to choose clean energy.
In addition, the mechanisms by which ICT affects energy consumption have been widely discussed by scholars from the perspectives of green innovation [28], energy efficiency [29], and environmental awareness [6]. From the perspective of the government, the development of digital technology promotes the construction of digital government platform, which facilitates the government’s unified coordination of various regions [30], thus putting pressure on enterprises to promote green innovation based on environmental regulations. From the perspective of enterprises, enterprises can conveniently grasp customers’ demands and feedback, based on the digital platform [31], which is beneficial for reducing resource waste and increasing energy efficiency. From the aspect of residents, digital development promotes information dissemination, which is beneficial for residents to understand the situation of environmental pollution and its negative impacts, and cultivate environmental awareness [32]. Green innovation promotes the production of clean energy, thus promoting the transition of energy consumption. The improvement of energy efficiency reduces energy costs, thus increasing consumers’ energy demand. And environmental awareness influences residents to choose clean energy consumption. Therefore, we propose the following mechanism hypothesis:
Hypothesis 3.
Digital development can promote clean energy consumption through the improvement of green innovation, energy efficiency, and public environmental awareness.
3. Data and Variable Description
3.1. Data
This paper matches the micro survey data with macro-level data related to the “Broadband China” policy. The micro data used in this paper were obtained from the China Health and Retirement Longitudinal Survey (CHARLS) in 2011, 2013, 2015, and 2018. The CHARLS aims to collect a high-quality, nationally representative sample of Chinese residents aged 45 and older to support scientific research on the elderly population. The baseline national wave of the CHARLS was conducted in 2011 and includes approximately 10,000 households and 17,500 individuals across 150 counties/districts and 450 villages/resident committees (https://charls.pku.edu.cn/en/). Since our study focused on households in rural areas, we kept the samples living in rural areas. The list of “Broadband China” demonstration cities was obtained from the official website of the Ministry of Industry and Information Technology of the People’s Republic of China.
3.2. Variables
3.2.1. Dependent Variables
Household Energy consumption (). This study focused on household energy consumption behavior, denoted as . We selected two energy consumption indicators, household heating expenses () and household fuel expenses (). represents the adjusted heating expenses of household i in year t, which equals the household heating expenses divided by the annual price index. represents the adjusted fuel expenses, which equals the household fuel expenses divided by the annual price index.
Clean heating () and clean cooking (). The CHARLS survey identified the main source of cooking fuels and heating fuels utilized in households. This study focused on the household choices of heating and cooking fuels. We used answers to the following question: What is the main heating energy source? Options like “Solar”, “Natural Gas”, “Electric”, “Liquefied Petroleum Gas”, and “Concentration heating” were considered clean heating fuels. “Coal” and “Crop residue/Wood burning” were classified as non-clean heating fuels. This proxy variable, denoted as , is a dummy variable that equals 1 if the main heating energy source of household i in year t is clean heating fuel, and 0 otherwise. We used answers to the question “What is the main source of cooking fuel?”. Options like “Natural Gas”, “Liquefied Petroleum Gas”, “Marsh Gas”, and “Electric” were considered clean cooking fuel; “Coal” and “Crop residue/Wood burning” were classified as non-clean cooking fuels. This proxy variable, denoted as , is a dummy variable that equals 1 if the main cooking energy source of household i in year t is clean cooking fuel, and 0 otherwise.
3.2.2. Independent Variable
Broadband infrastructure (). We introduced the exogenous shock of the “Broadband China” policy implementation as a quasi-natural experiment, denoted as . if household i lives in the city where the “Broadband China” policy was implemented by year t; otherwise.
3.2.3. Control Variables
To account for potential factors influencing household energy behaviors, we incorporated several control variables. For household head characteristics, we introduced age (), marital status (), whether the head had engaged in any work in the past year (); for household characteristics, we included the number of children in the household (), number of people living in the household (), and whether the household lives in a multi-story building (), the natural logarithm of the total value of cash and deposits in financial institutions (), and the natural logarithm of the value of the primary residence ().
3.2.4. Description
Table 3 presents the descriptive statistics for all the above variables.
Table 3.
Descriptive statistics.
In Table 3, the average levels of household heating expenses (HHEP) at 126.545 and household fuel expenses (HFEP) at 607.114, with standard deviations of 499.528 and 3983.019, respectively, indicate that households, on average, spend relatively modest amounts on heating and fuel. The relatively large standard deviation, particularly for HFEP, indicates that, while the average expenses are relatively modest, some households have extremely high heating and fuel expenses. This disparity likely reflects factors such as household income, regional climate variations, access to fuel sources, and differences in heating system efficiency. Moreover, the average portion of rural households choosing clean energy for cooking (CC) is 0.424, which suggests that approximately 42.4% of rural households have adopted cleaner energy sources for cooking, such as electricity or natural gas. This implies that, while a significant portion of rural households are transitioning toward cleaner energy, the majority (about 57.6%) still rely on traditional or less environmentally friendly energy sources, such as biomass or coal. The average portion of rural households choosing clean energy for heating (CH) is 0.008, which suggests that only 0.8% of rural households have adopted clean energy sources for heating. This extremely low adoption rate indicates that the vast majority of rural households continue to rely on solid energy sources for heating, such as coal, wood, or biomass.
4. Methodology
To analyze the impacts of digital infrastructure on household energy consumption, we first utilized the implementation of the “Broadband China” policy as a quasi-natural experiment to assess its effects on household energy consumption and energy choice using the difference-in-differences (DID) method. Then, to validate these impacts, we employed an event-study specification to test the parallel trends assumption and used the PSM-DID method to address selection bias. Finally, to explore potential mechanisms, we further applied the DID model to examine the effects of the “Broadband China” policy on relevant mechanism variables.
4.1. Benchmark Model: Difference-in-Differences (DID) Method
To investigate the influence of the “Broadband China” pilot policy on rural household energy consumption, we constructed the following time-varying difference-in-differences (DID) setting:
where denotes the energy consumption of household i in year t. Household energy consumption is measured by two aspects: household heating expenses () and household fuel expenses (); represents whether the city in which household i lives is a pilot city in year t, if it is a pilot city and “Broadband China” policy was implemented in year t, is 1; otherwise, it is 0. includes a variety of control variables mentioned in Section 3.2.3. denotes the household fixed effect; denotes the year fixed effect; denotes the random error term. The coefficient quantifies the influence of broadband infrastructure on household energy consumption in rural China.
4.2. Event-Study Specification
The key assumption in the difference-in-differences (DID) method is the parallel trends assumption. It asserts that, if there were no treatment, the treated and control groups would have followed comparable trends over time. Thus, we use the event study method proposed by [33] for parallel trend testing, which can be expressed as follows:
where is a set of dummy variables that equal 1 if the city where household i is located has implemented the “Broadband China” pilot policy in year t, and 0 otherwise. k = {−4, −3, −2, −1, 0, 1, 2, 3, 4}. We used the 1st period before policy implementation as the base period. The setting of control variables and fixed effects is consistent with Equation (1). The coefficients of interest are the set of . These pre-treatment coefficients measure the difference in the change in outcomes between the treatment and control groups before the onset of the “Broadband China” strategy.
4.3. Further Verification: PSM-DID Method
The propensity score matching-difference-in-differences (PSM-DID) method helps address selection bias by ensuring that treatment and control groups are comparable. We first used propensity score matching to create a control group that was similar to the treatment group in terms of observed characteristics. The specific steps are as follows: We first identified treatment and control groups for each of the four waves in 2011, 2013, 2015, and 2018. The samples were matched on a yearly basis; second, the control variables mentioned in Section 3.2.3 were used as matching data; third, a logit model was used to estimate the propensity score; finally, nearest-neighbor matching was adopted. Then, we constructed the time-varying difference-in-differences (DID) analysis based on Equation (1).
4.4. Mechanism Analysis: Moderating Model
We will further focus on exploring potential mechanisms from three perspectives at the city level: green innovation, energy efficiency, and environmental awareness. We estimated the effect of the Broadband China policy on the above three mechanism indicators using a DID specification:
where denotes the mechanism indicators of city j in year t, and k denotes the kth mechanism indicator: green innovation (the number of granted green patents), energy efficiency (GDP per unit of energy consumption), and environmental awareness (public environmental concern, measured by the daily average search volume for “environmental pollution” and “haze” on Baidu); is the dummy variable if city j implemented “Broadband China” policy by year t. includes the following control variables at the city level: economic development level (per capita GDP), industrial structure (the proportion of secondary industry), population, the number of industrial enterprises above the designated size, and the urbanization rate. represents the city fixed effect; denotes the year fixed effect; denotes the random error term. The coefficient measures the effect of broadband infrastructure on potential mechanisms in China.
5. Results
5.1. DID Estimation Results
Based on Model 1, we estimated the effect of the “Broadband China” strategy on household energy consumption in rural areas. The results are presented in Table 4.
Table 4.
DID estimation results.
In Columns (1) and (2), only the univariate relationship between the “Broadband China” policy and household energy consumption is considered. In Columns (3) and (4), we further control for household head characteristics. In Columns (5) and (6), the model incorporates control variables at both the individual and household levels. Columns (1), (3), and (5) present the regression results of while controlling for different variables. All of the estimation coefficients of are significantly positive at the 1% level, confirming that the implementation of the Broadband China strategy positively affects household heating expenses. Columns (2), (4), and (6) show the regression results of while controlling for different variables. While controlling for more variables, the estimates of coefficients decrease slightly, while all of them are positive at the 5% significance level, confirming the positive impact of the Broadband China strategy on rural household fuel expenses. And Figure 1 shows the estimated values of the dynamic effect coefficients and their 99% confidence intervals. The results indicate that there is no significant difference between households in the pilot and non-pilot cities before the policy was implemented, satisfying the parallel trend assumption.
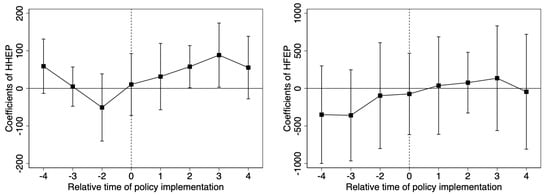
Figure 1.
Event−study estimates.
The above results indicate that digital infrastructure construction positively affects rural household energy consumption, which verifies Hypothesis 1. The possible reasons are as follows: the development of digital infrastructure facilitates the growth of digital finance, which reduces consumers’ cash constraints and encourages increased household energy consumption. Moreover, advancements in digital technology create more employment opportunities, leading to higher incomes for residents and promoting their consumption of high-quality energy.
5.2. Robustness Check
5.2.1. PSM-DID Estimation Results
DID estimates may be biased due to selection biases. By matching treated and control groups based on their propensity scores, PSM helps create comparable groups, addressing potential selection biases [34]. Therefore, we re-estimated the effects using the PSM-DID method. This study included several matching variables: age, age2, marriage, work, number of children and family size, type of house, value of cash and savings accounts, and house assets.
After matching, samples in the treatment and control groups should ideally exhibit comparable characteristics to ensure the validity of the causal inference. Evaluating the quality of matching is crucial for ensuring the reliability and validity of PSM results. The quality of matching depends on the fulfillment of specific conditions. First, the sufficient overlap of propensity scores. Before matching, it is important to ensure that there is adequate overlap in propensity scores between the treatment and control groups. This ensures that there are enough common observations across both groups to facilitate meaningful comparisons. Figure 2a displays the common range of propensity scores. Almost all the observations fell within the common range of propensity scores. Second, the balancing of covariates. After matching, it is essential to assess whether the matching process has effectively balanced covariates between the treatment and control groups. This involves comparing the distributions of covariates between the matched groups to ensure that they are similar and that any differences are not systematic or biased. Figure 2b and Table 5 illustrate the biases of the covariates before and after PSM [4]. After matching, the biases of all covariates are significantly reduced, with absolute standard biases below 5%. Figure 2c,d show the distributions of propensity scores for the control group and treated group before and after matching. After matching, the two groups have similar probability density distributions. The above results indicate that the matching quality is satisfactory.
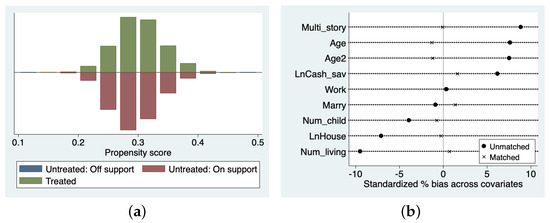
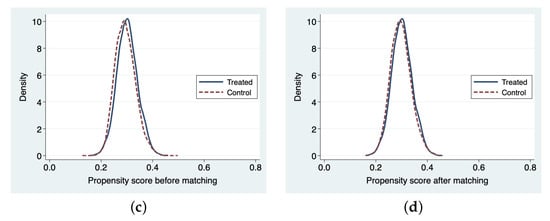
Figure 2.
Matching quality. (a) Common range of propensity scores. (b) Standard bias after matching. (c,d) Distributions of propensity scores before and after matching.
Table 5.
Covariate balancing after nearest-neighbor matching.
Figure 3 shows the estimated values of the dynamic effect coefficients and their 99% confidence intervals. The estimated coefficients for each period before the implementation of the “Broadband China” policy are not significant, implying that the model passes the parallel pre-trend assumption. Table 6 presents the results of the promotion of broadband infrastructure on energy consumption based on PSM-DID method. In column (1), the estimation coefficient of for household heating expenses () is significantly positive at 1% level. In column (2), the coefficient of for household fuel expenses () is significantly positive at 5% level. Both of the results show that the has significantly positive effect on household energy consumption. The promotion of broadband infrastructure significantly contributes to higher household heating and fuel expenses in rural China. The PSM-DID results further validate the conclusions of the baseline regression.
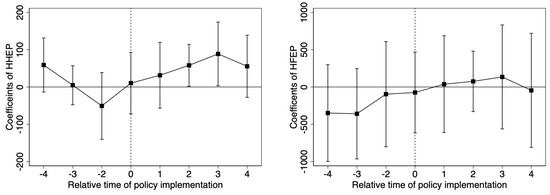
Figure 3.
Event−study estimates after propensity score matching.
Table 6.
PSM-DID estimation results.
5.2.2. Placebo Test: Constructing Randomized Experiments
An additional concern with the identification strategy of the difference-in-differences method is that other unobservable factors that vary over time may have an impact on the estimates, but this cannot usually be controlled in the model. In view of this, by randomly generating a list of experimental groups for the Broadband China pilot and randomly generating reform times, a false multiple difference coefficient estimate was generated. This process was repeated 500 times, and the kernel density distribution of the estimated coefficient is shown in Figure 4.
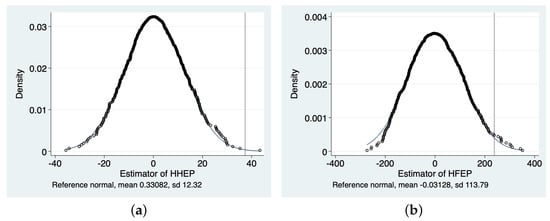
Figure 4.
Placebo test: constructing randomized experiments. (a) Coefficient density distribution of HHEP for the placebo test. (b) Coefficient density distribution of HFEP for the placebo test.
The estimated coefficients for 500 simulations are much smaller than the estimated coefficients for real data, and are concentrated at around 0 with a normal distribution. This indicates that other unobserved factors do not have a significant effect.
5.2.3. Counterfactual Test: Changing the Policy Execution Time
To avoid the possibility that the difference in energy consumption between the treatment and control group is caused by time change, based on the results of the parallel trend test, we advanced the implementation of the Broadband China policy by 4 years, constructed a false policy time represented by , and regressed Equation (1).
Table 7 shows that all the coefficient estimates of are not significant at the 10% level. This indicates that there is no systematic difference in time trends between treatment and control groups, and it further confirms that the Broadband China policy has affected household energy consumption.
Table 7.
Counterfactual test: Changing the policy execution time.
5.2.4. Control Other Policy Interference
In estimating the impact of the Broadband China policy on household energy consumption, there will inevitably be interference from other policies, which makes the estimated effect of the Broadband China policy biased. To identify and address this problem, this study identified an environmental policy implemented during the same period: low-carbon pilot policies () (To promote green and low-carbon development and ensure the achievement of China’s action targets for controlling greenhouse gas emissions, the National Development and Reform Commission (NDRC) conducted three batches of low-carbon city pilots in 2010, 2012, and 2017, respectively. The NDRC launched the first low-carbon pilot program in 2010, and established five provinces (Guangdong, Hubei, Liaoning, Shanxi, and Yunnan) and eight cities (Tianjin, Chongqing, Shenzhen, Xiamen, Hangzhou, Nanchang, Guiyang, and Baoding) as low-carbon pilot cities. In 2012, the NDRC determined 29 cities and provinces including Beijing, Shanghai, and Hainan as the low-carbon pilot cities. In 2017, the scope of the low-carbon pilot in China was expanded again. The NDRC has determined to carry out the third batch of pilot projects in 45 cities, including Wuhai city). Low-carbon pilot policies advocate for the construction of industrial systems and consumption patterns characterized by low carbon emissions, which may affect household energy consumption.
To eliminate the effect of this environmental policy, we set a new policy variable () as a control variable in the benchmark model. is a dummy variable indicating whether city j implemented the low-carbon pilot policies in year t. If the policy was implemented in city j in year t, is 1; otherwise, is 0. The estimation results in Table 8 show that the Broadband China policy still significantly improves household energy consumption. All signs and significance are not significantly different from the benchmark results, indicating that the conclusions are robust and trustworthy.
Table 8.
Control for other policy interference.
6. Does Broadband Development Facilitate Households’ Transition to Clean Energy Consumption?
Globally, about 2.4 billion people still rely on solid fuels as their main source of household energy, and 293 million people in China alone. China needs to make the transition to clean energy as a primary action strategy. This is essential for China to address environmental challenges, enhance energy security, improve public health, fulfill international obligations, and ensure long-term sustainability [35]. Recent literature shows that internet development promotes the development of clean energy, which is an important way to achieve sustainable development [36]. Since the empirical results in the previous sections indicate a close correlation between broadband infrastructure construction and energy consumption, we further investigated whether the implementation of broadband infrastructure facilitates households’ transition to clean energy.
In this section, we introduce two indicators, clean heating fuel choice () and clean cooking fuel choice (), as proxy variables for clean energy consumption. Based on Model 1, we utilized the above two indicators of clean energy consumption as the dependent variables and estimated the influence of broadband development on household clean energy consumption. The results in Table 9 indicate a positive coefficient for , meaning that broadband infrastructure helps to increase the choice of clean fuels for households. However, the estimates are small and only one estimate in Column (1) is statistically significant at the 5% significance level. Therefore, these experiments indicated that the implementation of broadband infrastructure facilitates households’ transition to clean energy consumption, which verifies Hypothesis 2. However, the observed effect is relatively modest. The possible reasons are as follows: first, the construction of digital infrastructure encourages traditional industries to achieve industrial upgrading, promoting energy efficiency and resulting in the reduction of clean energy costs, and, thus, increasing the demand for clean energy. Second, digital transformation accelerates information dissemination, which is beneficial to the increase of residents’ environmental awareness, encouraging residents to choose clean energy.
Table 9.
Impact of broadband development on household clean energy consumption.
7. Further Analysis
7.1. Heterogeneity Analysis
To further explore the differential impact of the “Broadband China” policy on rural households’ energy consumption, we conducted heterogeneity analyses across household characteristics in this section.
7.1.1. Heterogeneity in Human Capital
Based on the education of the household head, the data were divided into a low human capital group (education levels are below primary school) and a high human capital group (education levels are primary school or above).
Table 10 reports the human capital heterogeneity in the impact of the “Broadband China” policy on household energy consumption. Columns (1) to (4) show the regression results of households with low human capital, and columns (5) to (8) show the results of high human capital. None of the estimation coefficients of columns (1) to (4) are significant at the 10% level. In column (5), the coefficient is significantly positive at the 1% level, and the coefficients in columns (6) and (7) are significantly positive at the 5% level. The results in Table 10 show that the policy significantly increases household energy expenses and clean energy choices in households with high human capitals, while its impact on rural households with low human capital is not significant.
Table 10.
Heterogeneity in human capital.
The development of the internet makes it easy to access various online learning resources, thereby enhancing the level of household knowledge [8], which encourages households to access and use modern energy equipment and improve energy consumption, especially households with literacy skills. Before the development of broadband, rural households may have limited access to information about energy-saving practices and clean energy options. The promotion of broadband infrastructure provides the households, especially those with a higher education level, with improved access to online resources, educational materials, and market information, empowering them to make more informed decisions and adopt cleaner energy choices. Therefore, the “Broadband China” policy has a more positive impact on households with high human capital.
7.1.2. Heterogeneity in Household Income Level
As shown in Table 3, there is a significant gap between different groups in terms of household assets. Referring to [37], rural households were divided into the poverty group (per capita income below 2300 RMB per year) and the non-poverty group (per capita income above 2300 RMB per year).
The results are shown in Table 11. Columns (1) to (4) show the regression results of rural households in poverty. And columns (5) to (8) show the results of households in non-poverty. All of the coefficients in poverty are not significant, while the coefficients in columns (5) and (8) are significantly positive at the 5% level, showing that the “Broadband China” policy increases household heating expenses in non-poverty households and is more likely to encourage non-poverty households to use clean cooking fuel, but has no significant effect on poverty households. Non-poverty households may have higher disposable incomes, allowing them to invest in energy-efficient heating systems and cleaner cooking fuel options. The “Broadband China” policy may encourage these households to adopt cleaner and more expensive energy alternatives, leading to increased heating expenses and a greater uptake of clean cooking fuels. In contrast, households in poverty may have limited financial resources to afford such investments, resulting in a negligible effect of the policy on their energy consumption patterns.
Table 11.
Heterogeneity in household income level.
7.1.3. Heterogeneity in Family Size
Each extra person living in a house contributed to an increase in household energy consumption by 219,811 kWh/year [38]. To investigate the difference in household energy consumption between households of different sizes, rural households were divided into small-size households (with family sizes less than or equal to 3) and large-size households (with family sizes greater than 3).
The results are shown in Table 12. Columns (1) to (4) show the regression results of small-size families, and columns (5) to (8) show the results of large-size families. All of the coefficients in small-size families are not significant, while the coefficients are significantly positive at the 5% level in columns (5) and (7), showing that the “Broadband China” policy significantly increases heating expenses of large-size households and is more likely to encourage those households to use clean heating fuel, but the effects on small-size households are insignificant. Large-size households typically have higher heating demands due to their larger living spaces and higher occupancy. As a result, they may benefit more from broadband-enabled technologies for heating control and efficiency improvements, leading to increased heating expenses. Additionally, large households may find it more cost-effective to invest in cleaner heating fuel options, such as natural gas or electric heating systems, compared to smaller households.
Table 12.
Heterogeneity in family size.
7.1.4. Heterogeneity in Housing Type
The “Broadband China” policy may have heterogeneous effects on rural household energy usage based on housing type. Therefore, we split the sample into two groups based on the housing type (one-story and multi-story) and conducted a heterogeneity analysis.
The results are shown in Table 13. Columns (1) to (4) show the regression results of households with the one-story housing type, and columns (5) to (8) show the results of households with the multi-story housing type. In columns (1) to (4), none of the coefficients are significantly positive, while all of the coefficients in columns (5) to (8) are significantly positive at least at the 10% level, showing that the broadband mainly affects the energy consumption and clean energy choices of households living in multi-story buildings, but has little significant impact on the energy consumption of households living in bungalows, and even has a negative impact on clean heating fuel choices () for households living in bungalows.
Table 13.
Heterogeneity in housing type.
Compared with households living in bungalows, households living in multi-story buildings are more likely to use broadband technology for energy management, such as smart home systems and energy-saving appliances. These technologies can lead to more significant growth in energy expenditure and promote the adoption of clean energy.
7.2. Mechanism Analysis
7.2.1. Green Innovation Enhancement Channel
The construction of digital infrastructure not only promotes the development of digital finance and reduces corporate financial constraints [39], thus promoting R&D investments, but also facilitates researchers’ access to a wealth of environmental data and scholarly resources online to explore green innovations [40]. Green technological innovation is widely used in the production of enterprises and the lives of residents, and can promote the clean production of enterprises, enhance green energy consumption, and reduce resource consumption. This has also spawned new energy consumption patterns and reduced carbon emissions [41]. Moreover, green technological innovation can also accelerate the development of renewable energy, promote the development of new energy, and facilitate the transition of the energy consumption structure to green, low-carbon, and clean energy [42].
To verify the green innovation enhancement effect, we applied the number of green patents granted in a city (data source: China National Intellectual Property Administration) as the dependent variable. Column (1) of Table 14 shows that the estimation coefficient is significantly positive at the 1% level, indicating that the Broadband China policy enhances regional green innovation, which changes rural household energy consumption behaviors.
Table 14.
Mechanism analysis.
7.2.2. Energy Efficiency Enhancement Channel
The development of digital infrastructure is beneficial for enterprises to grasp customers’ demand and the feedback [31]. Moreover, the construction of network facilities promotes the development of the digitalization of production, intelligent management modes, and intensive utilization of traditional industry, thus improving energy efficiency [43]. Improvements in energy efficiency help to reduce energy costs, which, in turn, brings about changes in energy demand and household energy consumption decisions.
To verify the energy efficiency channel, we applied city-level energy efficiency, which is calculated as GDP per unit of energy consumption, as the dependent variable. Column (2) of Table 14 shows that the estimation coefficient of is significantly positive at the 5% level, indicating that the construction of digital infrastructure promotes energy efficiency, which reduces costs and increases the energy demand.
7.2.3. Environmental Awareness Enhancement Channel
Studies have shown that information technology construction makes it easier for individuals to access resources related to sustainable development, environmental conservation, and information about environmental health risks, thus increasing residents’ awareness of environmental pollution and level of risk perception [44], increasing willingness to purchase green products [32], and choose clean and renewable energy sources.
To verify the existence of the environmental awareness channel, we used public environmental concern in the city as the proxy variable, measured by the daily average search volume for “environmental pollution” and “haze” on Baidu. The estimates in Column (3) of Table 14 indicate that the promotion of broadband infrastructure increases public search about “environmental pollution” and “haze”, suggesting a positive effect on environmental awareness.
In sum, the above mechanisms collectively contribute to promoting environmental upgrading, increasing energy efficiency, and enhancing overall environmental awareness, thereby changing household energy consumption patterns and clean fuel choices.
8. Conclusions and Policy Implications
In this study, we investigated the impact of broadband infrastructure on household energy consumption and clean fuel choices using data from the China Health and Retirement Longitudinal Study (CHARLS). Our analysis, employing a difference-in-differences framework, revealed several key findings. First, the promotion of broadband infrastructure significantly increases rural household energy consumption, and this finding remains robust across several robustness checks. Second, the promotion of broadband infrastructure encourages households to choose clean energy. Third, large-size households living in multi-story buildings, particularly those with higher levels of education and income, tend to benefit more from enhanced broadband internet access. Finally, mechanism analysis further indicates that the “Broadband China” policy can positively influence household consumption through channels such as fostering technological innovation, enhancing energy efficiency in cities, and improving overall environmental awareness. These findings indicate that the construction of digital infrastructure benefits the energy transition to clean energy with high energy efficiency, which contribute to our understanding of the role of broadband infrastructure in shaping household energy consumption patterns and have important implications for policymakers, particularly in the context of sustainable development and energy transition efforts.
Our results have several crucial policy implications for policymakers aiming to promote sustainable development and address energy challenges. First, governments should prioritize investments in rural broadband infrastructure. Expanding broadband networks to these underdeveloped areas can help bridge the digital divide and unlock economic opportunities that may have previously been inaccessible. This investment not only facilitates the transition to cleaner resources and increases energy consumption for rural households but also stimulates economic growth, thus contributing to broader development objectives. Given the differential benefits observed among households with varying socioeconomic statuses, policymakers should implement targeted support measures to ensure that disadvantaged groups can also access and benefit from broadband infrastructure. This may involve providing subsidies for low-income households to access broadband services and offering digital literacy programs to enhance their ability to utilize online resources effectively. Moreover, this study emphasizes the role of broadband infrastructure in facilitating a transition towards cleaner energy sources. Policymakers should promote renewable energy and encourage households to switch to cleaner fuel options. This could involve implementing subsidies, tax incentives, and regulatory mechanisms to make clean energy more attractive and accessible to consumers.
Author Contributions
Conceptualization, Z.H. and X.W.; methodology, Z.H.; software, Y.Z.; validation, Y.Z.; formal analysis, Z.H. and X.W.; data curation, Y.Z.; writing—original draft preparation, Y.Z.; writing—review and editing, Z.H. and X.W.; visualization, Z.H.; supervision, Z.H.; funding acquisition, Z.H. and X.W. All authors have read and agreed to the published version of the manuscript.
Funding
This research is supported by National Natural Science Foundation of China (No. 72003011), Humanities and Social Science Fund of Ministry of Education of China (No. 23YJC790143), and R&D Program of Beijing Municipal Education Commission (No. SM202210005009).
Institutional Review Board Statement
Not applicable.
Informed Consent Statement
Not applicable.
Data Availability Statement
The data used to support the findings of this study can be made available by the corresponding author upon request.
Conflicts of Interest
The authors declare no conflicts of interest.
References
- Kim, T.Y.; Cho, S.B. Predicting residential energy consumption using CNN-LSTM neural networks. Energy 2019, 182, 72–81. [Google Scholar] [CrossRef]
- Jiang, L.; Yu, L.; Xue, B.; Chen, X.; Mi, Z. Who is energy poor? Evidence from the least developed regions in China. Energy Policy 2020, 137, 111122. [Google Scholar] [CrossRef]
- Che, X.; Zhu, B.; Wang, P. Assessing global energy poverty: An integrated approach. Energy Policy 2021, 149, 112099. [Google Scholar] [CrossRef]
- Wang, X.; Bian, Y.; Zhang, Q. The effect of cooking fuel choice on the elderly’s well-being: Evidence from two non-parametric methods. Energy Econ. 2023, 125, 106826. [Google Scholar] [CrossRef]
- Asongu, S.A.; Anyanwu, J.C.; Tchamyou, V.S. Technology-driven information sharing and conditional financial development in Africa. Inf. Technol. Dev. 2019, 25, 630–659. [Google Scholar] [CrossRef]
- Yan, H.; Yi, X.; Jiang, J.; Bai, C. Can information technology construction alleviate household energy poverty? Empirical evidence from the “broadband China” Pilot Policy. Energy Policy 2024, 185, 113966. [Google Scholar] [CrossRef]
- Zhang, C.; Weng, X.; Guo, Y. Digital infrastructure construction and household energy efficiency: Based on a quasi-natural experiment in China. Sci. Total Environ. 2024, 911, 168544. [Google Scholar] [CrossRef]
- Zhang, S.H.; Yang, J.; Feng, C. Can internet development alleviate energy poverty? Evidence from China. Energy Policy 2023, 173, 113407. [Google Scholar] [CrossRef]
- Liu, K. Insuring against health shocks: Health insurance and household choices. J. Health Econ. 2016, 46, 16–32. [Google Scholar] [CrossRef]
- Elavarasan, R.M.; Nadarajah, M.; Pugazhendhi, R.; Sinha, A.; Gangatharan, S.; Chiaramonti, D.; Abou Houran, M. The untold subtlety of energy consumption and its influence on policy drive towards Sustainable Development Goal 7. Appl. Energy 2023, 334, 120698. [Google Scholar] [CrossRef]
- Zhe, L.; Yüksel, S.; Dincer, H.; Mukhtarov, S.; Azizov, M. The positive influences of renewable energy consumption on financial development and economic growth. Sage Open 2021, 11, 21582440211040133. [Google Scholar] [CrossRef]
- He, K.; Mi, Z.; Zhang, J.; Li, J.; Coffman, D. The polarizing trend of regional CO2 emissions in China and its implications. Environ. Sci. Technol. 2023, 57, 4406–4414. [Google Scholar] [CrossRef]
- Lin, B.; Wang, Y. Does energy poverty really exist in China? From the perspective of residential electricity consumption. Energy Policy 2020, 143, 111557. [Google Scholar] [CrossRef]
- Chen, C.f.; Xu, X.; Adua, L.; Briggs, M.; Nelson, H. Exploring the factors that influence energy use intensity across low-, middle-, and high-income households in the United States. Energy Policy 2022, 168, 113071. [Google Scholar] [CrossRef]
- Ali, M. Urbanisation and energy consumption in Sub-Saharan Africa. Electr. J. 2021, 34, 107045. [Google Scholar] [CrossRef]
- Li, X.; Zhang, D.; Zhang, T.; Ji, Q.; Lucey, B. Awareness, energy consumption and pro-environmental choices of Chinese households. J. Clean. Prod. 2021, 279, 123734. [Google Scholar] [CrossRef]
- Kurniawan, R.; Sugiawan, Y.; Managi, S. Cleaner energy conversion and household emission decomposition analysis in Indonesia. J. Clean. Prod. 2018, 201, 334–342. [Google Scholar] [CrossRef]
- Surahman, U.; Hartono, D.; Setyowati, E.; Jurizat, A. Investigation on household energy consumption of urban residential buildings in major cities of Indonesia during COVID-19 pandemic. Energy Build. 2022, 261, 111956. [Google Scholar] [CrossRef]
- Modigliani, F. Utility Analysis and the Consumption Function: An Interpretation of Cross-Section Data; Allen & Unwin: London, UK, 1954. [Google Scholar]
- Siaw, A.; Jiang, Y.; Twumasi, M.A.; Agbenyo, W. The impact of internet use on income: The case of rural Ghana. Sustainability 2020, 12, 3255. [Google Scholar] [CrossRef]
- Deaton, A. Saving and Liquidity Constraints; National Bureau of Economic Research: Cambridge, MA, USA, 1989. [Google Scholar]
- Li, J.; Wu, Y.; Xiao, J.J. The impact of digital finance on household consumption: Evidence from China. Econ. Model. 2020, 86, 317–326. [Google Scholar] [CrossRef]
- Wu, H.; Xue, Y.; Hao, Y.; Ren, S. How does internet development affect energy-saving and emission reduction? Evidence from China. Energy Econ. 2021, 103, 105577. [Google Scholar] [CrossRef]
- Qin, P.; Liu, M.; Su, L.; Fei, Y.; Tan-Soo, J.S. Electricity consumption in the digital era: Micro evidence from Chinese households. Resour. Conserv. Recycl. 2022, 182, 106297. [Google Scholar] [CrossRef]
- Hosier, R.H.; Dowd, J. Household fuel choice in Zimbabwe: An empirical test of the energy ladder hypothesis. Resour. Energy 1987, 9, 347–361. [Google Scholar] [CrossRef]
- He, J.; Qing, C.; Guo, S.; Zhou, W.; Deng, X.; Xu, D. Promoting rural households’ energy use for cooking: Using Internet. Technol. Forecast. Soc. Chang. 2022, 184, 121971. [Google Scholar] [CrossRef]
- Yan, J.; Li, J.; Li, X.; Liu, Y. Digital transition and the clean renewable energy adoption in rural family: Evidence from Broadband China. Front. Ecol. Evol. 2023, 11, 1241410. [Google Scholar] [CrossRef]
- Hong, J.; Shi, F.; Zheng, Y. Does network infrastructure construction reduce energy intensity? Based on the “Broadband China” strategy. Technol. Forecast. Soc. Change 2023, 190, 122437. [Google Scholar] [CrossRef]
- Xue, Y.; Tang, C.; Wu, H.; Liu, J.; Hao, Y. The emerging driving force of energy consumption in China: Does digital economy development matter? Energy Policy 2022, 165, 112997. [Google Scholar] [CrossRef]
- Lv, Z.; Li, X.; Wang, W.; Zhang, B.; Hu, J.; Feng, S. Government affairs service platform for smart city. Future Gener. Comput. Syst. 2018, 81, 443–451. [Google Scholar] [CrossRef]
- Peng, Y.; Tao, C. Can digital transformation promote enterprise performance?—From the perspective of public policy and innovation. J. Innov. Knowl. 2022, 7, 100198. [Google Scholar] [CrossRef]
- Yadav, R.; Pathak, G.S. Young consumers’ intention towards buying green products in a developing nation: Extending the theory of planned behavior. J. Clean. Prod. 2016, 135, 732–739. [Google Scholar] [CrossRef]
- Jacobson, L.S.; LaLonde, R.J.; Sullivan, D.G. Earnings Losses of Displaced Workers. Am. Econ. Rev. 1993, 83, 685–709. [Google Scholar]
- Ghimire, A.; Ali, S.; Long, X.; Chen, L.; Sun, J. Effect of Digital Silk Road and innovation heterogeneity on digital economy growth across 29 countries: New evidence from PSM-DID. Technol. Forecast. Soc. Change 2024, 198, 122987. [Google Scholar] [CrossRef]
- Tiwari, S.; Mohammed, K.S.; Guesmi, K. A way forward to end energy poverty in China: Role of carbon-cutting targets and net-zero commitments. Energy Policy 2023, 180, 113677. [Google Scholar] [CrossRef]
- Mishra, R.; Naik, B.K.R.; Raut, R.D.; Kumar, M. Internet of Things (IoT) adoption challenges in renewable energy: A case study from a developing economy. J. Clean. Prod. 2022, 371, 133595. [Google Scholar] [CrossRef]
- Luan, B.; Zou, H.; Huang, J. Digital divide and household energy poverty in China. Energy Econ. 2023, 119, 106543. [Google Scholar] [CrossRef]
- Tso, G.K.; Guan, J. A multilevel regression approach to understand effects of environment indicators and household features on residential energy consumption. Energy 2014, 66, 722–731. [Google Scholar] [CrossRef]
- Tang, M.; Liu, Y.; Hu, F.; Wu, B. Effect of digital transformation on enterprises’ green innovation: Empirical evidence from listed companies in China. Energy Econ. 2023, 128, 107135. [Google Scholar] [CrossRef]
- Tang, C.; Xu, Y.; Hao, Y.; Wu, H.; Xue, Y. What is the role of telecommunications infrastructure construction in green technology innovation? A firm-level analysis for China. Energy Econ. 2021, 103, 105576. [Google Scholar] [CrossRef]
- Peng, H.R.; Ling, K.; Zhang, Y.J. The carbon emission reduction effect of digital infrastructure development: Evidence from the broadband China policy. J. Clean. Prod. 2024, 434, 140060. [Google Scholar] [CrossRef]
- Li, J.; Zhang, X.; Ali, S.; Khan, Z. Eco-innovation and energy productivity: New determinants of renewable energy consumption. J. Environ. Manag. 2020, 271, 111028. [Google Scholar] [CrossRef]
- Jia, X.; Xie, B.; Wang, X. The impact of network infrastructure on enterprise digital transformation—A quasi-natural experiment from the “Broadband China” Strategy. Appl. Econ. 2024, 56, 1363–1380. [Google Scholar] [CrossRef]
- Tu, M.; Zhang, B.; Xu, J.; Lu, F. Mass media, information and demand for environmental quality: Evidence from the “Under the Dome”. J. Dev. Econ. 2020, 143, 102402. [Google Scholar] [CrossRef]
Disclaimer/Publisher’s Note: The statements, opinions and data contained in all publications are solely those of the individual author(s) and contributor(s) and not of MDPI and/or the editor(s). MDPI and/or the editor(s) disclaim responsibility for any injury to people or property resulting from any ideas, methods, instructions or products referred to in the content. |
© 2024 by the authors. Licensee MDPI, Basel, Switzerland. This article is an open access article distributed under the terms and conditions of the Creative Commons Attribution (CC BY) license (https://creativecommons.org/licenses/by/4.0/).