
A Multivariate Model and Correlation Study on the Impact of Typical Residential Spatial Forms in the Middle Reaches of the Hanjiang River on the Thermal Environment and Thermal Comfort

Abstract
1. Introduction
2. Materials and Methods
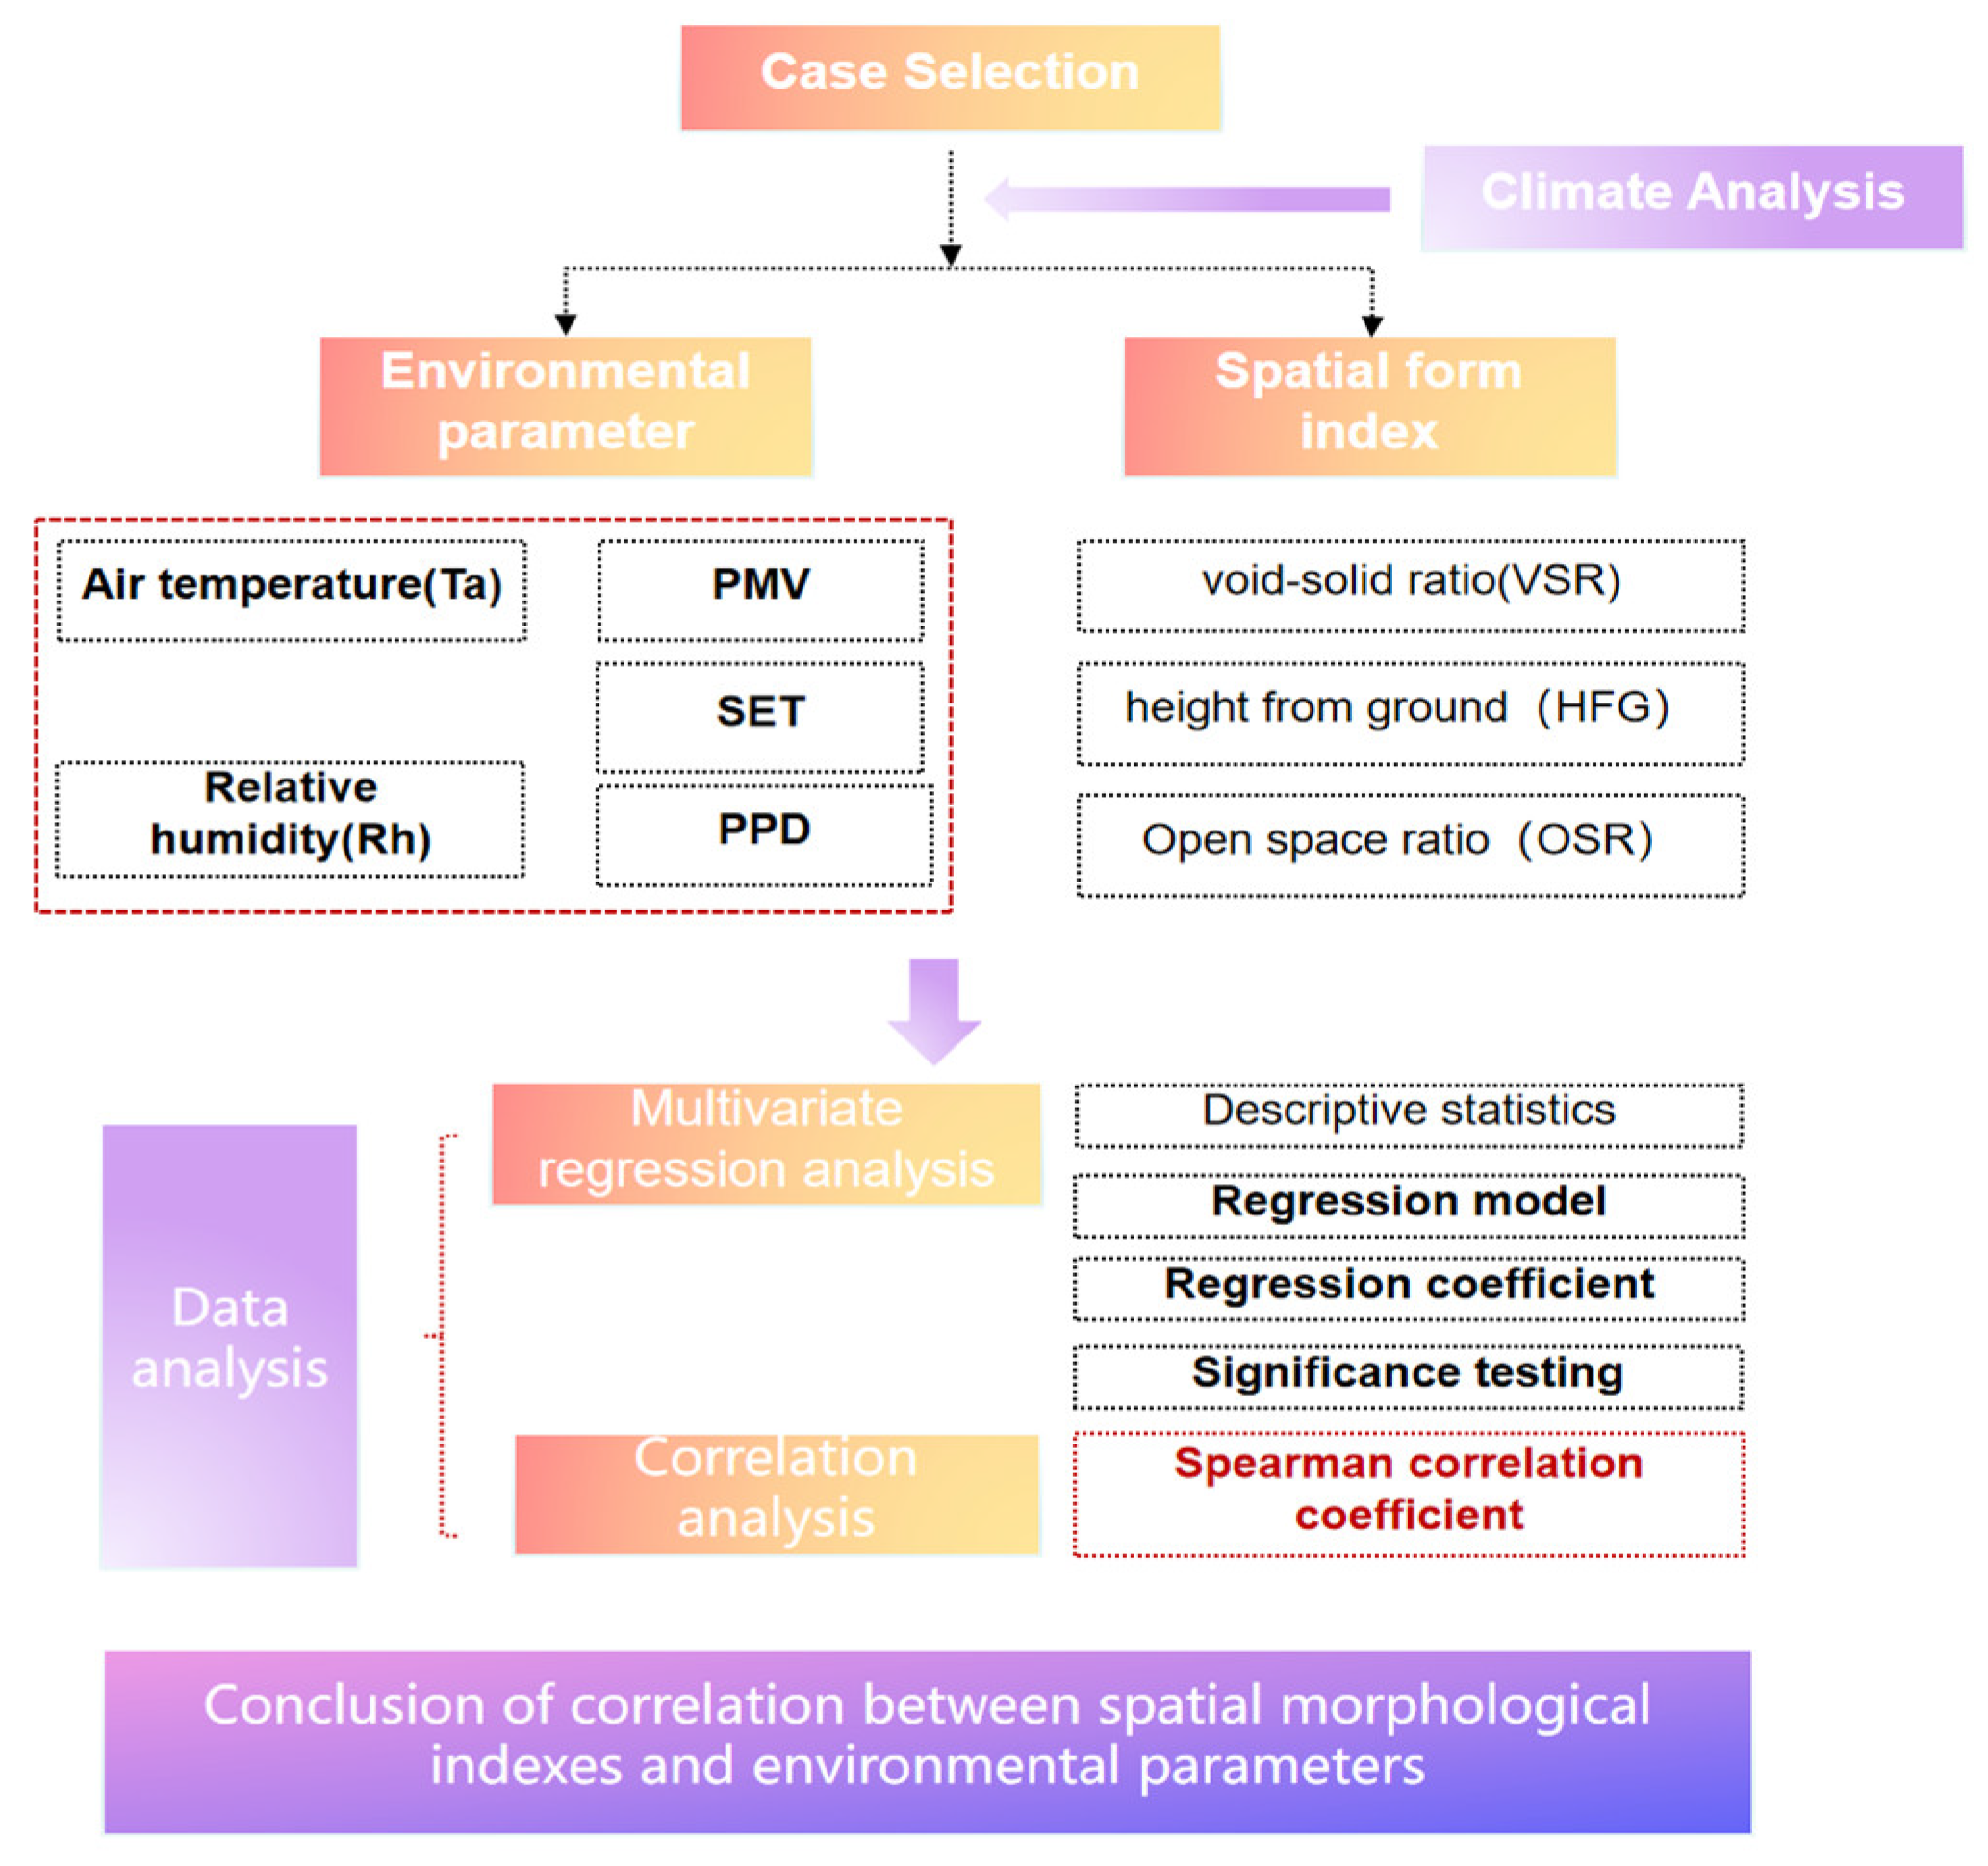
2.1. Research Methods
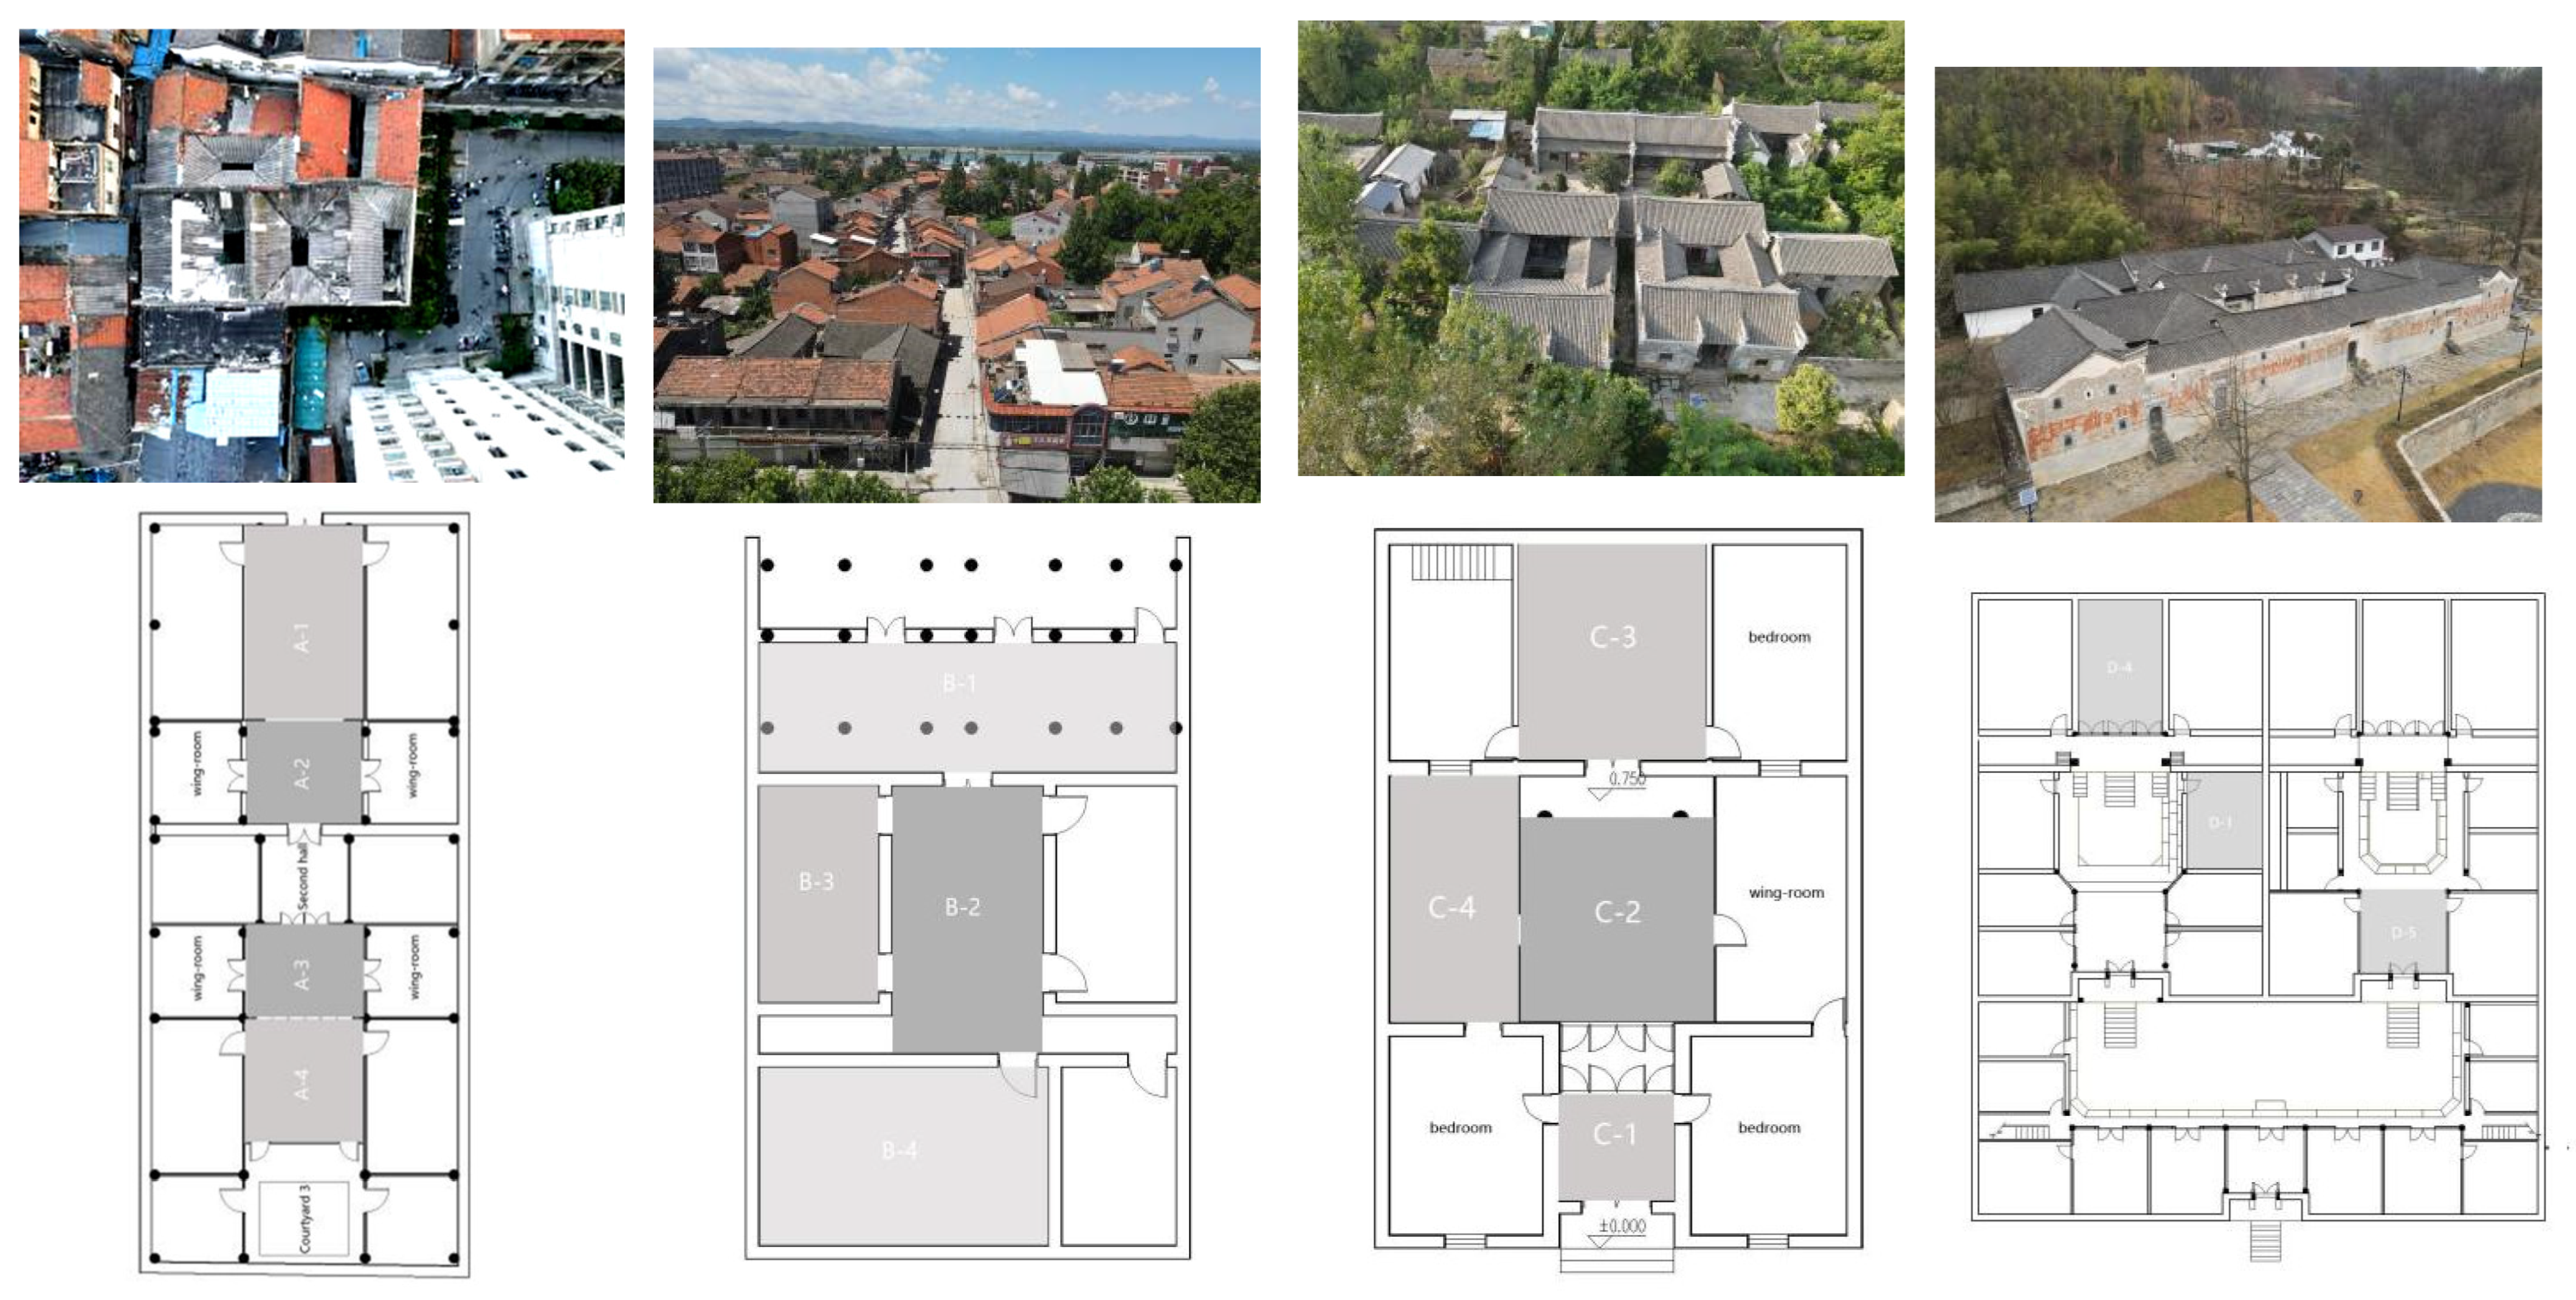
2.2. Regional Climate and Sample Characteristics
2.3. Spatial Form Index
2.4. Thermal Environment Parameters and Thermal Comfort Indexes
2.5. Test Instruments
3. Results
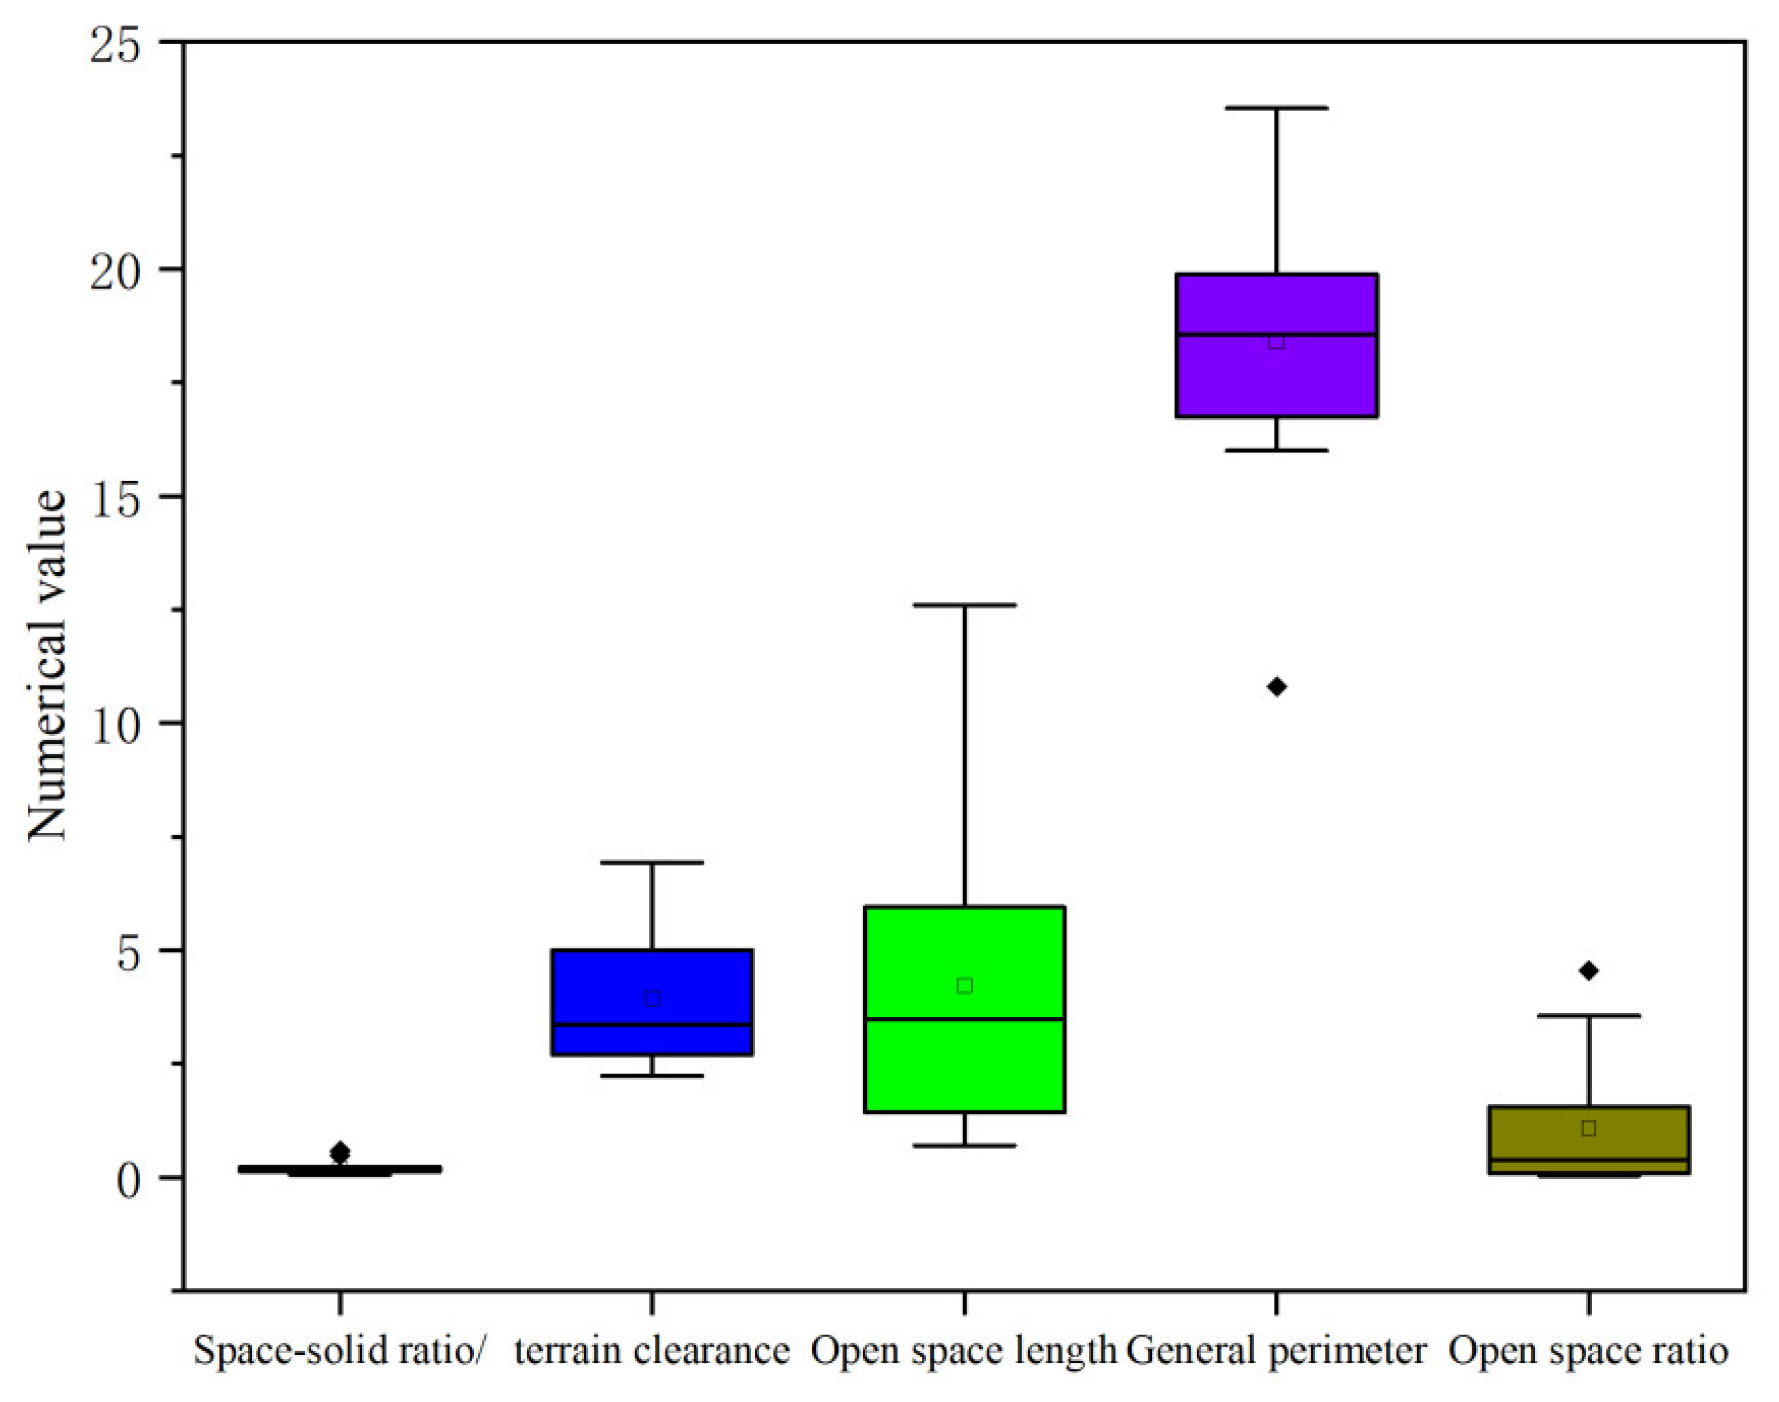
3.1. Spatial Form Index Distribution Characteristics of Residential Buildings
3.2. Influence of Spatial Form Index on Indoor and Outdoor Thermal Environment
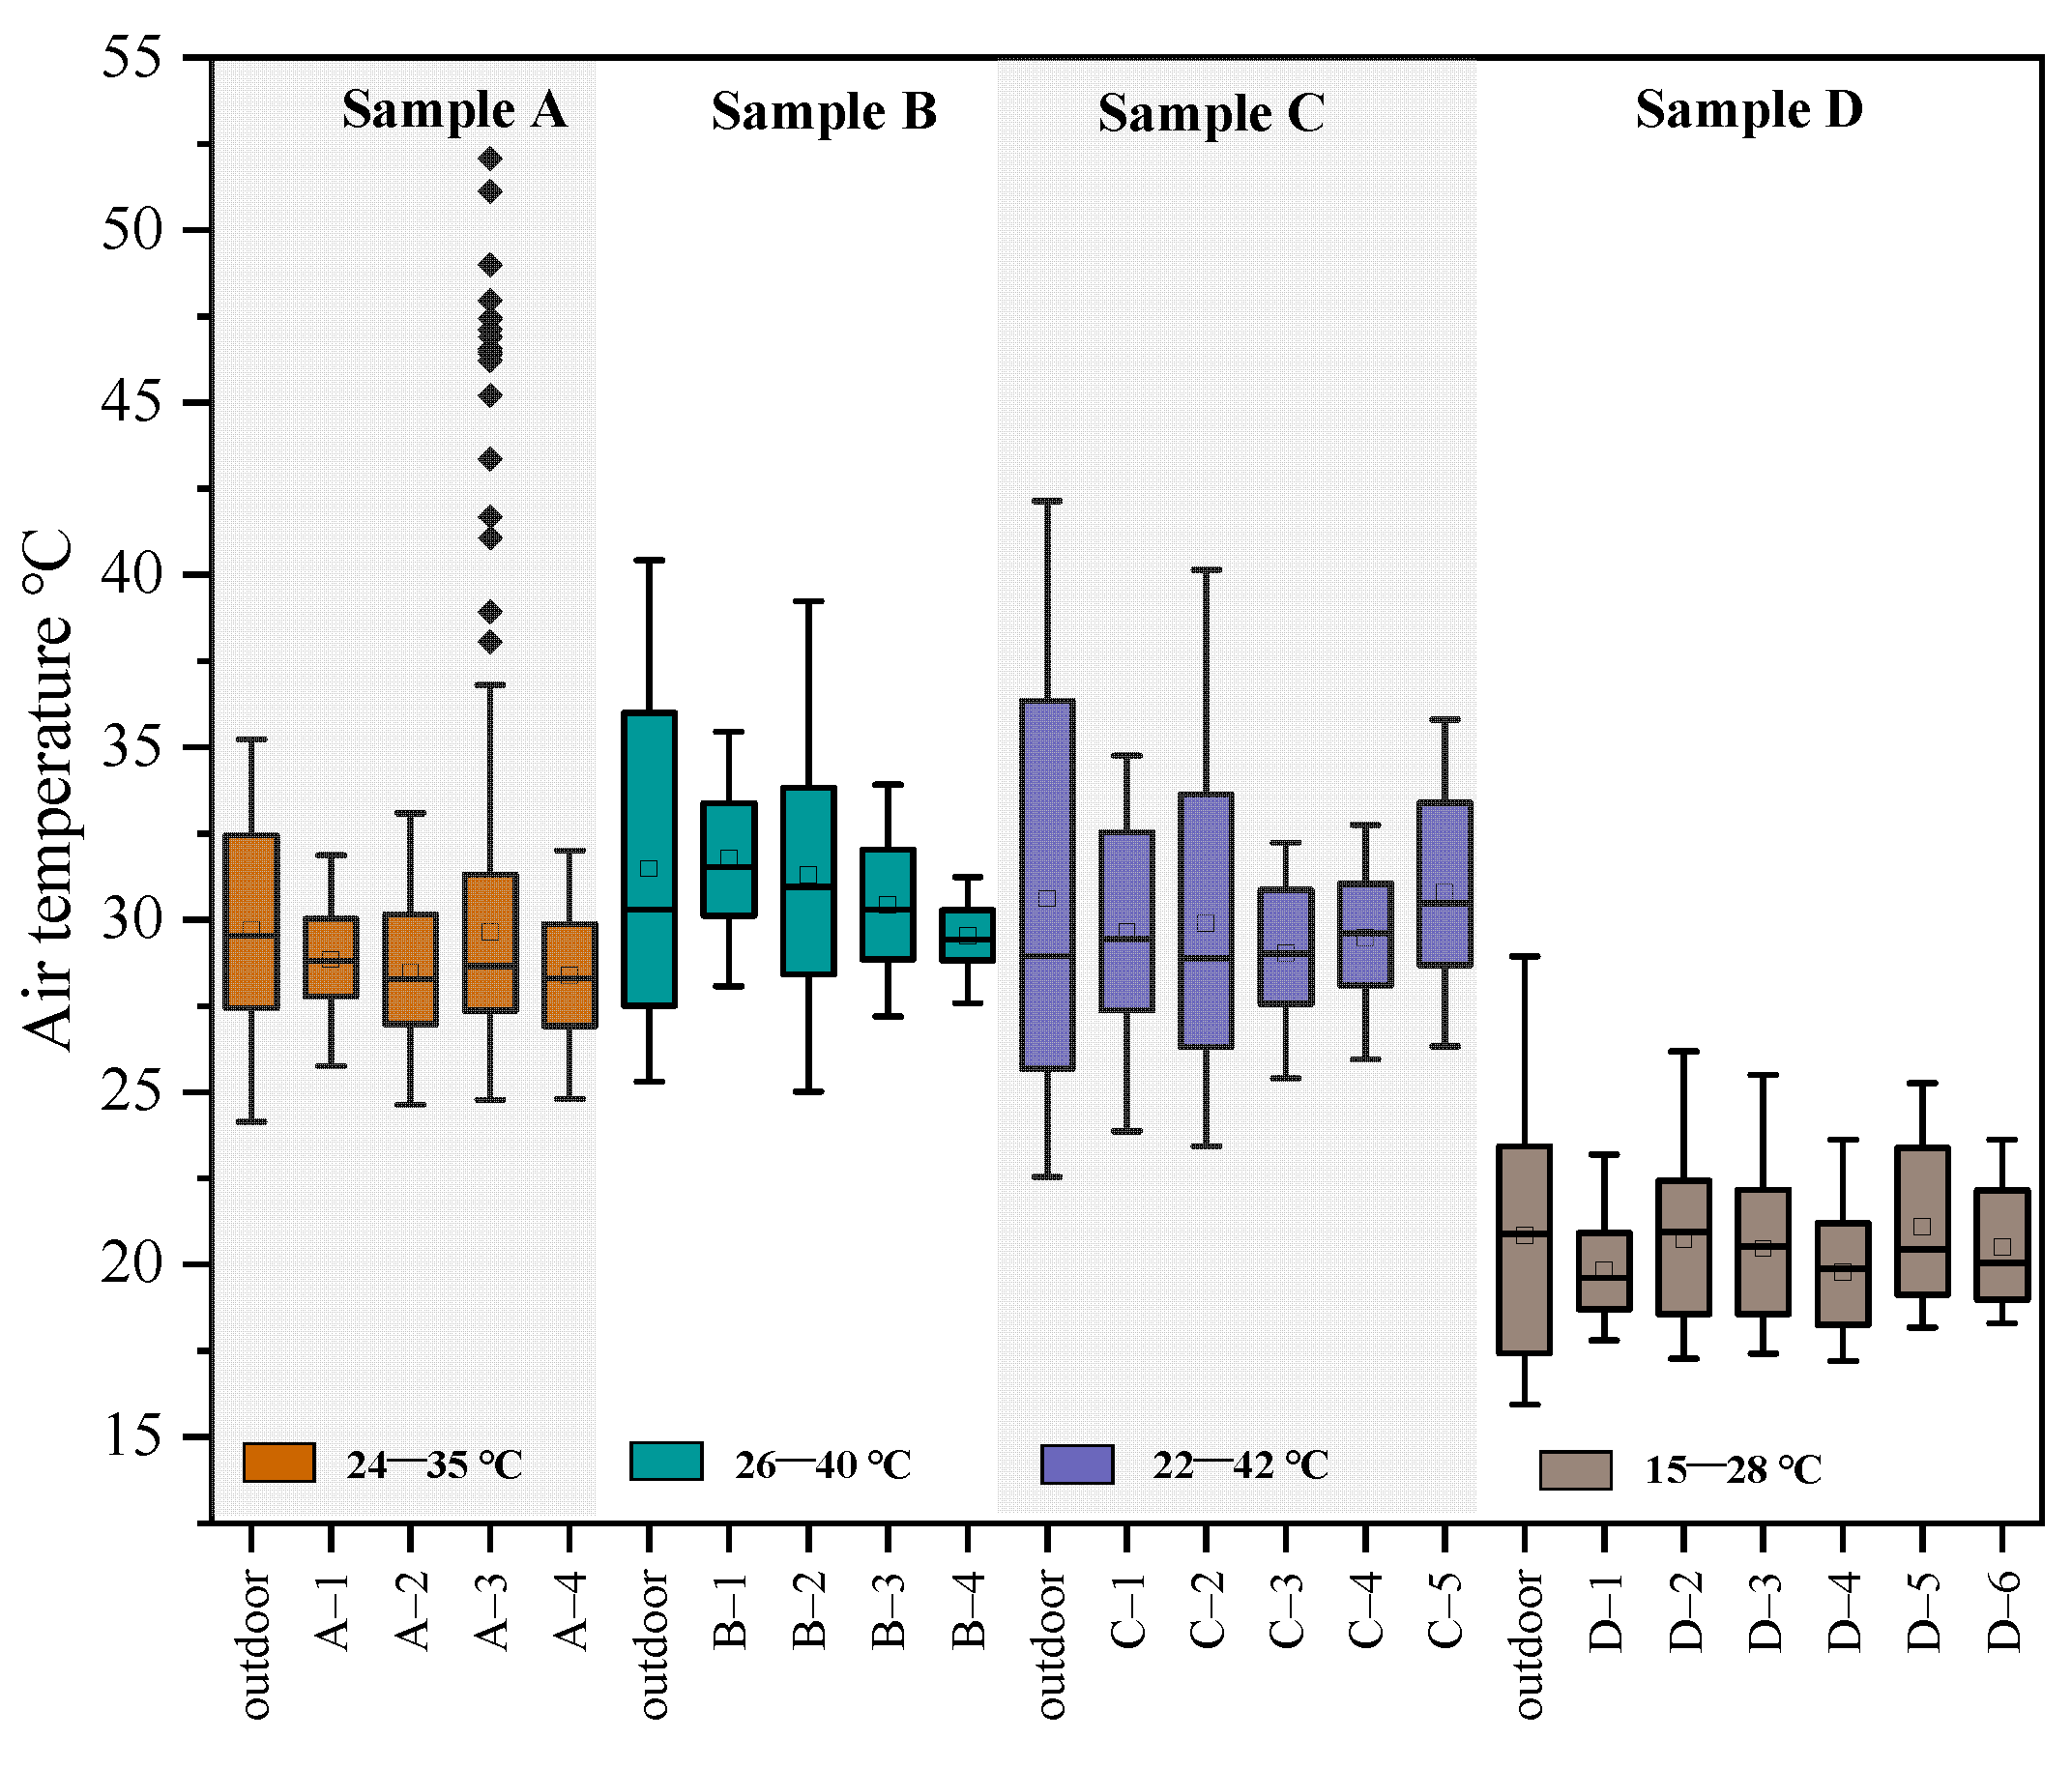
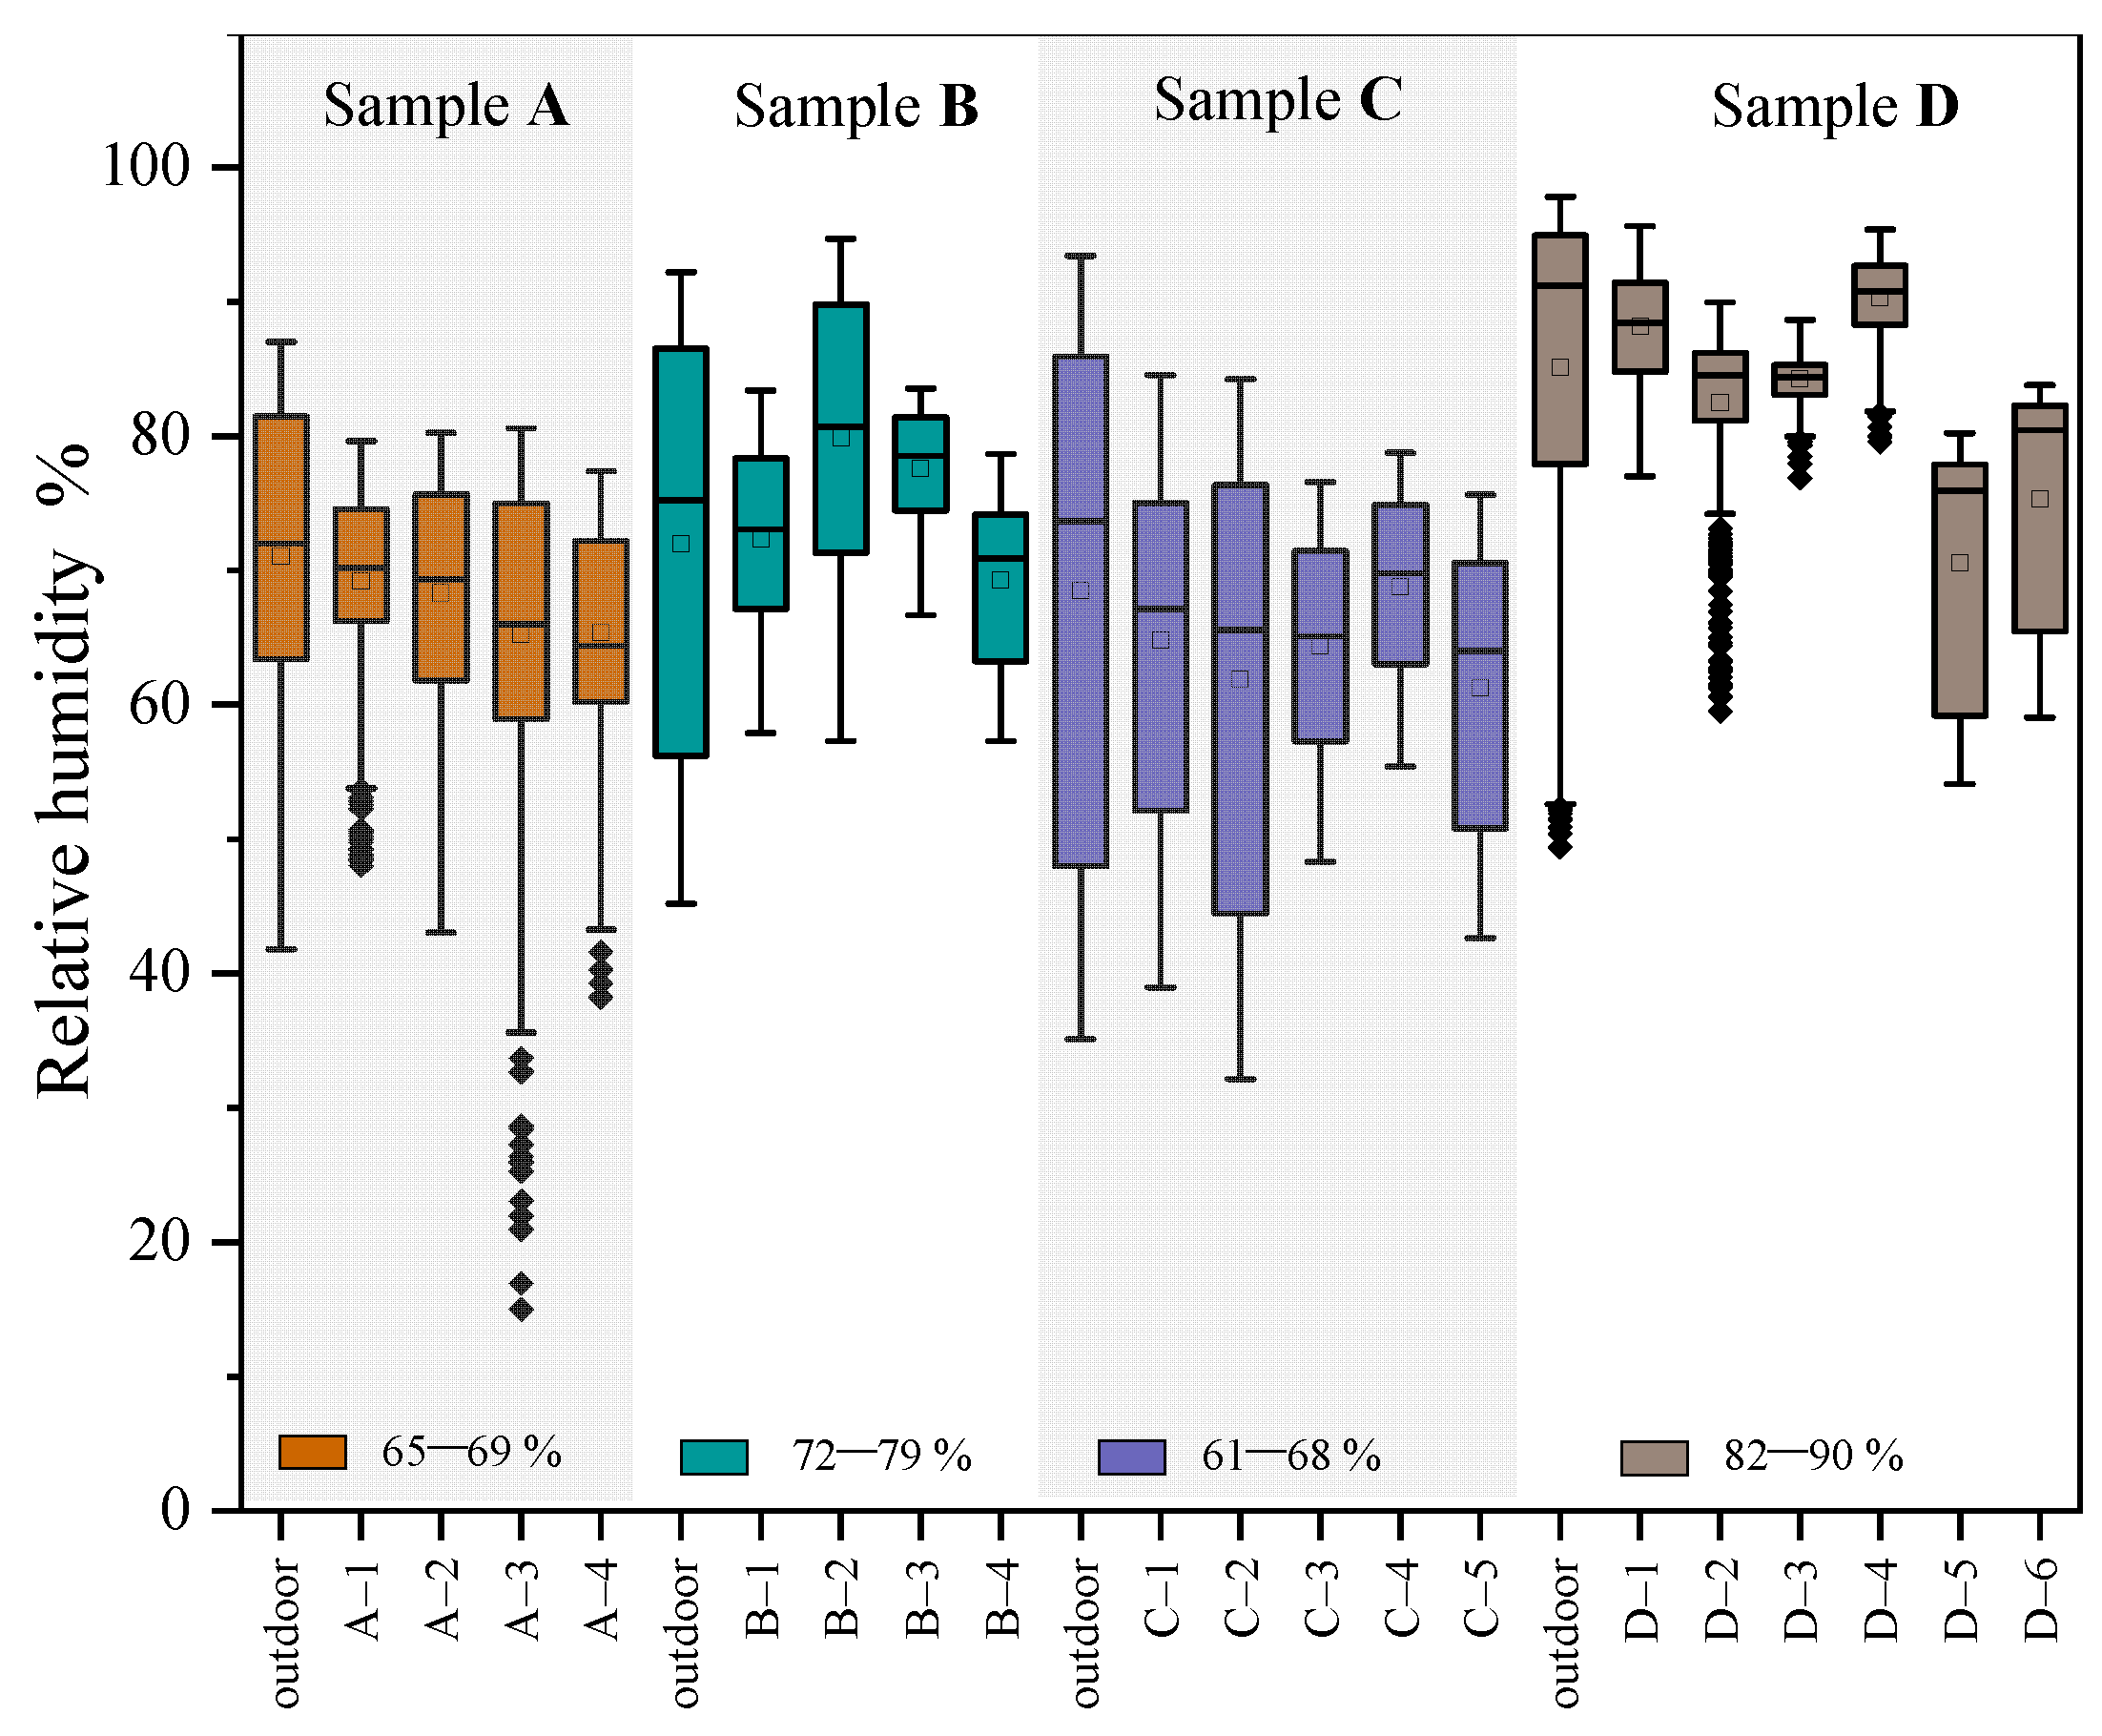
3.2.1. Measured Thermal Environment on Site
3.2.2. Multiple Regression Model
3.2.3. Correlation Analysis
3.3. Influence of Spatial Form Index on Indoor Thermal Comfort Evaluation Index
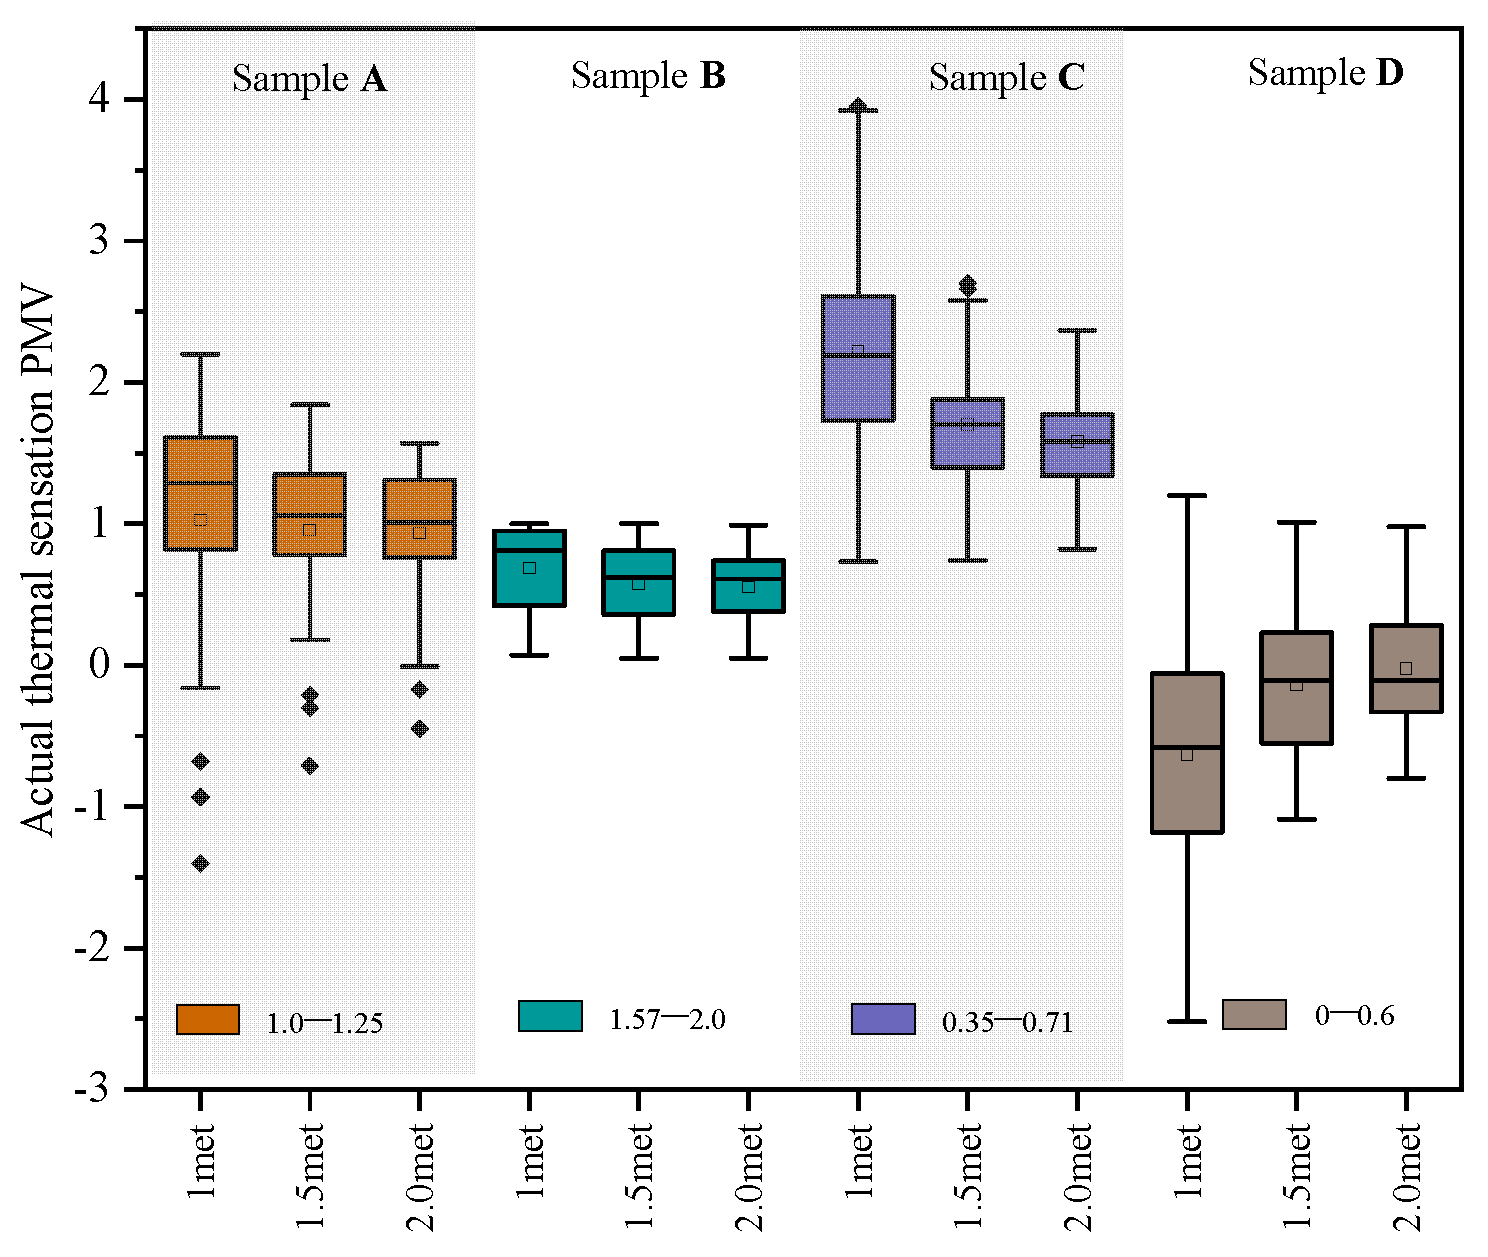
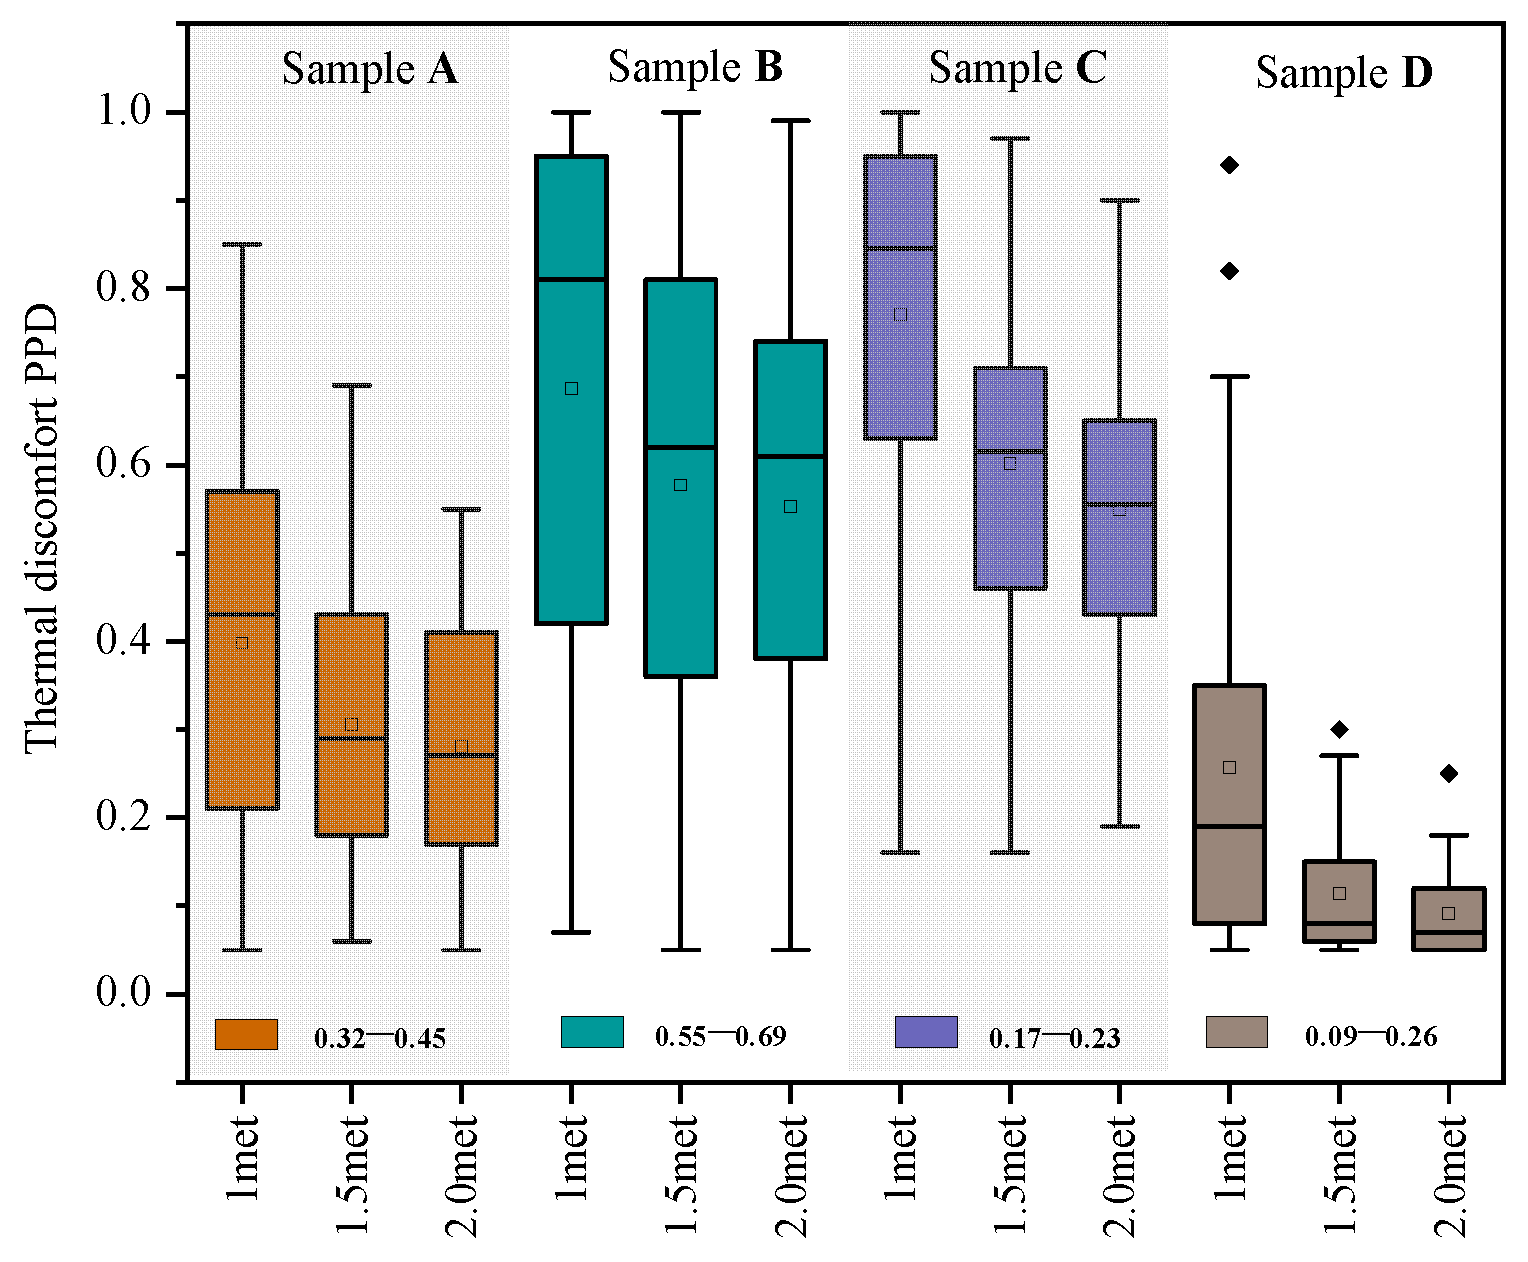
3.3.1. Results of Questionnaire Survey
3.3.2. Multiple Regression Model
3.3.3. Correlation Analysis
4. Conclusions
- We quantified the range value of the key spatial form index and the variation interval of thermal environment and thermal comfort through field measurement of typical residential buildings and questionnaire users, in which the virtual-real ratio was 5–58%; the HFG was 2.23–6.92 m; and the OSR was 0.04–4.55.
- We established regression models for the three spatial form indexes, thermal environment parameters, and thermal comfort indexes. Among them, the explanatory power of the spatial form index to indoor air temperature was 57.5%, with strong correlation (R2 = 0.675). The explanatory power for humidity was 38.2%, with weak correlation (R2 = 0.525). The explanatory power of SET was 30.6–50.1%, with weak correlation (R2 = 0.466). The explanatory power of PMV ranged from 6.5% to 31.7%, and PMV1.0 was weakly correlated (R2 = 0.474). The explanatory power for PPD was 15.5%, where PPD1.0 was close to a weak correlation (R2 = 0.508).
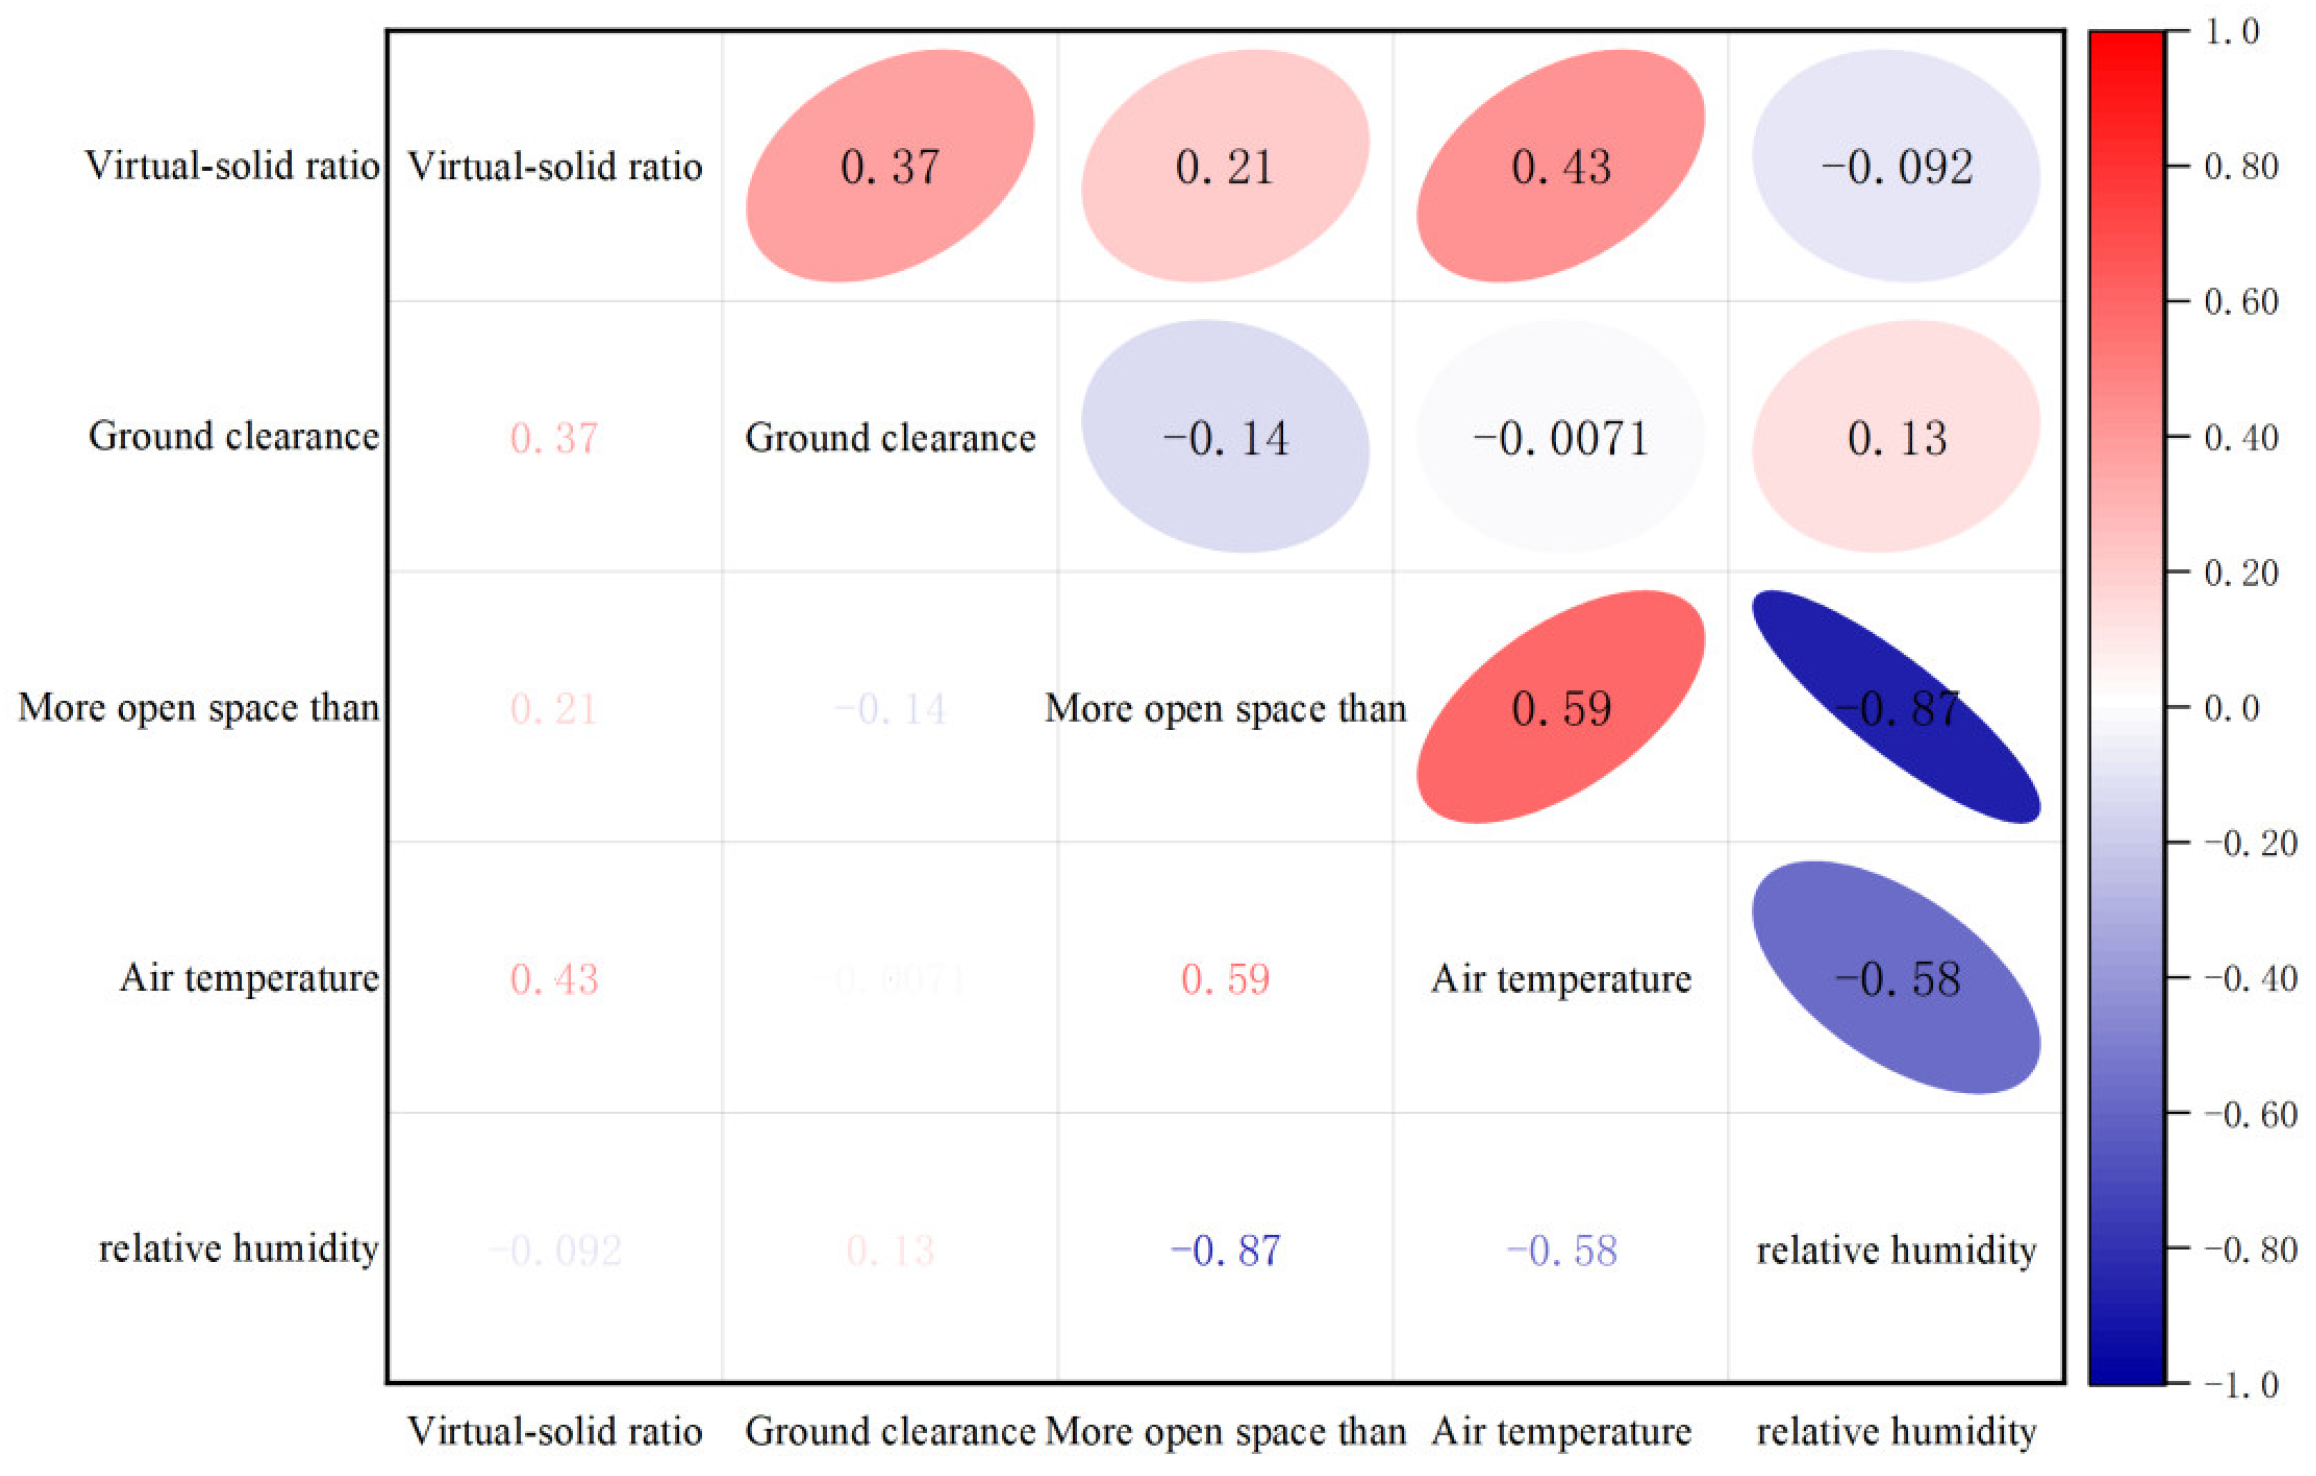
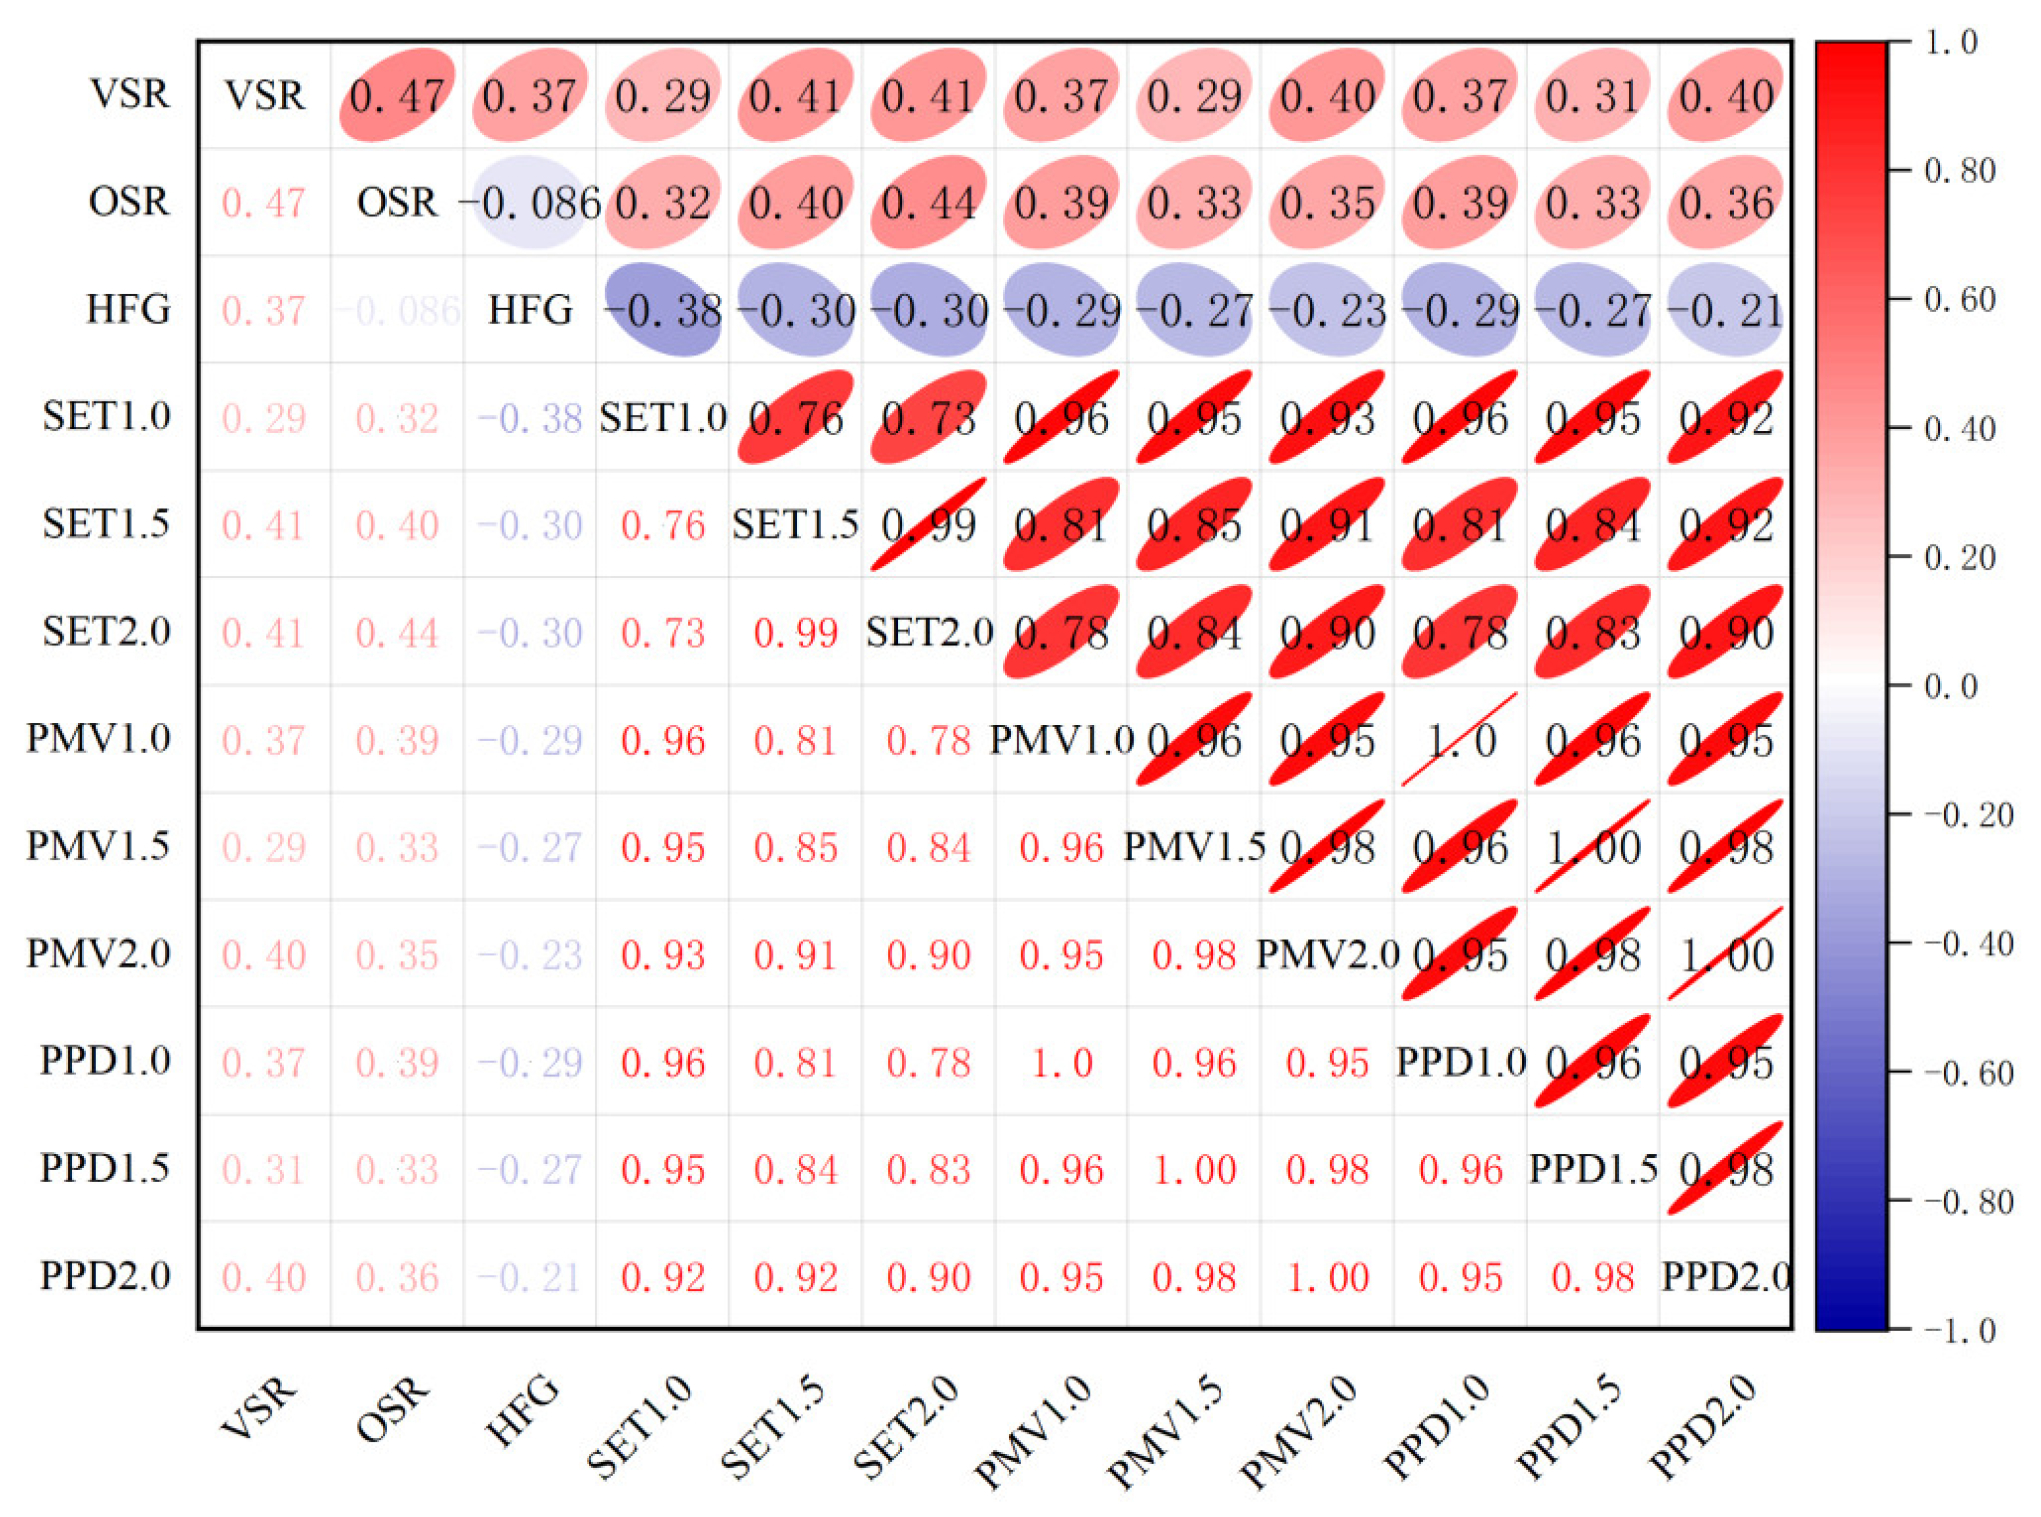
- Based on the correlation analysis of the indicator variables, we obtained the correlation coefficient between indicator parameters. When the permeability ratio of space form was larger, the air temperature and SET also increased, the humidity decreased, and the thermal sensation and thermal discomfort were significantly affected. The higher the altitude was from the ground, the lower the air temperature and SET; the higher the humidity was, the more general thermal sensation and thermal discomfort were affected. The more open the space was, the higher the air temperature and SET; the lower the humidity was, the more significant the influence of thermal sensation and thermal discomfort.
Author Contributions
Funding
Institutional Review Board Statement
Informed Consent Statement
Data Availability Statement
Conflicts of Interest
References
- Zhang, R.; Li, W.; Li, Y.; Li, H. Job losses or gains? The impact of supply-side energy transition on employment in China. Energy 2024, 308, 132804. [Google Scholar] [CrossRef]
- Venkatraj, V.; Dixit, M.K.; Yan, W.; Lavy, S. Evaluating the impact of operating energy reduction measures on embodied energy. Energ. Build. 2020, 226, 110340. [Google Scholar] [CrossRef]
- Qian, F.; Sun, H.; Yang, L. Integrating Smart City Principles in the Numerical Simulation Analysis on Passive Energy Saving of Small and Medium Gymnasiums. Smart Cities 2024, 7, 1971–1991. [Google Scholar] [CrossRef]
- Zhang, M.; Liu, F.; Liu, Q.; Zhang, F.; Li, T. Climate Adaptation Analysis and Comfort Optimization Strategies for Traditional Residential Buildings in Hot-Summer, Cold-Winter Regions: A Case Study in Xuzhou, China. Sustainability 2024, 16, 3411. [Google Scholar] [CrossRef]
- Yang, L.; Fu, R.; He, W.; He, Q.; Liu, Y. Adaptive thermal comfort and climate responsive building design strategies in dry–hot and dry–cold areas: Case study in Turpan, China. Energ. Build. 2020, 209, 109678. [Google Scholar] [CrossRef]
- Buyukyazici, D.; Mazzoni, L.; Riccaboni, M.; Serti, F. Workplace skills as regional capabilities: Relatedness, complexity and industrial diversification of regions. Reg. Stud. 2024, 58, 469–489. [Google Scholar] [CrossRef]
- Dorcas Mobolade, T.; Pourvahidi, P. Bioclimatic approach for climate classification of Nigeria. Sustainability 2020, 12, 4192. [Google Scholar] [CrossRef]
- Kim, J.H.; Han, S.H. Applicability of preliminary standards for the hanok comfort evaluation based on spatial indices. Buildings 2021, 11, 497. [Google Scholar] [CrossRef]
- Dwikat, S.Y.; Arshad, D.; Mohd Shariff, M.N. Effect of competent human capital, strategic flexibility and turbulent environment on sustainable performance of SMEs in manufacturing industries in palestine. Sustainability 2023, 15, 4781. [Google Scholar] [CrossRef]
- Dagestani, A.A.; Chen, P.; Du, L.; Hu, J.; Bilan, Y. The impacts of urban development orientation of resource-based cities on environmental information disclosure and greenwashing behavior of listed firms in China. Environ. Dev. Sustain. 2024, 1–26. [Google Scholar] [CrossRef]
- Tao, Y.; Lau, S.S.Y.; Gou, Z.; Zhang, J.; Tablada, A. An investigation of semi-outdoor learning spaces in the tropics: Spatial settings, thermal environments and user perceptions. Indoor Built Environ. 2019, 28, 1368–1382. [Google Scholar] [CrossRef]
- Yuan, L.; Lu, W.; Xue, F.; Li, M. Building feature-based machine learning regression to quantify urban material stocks: A Hong Kong study. J. Ind. Ecol. 2023, 27, 336–349. [Google Scholar] [CrossRef]
- Deng, Z.; Chen, Y.; Yang, J.; Causone, F. AutoBPS: A tool for urban building energy modeling to support energy efficiency improvement at city-scale. Energ. Build. 2023, 282, 112794. [Google Scholar] [CrossRef]
- Gamero-Salinas, J.; Kishnani, N.; Monge-Barrio, A.; López-Fidalgo, J.; Sánchez-Ostiz, A. The influence of building form variables on the environmental performance of semi-outdoor spaces. A study in mid-rise and high-rise buildings of Singapore. Energ. Build. 2021, 230, 110544. [Google Scholar] [CrossRef]
- Henna, K.; Saifudeen, A.; Mani, M. Resilience of vernacular and modernising dwellings in three climatic zones to climate change. Sci. Rep. 2021, 11, 9172. [Google Scholar] [CrossRef] [PubMed]
- Gratia, E.; De Herde, A. Design of low energy office buildings. Energ. Build. 2003, 35, 473–491. [Google Scholar] [CrossRef]
- Ourghi, R.; Al-Anzi, A.; Krarti, M. A simplified analysis method to predict the impact of shape on annual energy use for office buildings. Energ. Convers. Manag. 2007, 48, 300–305. [Google Scholar] [CrossRef]
- Su, Y.; Wang, C.; Li, Z.; Meng, Q.; Gong, A.; Wu, Z.; Zhao, Q. Summer outdoor thermal comfort assessment in city squares—A case study of cold dry winter, hot summer climate zone. Sustain. Cities Soc. 2024, 101, 105062. [Google Scholar] [CrossRef]
- Taher Tolou Del, M.S.; Bayat, S.; Zojaji, N. The effect of building plan form on thermal comfort in the traditional residential patterns of the hot and dry climate of Qom. Herit. Sci. 2022, 10, 185. [Google Scholar] [CrossRef]
- Xiong, Y.; Zhang, J.; Yan, Y.; Sun, S.; Xu, X.; Higueras, E. Effect of the spatial form of Jiangnan traditional villages on microclimate and human comfort. Sustain. Cities Soc. 2022, 87, 104136. [Google Scholar] [CrossRef]
- Gamero-Salinas, J.; Kishnani, N.; Sánchez-Ostiz, A.; Monge-Barrio, A.; Benitez, E. Porosity, openness, and exposure: Identification of underlying factors associated with semi-outdoor spaces’ thermal performance and clustering in tropical high-density Singapore. Energ. Build. 2022, 272, 112339. [Google Scholar] [CrossRef]
- Chang, S.; He, W.; Yan, H.; Yang, L.; Song, C. Influences of vernacular building spaces on human thermal comfort in China’s arid climate areas. Energ. Build. 2021, 244, 110978. [Google Scholar] [CrossRef]
- Wang, S.S.; Yi, Y.K.; Liu, N.X. Multi-objective optimization (MOO) for high-rise residential buildings’ layout centered on daylight, visual, and outdoor thermal metrics in China. Build. Environ. 2021, 205, 108263. [Google Scholar] [CrossRef]
- Zhu, J.; Feng, J.; Lu, J.; Chen, Y.; Li, W.; Lian, P.; Zhao, X. A review of the influence of courtyard geometry and orientation on microclimate. Build. Environ. 2023, 236, 110269. [Google Scholar] [CrossRef]
- Xu, X.Y.; Sun, S.; Liu, W.; García, E.H.; He, L.; Cai, Q.; Xu, S.J.; Wang, J.J.; Zhu, J.N. The cooling and energy saving effect of landscape design parameters of urban park in summer: A case of Beijing, China. Energ. Build. 2017, 149, 91–100. [Google Scholar] [CrossRef]
- Bai, M.; Hu, R.; Lian, H.; Zhou, W. Correlation Study of Commercial Street Morphology and Pedestrian Activity in Cold Region Summers under Thermal Comfort Guidance: A Case Study of Sanlitun, Beijing. Buildings 2024, 14, 1751. [Google Scholar] [CrossRef]
- Gou, S.; Li, Z.; Zhao, Q.; Nik, V.M.; Scartezzini, J.L. Climate responsive strategies of traditional dwellings located in an ancient village in hot summer and cold winter region of China. Build. Environ. 2015, 86, 151–165. [Google Scholar] [CrossRef]
- Yang, Y.; Wang, Z.; Zhou, F.; Liu, C.; Duanmu, L.; Zhai, Y.; Lian, Z.; Cao, B.; Zhang, Y.; Zhou, X.; et al. Comparison of indoor thermal environments and human thermal responses in Northern and Southern China during winter. J. Build. Eng. 2024, 82, 108131. [Google Scholar] [CrossRef]
- Li, W.; Zhou, Z.; Wang, C.; Han, Y. Impact of outdoor microclimate on the performance of high-rise multi-family dwellings in cold areas and optimization of building passive design. Build. Environ. 2024, 248, 111038. [Google Scholar] [CrossRef]
- Sun, Q.; Qi, Y.; Long, Y. A comparative case study of volcanic-rock vernacular dwelling and modern dwelling in terms of thermal performance and climate responsive design strategies in Hainan Island. J. Asian Arch. Build. 2022, 21, 1381–1398. [Google Scholar] [CrossRef]
- Liang, C.; Yu, L.; Liu, X. Parametric Study on the Comfort of Outdoor Wind Environment of Traditional Dwelling—Taking Lius’ courtyard in Kaifeng as an Example. IOP Conference Series, Earth and Environmental Science. IOP Publ. 2021, 768, 012152. [Google Scholar]
- Li, E.; Zhu, J. Parametric analysis of the mechanism of creating indoor thermal environment in traditional houses in Lhasa. Build. Environ. 2022, 207, 108510. [Google Scholar] [CrossRef]
- ASHRAE Standard 55-2013; Thermal Environmental Conditions for Human Occupancy. ASHRAE: Peachtree Corners, GA, USA, 2013.
- GB/T50785-2012; Evaluation Standard for Indoor Thermal Environment in Civil Buildings. China Architecture Publishing & Media Co Ltd: Beijing, China, 2012.


| Research Object | Sample A | Sample B | Sample C | Sample D |
|---|---|---|---|---|
| Era build | Qing dynasty | Qing dynasty | Qing dynasty | Qing dynasty |
| Permanent population | 6 | 4 | 2 | 0 |
| Building orientation | West facing east | East facing west | Facing south | Facing south |
| Floor area | 319.92 m2 | 200.82 m2 | 244.42 m2 | 841.51 m2 |
| Building stories | Local layer 2 | Local layer 2 | Local layer 2 | Local layer 2 |
| Architectural structure | Post and panel structure | Post and panel structure | Post and panel structure | Post and panel structure |
| Building envelope | Blue brick wall; wood doors and windows Slope roof (wood purlin + wood rafters + gray tile) | Blue brick wall; wood doors and windows Slope roof (wood purlin + wood rafters + gray tile) | Blue brick wall; wood doors and windows Slope roof (wood purlin + wood rafters + gray tile) | Blue brick wall wood doors and windows Slope roof (wood purlin + wood rafters + gray tile) |
| Heat transfer coefficient W/m2·K | 1.67 | 1.54 | 1.46 | 1.58 |
| Thermal resistance m2·K/W | 0.66 | 0.37 | 0.75 | 0.68 |
| Cooling method | Natural ventilation | Natural ventilation | Natural ventilation | Natural ventilation |
| Morphological Index | Definition | Computational Formula |
|---|---|---|
| Delivery criterion | The distance between two adjacent transverse positioning axes, m | L |
| Depth | The actual length between the front and back walls of the building, m | W |
| Terrain clearance | Height of roof surface (floor) to indoor floor, m | H |
| Space-solid ratio/virtual-real ratio | Virtual area divided by solid area, m2 | Svirtual/Sreal |
| Open-space ratio | The open length based on the perimeter divided by the total perimeter | Lopen/Ltoal |
| General perimeter | The sum of the lengths of all sides of the perimeter | Ltotal |
| Measurement Content | Name | Measuring Range | Precision | Test Cycle |
|---|---|---|---|---|
| Air temperature and humidity | ONSET HOBO UX100-011 High precision temperature and humidity recorder | −20 °C to 70 °C, 1–95% | 0.024 °C, 0.01% | 72 h |
| wind speed | WWFWZY-1 wireless universal wind speed and temperature recorder | −260 °C to 1370 °C | 0.04 °C | 72 h |
| Black ball temperature | Heat index HD32.3TC | −5 °C to 50 °C | ClassA 1/3DIN | instantaneous |
| Subjective evaluation scale | 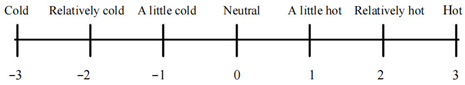 | |||
| Encoding | Room Name | Space-Solid Ratio/Virtual-Real Ratio | Terrain Clearance | Open-Space Length | General Perimeter | Open-Space Ratio |
|---|---|---|---|---|---|---|
| A-1 | Lobby | 0.13 | 6.92 | 7.78 | 23.54 | 0.33 |
| A-2 | Courtyard 1 | 0.13 | 5.73 | 4 | 16 | 0.25 |
| A-3 | Courtyard 2 | 0.58 | 6.28 | 12.6 | 16.45 | 0.77 |
| A-4 | Three halls | 0.22 | 4.04 | 8.28 | 18.6 | 0.45 |
| B-1 | Lobby | 0.29 | 3.6 | 9.1 | 35 | 0.26 |
| B-2 | Courtyard | 0.32 | 4.2 | 5.4 | 26.8 | 0.2 |
| B-3 | Wing-room | 0.19 | 2.21 | 1.23 | 12.1 | 2.65 |
| B-4 | Principal room | 0.18 | 4.56 | 1.52 | 17.56 | 21.6 |
| C-1 | Lobby | 0.47 | 2.7 | 5.94 | 10.8 | 0.55 |
| C-2 | Courtyard | 0.13 | 5 | 5.68 | 21.8 | 1.55 |
| C-3 | Second hall | 0.13 | 2.55 | 2.96 | 19.89 | 2.55 |
| C-4 | Wing-room | 0.23 | 2.93 | 1.66 | 18.52 | 3.55 |
| C-5 | Second floor | 0.05 | 2.23 | 1.64 | 16.74 | 4.55 |
| D-1 | West to east wing | 0.09 | 2.59 | 0.7 | 17.38 | 0.04 |
| D-2 | West to the second-floor west wing | 0.12 | 2.75 | 0.7 | 17.38 | 0.04 |
| D-3 | West to the second floor | 0.12 | 3.8 | 1.4 | 19.7 | 0.07 |
| D-4 | Two halls west | 0.22 | 4.96 | 4.22 | 21.8 | 0.19 |
| D-5 | East into the second floor | 0.12 | 2.76 | 1.43 | 18.85 | 0.08 |
| D-6 | East into the first floor | 0.31 | 3.3 | 2.56 | 19.2 | 0.072 |
| Numerical Value | Solar Radiation | Outdoor Air Temperature | Outdoor Relative Humidity | Outdoor Wind Speed |
|---|---|---|---|---|
| Mean value | 203.73 | 28.17 | 74.16% | |
| Maximum value | 926.85 | 42.15 | 97.8% | 12.67 |
| Minimum value | 0 | 15.94 | 35.1% | 0.08 |
| Indoor Thermal Environment | Model | Nonnormalized Coefficient | Standardization Coefficient (Beta) | p-Value (p) | Variance Inflation Factor (VIF) | |
|---|---|---|---|---|---|---|
| (B) | (Std. Dev.) | |||||
| Air temperature | (constant) | 16.712 | 2.694 | 0.000 | ||
| Virtual–solid ratio/air–solid ratio (VSR) | 9.557 | 5.665 | 0.317 | 0.122 | 1.085 | |
| Ground clearance m-OSR | 1.246 | 0.576 | 0.431 | 0.056 | 1.225 | |
| More open space than m-HFG | 2.476 | 0.601 | 0.798 | 0.002 * | 1.155 | |
| Relative humidity | (constant) | 89.265 | 7.203 | - | 0.000 | |
| Virtual–solid ratio/air–solid ratio (VSR) | −18.023 | 15.117 | −0.271 | 0.261 | 1.085 | |
| Ground clearance m-OSR | −2.05 | 1.540 | −0.321 | 0.213 | 1.225 | |
| More open space than m-HFG | −4.973 | 1.607 | −0.725 | 0.011 * | 1.155 | |
| Thermal Comfort Parameter | Model | Nonnormalized Coefficient | Standardization Coefficient (Beta) | p-Value (p) | VIF | |
|---|---|---|---|---|---|---|
| B | Std. Dev. | |||||
| SET | SET 1.0 met | |||||
| (constant) | 27.838 | 1.413 | 0 | |||
| Virtual–solid ratio/air–solid ratio (VSR) | 2.398 | 2.966 | 0.195 | 0.438 | 1.085 | |
| Ground clearance m-OSR | 0.183 | 0.302 | 0.155 | 0.557 | 1.225 | |
| More open space than m-HFG | −0.69 | 0.315 | −0.544 | 0.054 * | 1.155 | |
| SET 1.5 met | ||||||
| (constant) | 28.699 | 1.531 | ||||
| Virtual–solid ratio/air–solid ratio (VSR) | 4.318 | 3.212 | 0.285 | 0.209 | 1.085 | |
| Ground clearance m-OSR | 0.185 | 0.327 | 0.128 | 0.584 | 1.225 | |
| More open space than m-HFG | −0.938 | 0.342 | −0.602 | 0.021 * | 1.155 | |
| SET 2.0 met | ||||||
| (constant) | 29.422 | 1.449 | 0 | |||
| Virtual–solid ratio/air–solid ratio (VSR) | 4.146 | 3.041 | 0.278 | 0.203 | 1.085 | |
| Ground clearance m-OSR | 0.182 | 0.31 | 0.128 | 0.569 | 1.225 | |
| More open space than m-HFG | −0.964 | 0.323 | −0.628 | 0.014 * | 1.155 | |
| PMV | PMV 1.0 met | |||||
| (constant) | 0.822 | 0.461 | 0.105 | |||
| Virtual–solid ratio/air–solid ratio (VSR) | 1.047 | 0.968 | 0.258 | 0.305 | 1.085 | |
| Ground clearance m-OSR | 0.094 | 0.099 | 0.241 | 0.364 | 1.225 | |
| More open space than m-HFG | −0.188 | 0.103 | −0.45 | 0.097 | 1.155 | |
| PMV 1.5 met | ||||||
| (constant) | 0.844 | 0.333 | 0.03 | |||
| Virtual–solid ratio/air–solid ratio (VSR) | 0.716 | 0.699 | 0.286 | 0.33 | 1.085 | |
| Ground clearance m-OSR | 0.046 | 0.071 | 0.193 | 0.53 | 1.225 | |
| More open space than m-HFG | −0.069 | 0.074 | −0.268 | 0.375 | 1.155 | |
| PMV 2.0 met | ||||||
| (constant) | 0.863 | 0.288 | 0.013 | |||
| Virtual–solid ratio/air–solid ratio (VSR) | 0.704 | 0.605 | 0.298 | 0.271 | 1.085 | |
| Ground clearance m-OSR | 0.043 | 0.062 | 0.189 | 0.503 | 1.225 | |
| More open space than m-HFG | −0.095 | 0.064 | −0.39 | 0.172 | 1.155 | |
| PPD | PPD 1.0 met | |||||
| (constant) | 0.304 | 0.174 | 0.112 | |||
| Virtual–solid ratio/air–solid ratio (VSR) | 0.443 | 0.366 | 0.28 | 0.254 | 1.085 | |
| Ground clearance m-OSR | 0.026 | 0.037 | 0.172 | 0.499 | 1.225 | |
| More open space than m-HFG | −0.084 | 0.039 | −0.517 | 0.056 * | 1.155 | |
| PPD 1.5 met | ||||||
| (constant) | 0.276 | 0.12 | 0.045 | |||
| Virtual–solid ratio/air–solid ratio (VSR) | 0.291 | 0.253 | 0.306 | 0.275 | 1.085 | |
| Ground clearance m-OSR | 0.009 | 0.026 | 0.1 | 0.732 | 1.225 | |
| More open space than m-HFG | −0.04 | 0.027 | −0.405 | 0.17 | 1.155 | |
| PPD 2.0 met | ||||||
| (constant) | 0.266 | 0.107 | 0.033 | |||
| Virtual–solid ratio/air–solid ratio (VSR) | 0.295 | 0.225 | 0.322 | 0.22 | 1.085 | |
| Ground clearance m-OSR | 0.01 | 0.023 | 0.111 | 0.681 | 1.225 | |
| More open space than m-HFG | −0.045 | 0.024 | −0.474 | 0.091 | 1.155 | |
Disclaimer/Publisher’s Note: The statements, opinions and data contained in all publications are solely those of the individual author(s) and contributor(s) and not of MDPI and/or the editor(s). MDPI and/or the editor(s) disclaim responsibility for any injury to people or property resulting from any ideas, methods, instructions or products referred to in the content. |
© 2024 by the authors. Licensee MDPI, Basel, Switzerland. This article is an open access article distributed under the terms and conditions of the Creative Commons Attribution (CC BY) license (https://creativecommons.org/licenses/by/4.0/).
Share and Cite
Liu, Y.; Yang, L.; Qiao, Y.; Cao, Q.; Han, B. A Multivariate Model and Correlation Study on the Impact of Typical Residential Spatial Forms in the Middle Reaches of the Hanjiang River on the Thermal Environment and Thermal Comfort. Sustainability 2024, 16, 8297. https://doi.org/10.3390/su16198297
Liu Y, Yang L, Qiao Y, Cao Q, Han B. A Multivariate Model and Correlation Study on the Impact of Typical Residential Spatial Forms in the Middle Reaches of the Hanjiang River on the Thermal Environment and Thermal Comfort. Sustainability. 2024; 16(19):8297. https://doi.org/10.3390/su16198297
Chicago/Turabian StyleLiu, Yue, Liu Yang, Yuhao Qiao, Qimeng Cao, and Bing Han. 2024. "A Multivariate Model and Correlation Study on the Impact of Typical Residential Spatial Forms in the Middle Reaches of the Hanjiang River on the Thermal Environment and Thermal Comfort" Sustainability 16, no. 19: 8297. https://doi.org/10.3390/su16198297
APA StyleLiu, Y., Yang, L., Qiao, Y., Cao, Q., & Han, B. (2024). A Multivariate Model and Correlation Study on the Impact of Typical Residential Spatial Forms in the Middle Reaches of the Hanjiang River on the Thermal Environment and Thermal Comfort. Sustainability, 16(19), 8297. https://doi.org/10.3390/su16198297