Article

Observations of Live Individuals and Predicted Suitable Habitat for Chinese Pangolin (Manis pentadactyla) in Guangdong, China

1
School of Life Science, South China Normal University, Guangzhou 510631, China
2
Guangzhou Caomufan Ecological Research Co., Ltd., Guangzhou 510520, China
*
Author to whom correspondence should be addressed.
These authors contributed equally to this work.
Sustainability 2024, 16(16), 7209; https://doi.org/10.3390/su16167209
Submission received: 27 June 2024 / Revised: 19 August 2024 / Accepted: 19 August 2024 / Published: 22 August 2024

Abstract

:
Due to overexploitation and habitat loss, the Chinese pangolin (Manis pentadactyla) is in such extreme decline that it is so rare in the wild as to be considered functionally extinct, even in Guangdong, which was historically a major distribution area for the species. This study sought to verify whether functional extinction has occurred using observation records from field surveys, infrared wildlife cameras, rescue and enforcement cases and the published literature. The results indicated that suitable habitat occurred within 63.4% of the forested land in Guangdong, but only 17.6% of this area was deemed highly suitable, and 82.3% of all suitable habitat occurred outside of protected areas. Thus, the Chinese pangolin is not yet functionally extinct in Guangdong, but urgent conservation and restoration actions must be taken to ensure its persistence. Chinese pangolins in Guangdong Province are primarily distributed in the Lianhua Mountain and Nanling Mountains, with 91.6% belonging to a single population. From 1980 to 2020, the urban area increased by 776 km2, largely via conversion from agricultural land (48.6%). Suitable habitat for Chinese pangolins was reduced and became more fragmented over this time period, highlighting the urgent need for the establishment of protected areas, habitat restoration and cooperation with local residents.

1. Introduction

Ensuring the survival of endangered species requires understanding the distribution of their suitable habitat. Suitable habitat is defined as area that can fulfil all of a species’ life history requirements for survival and reproduction [1,2,3]. Understanding the distribution of suitable habitat is critical for in situ conservation actions, delineating conservation areas and determining suitable places for the release of captive-bred or relocated individuals. These and other conservation activities reliant on accurately identified suitable habitat have been applied to several endangered species in Asia, including the Asian elephant (Elephas maximus) [4], Eastern hoolock gibbon (Hoolock leuconedys) [5] and Red-crowned Crane (Grus japonensis) [6].
The Chinese pangolin (Manis pentadactyla) is a charismatic, unique mammal belonging to the order Pholidota. Their scale-covered bodies maintain a low temperature (31–35 °C) and they feed exclusively on ants and termites. Chinese pangolins inhabit mainland China, Hong Kong and Taiwan, as well as Bangladesh, Bhutan, India, Laos, Myanmar, Nepal, Thailand and Vietnam. However, China was the historical epicentre of the Chinese pangolin range, with 80% of the range falling within this country [7]. Within China, Guangdong Province was the most important area for the Chinese pangolin, with approximately 70% of the land area overlapping with the pangolins’ range. The provincial population has shown a significant downward trend since the 1970s, decreasing from 14,273 individuals to 4405 individuals between 2000 and 2020 [8,9,10]. The global Chinese pangolin population has declined dramatically due to overharvesting and human activity, and the species has become very rare in the wild. Traces of wild pangolin activity have not been observed in the past 20–30 years, even in its original distribution area [11,12,13,14,15]. The Chinese pangolin has been listed as Critically Endangered by the International Union for Conservation of Nature since 2014 and was added to the Convention for the International Trade of Endangered Species’ Appendix I in 2017. The Chinese government designated the Chinese pangolin as a National Level I protected animal in 2021. At present, the China Green Development Association considers the species to be functionally extinct on the Chinese mainland. Chinese pangolins are only considered common in central and eastern regions of Nepal and Taiwan [16]; these areas may be the most critical for pangolins globally.
Functional extinction refers to the permanent loss of reproductive capability within a population, meaning that recruitment has or will decline to zero and the species thus faces extirpation or extinction. Many species experience functional extinction prior to becoming extinct. Functional extinctions can have cascading effects, where other dependent species may decline or ecological consequences such as a decline in structure and function may manifest. Detecting functional extinctions early is critical, as science-based decision making and species management can prevent total extinction if given enough time [17,18]. For the Chinese pangolin, statistical surveys are typically conducted to determine if the population maintains normal reproductive capacity and growth potential, such as the presence of cubs or pregnant females, as criteria for functional extinction [13].
We sought to determine if Chinese pangolins are indeed functionally extinct within Guangdong Province and, if populations are remaining, their size and distribution status. To achieve this, we used observation data spanning two decades, from a wide variety of sources, in conjunction with appropriate environmental covariates. Observation and environmental data were used to predict and assess potential suitable habitat within Guangdong. The resulting prediction and ranking of suitable habitat can be applied in establishing priority protection areas, setting population and habitat recovery goals, making protected area boundary adjustments and the selection of sites for release or ex situ conservation.

2. Methods

2.1. Study Area

Guangdong Province is located in the southernmost part of mainland China (20°09′–25°31′ N, 109°45′–117°20′ E), with hilly and mountainous terrain accounting for 62.7% of the total land area (17.97 × 10⁴ km2, Figure 1). The highest elevation peak reaches 1902 m (Figure 1). The climate is warm and humid, with an average annual temperature of 21.8 °C; the coldest and hottest monthly average temperatures are 13.4 °C and 28.5 °C, respectively. The average annual precipitation in 2016 was 1790 mm. The total area of forested land in the province is 10.53 × 10⁴ km2, of which 3.3 × 10⁴ km2 is natural [19].

2.2. Collection, Screening and Processing of Chinese Pangolin Observations

We obtained data representing observations of pangolin individuals or burrows from the published literature, field and camera trap surveys, rescue and enforcement cases and interviews. In total, we collected 371 observations (“sites”) from these sources. Chinese pangolin lifespans generally do not exceed 20 years; thus, observations of burrows were limited to the past 25 years (2000–2024). Live sightings were limited to the past 4 years (2021–2024) given the objective of determining functional extinction. Data obtained from the literature and interview surveys were checked to ensure their authenticity and reliability, and records without direct evidence, such as live photographs or specimens, were excluded. Infrared cameras were installed in all areas suspected of pangolin activity along the field survey routes, with priority given to their installation at burrows. They were set up to capture both photos and videos, taking 3 photos and a 15 s video each time. Manual screening was conducted on the photo and video data from the 163 recovered infrared cameras. The coordinates for each record were determined and corrected using a handheld Global Positioning System device (GPSMAP 631csx; Garmin China, Shanghai, China) and satellite imagery obtained from Google Earth Pro (Alphabet Inc., Mountain View, CA, USA). The screening process resulted in the removal of 99 site points, most of which were mistakenly identified burrows or instances where Malayan (Sunda) pangolins (Manis javanica) were incorrectly identified as Chinese pangolins. In total, 272 sites were retained for analyses (Table 1, Figure 1). These locations were mapped using ArcGIS version 10.7 (Esri, Redlands, CA, USA) and assessed for spatial autocorrelation. Biological and ecological data associated with pangolin observations, including individual age and gender, and population size, were collated into a Microsoft Excel spreadsheet and converted into comma-delimited (.csv) format for use in maximum entropy (MaxEnt) modelling.

2.3. Collection, Screening and Processing of Environmental Data

Using published literature descriptions of the environmental characteristics of Chinese pangolin habitat, 26 environmental variables were selected and then derived from WorldClim, the Geospatial Data Cloud Platform (http://www.geodata.cn/, accessed on 20 August 2024) and the Resource and Environmental Science Data Platform (http://www.resdc.cn/, accessed on 20 August 2024). The variables represented climate and land cover variables and were processed in raster format. To avoid overfitting resulting from high correlations among environmental variables, we used Pearson correlation coefficients to assess and then remove highly collinear variables. For any two variables with a correlation coefficient > 0.7, only one was retained. This resulted in 12 environmental variables for inclusion in modelling (Table 2, Figure S1).
Given the estimated lifespan of Chinese pangolins and the urbanisation trajectory within Guangdong Province, two time periods were assessed separately; current (2020) and historical (1980). Although all environmental variables were derived from current data, historical data were used in an analysis of habitat fragmentation focused on three environmental variables that have exhibited rapid change: land cover classification, vegetation index and distance to roads. Before the analyses, all variables were standardised to a coordinate system (WGS1984), the administrative boundary of Guangdong and a cell size of 30.

2.4. Habitat Prediction and Suitability Analysis

Site (observation) and environmental data were imported into MaxEnt version 3.4. Prior to predictive modelling, the test data were set to 25% and model iteration was set to 20. For predictive modelling, the jackknife method was used to test the relative importance of each of the 12 environmental variables to the overall suitable habitat prediction. The area under the receiver operator characteristic curve (AUC) was used to test the model fit [20]. The predictive model outputs were visualised as suitable habitat distribution maps using ArcGIS. Habitat suitability was binned, using the Jenks natural breaks tool in ArcGIS, into four categories, three of which represented suitable habitat: high suitability (0.5 < p ≤ 1), moderate suitability (0.3 < p ≤ 0.5), inferior suitability (0.09 < p ≤ 0.3), and unsuitable (0 < p ≤ 0.09) [21]. The total area of suitable habitat was determined using the raster calculator tool. The environmental characteristics of suitable habitats were determined using the response curves of each variable obtained from the MaxEnt model and field survey results.

2.5. Habitat Fragmentation Analysis

FRAGSTATS version 4.2 was used to assess historical and current fragmentation within the Chinese pangolin range in Guangdong Province. The predicted results for historical and current suitable habitat obtained from MaxEnt modelling were converted into raster format using ArcGIS and exported for use in FRAGSTATS. Eight key landscape indices representing the distribution patterns of suitable habitat were calculated using the moving window method (Table S1) at the municipal scale for the entire study area in both time periods. A moving window size of 3 km × 3 km was selected and moved from the top left corner of the study area onward, one grid cell at a time. Once a value was computed within a given window, the centre pixel within that window was assigned the calculated value, resulting in a raster output for each of the eight indices. ArcGIS was used to standardise and normalise each dimensionless index. All eight indices were then subject to principal component analysis (PCA) for the historical and current time periods. The weights obtained from the PCA were applied in ArcGIS using the weighted sum and overlay tools. The extent of fragmentation in both time periods was then binned into high, moderate and low categories using the natural breaks method [22].
Finally, we assessed the relationship between change in suitable habitat and change in land use between the two time periods, determined from the FRAGSTATS outputs and environmental variables, using Pearson correlation analyses in SPSS version 26 (IBM Corp., Armonk, NY, USA). Six variables were assessed: percentage of suitable habitat area (X1), patch density of suitable habitat (X2), mean patch size of suitable habitat (X3), percentage of urban/built-up land (X4), patch density of urban/built-up land (X5), and mean patch size of urban/built-up land (X6) [23].

3. Results

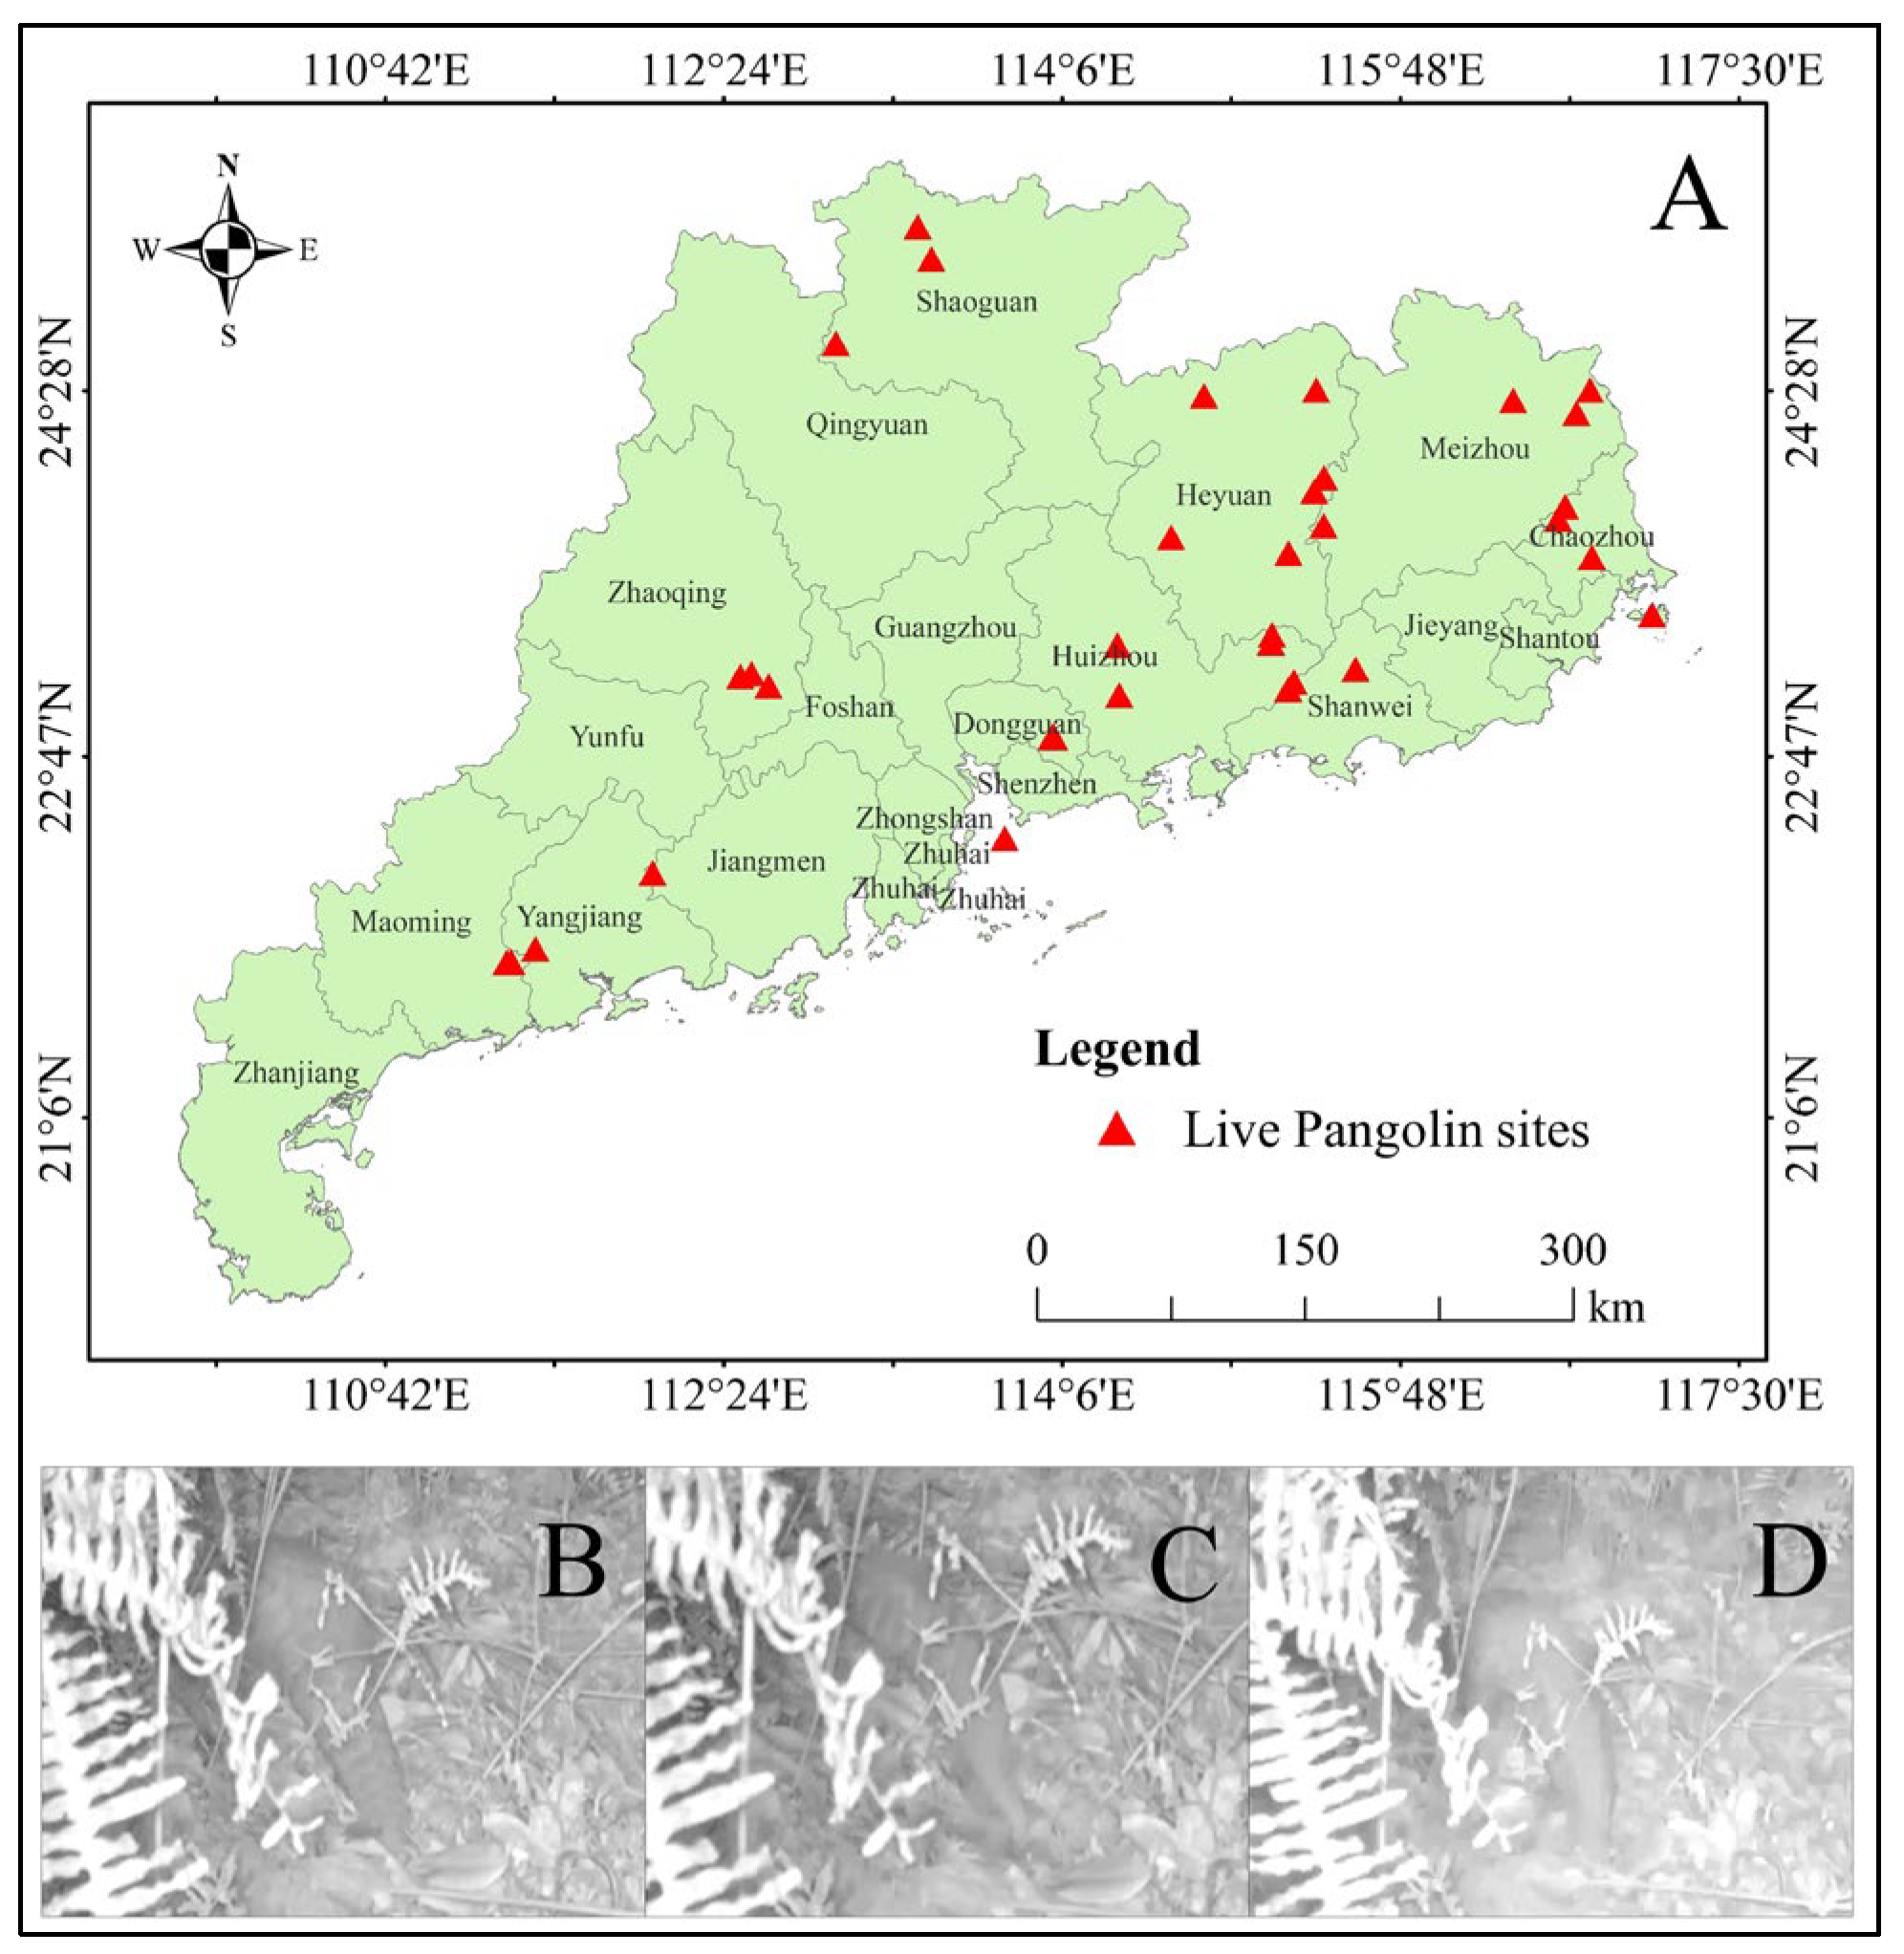
3.1. Live Chinese Pangolin Observations

In total, 60 live Chinese pangolins were documented during 36 observations in Guangdong Province during 2021–2024. The observations were recorded across 11 municipalities and included 3 adult males, 2 adult females, and 1 juvenile female; 2 adults, 1 juvenile and 1 cub of unknown sex; 1 male and 1 female of unknown age; and 48 individuals of unknown age and sex (Table S2). Observations were primarily obtained from the hilly and mountainous terrain in eastern, northern and western Guangdong (Figure 2). Protected areas appeared to have a crucial role for Chinese pangolins; 65% (39 of the 60 recorded individuals) were recorded within protected areas. Specifically, Xiangtou Mountain Nature Reserve in Boluo County, Huizhou City, had the highest number of observations (15 individuals). The majority of pangolin observations were of single individuals. Of the 272 total observations during 2000–2024, including burrows and live sightings, the spatial autocorrelation analyses yielded a Moran’s I index of 0.14 (Z = 2.69, p = 0.007, Figure 3), indicating a significant positive (i.e., aggregated clustering) spatial pattern in the distribution of Chinese pangolins in Guangdong. Thus, Chinese pangolins in Guangdong Province are mostly distributed in isolated, small populations (Figure S2).

3.2. Distribution of Suitable Habitat

Combining the environmental data of Guangdong Province, the maxent model analysis found that all the resident sites were located within the range of highly suitable habitats, and the suitable habitat for Chinese pangolins in Guangdong Province was primarily distributed in hilly, mountainous forested terrain in the northern, eastern and western regions, along the Nanling, Jiulian, Lianhua and Yunkai Mountains (Figure S3). In total, suitable habitat comprised 6.67 × 10⁴ km2 and overlapped with 63.4% of the total forested area in the province (10.53 × 10⁴ km2). Within suitable habitat, high-suitability areas occupied the smallest total area (17.6% of the total suitable habitat), while inferior-suitability habitat occupied the largest area (Figure S3, Table 3). Historical accounts suggest that all forested, mountainous terrain in Guangdong are suitable habitat for pangolins; these results suggest a significant reduction in both their distribution range and area over time. Critically, of the 1.18 × 10⁴ km2 of forested nature reserve land in Guangdong [24], only 17.7% was suitable habitat. This indicates that large proportions of suitable habitat are distributed outside of protected areas and are therefore vulnerable to substantial threats (Figure S3).

3.3. Environmental Characteristics of Suitable Habitat

MaxEnt uses an iterative algorithm whereby individual coefficients are continuously adjusted. Predicted suitable habitat is further overlaid with individual climate variables to allow for the computation of zonation statistics, including thresholds and average values of multiple climate variables (Table 4, Figure S4). Collectively, the contributions of nine continuous climate variables, including mean diurnal range, annual temperature range (Bio7), mean temperature of the coldest quarter (Bio11), precipitation of the wettest month (Bio13), precipitation seasonality (Bio15), elevation, slope, vegetation index and distance to road, reached 93.1%. Among these nine variables, elevation had the greatest influence on Chinese pangolin habitat distribution, with a contribution rate of 36.9%. Combined response curves for all nine variables indicated that the most suitable habitat conditions for Chinese pangolins were as follows: elevation, 0–900 m; slope threshold, 0–50°; vegetation index, 2000–10,000; mean diurnal range, 5.0–9.0 °C; annual temperature range, 17.6–28.0 °C; mean temperature in the coldest quarter, 4.7–16.1 °C; precipitation in the wettest month, 219–378 mm; and precipitation seasonality, 57.3–78.2 mm.
The mapped results further indicated that suitable habitat for Chinese pangolins was often located on sunny slopes, which may be beneficial for the survival of a thermophilic animal. The forest vegetation was primarily warm coniferous forest, dominated by subtropical fir species and Masson’s pine, as well as tropical and subtropical evergreen broadleaf forests (Figure S5). Land cover was typically forested (85% of all suitable habitat), and closed-canopy forest accounted for one-third of all suitable habitat. Only 9% of all suitable habitat was situated on farmland. Generally, high-suitability habitat with low levels of human activity was located within protected areas.
The AUC, which is a measure of model performance, was 0.90 (Figure 4), indicating excellent performance.

3.4. Field Validation of Habitat Suitability

Based on field validation, it is believed that the predicted suitable habitats have a relatively high level of accuracy. Twenty-four sites were randomly selected for field validation, with sixteen and eight sites placed in suitable and unsuitable habitat, respectively. Only one site was found to be incorrectly classified (predicted as suitable habitat when it was not) (Figure 5, Table S3).

3.5. Land Cover in Guangdong Province over a 40-Year Period

Land cover change is one of the main causes of environmental change. The analysis of historical (1980) and current (2020) land cover data indicated that the urbanisation that has taken place over this 40-year period has generally encroached upon arable land and grassland. There was a decrease in cropland (−14% change) and grassland (−10%), but the total area of forest cover has remained unchanged (0%). There were significant increases in water (+12%) and urban/built-up land (+106%). As of 2020, 48.6% of the land converted into urban/built-up land was formerly cropland, 18.7% was formerly forest, and the remainder had been urban/built-up land since 1980 (Table 5, Figure 6).

3.6. Fragmentation in Suitable Habitat

Habitat fragmentation is one of the primary causes of biodiversity loss and poses a significant threat to endangered species facing the risk of extinction. This study evaluates the habitat fragmentation within suitable habitat for Chinese pangolins for 1980 and 2020. During this 40-year period, there was a 2745 km2 reduction in the total area of suitable habitat. The number of patches increased from 1172 in 1980 to 1214 in 2020. The mean patch size decreased from 58.2 km2 to 53.96 km2, the percentage of landscape of suitable habitat decreased by 1.5%, and the patch cohesion index declined by 0.1% over this period (Table 6, Figure S6). These results indicate a decline in the suitable habitat area for Chinese pangolins and a concurrent rise in fragmentation.
The Moving window analysis results indicated that areas with higher fragmentation tended to be located at the edges of suitable habitat, whereas those with lower fragmentation were located more centrally in suitable habitat. There was an overall increase in fragmentation of 1.7 × 10⁴ km2 from 1980 to 2020. Notably, there were small areas in eastern Guangdong that showed a slight decrease in fragmentation over time, despite increases in fragmentation in northern and western Guangdong (Figure 7).
The Pearson correlation coefficients indicated that during both the historical and current periods, the percentages of landscape and patch metrics, i.e., fragmentation, of suitable habitat were negatively correlated with urban/built-up land. Generally, as urban areas increased in size, suitable habitat for Chinese pangolins decreased and became more fragmented (Table 7, Table S4).

4. Discussion

Functional extinction refers to the permanent loss of a species’ reproductive function, where it is unable to replenish with new individuals, continuously declining, and eventually becoming extinct from the Earth. Following the collection and assessment of Chinese pangolin observations, this study found that Chinese pangolins are unlikely to be functionally extinct in Guangdong. In total, 60 live pangolins were documented over a 22-year period (2000–2022) within 11 municipalities in Guangdong. Recorded individuals included the full span of age classes, i.e., juvenile to adult, and instances of a mother and her offspring were captured via infrared camera. Observations of the cubs or pregnant females indicated that Chinese pangolins in Guangdong still possess reproductive capability, are therefore not functionally extinct, but are occurring in small, highly threated populations. Using an ensemble species distribution model, Gao et al. (2024) [25] also concluded that large areas of suitable habitat exist for Chinese pangolins in Guangdong Province, but reported that they are poorly protected. With proper protection, the Guangdong population may yet have the opportunity to recover [13].
The threats faced by Chinese pangolin are daunting. First, the population has declined substantially over the past several decades, with many areas in Guangdong no longer supporting populations [11,26,27]. Chinese pangolins were previously known from all 21 municipalities in Guangdong, but only 11 have reported pangolin observations within the past two decades. The populations that persist are likely extremely low in number and potentially below the minimum viable population size, which could increase extinction probability due to inbreeding depression. Of the 36 instances of observations of live pangolins, 33 were of a single individual. Further, populations that are living outside of protected areas are at risk, as poaching is a major cause of the decline in endangered species’ populations and the reduction in their distribution. Of the 60 live individuals observed, 21 (36%) were found outside of protected areas, making them highly vulnerable to poaching, habitat destruction and other human disturbance. One individual recorded as an observation in this study was found live by police following a poaching investigation in Dabu County, Meizhou City, Guangdong Province. In addition, the majority of suitable habitat described in this study was located outside of protected areas, meaning these areas are vulnerable to ongoing development for infrastructure, conversion for agriculture and road construction. However, no matter how much effort is made to improve the habitat of the pangolin and study how to improve their distribution and population survival, if the people of China and Vietnam do not reduce or cease their desire for pangolin trade, as well as stop the large-scale use of pangolin scales in traditional medicine, it will place the pangolins remaining in an extremely endangered state. Without a profound understanding of this issue, it will be impossible to completely reverse the declining trend of their population.
Population recovery in the wild is reliant on suitable habitat for recovering species. Chinese pangolin habitat in Guangdong has been extensively degraded, and faces major challenges in terms of restoration [8,28,29]. First, the vegetation index in the most suitable areas was 9800, indicating that good vegetation growth and high vegetation density are important to pangolin habitat, but forest area for recovery is limited. At present, the forested area of Guangdong Province is 105,300 km2 (including 33,000 km2 of natural forests), and the suitable habitat area for pangolins is 66,700 km2, such that at least 38,600 km2 (36.7%) of the forested area is unsuitable for pangolins, and most of this area comprises plantations of eucalyptus (Eucalyptus robusta), Chinese fir (Cunninghamia lanceolata) and bamboo (Bambusoideae). This is in part due to bamboo cultivation, which poses an often overlooked but serious threat to habitat quality when it spreads beyond cultivation, colonises large areas in the absence of intact forest and then hinders natural habitat restoration. Finally, substantial habitat fragmentation poses a challenge to habitat recovery and persistence into the future. Rapid infrastructure development in recent years has placed roads, water and electrical facilities deep into Chinese pangolin habitat, leading to habitat fragmentation. The strong, negative correlation between urban/built-up land and suitable habitat demonstrates the serious impact of urban development in Guangdong on Chinese pangolin habitat.
Low-elevation areas in mountainous or hilly terrain were historically considered to be the primary distribution areas for Chinese pangolins [10], whereas the Pearl River Delta and Leizhou Peninsula were dominated by high urbanisation and plains habitat, respectively, which are unsuitable for Chinese pangolins. Although research has suggested that suitable habitat for Chinese pangolins is distributed throughout China [30], with high-suitability habitat overlapping with highly urbanised areas, this is unlikely to be the case. Optimistic or erroneous predictions of pangolin habitat may be the result of low observation numbers or a lack of field validation of model results.

5. Conclusions

Despite the significant decline in the Chinese pangolin population’s size and distribution in Guangdong Province, the species is not yet functionally extinct in the wild. These populations face serious threats and require enhanced protection to persist. Suitable habitat for Chinese pangolins is still present in all 21 municipalities, especially outside of southern Guangdong, but these habitats have not received effective protection to date. Rapid urbanisation will lead to continued declines in habitat area and quality, and effective conservation and restoration actions are needed.
Four recommendations are proposed. (1) The establishment of protected areas where live pangolins have been recently encountered. Specifically, field surveys have found live pangolins in the Wuqinzhang and Xiangtou Mountain Reserves, with the largest population numbers observed in Xiangtou (15 individuals). These areas are prime candidates for protection. (2) Protection for Chinese pangolins and their habitat must be enhanced outside of protected areas, including areas within nature reserves. (3) The restoration of habitat that is suitable in terms of climate and topography but of low quality, such as areas with high densities of non-native species, should be prioritised. Restoration efforts should include the establishment of planted forests, avoiding the use of bamboo and eucalyptus species, and focus on increasing connectivity among high- or moderate-suitability habitat patches. (4) Community participation is critical to Chinese pangolin survival and can be promoted using ecological compensation actions that increase the incomes of local residents, raise conservation awareness and reduce the incentive to poach. These actions can work to promote the protection of Chinese pangolin populations and their habitats in Guangdong Province.

Supplementary Materials

The following supporting information can be downloaded at: https://www.mdpi.com/article/10.3390/su16167209/s1, Figure S1: Heat map showing Pearson’s correlation coefficients for environmental variables used in analyses; Figure S2: Spatial autocorrelation results obtained from ArcGIS version 10.7 for the distribution of observations of Chinese pangolin individuals in Guangdong Province; Figure S3: Distribution of (A) all suitable habitat for Chinese pangolins and natural reserves, (B) high-suitability habitat, (C) moderate-suitability habitat and (D) inferior-suitability habitat in Guangdong Province; Figure S4: Habitat suitability response curves for nine continuous environmental variables; Figure S5: Proportion of (A) slope aspect, (B) vegetation type and (C) land cover type in suitable habitat for Chinese pangolins. (D) An image of typical suitable habitat in Lianping County, Guangdong Province; Figure S6: Area under the receiver operating characteristic curve (AUC) values for models built using historical (1980) data; Table S1: Eight landscape indices used for FRAGSTATS analyses and their ecological relevance; Table S2: Observations of live Chinese pangolins in Guangdong Province (2021–2023); Table S3: Field validation of predicted habitat suitability; Table S4: Landscape pattern indices of suitable habitat and urban land in Guangdong Province.

Author Contributions

Methodology, B.Z. and W.W.; software, F.Z.; formal analysis, F.Z.; investigation, B.Z., P.C. (Peng Cen), W.W., Z.L., C.L., Y.L., J.Z., P.C. (Peiqi Chen) and S.W.; resources, Z.L., C.L., J.Z., P.C. (Peiqi Chen) and S.W.; data curation, Z.L. and Y.L.; writing—original draft preparation, B.Z. and P.C. (Peng Cen); writing—review and editing, B.Z.; project administration, S.W.; funding acquisition, S.W. All authors have read and agreed to the published version of the manuscript.

Funding

This research was funded by [National Key Research and Development Program of China, National Natural Science Foundation of China, State Forestry Administration and Grassland Administration, State Forestry Administration, Ministry of Ecology and Environment] grant number [2022YFF1301500, 32070522, 0b05-1, 2018-HS01, 2019-6-2, 2019-2-2-1] And The APC was funded by [National Key Research and Development Program of China].

Institutional Review Board Statement

Not applicable.

Informed Consent Statement

Informed consent was obtained from all subjects involved in the study.

Data Availability Statement

Some data cannot be publicly disclosed, and details can be obtained by contacting the corresponding author. This is due to the study subjects being rare and endangered animals, as well as restrictions imposed by the Chinese Biosafety Law.

Acknowledgments

We extend our gratitude for financial support from the National Key Research and Development Program of China (No. 2022YFF1301500), the National Natural Science Foundation of China (No. 32070522), the State Forestry Administration and Grassland Administration (No. 0b05-1), the State Forestry Administration (No. 2018-HS01) and the Ministry of Ecology and Environment (No. 2019-6-2, 2019-2-2-1). We thank Zheng Ke of the Ehuangzhang Provincial Nature Reserve for assisting in gathering infrared camera data. We also thank the staff of Yunkai Mountain National Nature Reserve, Shimentai National Nature Reserve, Chebaling National Nature Reserve, Huangniushi Provincial Nature Reserve, Yinna Mountain Provincial Nature Reserve, Heishiding National Nature Reserve, Tongledashan Provincial Nature Reserve, Baiyong Provincial Nature Reserve, Ehuangzhang Provincial Nature Reserve, Chenhedong Provincial Nature Reserve, Wuhua Qimuzhang Provincial Nature Reserve and Chaoan Fenghuangshan Provincial Nature Reserve for assisting in our efforts and providing valuable data.

Conflicts of Interest

The authors declare no conflict of interest. Author Peng Cen was employed by the company Guangzhou Caomufan Ecological Research Co., Ltd. The remaining authors declare that the research was conducted in the absence of any commercial or financial relationships that could be construed as a potential conflict of interest.

References

  1. Li, Y.; Cao, W.; He, X.Y.; Wei, C.; Sheng, X. Prediction of Suitable Habitat for Lycophytes and Ferns in Northeast China: A Case Study on Athyrium brevifrons. Chin. Geogr. Sci. 2019, 29, 1011–1023. [Google Scholar] [CrossRef]
  2. Pauli, B.P.; Zollner, P.A.; Haulton, G.S.; Shao, G.; Shao, G. The simulated effects of timber harvest on suitable habitat for Indiana and northern long- eared bats. Ecosphere 2015, 6, 1–24. [Google Scholar] [CrossRef]
  3. Wei, F.W.; Feng, Z.J.; Wang, Z.W. Overview of research on wildlife habitat selection. Chin. J. Zool. 1998, 33, 49–53. [Google Scholar]
  4. Zhang, J.J.; Chen, F.; Xie, F.; Zhang, X.; Yi, W.L.; Fan, H. Long time series changes of Asian elephant habitat and impacts on human-elephant conflict: Based on habitat suitability evaluation method by combining MaxEnt and HSI models. Acta Ecol. Sin. 2023, 43, 3807–3818. [Google Scholar] [CrossRef]
  5. Sarma, K.; Kumar, A.; Krishna, M.; Medhi, M.; Tripathi, O.P. Predicting suitable habitats for the vulnerable eastern hoolock gibbon, Hoolock leuconedys, in India using the MaxEnt model. Folia Primatol. 2015, 86, 387–397. [Google Scholar] [CrossRef] [PubMed]
  6. Wu, M.Q.; Wang, L.; Zhu, R.P.; Yang, Y.B.; Jin, H.Y.; Zou, H.F. Nesting habitat suitability analysis of red-crowned crane in Zhalong Nature Reserve based on MaxEnt modeling. Acta Ecol. Sin. 2016, 36, 3758–3764. [Google Scholar] [CrossRef]
  7. Challender, D.; Wu, S.; Kaspal, P.; Khatiwada, A.; Ghose, A.; Ching-Min, S.N.; Mohapatra, R.K.; Laxmi, S.T. Manis pentadactyla. The IUCN RedList of Threatened Species 2019: E.T12764A168392151. Available online: https://www.iucnredlist.org/species/12764/168392151 (accessed on 26 June 2024).
  8. Cen, P. Population Status of Pangolin (Pholidota) in China. Master’s Thesis, South China Normal University, Guangzhou, China, 2023. [Google Scholar]
  9. Wu, S.B.; Ma, G.Z.; Tang, M. Survey on the Population and Resource Reserve of Pangolins in Guangdong Province. Acta Theriol. Sin. 2002, 22, 271–276. [Google Scholar] [CrossRef]
  10. Liu, Z.H.; Xu, L.H. The Habits and Conservation Issues of Pangolins. Chin. J. Zool. 1981, 1, 40–41. [Google Scholar] [CrossRef]
  11. Challender, D.; Nash, H.; Waterman, C. Pangolins: Science, Society and Conservation; Academic Press: London, UK; San Diego, CA, USA, 2020; pp. 49–70. [Google Scholar]
  12. Zhang, F.H.; Wan, W.H.; Mahmood, A.; Wu, S.B.; Li, J.Q.; Xu, N. Observations of Chinese pangolins (Manis pentadactyla) in mainland China. Glob. Ecol. Conserv. 2021, 26, e01460. [Google Scholar] [CrossRef]
  13. Grayson, K.L.; Mitchell, N.J.; Monks, J.M.; Keall, S.N.; Wilson, J.N.; Nelson, N.J. Sex Ratio Bias and Extinction Risk in an Isolated Population of Tuatara (Sphenodon punctatus). PLoS ONE 2014, 9, e94214. [Google Scholar] [CrossRef]
  14. Gao, H.Y.; Dou, H.L.; Wei, S.C.; Sun, S.; Zhang, Y.L.; Hua, Y. Local chronicles reveal the effect of anthropogenic and climatic impacts on local extinctions of Chinese pangolins (Manis pentadactyla) in mainland China. Ecol. Evol. 2022, 12, e9388. [Google Scholar] [CrossRef] [PubMed]
  15. Zhang, F.H.; Cen, P.; Wu, S.B. The past, present and future of the pangolin in Mainland China. Glob. Ecol. Conserv. 2022, 33, e01995. [Google Scholar] [CrossRef]
  16. Sharma, H.P.; Rimal, B.; Zhang, M.X.; Sharma, S.; Poudyal, L.P.; Maharjan, S.; Kunwar, R.; Kaspal, P.; Bhandari, N.; Baral, L.; et al. Potential Distribution of the Critically Endangered Chinese Pangolin (Manis pentadactyla) in Different Land Covers of Nepal: Implications for Conservation. Sustainability 2020, 12, 1282. [Google Scholar] [CrossRef]
  17. Jarić, I.; Gessner, J.; Solow, A.R. Inferring functional extinction based on sighting records. Biol. Conserv. 2016, 199, 84–87. [Google Scholar] [CrossRef]
  18. Roberts, D.L.; Jarić, I.; Solow, A.R. On the functional extinction of the Passenger Pigeon. Conserv. Biol. 2017, 31, 1192–1195. [Google Scholar] [CrossRef]
  19. Statistical Analysis Report of Forestry in Guangdong Province in 2020. Available online: http://lyj.gd.gov.cn/government/release/content/post_3350630.html (accessed on 26 June 2024).
  20. Swets, J.A. Measuring the accuracy of diagnostic systems. Science 1988, 240, 1285–1293. [Google Scholar] [CrossRef]
  21. Li, Y.; Shao, W.; Huang, S.; Zhang, Y.Z.; Fang, H.F.; Jiang, G. Prediction of Suitable Habitats for Sapindus delavayi Based on the MaxEnt Mode. Forests 2022, 13, 1611. [Google Scholar] [CrossRef]
  22. Ran, R.; Wei, H.Y.; Zhao, Z.F.; Zhang, Q.Z.; Liu, J.; Gu, W. Impact of climate change on the potenial distribution and habitat fragmentation of the relict plant Cathaya argyrophylla Chun et Kuang. Acta Ecol. Sin. 2019, 39, 2481–2493. [Google Scholar] [CrossRef]
  23. Yu, W.J.; Ren, T.; Zhou, W.Q.; Li, W.F. Forest fragmentation and its relationship with urban expansion in Guangdong-Hong Kong-Macao Great Bay Area, China. Acta Ecol. Sin. 2020, 40, 8474–8481. [Google Scholar]
  24. List of National Nature Reserves. Available online: https://www.mee.gov.cn/ywgz/zrstbh/zrbhdjg/201905/P020190514616282907461.pdf (accessed on 26 June 2024).
  25. Gao, H.Y.; Hong, L.; Wang, D.K.; Zhang, Y.Q.; Hua, Y. Ensemble SDMs reveal the effect of environmental suitability and nature reserves on conserving Chinese pangolins in Guangdong, China. J. Nat. Conserv. 2024, 79, 126617. [Google Scholar] [CrossRef]
  26. Yu, S.J.; Xu, L.H. Population and distribution of protected animals in Guangdong, China. Chin. J. Wildlife 1985, 6, 39–42. [Google Scholar] [CrossRef]
  27. Zhang, L.; Li, Q.L.; Sun, G.; Luo, S.J. An Overview of Pangolin Populations and Conservation. Biol. Bull. 2010, 45, 1–4. [Google Scholar] [CrossRef]
  28. Zheng, J.C.; Xie, B.G.; You, X.B. Spatio-temporal characteristics of habitat quality based on land-use changes in Guangdong Province. Acta Ecol. Sin. 2022, 42, 6997–7010. [Google Scholar] [CrossRef]
  29. Wang, S.; Zhang, L.L.; Lin, W.B. Study on vegetation coverage and land-use change of Guangdong Province based on MODIS-NDVI. Acta Ecol. Sin. 2022, 42, 2149–2163. [Google Scholar] [CrossRef]
  30. Ta, Q.; Li, Y.K.; Fan, W.Q.; Shan, J.H.; Tu, X.B.; Ying, Q.; Miao, L.J.; Shao, R.Q.; Shen, J. Predicting the potential distribution of Chinese pangolin using the MaxEnt Model. Acta Ecol. Sin. 2021, 41, 9941–9952. [Google Scholar] [CrossRef]
Figure 1. The distribution of Chinese pangolin individuals or burrows in Guangdong Province from 2000 to 2024.
Sustainability 16 07209 g001
Figure 2. (A) Locations of live Chinese pangolin observations in Guangdong Province. A total of 60 individuals were observed across all sites. Observations share a site coordinate where they were taken close together. Images (BD) were taken between 13 April 2022 and 27 July 2022 with an infrared camera and each show an individual Chinese pangolin at a burrow.
Sustainability 16 07209 g002
Figure 3. Municipal-level Moran’s I values showing spatial associations of Chinese pangolin observations in Guangdong Province, China.
Sustainability 16 07209 g003
Figure 4. Area under the receiver operating characteristic curve (AUC) values obtained from MaxEnt.
Sustainability 16 07209 g004
Figure 5. The geographical distribution of the 16 sites used for the field validation. Five of the 16 sites are shown in inset images. Sites gz1, hd2 and dy1 were predicted to be suitable habitat and were consistent with Chinese pangolin habitat requirements. Site sx3 was predicted to be unsuitable habitat and was found to be unsuitable in the field. Site yd2 was located in a managed orchard, with no evidence of burrowing, and was determined to be unsuitable despite being predicted to be suitable habitat.
Sustainability 16 07209 g005
Figure 6. Chord diagram showing a land use conversion matrix for Guangdong Province from 1980 to 2020.
Sustainability 16 07209 g006
Figure 7. Spatial distribution of fragmentation in habitat suitable for Chinese pangolins in Guangdong Province in (A) 1980 and (B) 2020. Spatial distribution of areas of (C) decreasing and (D) increasing fragmentation.
Sustainability 16 07209 g007
Table 1. Data sources and processing steps for pangolin observation data.
Collecting MethodWorkloadWhole SiteEffective Site
IndividualBurrow
Literature62 sources344175
Interview199 interviewees1191132
Field work83 routes, total length 162.3 km3116118
Infrared camera163 infrared cameras, total of 550,000 deployed days47/47
Total/371272
Table 2. Environmental variables used in the prediction of suitable habitat.
NoEnvironment DataRecourse
1Mean diurnal range (Bio2)http://www.worldclim.org/ (accessed on 20 August 2024)
2Temperature annual range (Bio7)http://www.worldclim.org/ (accessed on 20 August 2024)
3Mean temperature of coldest quarter (Bio11)http://www.worldclim.org/ (accessed on 20 August 2024)
4Precipitation of wettest month (Bio13)http://www.worldclim.org/ (accessed on 20 August 2024)
5Precipitation seasonality (Bio15)http://www.worldclim.org/ (accessed on 20 August 2024)
6Elevationhttp://www.geodata.cn/ (accessed on 20 August 2024)
7Slopehttp://www.geodata.cn/ (accessed on 20 August 2024)
8Aspecthttp://www.geodata.cn/ (accessed on 20 August 2024)
9Forest vegetationhttp://www.geodata.cn/ (accessed on 20 August 2024)
10Land coverhttp://www.resdc.cn/ (accessed on 20 August 2024)
11Vegetation indexhttp://www.resdc.cn/ (accessed on 20 August 2024)
12Distance to roadshttp://www.resdc.cn/ (accessed on 20 August 2024)
Table 3. Land area (km2) of four categories of habitat suitability in Guangdong Province, China.
Habitat Suitability LevelArea/km2Percentage
High Suitability11,72117.56%
Medium Suitability19,25728.86%
Inferior Suitability35,75253.58%
Total66,730100.00%
Table 4. The contribution rate (%) and range of nine continuous environmental variables influencing the geographical distribution of suitable habitat for Chinese pangolins in Guangdong Province.
Environmental FactorsFactor Contribution/%High RangeMedium RangeInferior Range
RangeMeanRangeMeanRangeMean
Elevation/m36.9 0–900459344–1563961567–17651233
Mean diurnal range (Bio2)/°C14.0 5.0–9.07.484.9–9.27.95.1–9.68.2
Temperature annual Range (Bio7)/°C13.2 17.6–28.022.917.6–29.423.917.8–30.025.1
Slope/°11.2 0.0–49.418.00.1–56.415.70.1–53.612.2
Mean temperature of coldest quarter (Bio11)/°C5.6 4.7–16.111.94.6–16.412.63.5–17.613.3
Precipitation seasonality (Bio15)/mm3.2 57.3–78.26656.9–78.266.656.3–78.567.0
Distance to road/km3.1 0.01–0.140.020.01–0.130.020.01–0.140.01
Vegetation index3.0 2767–996585543153–99658322154–98877984
Precipitation of wettest month (Bio13)/mm2.9 219–378300218–384299218–388298
Table 5. Land cover (km2) conversion as a result of urbanisation in Guangdong Province between 1980 and 2020.
2020
1980CroplandForestGrasslandWaterUrban/Built-UpBarrenTotal
Cropland26,221.27 11,679.04 1351.07 2650.79 6595.39 27.22 48,525
Forest10,455.29 92,117.56 2668.96 1266.00 2538.69 20.01 109,067
Grassland1259.04 3381.65 3632.76 169.64 357.75 11.47 8812
Water1498.05 1039.93 140.60 2919.87 959.15 6.77 6564
Urban/built-up2157.65 898.77 117.72 338.28 3066.46 4.77 6584
Barren30.61 26.11 15.22 15.66 30.08 30.70 148
Total41,622 109,143 7926 7360 13,548 101 179,700
Table 6. Fragmentation index and rate of change in suitable habitat for Chinese pangolins in Guangdong Province.
Landscape IndicesHistoricalNowChange
CA68,25565,510−2745
NP1172121442
PD0.007 0.007 -
MPS58.24 53.96 −4.28
PLAND39.34 37.84 −1.50
AI85.29 85.91 0.62
COHESION99.11 99.01 −0.10
LSI39.26 36.93 −2.33
Table 7. Pearson correlation coefficients for municipal-level fragmentation metrics associated with suitable habitat and urbanisation.
Suitable Habitat PLAND X1Suitable Habitat PD X2Suitable Habitat MPS X3Urban/Built-Up PLAND X4Urban/Built-Up PD X5Urban/Built-Up MPS X6
HistoricalX11.00 −0.19 0.918 **−0.437 *−0.644 **−0.10
X2 1.00 −0.39 0.21 0.14 0.23
X3 1.00 −0.535 *−0.635 **−0.27
X4 1.00 0.864 **0.832 **
X5 1.00 0.465 *
X6 1.00
PresentX11.00 −0.19 0.857 **−0.448 *−0.622 **−0.25
X2 1.00 −0.40 0.37 0.05 0.26
X3 1.00 −0.444 *−0.38 −0.30
X4 1.00 −0.01 0.903 **
X5 1.00 −0.29
X6 1.00
** means the correlation is significant at the 0.01 levels. * means the correlation is significant at the 0.05 levels.
Disclaimer/Publisher’s Note: The statements, opinions and data contained in all publications are solely those of the individual author(s) and contributor(s) and not of MDPI and/or the editor(s). MDPI and/or the editor(s) disclaim responsibility for any injury to people or property resulting from any ideas, methods, instructions or products referred to in the content.

