
Research on Urban Street Spatial Quality Based on Street View Image Segmentation

 ,
, 
Abstract
1. Introduction
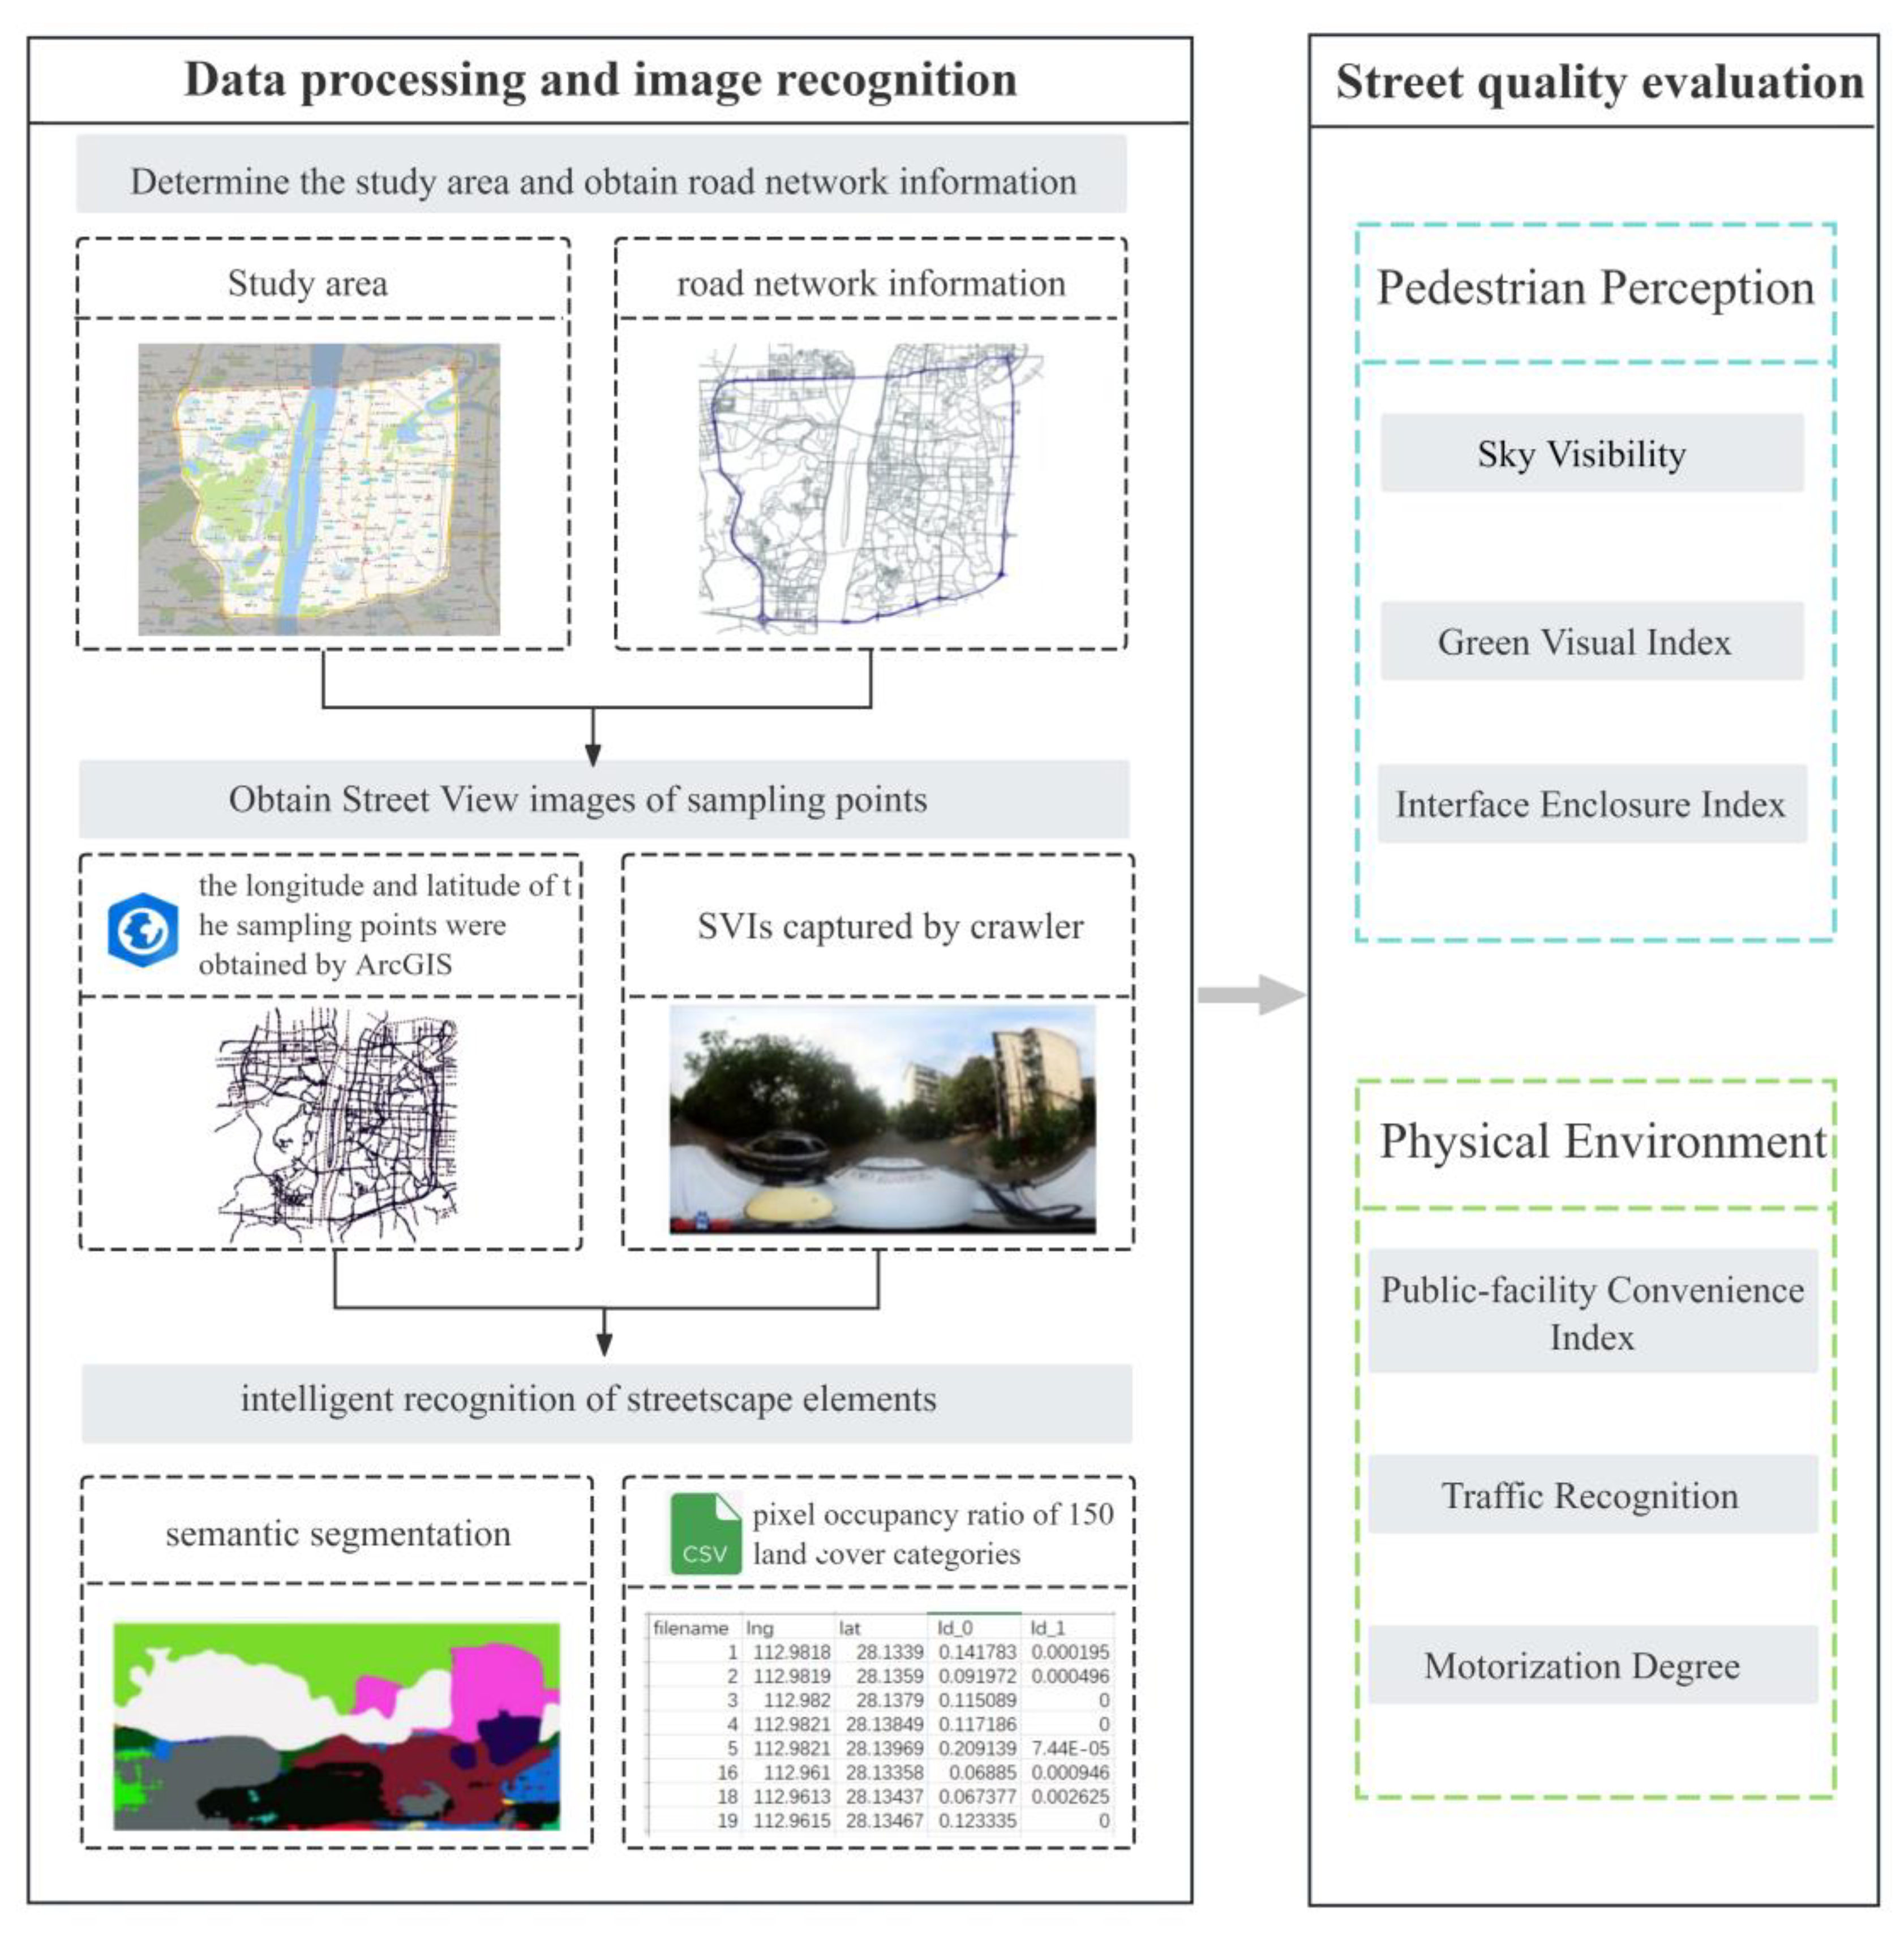
2. Methodology
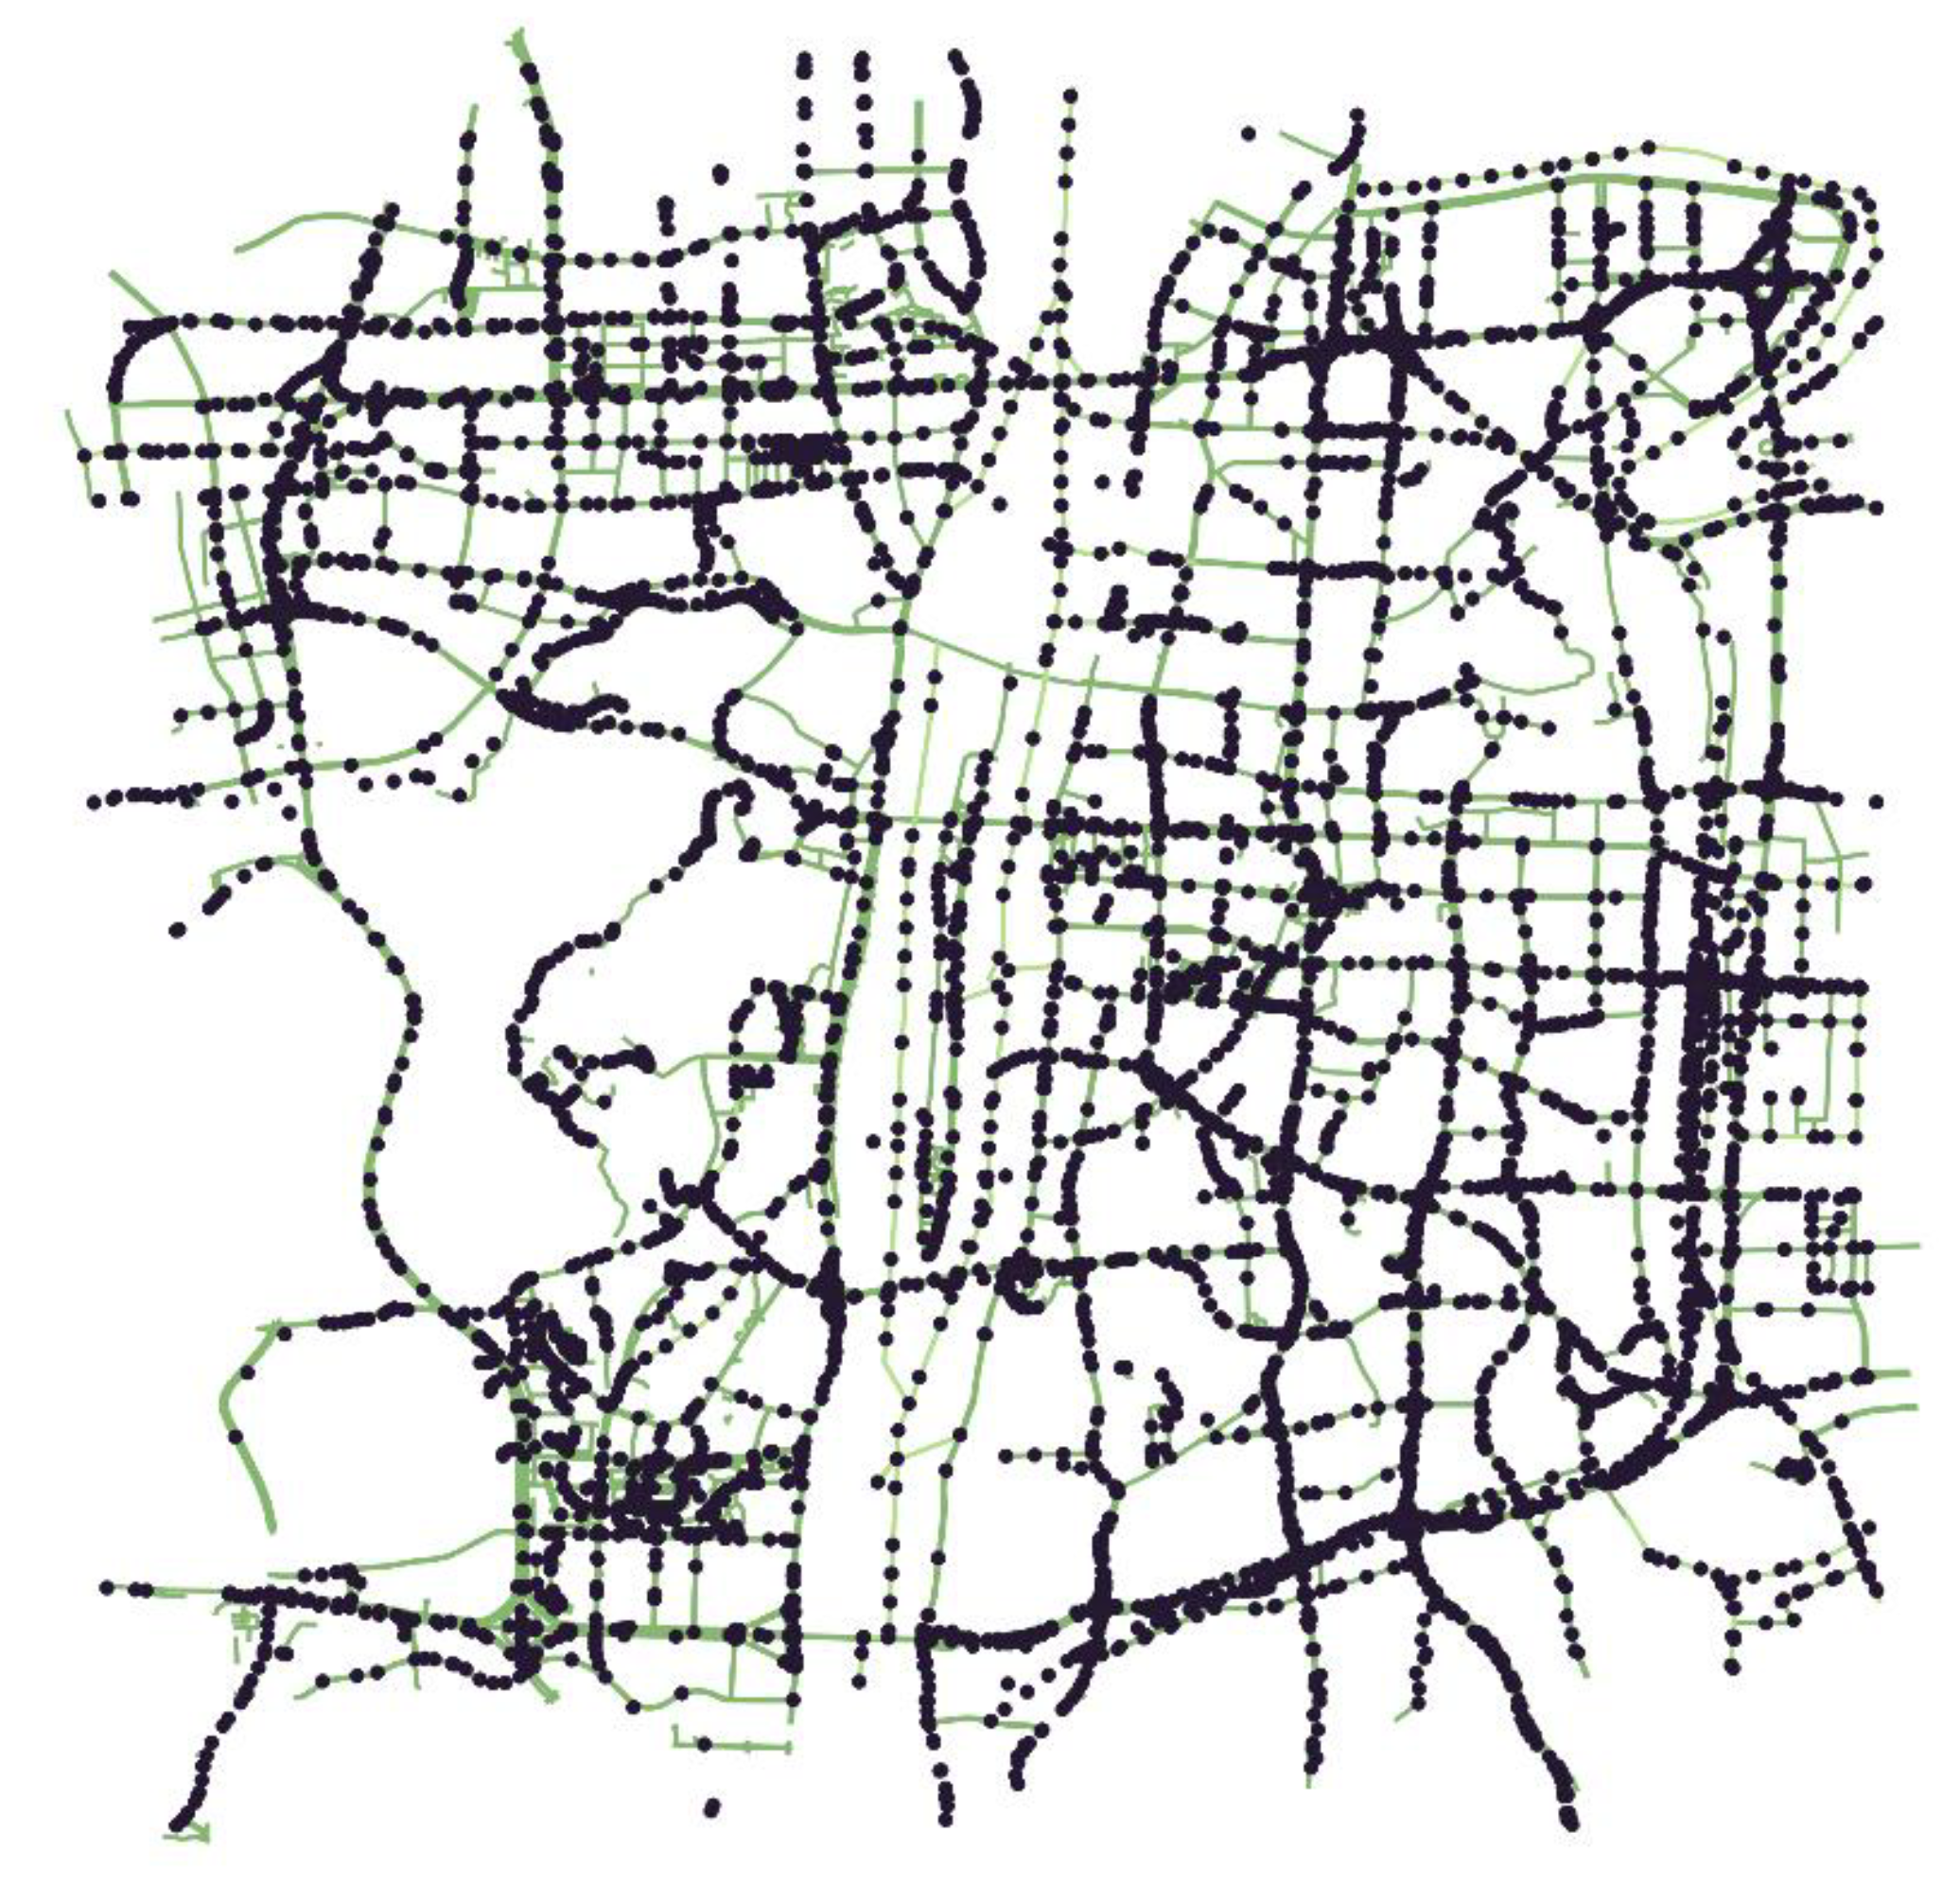
2.1. Data Gathering and Processing
2.1.1. Gathering the Data of the SVIs
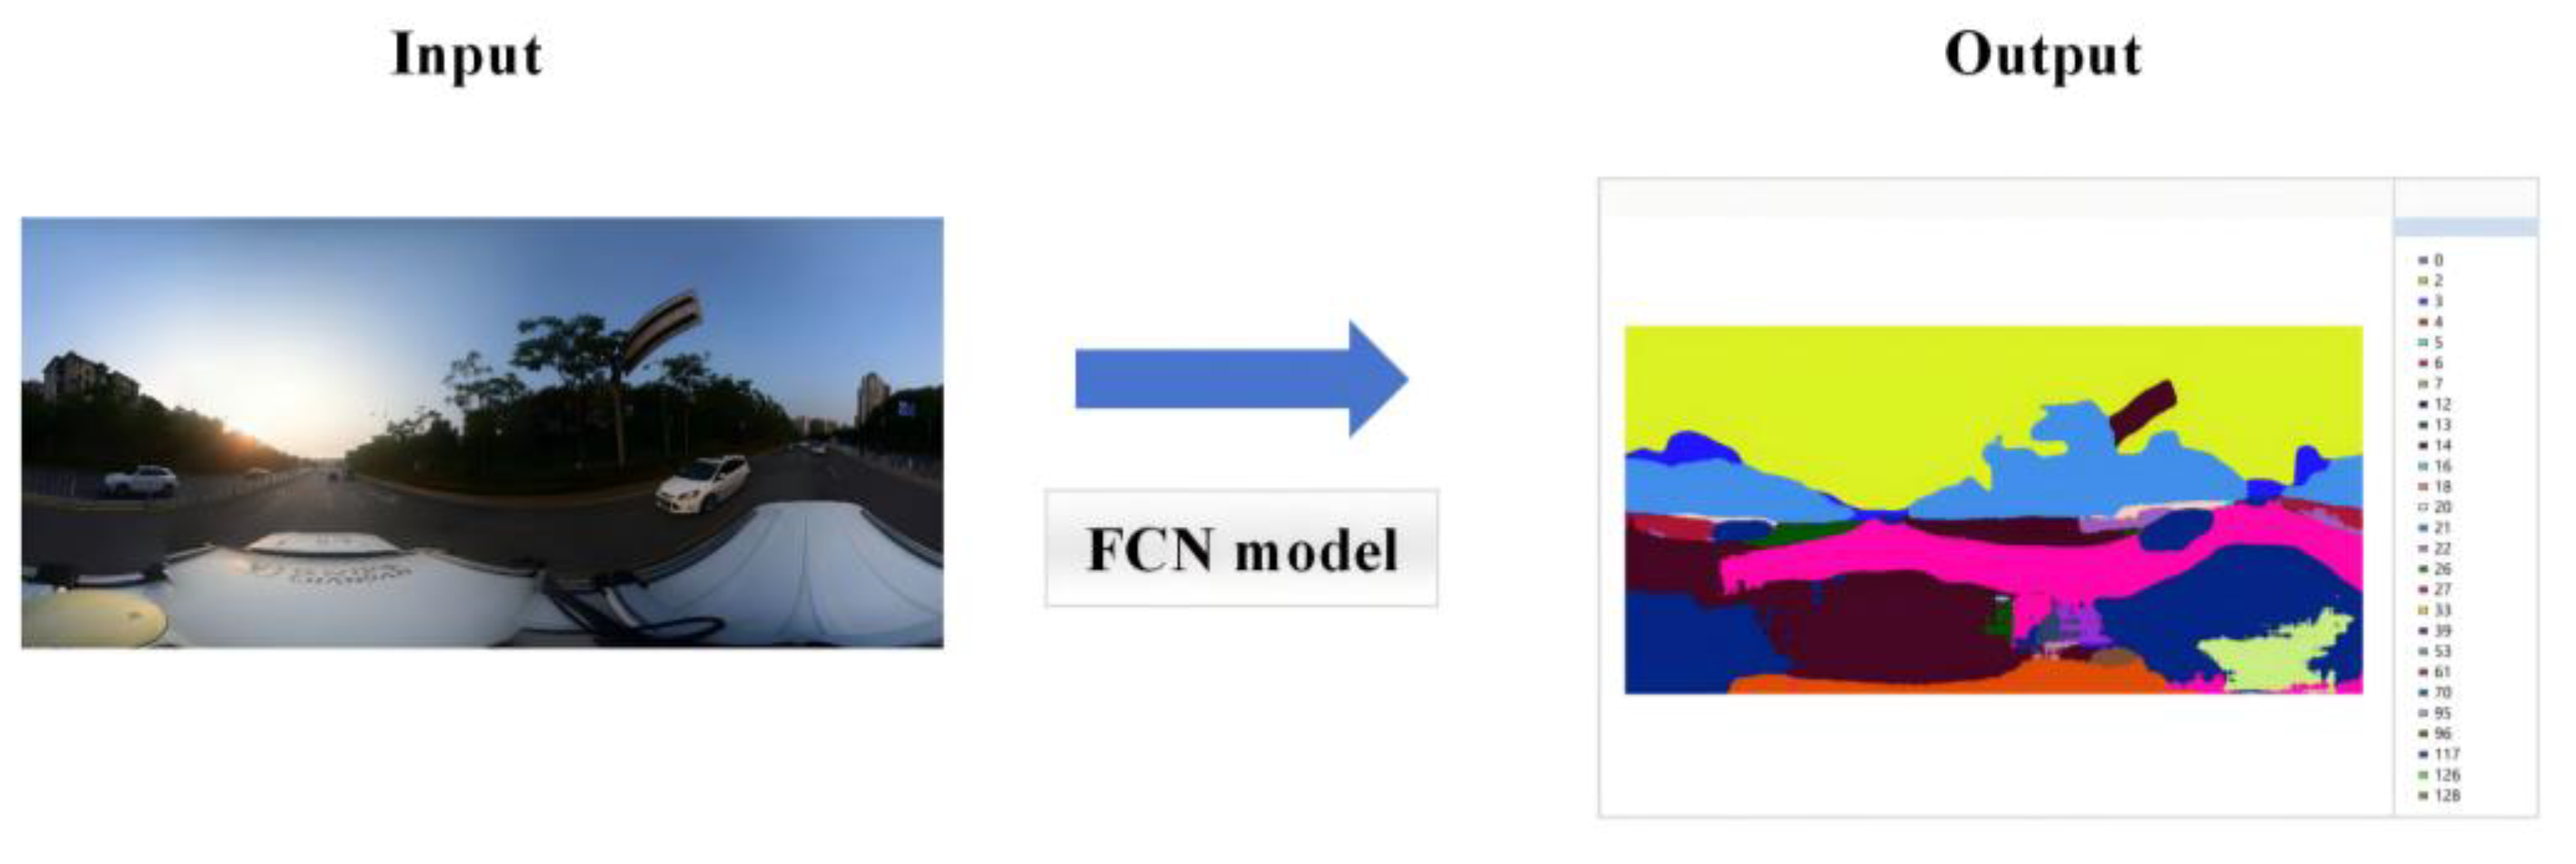
2.1.2. Extraction of Street View Elements
2.2. Construct Evaluation Indicators
2.2.1. Sky Visibility Index (SVI)
2.2.2. Green Visual Index (GVI)
2.2.3. Interface Enclosure Index (IEI)
2.2.4. Public–Facility Convenience Index (PCI)
2.2.5. Traffic Recognition (TR)
2.2.6. Motorization Degree (MD)
2.3. Quantifying Street Space Quality
3. Results
3.1. Evaluation Results Based on Physical Environment and Pedestrian Perception Dimensions
3.2. Evaluation Results Based on Six Factors
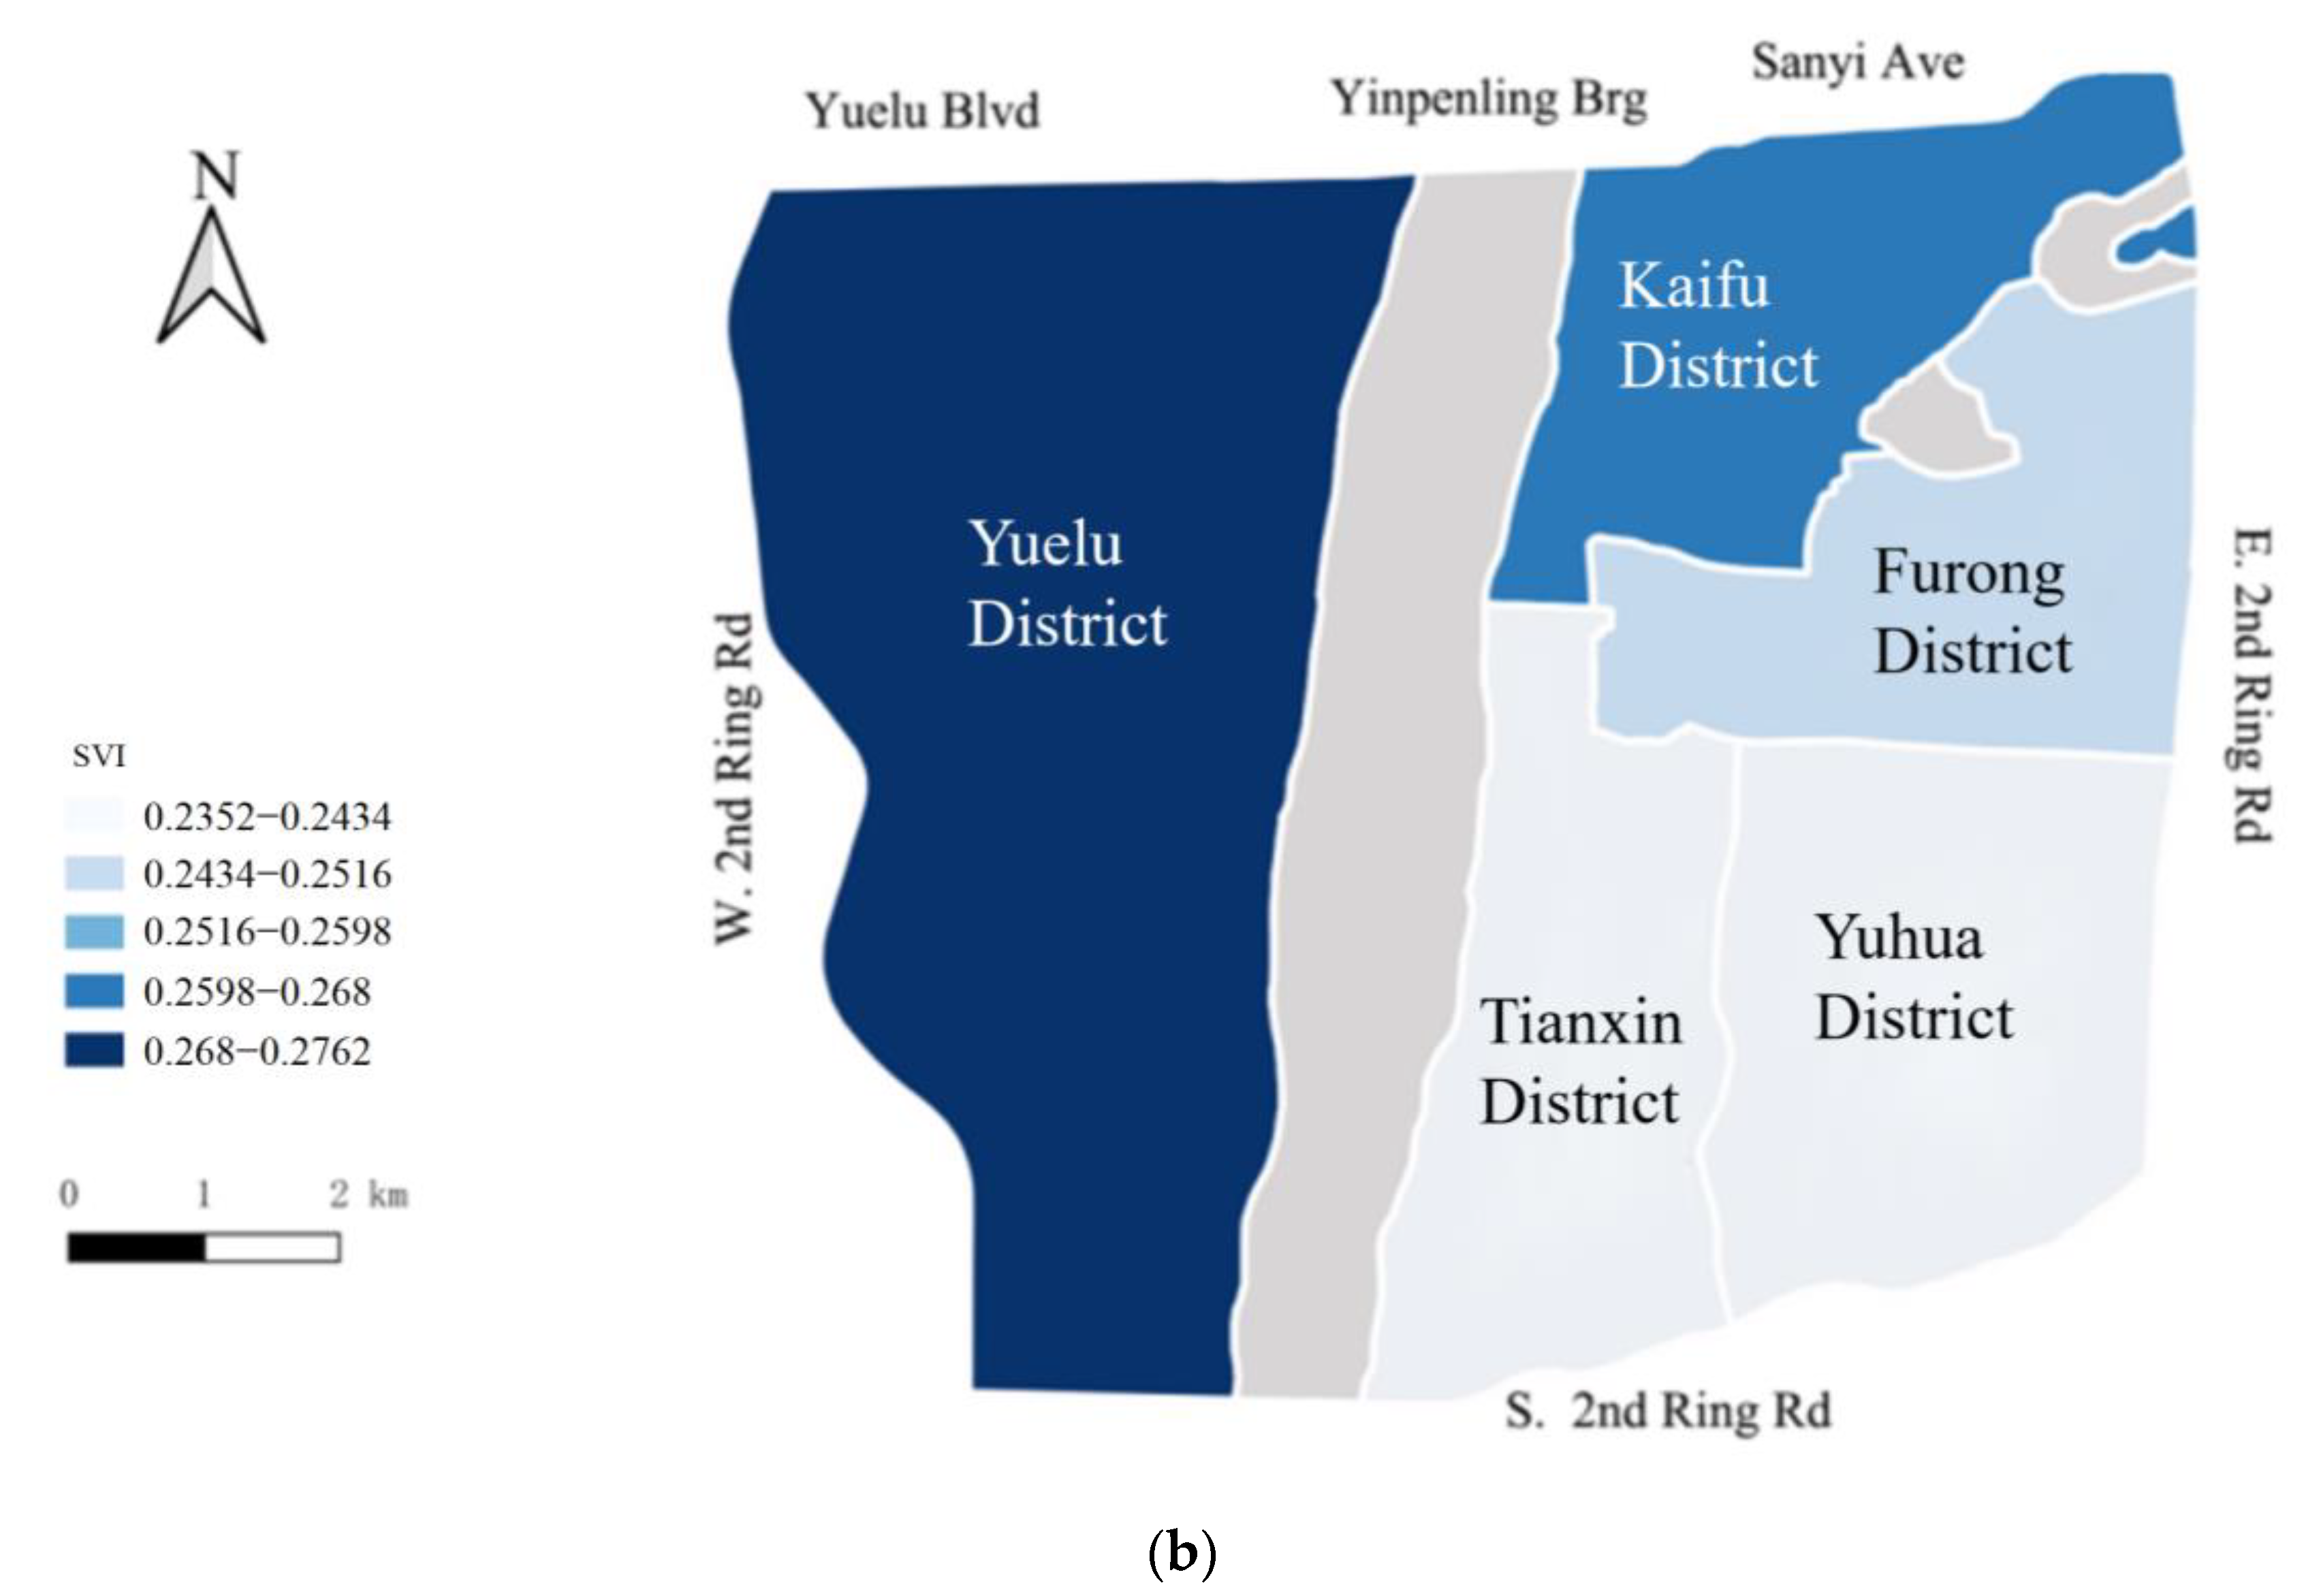
3.2.1. SVI
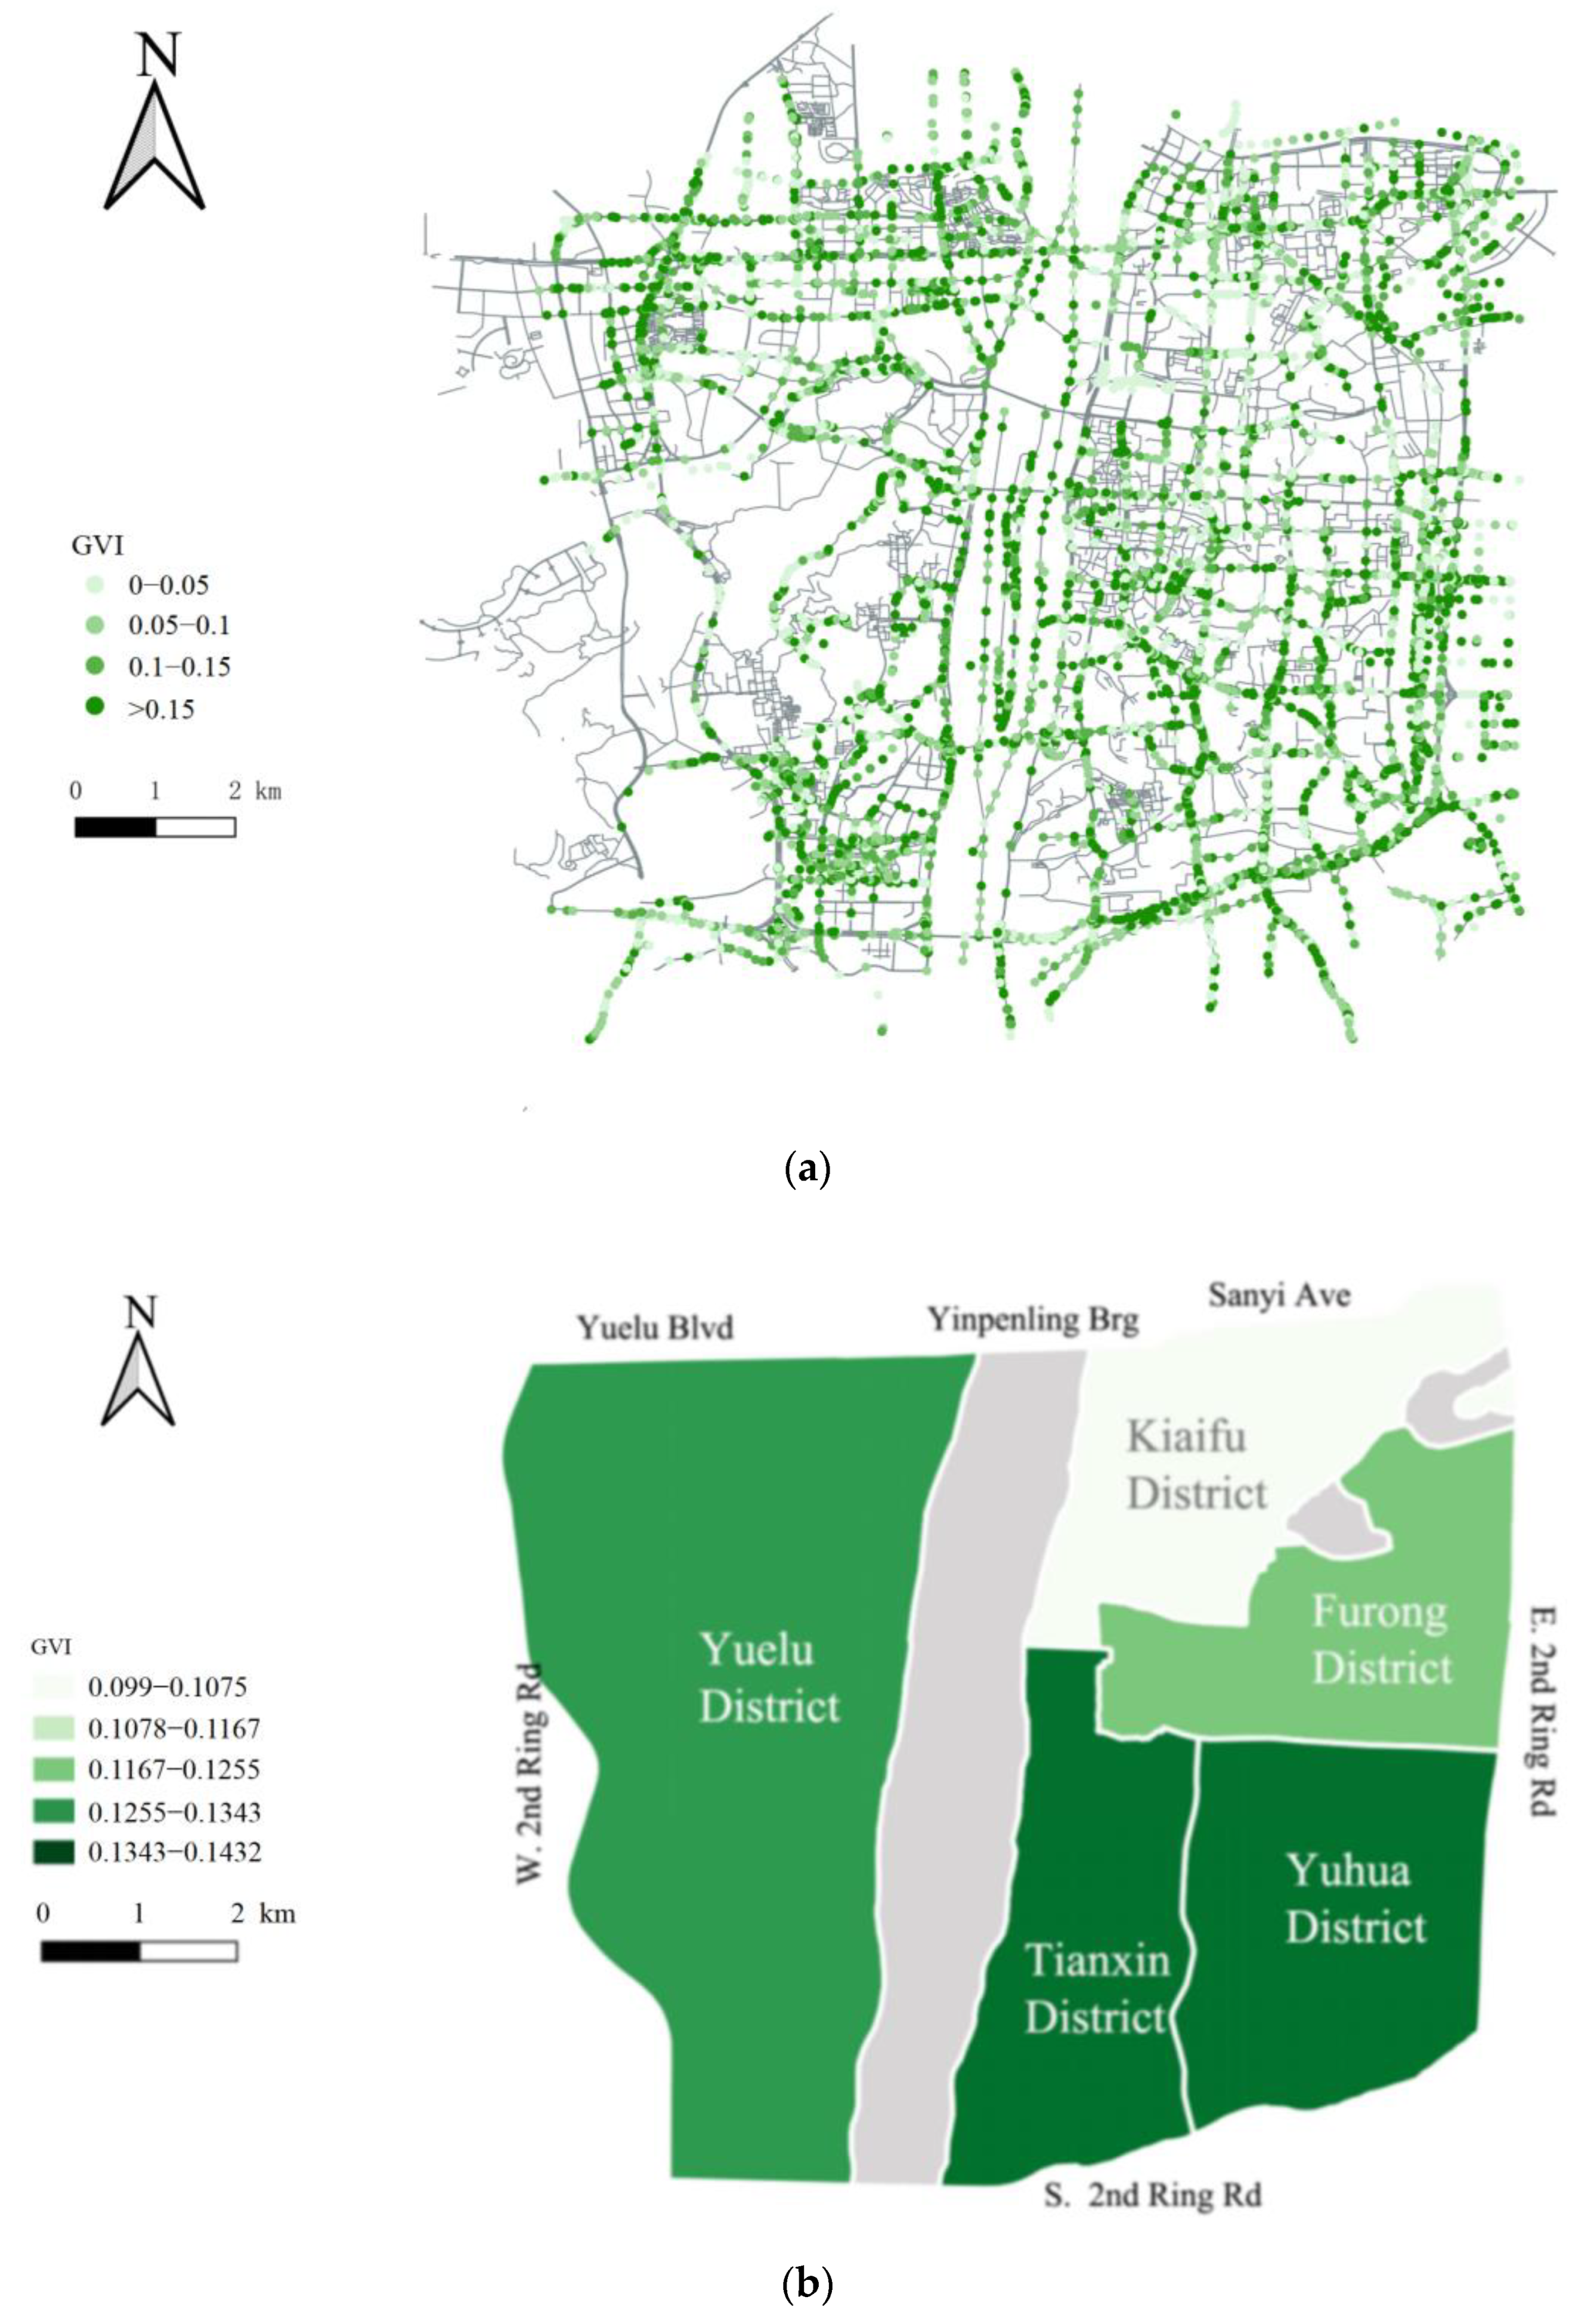
3.2.2. GVI
3.2.3. IEI
3.2.4. PCI
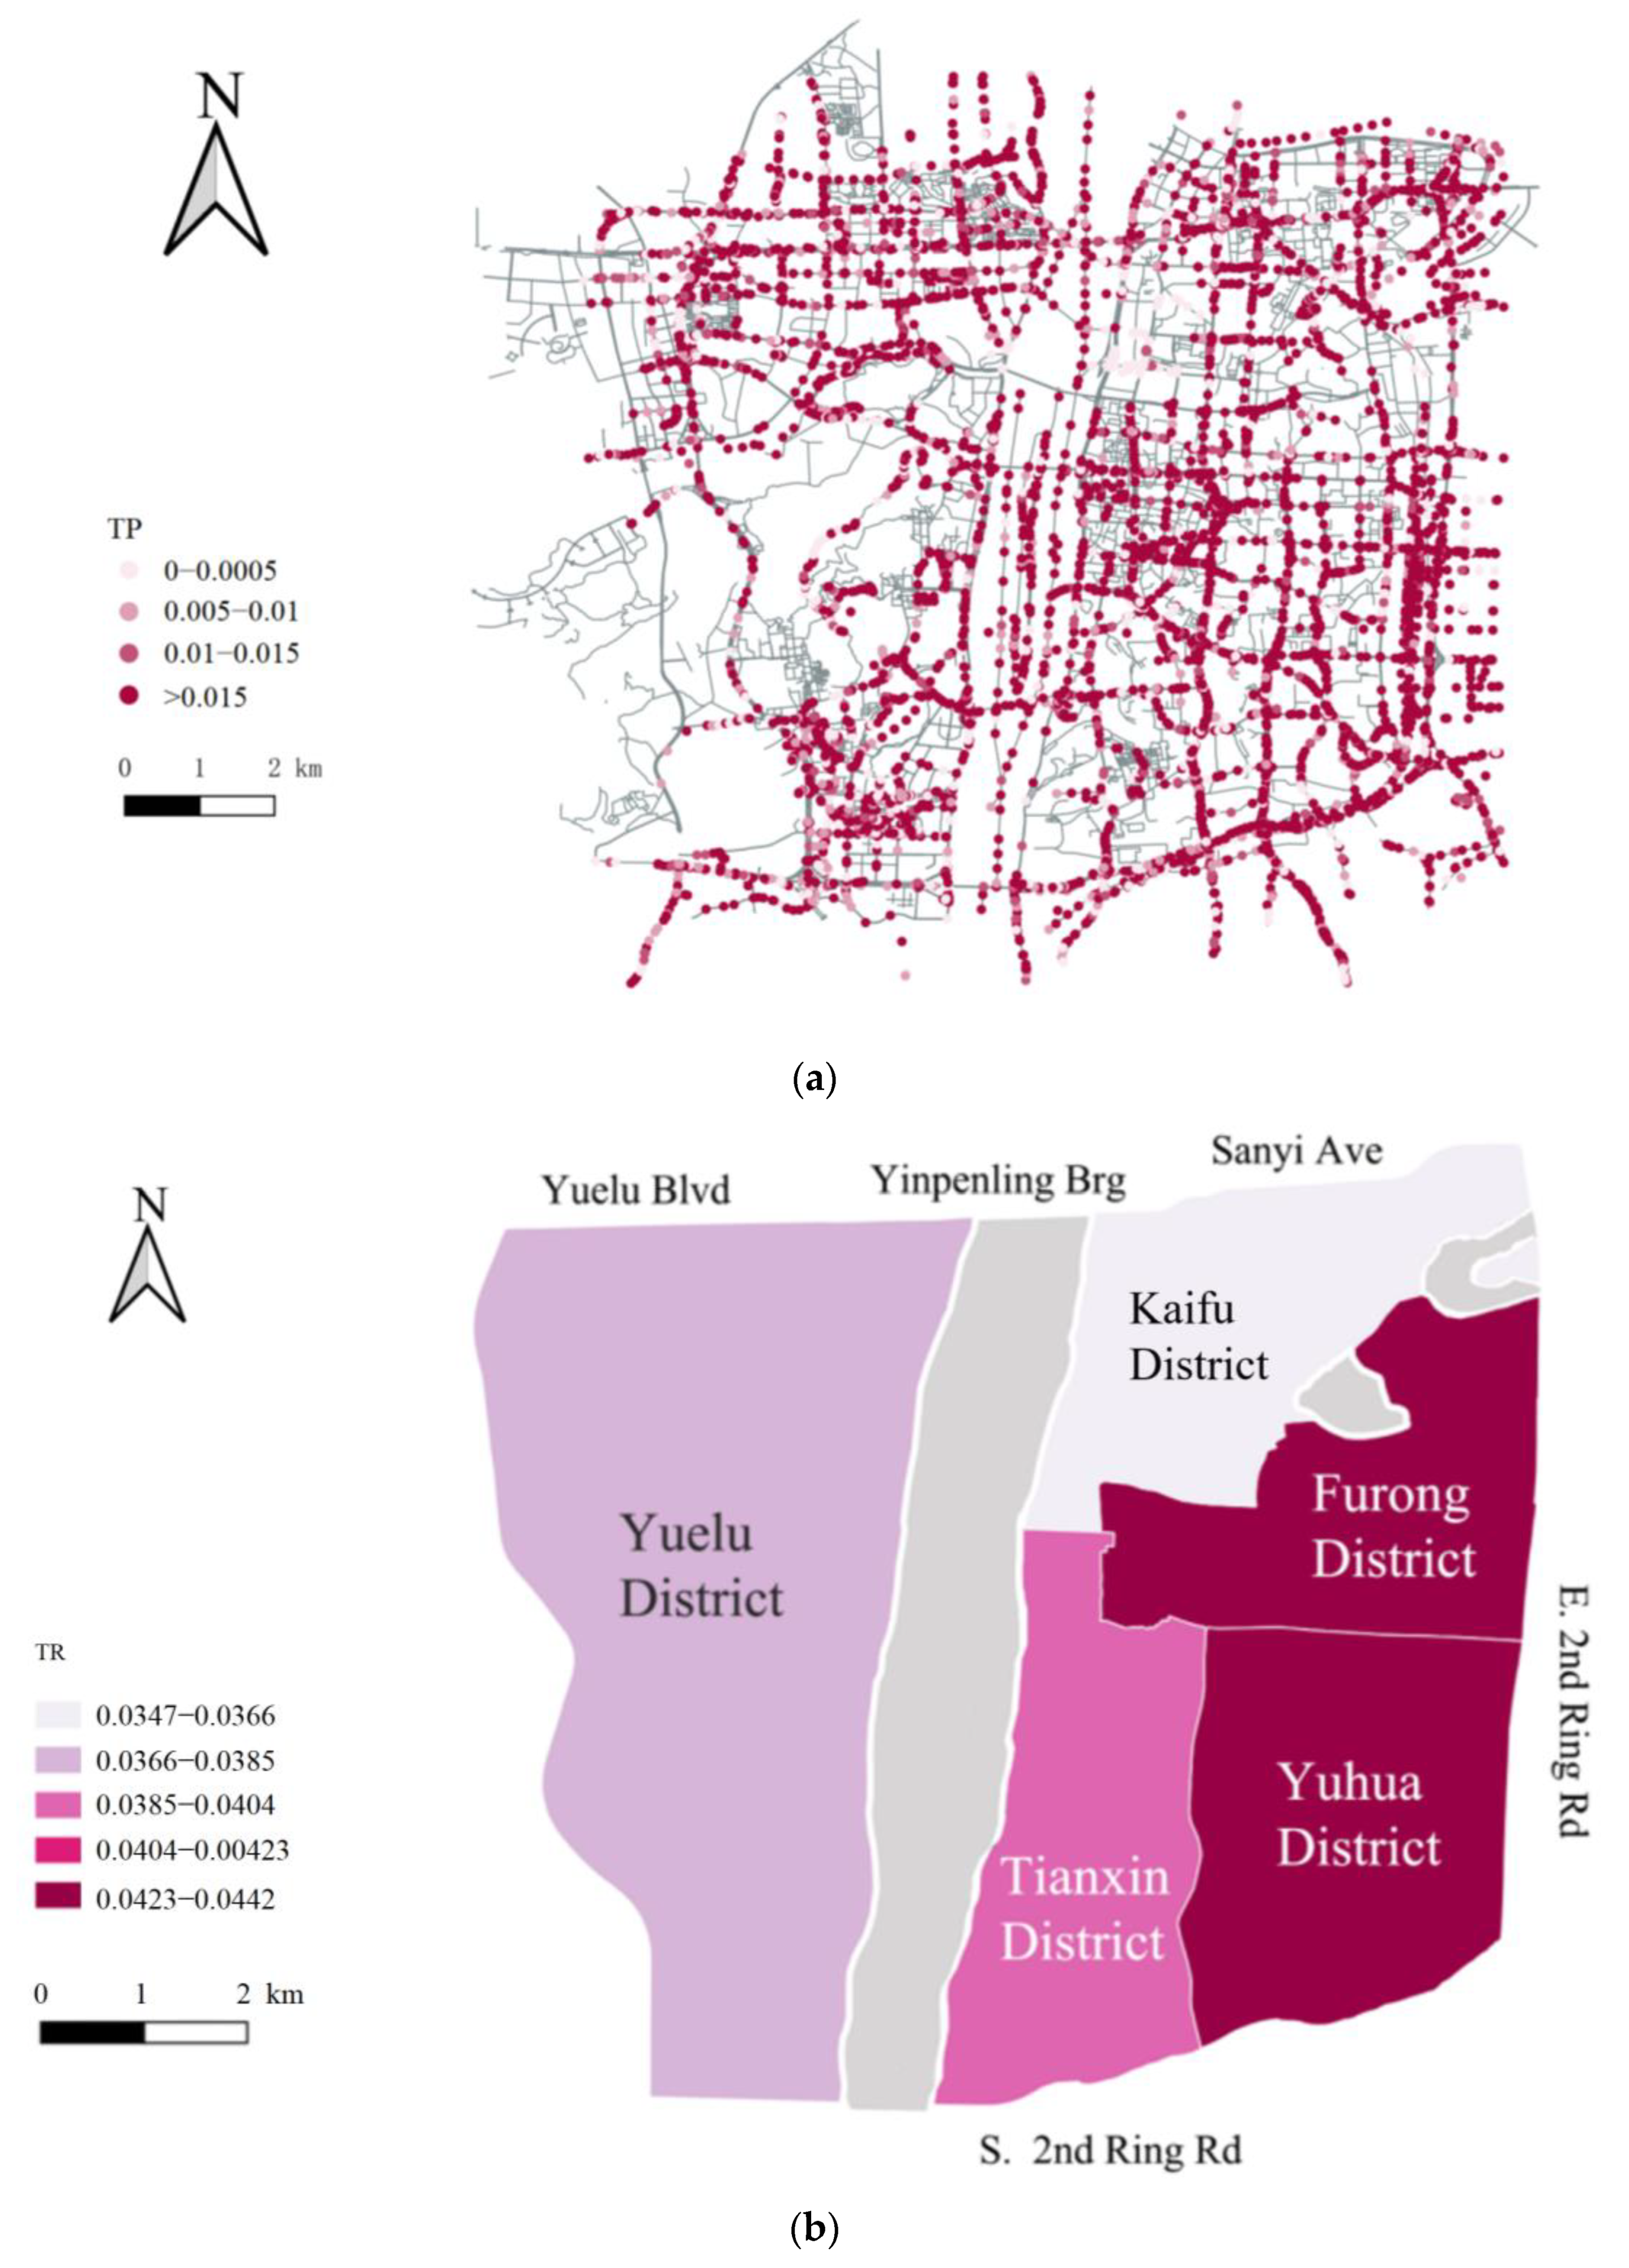
3.2.5. TR
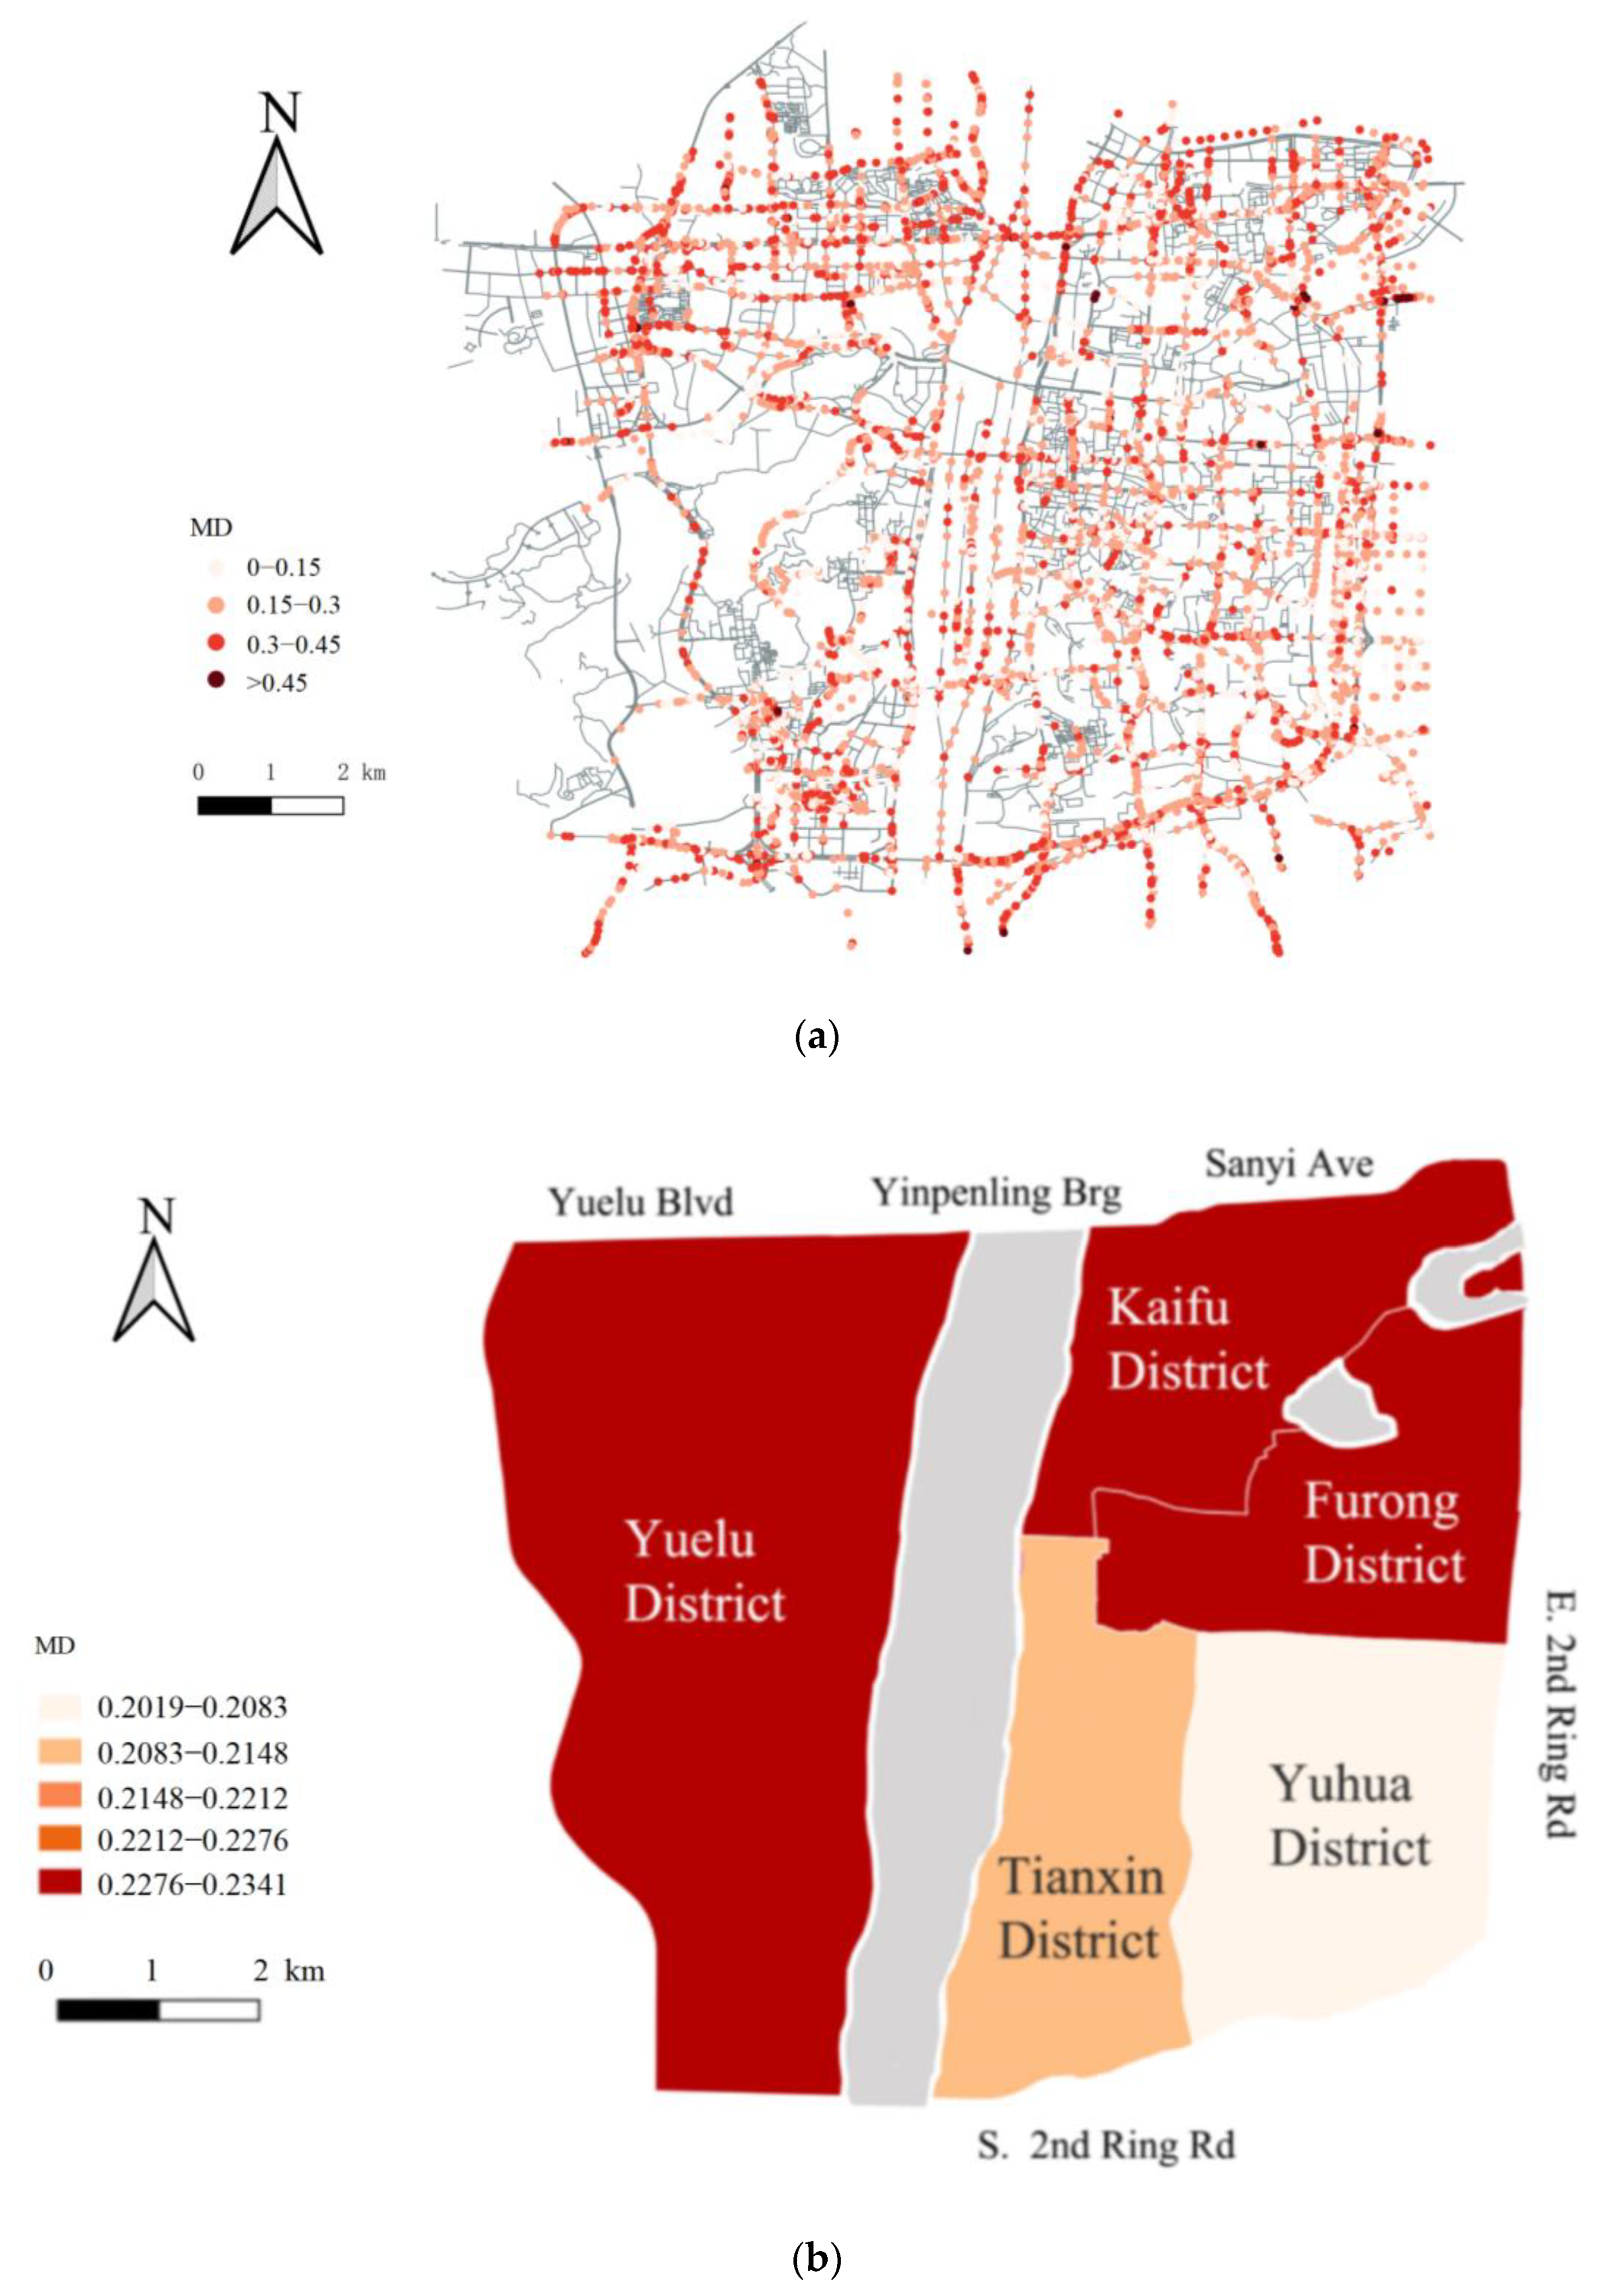
3.2.6. MD
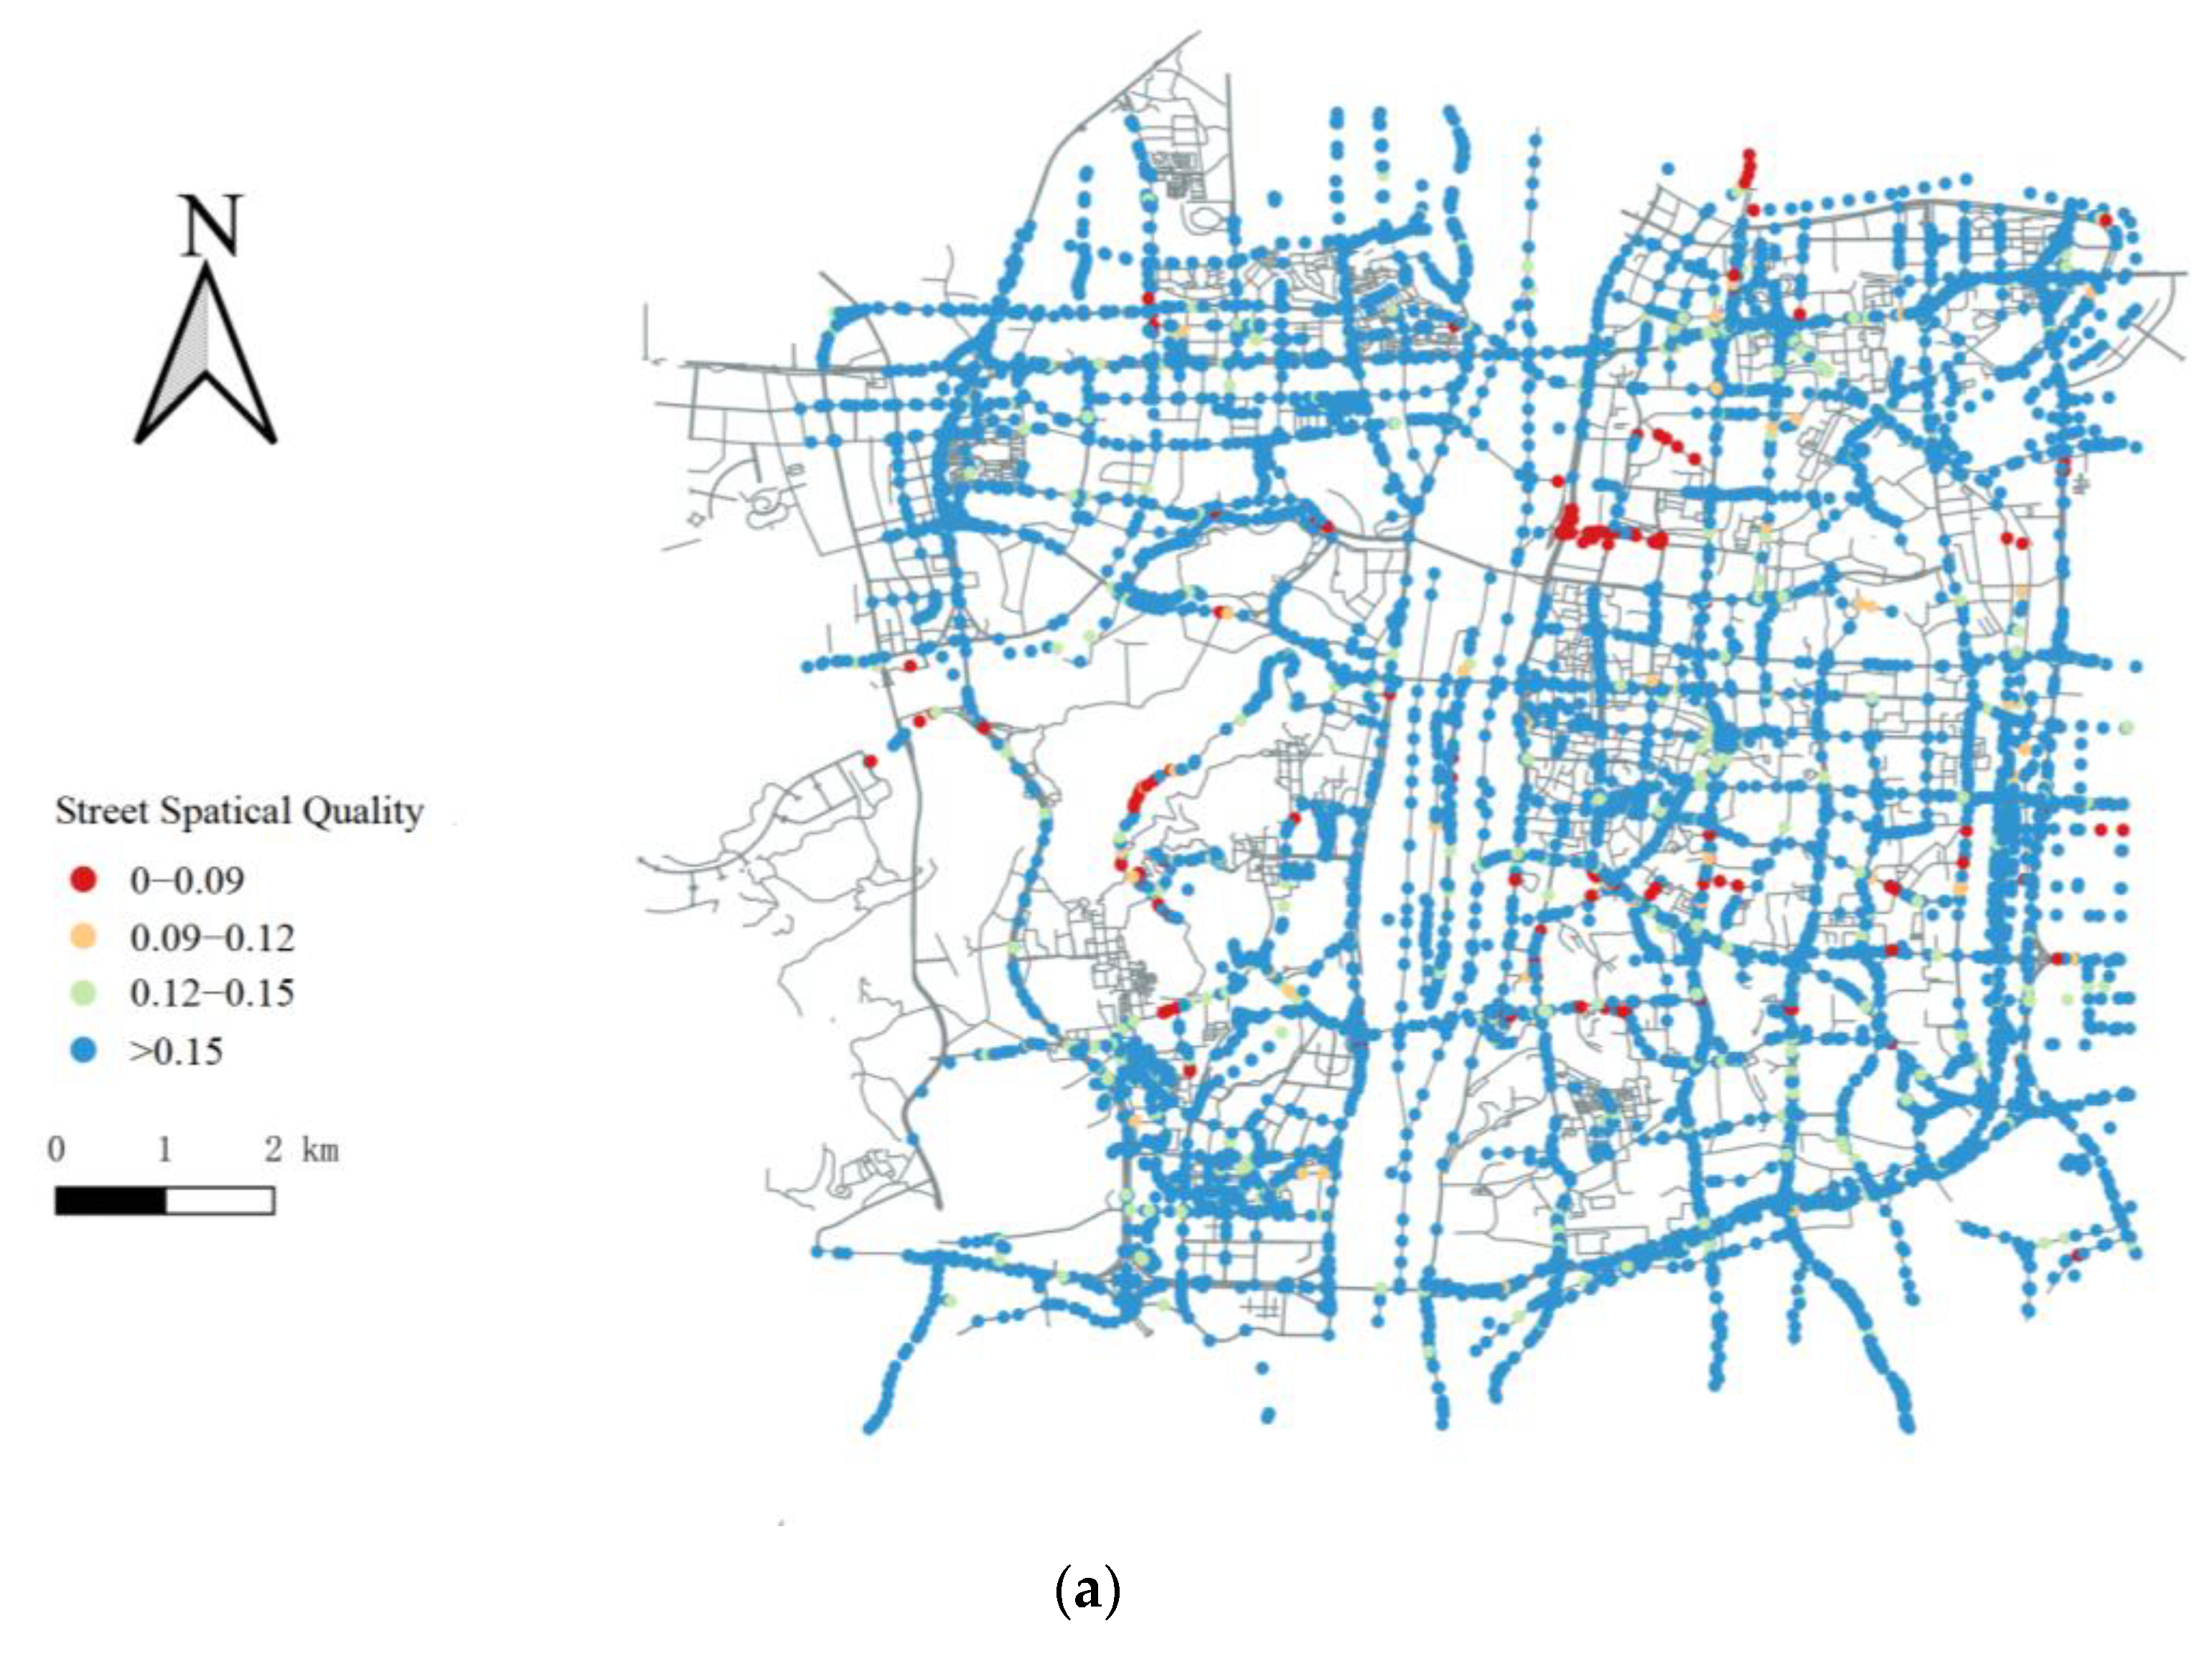
3.3. Street Spatial Quality
4. Discussion
- Considering the limited accuracy of the image semantic segmentation tool used, the SVIs acquired from 2019, and some missing images, the precision of the research conclusions may be affected.
- The SVI studied in this paper is not calculated using fisheye images but uses static panoramic street views to align with the most direct perspective of the pedestrian [42]. Because panoramic images might have overlapping pixels, research results can only reflect reality qualitatively.
- It is convenient and efficient to use the image semantic segmentation method to study the quality of street space. However, the environment of street space is relatively complex and is affected by factors such as illumination or occlusion. There will be a certain deviation between the recognition results and the true value.
- The contents of this study have mutual influences, such as the mutual constraints between IEI and SVI and the correlation between MD and TR. Hence, the research results have certain limitations.
- The research scope of this study does not cover the complete administrative area, and the research results can only reflect the street space quality of some spaces in different administrative areas.
5. Conclusions
- Over 70% of the observation points have a high SVI, while the average IEI is 27.09%, which is relatively low. In particular, in the commercial area east of the river within the Second Ring Road, the SVI is low, and the IEI is relatively high, indicating crowded buildings. Since the IEI and SVI are two factors that affect each other, they should be considered collectively to optimize both to a higher level.
- The average GVI is 12.59%, which is relatively low, and the average PCI is 0.48%. This indicates that the greenery within the human field of vision is not sufficient, and the block construction is still subpar. The GVI of Kaifu District is 9.90%, with a PCI of 0.39%, which is the lowest level within the study area. It is suggested that further greenery in street spaces and neighborhood facilities be improved to enhance comfort and convenience.
- The TR is high, with an average of 3.90%, ensuring safety and convenience for the public. And a low MD, with an average of 22.72%. The MD of the five administrative regions ranges from 20.19% to 23.41%, showing minimal differences. This implies potential traffic congestion in the entire study area, necessitating more appropriate road planning.
- In total, 66.52% of observation points have relatively high or high levels of street space quality. Observation points with lower or relatively lower levels are mainly distributed in the southern section of the East Second Ring Road and the Wujialing area on the east bank of the Xiangjiang River. Improvement in various aspects of streets based on the scores in other evaluation indicators within this region is required.
- Overall, the street space quality within the research scope is high, averaging 12.81%. However, only 19.11% of observation points have reached a high quality, and 33.48% still need to reach a higher level. Compared to other areas, the commercial area east of the river has denser buildings, lower levels of greenery, and more congested roads, which necessitates improvements in pedestrian perception. Other areas have significant advantages in terms of pedestrian perception but require enhancements in community public facilities and traffic signage.
Author Contributions
Funding
Institutional Review Board Statement
Informed Consent Statement
Data Availability Statement
Conflicts of Interest
References
- Deng, Z.; Chen, Y.; Yang, J.; Chen, Z. Archetype identification and urban building energy modeling for city-scale buildings based on GIS datasets. Build. Simul. 2022, 15, 1547–1559. [Google Scholar] [CrossRef]
- Wang, L.; Han, X.; He, J.; Jung, T. Measuring residents’ perceptions of city streets to inform better street planning through deep learning and space syntax. ISPRS J. Photogramm. Remote Sens. 2022, 190, 215–230. [Google Scholar] [CrossRef]
- Doğan, U. A comparison of space quality in streets in the context of public open space design: The example of Izmir, Barcelona, and Liverpool. J. Urban Aff. 2023, 45, 1282–1315. [Google Scholar] [CrossRef]
- Li, Y.; Peng, L.; Wu, C.; Zhang, J. Street View Imagery (SVI) in the Built Environment: A Theoretical and Systematic Review. Buildings 2022, 12, 1167. [Google Scholar] [CrossRef]
- Santosa, H.; Ernawati, J.; Wulandari, L.D. Visual quality evaluation of urban commercial streetscape for the development of landscape visual planning system in provincial street corridors in Malang, Indonesia. IOP Conf. Ser. Earth Environ. Sci. 2018, 126, 012202. [Google Scholar] [CrossRef]
- Zhang, L.; Xu, X.; Guo, Y. Comprehensive Evaluation of the Implementation Effect of Commercial Street Quality Improvement Based on AHP-Entropy Weight Method—Taking Hefei Shuanggang Old Street as an Example. Land 2022, 11, 2091. [Google Scholar] [CrossRef]
- Itma, M.; Monna, S. The Role of Collective Spaces in Achieving Social Sustainability: A Comparative Approach to Enhance Urban Design. Sustainability 2022, 14, 8756. [Google Scholar] [CrossRef]
- Gorgul, E.; Chen, C.; Wu, K.K.; Guo, Y. Measuring street enclosure and its influence to human physiology through wearable sensors. In Proceedings of the 2019 ACM International Joint Conference on Pervasive and Ubiquitous Computing and Proceedings of the 2019 ACM International Symposium on Wearable Computers, ACM, London, UK, 9–13 September 2019; pp. 65–68. [Google Scholar] [CrossRef]
- Salam, R.D.; Oluwatimilehin, I.A.; Ayanlade, A. Spatial analysis of urban expansion, land-use dynamics and its effects on land surface temperature in Oyo town, Southwestern Nigeria. City Built Environ. 2023, 1, 15. [Google Scholar] [CrossRef]
- Zeng, Q.; Bao, X.; Dewancker, B.J. Association between built environment on transport and recreational walking in Japan: The case of Kitakyushu. City Built Environ. 2023, 1, 10. [Google Scholar] [CrossRef]
- Peng, C.; Chen, Z.; Yang, J.; Liu, Z.; Yan, D.; Chen, Y. Assessment of electricity consumption reduction potential for city-scale buildings under different demand response strategies. Energy Build. 2023, 297, 113473. [Google Scholar] [CrossRef]
- Yang, J.; Deng, Z.; Guo, S.; Chen, Y. Development of bottom-up model to estimate dynamic carbon emission for city-scale buildings. Appl. Energy 2023, 331, 120410. [Google Scholar] [CrossRef]
- Yang, J.; Zhang, Q.; Peng, C.; Chen, Y. AutoBPS-Prototype: A web-based toolkit to automatically generate prototype building energy models with customizable efficiency values in China. Energy Build. 2024, 305, 113880. [Google Scholar] [CrossRef]
- Chen, Q.; Zhang, Z.; Chen, S.; Wen, S.; Ma, H.; Xu, Z. A self-attention based global feature enhancing network for semantic segmentation of large-scale urban street-level point clouds. Int. J. Appl. Earth Obs. Geoinf. 2022, 113, 102974. [Google Scholar] [CrossRef]
- Jiang, Y.; Han, Y.; Liu, M.; Ye, Y. Street vitality and built environment features: A data-informed approach from fourteen Chinese cities. Sustain. Cities Soc. 2022, 79, 103724. [Google Scholar] [CrossRef]
- Sigala, E.; Alepis, E.; Patsakis, C. Measuring the Quality of Street Surfaces in Smart Cities through Smartphone Crowdsensing. In Proceedings of the 2020 11th International Conference on Information, Intelligence, Systems and Applications (IISA), Piraeus, Greece, 15–17 July 2020; pp. 1–8. [Google Scholar] [CrossRef]
- Huang, B.; Wang, J. Big spatial data for urban and environmental sustainability. Geo-Spat. Inf. Sci. 2020, 23, 125–140. [Google Scholar] [CrossRef]
- Feng, G.; Zou, G.; Piga, B.E.A.; Hu, H. The Validity of Street View Service Applied to Ambiance Perception of Street: A Comparison of Assessment in Real Site and Baidu Street View. In Advances in Industrial Design; Shin, C.S., Di Bucchianico, G., Fukuda, S., Ghim, Y.-G., Montagna, G., Carvalho, C., Eds.; Springer International Publishing: Cham, Switzerland, 2021; pp. 740–748. [Google Scholar] [CrossRef]
- Liu, M.; Han, L.; Xiong, S.; Qing, L.; Ji, H.; Peng, Y. Large-Scale Street Space Quality Evaluation Based on Deep Learning Over Street View Image. In Image and Graphics; Zhao, Y., Barnes, N., Chen, B., Westermann, R., Kong, X., Lin, C., Eds.; Springer International Publishing: Cham, Switzerland, 2019; pp. 690–701. [Google Scholar] [CrossRef]
- Gonzalez, D.; Rueda-Plata, D.; Acevedo, A.B.; Duque, J.C.; Ramos-Pollán, R.; Betancourt, A.; García, S. Automatic detection of building typology using deep learning methods on street level images. Build. Environ. 2020, 177, 106805. [Google Scholar] [CrossRef]
- Sun, D.; Ji, X.; Gao, W.; Zhou, F.; Yu, Y.; Meng, Y.; Yang, M.; Lin, J.; Lyu, M. The Relation between Green Visual Index and Visual Comfort in Qingdao Coastal Streets. Buildings 2023, 13, 457. [Google Scholar] [CrossRef]
- Zhong, T.; Ye, C.; Wang, Z.; Tang, G.; Zhang, W.; Ye, Y. City-Scale Mapping of Urban Façade Color Using Street-View Imagery. Remote Sens. 2021, 13, 1591. [Google Scholar] [CrossRef]
- Mo, Y.; Wu, Y.; Yang, X.; Liu, F.; Liao, Y. Review the state-of-the-art technologies of semantic segmentation based on deep learning. Neurocomputing 2022, 493, 626–646. [Google Scholar] [CrossRef]
- Dai, L.; Zheng, C.; Dong, Z.; Yao, Y.; Wang, R. Analyzing the correlation between visual space and residents’ psychology in Wuhan, China using street-view images and deep-learning technique. City Environ. Interact. 2021, 11, 100069. [Google Scholar] [CrossRef]
- Weng, X.; Yan, Y.; Dong, G.; Shu, C.; Wang, B.; Wang, H.; Zhang, J. Deep Multi-Branch Aggregation Network for Real-Time Semantic Segmentation in Street Scenes. IEEE Trans. Intell. Transport. Syst. 2022, 23, 17224–17240. [Google Scholar] [CrossRef]
- Wang, R.; Ren, S.; Zhang, J.; Yao, Y.; Wang, Y.; Guan, Q. A comparison of two deep-learning-based urban perception models: Which one is better? Comput. Urban Sci. 2021, 1, 3. [Google Scholar] [CrossRef]
- Cai, Y.; Zong, W.; Jiao, S.; Wang, Z.; Ou, L. Land-Use Assessment and Trend Simulation from a Resilient Urban Perspective: A Case Study of Changsha City. Sustainability 2023, 15, 13890. [Google Scholar] [CrossRef]
- Chen, Y.; Zhang, Q.; Deng, Z.; Fan, X.; Xu, Z.; Kang, X.; Pan, K.; Guo, Z. Research on Green View Index of Urban Roads Based on Street View Image Recognition: A Case Study of Changsha Downtown Areas. Sustainability 2022, 14, 16063. [Google Scholar] [CrossRef]
- Lyu, M.; Meng, Y.; Gao, W.; Yu, Y.; Ji, X.; Li, Q.; Huang, G.; Sun, D. Measuring the perceptual features of coastal streets: A case study in Qingdao, China. Environ. Res. Commun. 2022, 4, 115002. [Google Scholar] [CrossRef]
- Wan, T.; Lu, W.; Sun, P. Constructing the Quality Measurement Model of Street Space and Its Application in the Old Town in Wuhan. Front. Public Health 2022, 10, 816317. [Google Scholar] [CrossRef] [PubMed]
- Nagata, S.; Nakaya, T.; Hanibuchi, T.; Amagasa, S.; Kikuchi, H.; Inoue, S. Objective scoring of streetscape walkability related to leisure walking: Statistical modeling approach with semantic segmentation of Google Street View images. Health Place 2020, 66, 102428. [Google Scholar] [CrossRef]
- Millstein, R.A.; Cain, K.L.; Sallis, J.F.; Conway, T.L.; Geremia, C.; Frank, L.D.; Chapman, J.; Van Dyck, D.; Dipzinski, L.R.; Kerr, J.; et al. Development, scoring, and reliability of the Microscale Audit of Pedestrian Streetscapes (MAPS). BMC Public Health 2013, 13, 403. [Google Scholar] [CrossRef]
- Yu, Y.; Jiang, T.; Li, Y.; Guan, H.; Li, D.; Chen, L.; Yu, C.; Gao, L.; Gao, S.; Li, J. SignHRNet: Street-level traffic signs recognition with an attentive semi-anchoring guided high-resolution network. ISPRS J. Photogramm. Remote Sens. 2022, 192, 142–160. [Google Scholar] [CrossRef]
- Tao, J.; Yang, M.; Wu, J. Coupling Coordination Evaluation of Lakefront Landscape Spatial Quality and Public Sentiment. Land 2022, 11, 865. [Google Scholar] [CrossRef]
- Akbarishahabi, L. Examining the Relationship Between Enclosure Ratio of Street and Skyline’s Complexity. Int. J. Archit. Plan. 2021, 9, 851–873. [Google Scholar] [CrossRef]
- Zhang, L.; Ye, Y.; Zeng, W.; Chiaradia, A. A Systematic Measurement of Street Quality through Multi-Sourced Urban Data: A Human-Oriented Analysis. Int. J. Environ. Res. Public Health 2019, 16, 1782. [Google Scholar] [CrossRef] [PubMed]
- Duan, J.; Liao, J.; Liu, J.; Gao, X.; Shang, A.; Huang, Z. Evaluating the Spatial Quality of Urban Living Streets: A Case Study of Hengyang City in Central South China. Sustainability 2023, 15, 10623. [Google Scholar] [CrossRef]
- Wu, B.; Yu, B.; Shu, S.; Liang, H.; Zhao, Y.; Wu, J. Mapping fine-scale visual quality distribution inside urban streets using mobile LiDAR data. Build. Environ. 2021, 206, 108323. [Google Scholar] [CrossRef]
- Yao, Y.; Liang, Z.; Yuan, Z.; Liu, P.; Bie, Y.; Zhang, J.; Wang, R.; Wang, J.; Guan, Q. A human-machine adversarial scoring framework for urban perception assessment using street-view images. Int. J. Geogr. Inf. Sci. 2019, 33, 2363–2384. [Google Scholar] [CrossRef]
- Ning, M.; Yu, Y.; Jiang, H.; Gao, Q. Research on Dynamic Evaluation of Urban Community Livability Based on Multi-Source Spatio-Temporal Data. In Proceedings of the 2018 26th International Conference on Geoinformatics, Kunming, China, 28–30 June 2018; pp. 1–6. [Google Scholar] [CrossRef]
- Kumar, R.; Singh, S.; Bilga, P.S.; Jatin; Singh, J.; Singh, S.; Scutaru, M.-L.; Pruncu, C.I. Revealing the benefits of entropy weights method for multi-objective optimization in machining operations: A critical review. J. Mater. Res. Technol. 2021, 10, 1471–1492. [Google Scholar] [CrossRef]
- Zhang, J.; Ansari, R.; Chen, X.; Campagne, J.-E.; Magneville, C.; Wu, F. Sky reconstruction from transit visibilities: PAON-4 and Tianlai dish array. Mon. Not. R. Astron. Soc. 2016, 461, 1950–1966. [Google Scholar] [CrossRef]


| Evaluation Rank | Low | Relatively Low | Relatively High | High |
|---|---|---|---|---|
| SVI | ≤10% | 10~15% | 15~20% | ≥20% |
| GVI | ≤5% | 5~10% | 10~15% | ≥15% |
| IEI | ≤15% | 15~30% | 30~45% | ≥45% |
| PCI | ≤1% | 1~2% | 2~3% | ≥3% |
| TR | ≤0.5% | 0.5~1% | 1~1.5% | ≥1.5% |
| MD | ≤15% | 15~30% | 30~45% | ≥45% |
| Street spatial quality | ≤9% | 9~12% | 12~15% | ≥15% |
| Establishing Dimensions | Indicators | Weights | Related Attributes |
|---|---|---|---|
| Pedestrian Perception | SVI | 0.2090 | Positive correlation |
| GVI | 0.1836 | Positive correlation | |
| IEI | 0.1995 | Negative correlation | |
| Physical Environment | PCI | 0.0488 | Positive correlation |
| TR | 0.1566 | Positive correlation | |
| MD | 0.2025 | Negative correlation |
| Low | Relatively Low | Relatively High | High | ||
|---|---|---|---|---|---|
| SVI (26.15%) 1 | Number of sites | 817 | 536 | 986 | 5708 |
| Proportion | 10.15% | 6.66% | 12.25% | 70.93% | |
| GVI (12.61%) 2 | Number of sites | 2150 | 1836 | 1380 | 2681 |
| Proportion | 26.72% | 22.82% | 17.15% | 33.32% | |
| IEI (27.08%) 3 | Number of sites | 1222 | 3597 | 2765 | 463 |
| Proportion | 15.19% | 44.70% | 34.36% | 5.75% | |
| PCI (0.48%) 4 | Number of sites | 6833 | 655 | 285 | 274 |
| Proportion | 84.91% | 8.14% | 3.54% | 3.40% | |
| TR (3.90%) 5 | Number of Sites | 1145 | 717 | 636 | 5549 |
| Proportion | 14.23% | 8.91% | 7.90% | 68.96% | |
| MD (22.72%) 6 | Number of Sites | 2204 | 3579 | 2210 | 54 |
| Proportion | 27.39% | 44.48% | 27.46% | 0.67% | |
| Street Spatial Quality | Number of Sites | 717 | 1977 | 3815 | 1538 |
| Proportion | 8.91% | 24.57% | 47.41% | 19.11% | |
Disclaimer/Publisher’s Note: The statements, opinions and data contained in all publications are solely those of the individual author(s) and contributor(s) and not of MDPI and/or the editor(s). MDPI and/or the editor(s) disclaim responsibility for any injury to people or property resulting from any ideas, methods, instructions or products referred to in the content. |
© 2024 by the authors. Licensee MDPI, Basel, Switzerland. This article is an open access article distributed under the terms and conditions of the Creative Commons Attribution (CC BY) license (https://creativecommons.org/licenses/by/4.0/).
Share and Cite
Gao, L.; Xiang, X.; Chen, W.; Nong, R.; Zhang, Q.; Chen, X.; Chen, Y. Research on Urban Street Spatial Quality Based on Street View Image Segmentation. Sustainability 2024, 16, 7184. https://doi.org/10.3390/su16167184
Gao L, Xiang X, Chen W, Nong R, Zhang Q, Chen X, Chen Y. Research on Urban Street Spatial Quality Based on Street View Image Segmentation. Sustainability. 2024; 16(16):7184. https://doi.org/10.3390/su16167184
Chicago/Turabian StyleGao, Liying, Xingchao Xiang, Wenjian Chen, Riqin Nong, Qilin Zhang, Xuan Chen, and Yixing Chen. 2024. "Research on Urban Street Spatial Quality Based on Street View Image Segmentation" Sustainability 16, no. 16: 7184. https://doi.org/10.3390/su16167184
APA StyleGao, L., Xiang, X., Chen, W., Nong, R., Zhang, Q., Chen, X., & Chen, Y. (2024). Research on Urban Street Spatial Quality Based on Street View Image Segmentation. Sustainability, 16(16), 7184. https://doi.org/10.3390/su16167184