Article

Optimal Machine Learning Model to Predict Demolition Waste Generation for a Circular Economy

1
Academic-Research Digital Convergence Scale-Up Platform Center, Kyungpook National University, Daegu 41566, Republic of Korea
2
Industry Academic Cooperation Foundation, Kyungpook National University, Daegu 41566, Republic of Korea
3
Division of Smart Safety Engineering, Dongguk University Wise Campus, Gyeongju 38066, Republic of Korea
*
Author to whom correspondence should be addressed.
Sustainability 2024, 16(16), 7064; https://doi.org/10.3390/su16167064
Submission received: 30 May 2024 / Revised: 7 August 2024 / Accepted: 14 August 2024 / Published: 17 August 2024

Abstract

:
A suitable waste-management strategy is crucial for a sustainable and efficient circular economy in the construction sector, and it requires precise data on the volume of demolition waste (DW) generated. Therefore, we developed an optimal machine learning model to forecast the quantity of recycling and landfill waste based on the characteristics of DW. We constructed a dataset comprising information on the characteristics of 150 buildings, demolition equipment utilized, and volume of five waste types generated (i.e., recyclable mineral, recyclable combustible, landfill specified, landfill mix waste, and recyclable minerals). We applied an artificial neural network, decision tree, gradient boosting machine, k-nearest neighbors, linear regression, random forest, and support vector regression. Further, we derived the optimal model through data preprocessing, input variable selection, and hyperparameter tuning. In both the validation and test phases, the “recyclable mineral waste” and “recyclable combustible waste” models achieved accuracies (R2) of 0.987 and 0.972, respectively. The “recyclable metals” and “landfill specified waste” models achieved accuracies (R2) of 0.953 and 0.858 or higher, respectively. Moreover, the “landfill mix waste” model exhibited an accuracy of 0.984 or higher. This study confirmed through Shapley Additive exPlanations analysis that the floor area is the most important input variable in the four models (i.e., recyclable mineral waste, recyclable combustible waste, recyclable metals, and landfill mix waste). Additionally, the type of equipment employed in demolition emerged as another crucial input variable impacting the volume of recycling and landfill waste generated. The results of this study can provide more detailed information on the generation of recycling and landfill waste. The developed model can provide precise data on waste management, thereby facilitating the decision-making process for industry professionals.

1. Introduction

The swift pace of industrialization and population growth has resulted in a surge in the production of solid waste [1,2]. Globally, the annual production of solid waste ranges from 7 to 9 trillion tons, with approximately 2 trillion tons estimated to be municipal solid waste (MSW) [3]. The worldwide production of MSW will reach 3.5 billion tons per year by 2050 [4]. Construction and demolition waste (CDW) accounts for more than 30% of the MSW generation worldwide [5,6], with Europe and the U.S. being responsible for 36% and 67% of the total generation volume, respectively [7]. The volume and composition of CDW differ across regions, with China, the U.S., and Europe being the primary contributors [8]. However, the recovery rate of CDW is not proportional to its generation volume and fluctuates significantly from 7% to 90% depending on the region [9]. Moreover, while 75% of global CDW could be recycled, approximately 35% is disposed of in landfills [10]. As the construction sector utilizes approximately 40% of the world’s raw materials [11], produces 40% of waste [12,13], and contributes to 25% of global carbon dioxide emissions [13,14], a low recovery rate of CDW implies that the industry lacks sustainability. Facilitated by a substantial recovery rate of CDW, recycling offers several benefits for sustainable development across social, environmental, and economic dimensions [15].
To achieve sustainable consumption and environmental integrity within the construction sector, stakeholders must cooperate within a circular economy framework. Such cooperation underscores the importance of acknowledging sustainable consumption and development initiatives as well as implementing effective systems and solutions to drive efficiency and promote sustainability within the architecture, construction, and engineering industries. An example of an effective tool for such systems and solutions involves the assessment of the maximum economic and environmental benefits attainable from a structure prior to its dismantling and demolition [16]. To ensure efficient waste management (WM), it is essential to precisely forecast the volume of generated waste by accurately quantifying both its quantity and composition [17], which is indispensable for realizing sustainable WM practices. These endeavors will lay the groundwork for enhancing legislation pertaining to waste; conducting environmental impact assessments; assessing social and economic costs; designing WM systems; and planning the necessary infrastructure such as collection sites, recycling centers, landfills, and incinerators [18,19]. Furthermore, the precise estimation of waste generation volume can serve as foundational data for effective WM practices, such as planning landfill capacity, implementing waste treatment levies or recycling incentives, and formulating comprehensive WM strategies [20]. However, owing to numerous uncertainties, an accurate prediction of the quantity of waste generated is difficult [21].
Recently, owing to considerable advancements in the WM domain, machine learning (ML) has emerged as an effective tool for addressing diverse challenges linked to CDW management. ML enables data-driven decision-making processes and delivers precise predictive data through the utilization of various technologies associated with data collection, processing, and information extraction [22]. In the CDW field, numerous researchers have investigated waste generation prediction models by utilizing ML as a component of WM tools. For example, Lu et al. [23] examined multilinear regression (MLR) models to forecast the volume of renovation waste generated from renovation projects conducted in Hong Kong. Lu et al. [24] developed MLR, the decision tree model (DT), the gray model, and an artificial neural network (ANN) to predict the volume of construction waste generated within a specific region in China. Based on a deep learning model, Akanbi et al. [25] predicted the volume of waste generation destined for recycling, reuse, and burial within the context of demolition waste (DW) management. By applying random forest (RF) and gradient boosting machine (GBM) for 690 structures involved in demolition projects, Cha et al. [26] developed a model for predicting the demolition waste generation (DWG) rate. Cha et al. [27] developed a hybrid ML model that integrated principal component analysis with ANN and support vector machine (SVM) algorithms, which aimed to enhance the accuracy of predicting the DWG rate for structures undergoing demolition projects. Coskuner et al. [28] developed an ML model applied with a multilayer perceptron (MLP)-ANN for predicting the CDW of the Askar landfill site in Bahrain. Gulghane et al. [29] collected construction waste data from 134 construction sites in Nagpur, India, and developed an ML model applied with decision (DT) and k-nearest neighbors (KNN) algorithms. Hu et al. [30] gathered data on the construction waste generation rate from 206 construction sites and used this to develop prediction models to which SVM, ANN, and MLR algorithms are applied. The aforementioned research on CDW management introduced ML models, which primarily targeted the overall CDW generation volume of a specific project or at a regional scale, as the resulting outcome. These results can serve practical purposes such as monitoring, collecting data, and devising a comprehensive waste-processing strategy on a large scale, guided by the total waste-generation volume. To enhance the effectiveness of CDW management, more comprehensive management strategies concerning detailed assessments of the environmental impact of specific waste types, the evaluation of processing expenses, and the selection of appropriate recycling methods are necessary. This indicates that the ML models developed in previous studies lack information on waste and detailed management plans necessary for achieving a sustainable construction industry. Therefore, to address the current research gap in recent studies and WM strategies, detailed information on waste, categorized by the properties and treatment methods of DW, is required. Through this, comprehensive strategies outlining environmental impact assessments, processing costs, and recycling plans for different types of CDW can provide a broader opportunity for fostering the development of a circular economy [31]. To formulate comprehensive strategies for CDW management, comprehending the attributes of processed waste, as well as the processing flow and categorization of CDW according to their characteristics and types, is imperative. This understanding enables informed decisions regarding effective and efficient environmental impact assessments and recycling techniques for CDW.
With the surge in dismantling operations during the redevelopment projects of old buildings, a sharp increase is anticipated in the generation of DW in Korea [32]. Therefore, managing DW poses a critical hurdle for Korea’s sustainable development. To achieve sustainable development in the Korean construction sector, it is imperative to establish comprehensive DW management strategies that should encompass aspects such as DW recovery rates, enhanced recycling rates, landfill allocation strategies, environmental impact assessments, and considerations of environmental and social costs. Such strategies should be formulated based on a thorough understanding of the flow and volume of DW generation from older structures. Accordingly, gaining insight into the processing flow and volume of DW generated from outdated structures in Korea is crucial. Moreover, for effective DW management and the implementation of a circular economy through resource recycling, it is essential to have recycling plans and WM based on detailed information on demolition waste, categorized by the properties and treatment methods of DW. Therefore, this study developed an ML-based management tool to predict the volume of DW generation—along with the quantities of recyclable and discarded or landfill building materials based on their characteristics—from old structures. By identifying the characteristics of such DW, this tool can aid decision-making processes in DW management by providing data on recycling recovery rates, recyclable DW generation volumes, and landfill waste generation to support landfill allocation plans. This study presents the following specific objectives:
  • Designing a model for predicting the volumes of recycling and landfill DW by considering the characteristics of DW generated from old structures within redevelopment zones.
  • Testing various potential subprediction models by determining optimal hyperparameters (HPs) and employing different algorithms.
  • Analyzing the factors affecting the volumes of recycling and landfill DW generated.
  • Proposing an optimal ML model for forecasting the volumes of recycling and landfill DW by evaluating the performance of training, validation, and testing models.
The remainder of this paper is structured as follows. Section 2 proposes application approaches of various ML algorithms, along with the data used in model development, the theoretical basis of the applied algorithms, model-optimization methods, and model-evaluation techniques. In Section 3, we assess the developed subprediction models and propose the best-performing prediction model; additionally, we analyze the factors influencing the models using SHAP analysis. Section 4 offers various discussions based on the key research results, while Section 5 presents the major findings and conclusions and addresses the limitations of this study.

2. Literature Review on ML-Based Models and Application

This study examines seven ML algorithms. In waste-generation studies within the WM field, the most commonly used ML algorithms are ANN, DT, KNN, RF, and SVM [33,34]. These algorithms typically demonstrate an exceptional performance in supervised learning tasks, handling non-linear data, identifying faults in datasets, and managing heterogeneous output parameters and numerical target variables [35]. Accordingly, many researchers often utilize these algorithms (i.e., ANN, DT, KNN, RF, and SVM), which continue to be widely employed and should be prioritized in developing prediction models. Additionally, the LR algorithm is straightforward and facilitates the interpretation of results; it is thus a recurrent choice for model development in the WM domain [33,35]. Ensemble algorithms, including RF, offer benefits such as an improved prediction performance and enhanced generalization results compared to individual learning algorithms [36,37]. Different from RF, the GBM algorithm is also a commonly used ensemble algorithm. Furthermore, Al Martini et al. [38] and Jayasinghe et al. [39] developed ML models with an excellent prediction performance using GBM. The current study utilizes ANN, DT, GBM, KNN, LR, RF, and SVR algorithms, which have demonstrated a remarkable performance or are commonly employed in the WM field. The features of each algorithm and methods for enhancing their performance are described below.
Owing to their strong fault tolerance capacity and suitability for depicting the complex relationships between variables in a multivariate system, ANNs are frequently used in the WM field for developing artificial intelligence models [33,40]. The architecture of ANN, a multilayer perceptron neural network, can achieve deep learning by expanding the hidden layer. Two fundamental HPs of an ANN model include the number of hidden layers and neurons as well as the type of activation function. Additionally, other HPs such as epoch and the regularization method (e.g., learning rate) also need to be properly selected to improve the model’s generalization ability and reduce training time [41].
As a supervised learning model for tackling classification and regression problems, the DT algorithm is used for efficiently extracting a set of rules from unfamiliar data [35], and it offers numerous benefits; however, it can be vulnerable to the problem of overfitting with data [33]. To construct an effective DT model with an optimal performance, devising a model that avoids overfitting is crucial. Thus, the complexity of a DT model needs to be controlled by tuning HPs such as the maximum depth or segmentation criteria of the DT model [42].
Friedman [43] first proposed gradient boosting as an algorithm used for classification and regression tasks. As a boosting technique, GBM stands out as one of the most robust ML algorithms extensively utilized in the engineering domain [44]. The model’s performance is enhanced while simultaneously minimizing loss or error by iteratively incorporating diverse prediction variables. As a result, the bias and variance of the prediction model can be drastically reduced [43]. As a boosting-based ensemble learning technique, GBM can enhance model efficiency and accuracy by tuning the learning rate, which reduces the influence of each classifier, and “n_estimators”, representing the maximum number of estimators at which boosting concludes [45].
The KNN algorithm is a simple and easily implementable supervised learning technique commonly employed for classification and regression purposes. This approach entails utilizing training data and computing distances for a predetermined k-value, where a set of k closest values are identified using clustering algorithms [46]. KNN achieves a low error rate when managing extensive datasets and determines the optimal closest neighbors of a point using a minimal number of attributes (low dimension) [35]. The most crucial HP in KNN is the k-value, which denotes the number of nearest neighbors considered. If the k-value is too small, underfitting may occur, whereas an excessively large k-value can cause overfitting, consequently prolonging computation time. Furthermore, the enhancement of the KNN model’s performance is significantly influenced by modifying a weighted function (such as uniform and distance) and the distance metric employed for prediction [47].
Combining statistical and ML techniques, the LR model is a linear equation comprising output values corresponding to specific input values. The main objective of regression analysis is to train a model using existing data and then make predictions by mapping an input value with an output value [48]. Although LR involves a relatively straightforward interpretation and minimal computational expenses, it also tends to exhibit bias [35]. Despite these shortcomings, LR remains appealing for its simplicity in terms of algorithmic design and ease of analyzing the results [33]. Owing to these advantages, LR has been consistently used as an ML algorithm for constructing waste-generation prediction models. The hyperparameters that require tuning via regularization in the LR model to enhance its performance are penalty terms such as “L1” and “L2” [41,49].
Proposed by [50], RF is a classic bagging-based ensemble technique that creates bootstrap samples. Since it incorporates multiple decision trees, the RF technique delivers a superior performance compared to single decision trees, reduces the risk of overfitting, and lessens the impact of outliers [51]. RF is an ensemble model that uses bagging, with the initial parameter to consider being n_estimators [45]. Subsequently, the model’s performance can be improved by tuning “max_features”, which represents the number of attributes used to create different subsets. Similar to GBM, performance can be improved in a DT-based ensemble model by tuning the split criteria and maximum depth [41].
An SVM Is an effective ML algorithm commonly applied for classification, regression, and anomaly detection [52]. SVM adopts the principle of structural risk minimization to address challenges such as a small number of data samples, non-linearity, high dimensionality, and local minima. This approach offers effective flexibility and generalization abilities, which are especially valuable for addressing non-linear problems. Particularly, SVM has the benefit of circumventing overfitting [53]. In an SVR model, the kernel type is a crucial hyperparameter that needs to be tuned first. In general, four types of kernels exist (i.e., radial basis function and linear, polynomial, and sigmoid kernels), and selecting the appropriate kernel type is essential for improving performance. In addition to kernels, the regularization parameter I, which governs the model’s complexity, and epsilon ( ε ), which denotes the distance error of a loss function, also influence the performance enhancement of an SVR model [54].
In summary, we examined the characteristics of the ML algorithms applied in this study and the HP tuning methods performed in previous research. ML algorithms require testing and adjusting various HPs to develop optimal prediction models, and it is necessary to develop models that integrate the domain-specific characteristics of the related field. Therefore, to develop predictive models that can provide detailed waste information based on the properties and various treatment methods (e.g., different recycling and landfill methods) of DW as part of WM strategies, it is important to derive generalized and robust models through the application of various algorithms, derive HPs optimized for the applied algorithms, and integrate domain-specific characteristics into the model for demolition waste management. Thus, this study developed DWG prediction models for various recycling and landfill methods by deriving the optimal set of input variables and HPs through various algorithms.

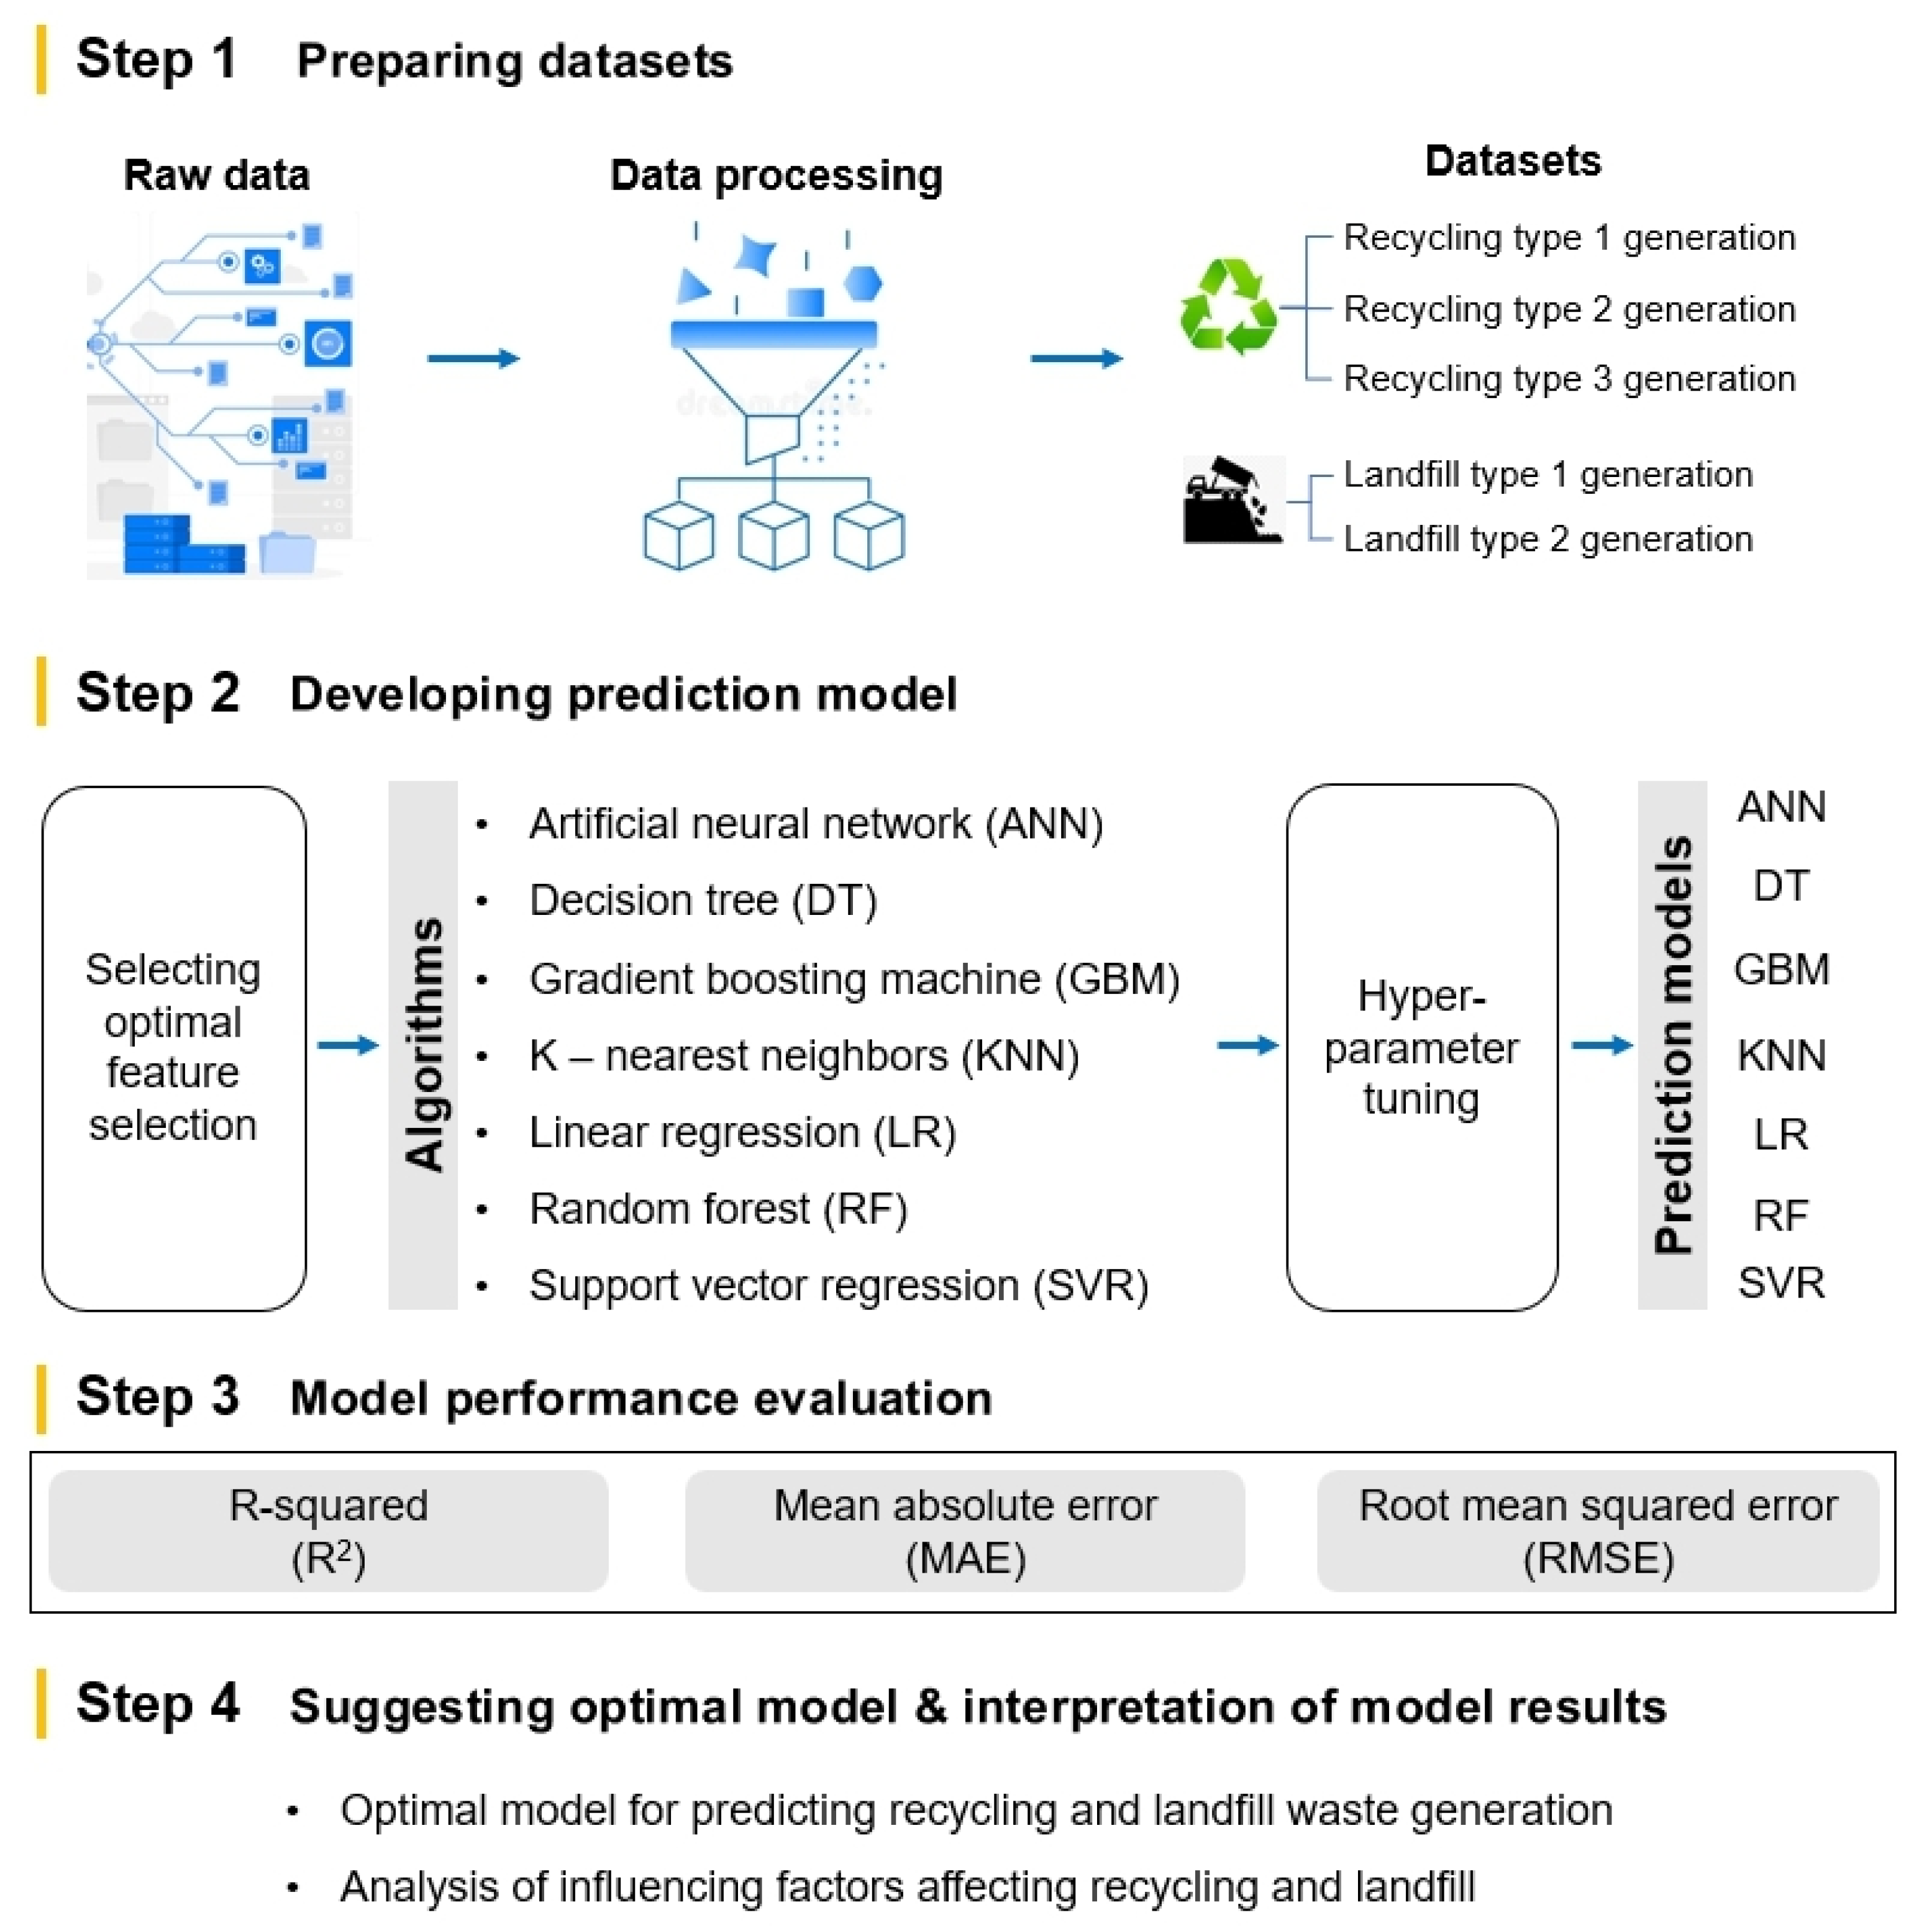
3. Methods and Materials

As illustrated in Figure 1, this study followed a sequence comprising dataset preparation; prediction model development; performance evaluation; and ultimately, the proposal and analysis of an optimal model capable of predicting the volumes of recycling and landfill DW generation (DWG).

3.1. Data Collection and Preprocessing

We collected data on DWG from the demolition sites in redevelopment areas located in Daegu (35.88° N latitude, 128.61° E longitude) and Busan (35.87° N latitude, 128.63° E longitude), both of which are situated in the southern region of Korea. The study area for this research is the same as that in a previous study [32]. While the previous study collected DWGR data through on-site investigations prior to the demolition of buildings, the data for this research are based on DWG data classified according to the disposal methods of waste through waste disposal companies and demolition companies after the demolition of buildings. The previous study [32] collected data from March to September 2019, when the demolition work was conducted. By contrast, we performed data collection for this study after the demolition work was completed, investigating recycling, combustible, and landfill wastes. The gathered dataset comprises details on 186 buildings (102 from Project A and 84 from Project B), along with the DWG acquired during the demolition phase. Structural information encompasses the building address and characteristics such as location, structure type, usage, wall and roof types, gross floor area (GFA), and number of floors. The dataset includes details on the structure and equipment utilized for demolition, along with the volumes of recycling and landfill DW produced.
We gathered recycling and landfill waste data in collaboration with demolition and processing companies by recording truck specifics and the volume transported to the processing company for DW treatment. We categorized recycling and landfill waste into three and two types, respectively. Recycling waste consisted of minerals (i.e., mortar, concrete, block, brick, and roofing tile), combustibles (i.e., wood, plastics, and paper), and metals. Landfill waste consisted of specified waste such as asbestos-containing materials and mixed waste that poses challenges for recycling.
To improve the prediction performance of ML models, a stable dataset must be constructed. The main purpose of building a stable dataset is to suppress the unwanted impact of distortions or outliers in the data. Therefore, this study preprocessed datasets to improve the performance of the prediction models. We conducted data preprocessing to construct reliable datasets and data standardization to prepare datasets of identical scales as follows:
x standardization = x x ¯ σ
where x , x ¯ , and σ are the element, mean, and standard deviation of the data, respectively.
Following data preprocessing, we resized the dataset to 150 entries (81 from Project A and 69 from Project B) to make it suitable for model development. The statistics of the data incorporated in the datasets utilized for model development, as well as the volumes of recycling and landfill waste generation, are presented in Table 1 and Table 2 and Figure 2. Approximately 85% of DW originating from aged structures in redevelopment areas undergo recycling, with approximately 14.5% and 0.4% of mixed and specified waste being disposed of in landfills, respectively. Specifically, minerals account for most recycling DW, comprising 75.9% of the total.

3.2. Model Development

3.2.1. Variable Selection

The datasets contained information on recycling and landfill DWG, structure characteristics (i.e., region, structure, usage, wall type, roof type, floor area, and number of floors), and equipment utilized for demolition. We considered region, structure, usage, wall type, roof type, floor area, number of floors, and equipment type as major input variables for predicting the volume of recycling and landfill DWG. As various input variables are expected to have differing impacts on the five categories of recycling and landfill DWG, devising optimal input variables based on the algorithm type and dependent variables (i.e., recycling and landfill generation by type) is essential. Thus, we examined the correlation between the major input variables and recycling and landfill DWG (Figure 3), which revealed variations among the major input variables across the recycling and landfill categories. Of the eight input variables, floor area, number of floors, equipment type, and region exhibited strong correlations across all DWG categories except for Landfill 1. Additionally, roof type was the most influential factor affecting the volume of Landfill 1 generation, ultimately displaying the strongest correlation. However, accurately predicting the DWG volume solely based on one or two input variables with strong correlations remains challenging. Therefore, we examined various combinations of input variables to forecast the generation of Recycling 1, 2, and 3 as well as Landfill 1 and 2 before tuning the HPs. Testing the model’s performance by sequentially adding input variables with strong correlations, according to recycling and landfill classification, revealed that the prediction accuracy was highest when eight input variables were included. Thus, we selected region, structure, usage, wall type, roof type, floor area, number of floors, and equipment type as input variables for predicting the DWG of Recycling 1, 2, and 3 as well as Landfill 1 and 2.

3.2.2. Hyperparameter Tuning

HP tuning is considered an essential element for building an effective ML model. Before enhancing an ML model with HPs, the identification of which key HPs need tuning to tailor the ML model to a particular problem or dataset is essential. As each algorithm has its own set of HPs, the process of tuning HPs varies according to the ML algorithm [55]. Therefore, major HPs are tuned to develop a prediction model with an optimal performance across other algorithms. All experiments were conducted utilizing Python 3.7 and Scikit-learn 1.0.
We tuned various HPs such as the activation function, the quantity of hidden layers, the number of neurons, regularization, and iteration to derive an ANN model with an optimal performance. For the DP algorithms, we tuned HPs including the maximum depth, minimum samples left, and split criteria; for the GBM model, we tuned HPs including n_estimators, the learning rate, split criteria, and the maximum depth for model development. Further, we tuned HPs such as the k-value, weighted function, and distance metric to optimize the performance of the KNN model. We tested the LR algorithm using three regularization methods: ridge, lasso, and elastic. For the RF model, we tuned HPs including n_estimators, max_features, split criteria, and the max depth; moreover, for the SVR model, we tuned HPs including kernel, C, and ε to derive an optimal SVR model. The types of HPs used to test different algorithms for predicting recycling and landfill waste generation are presented in Table 3, along with the results of HP tuning showing an optimal prediction performance.

3.3. Performance Metrics for Model Verification

We split the training and test data into an 80:20 ratio to develop the prediction model for recycling and landfill waste generation. Additionally, we took leave-one-out cross-validation (LOOCV) into consideration for validating the developed models. As a special case of k-fold cross-validation, LOOCV is typically considered suitable for small sample sizes [56]. Since LOOCV uses all samples as both test and training data to ensure enough training and validation sets, this method offers the advantage of producing stable results for small-scale datasets compared to 10- or k-fold cross-validation [57,58].
We employed the mean absolute error (MAE) (Equation (2)), root mean squared error (RMSE) (Equation (3)), and R2 (Equation (4)) as metrics for evaluating the performance of the developed models. In performance evaluation, a higher R2 result indicates a better model, while lower MAE and RMSE results are also signs of a superior model:
MAE =   i = 1 n y i x i n
RMSE = i = 1 n y i x i 2 n
R 2 = 1 i = 1 n y i x i 2 i = 1 n y i x ¯ i 2
where x i is the observed value; y i , x ¯ i , and y ¯ i are the predicted, average observed, and average predicted quantity of generated DW, respectively; and n is the number of samples.

4. Results and Discussion

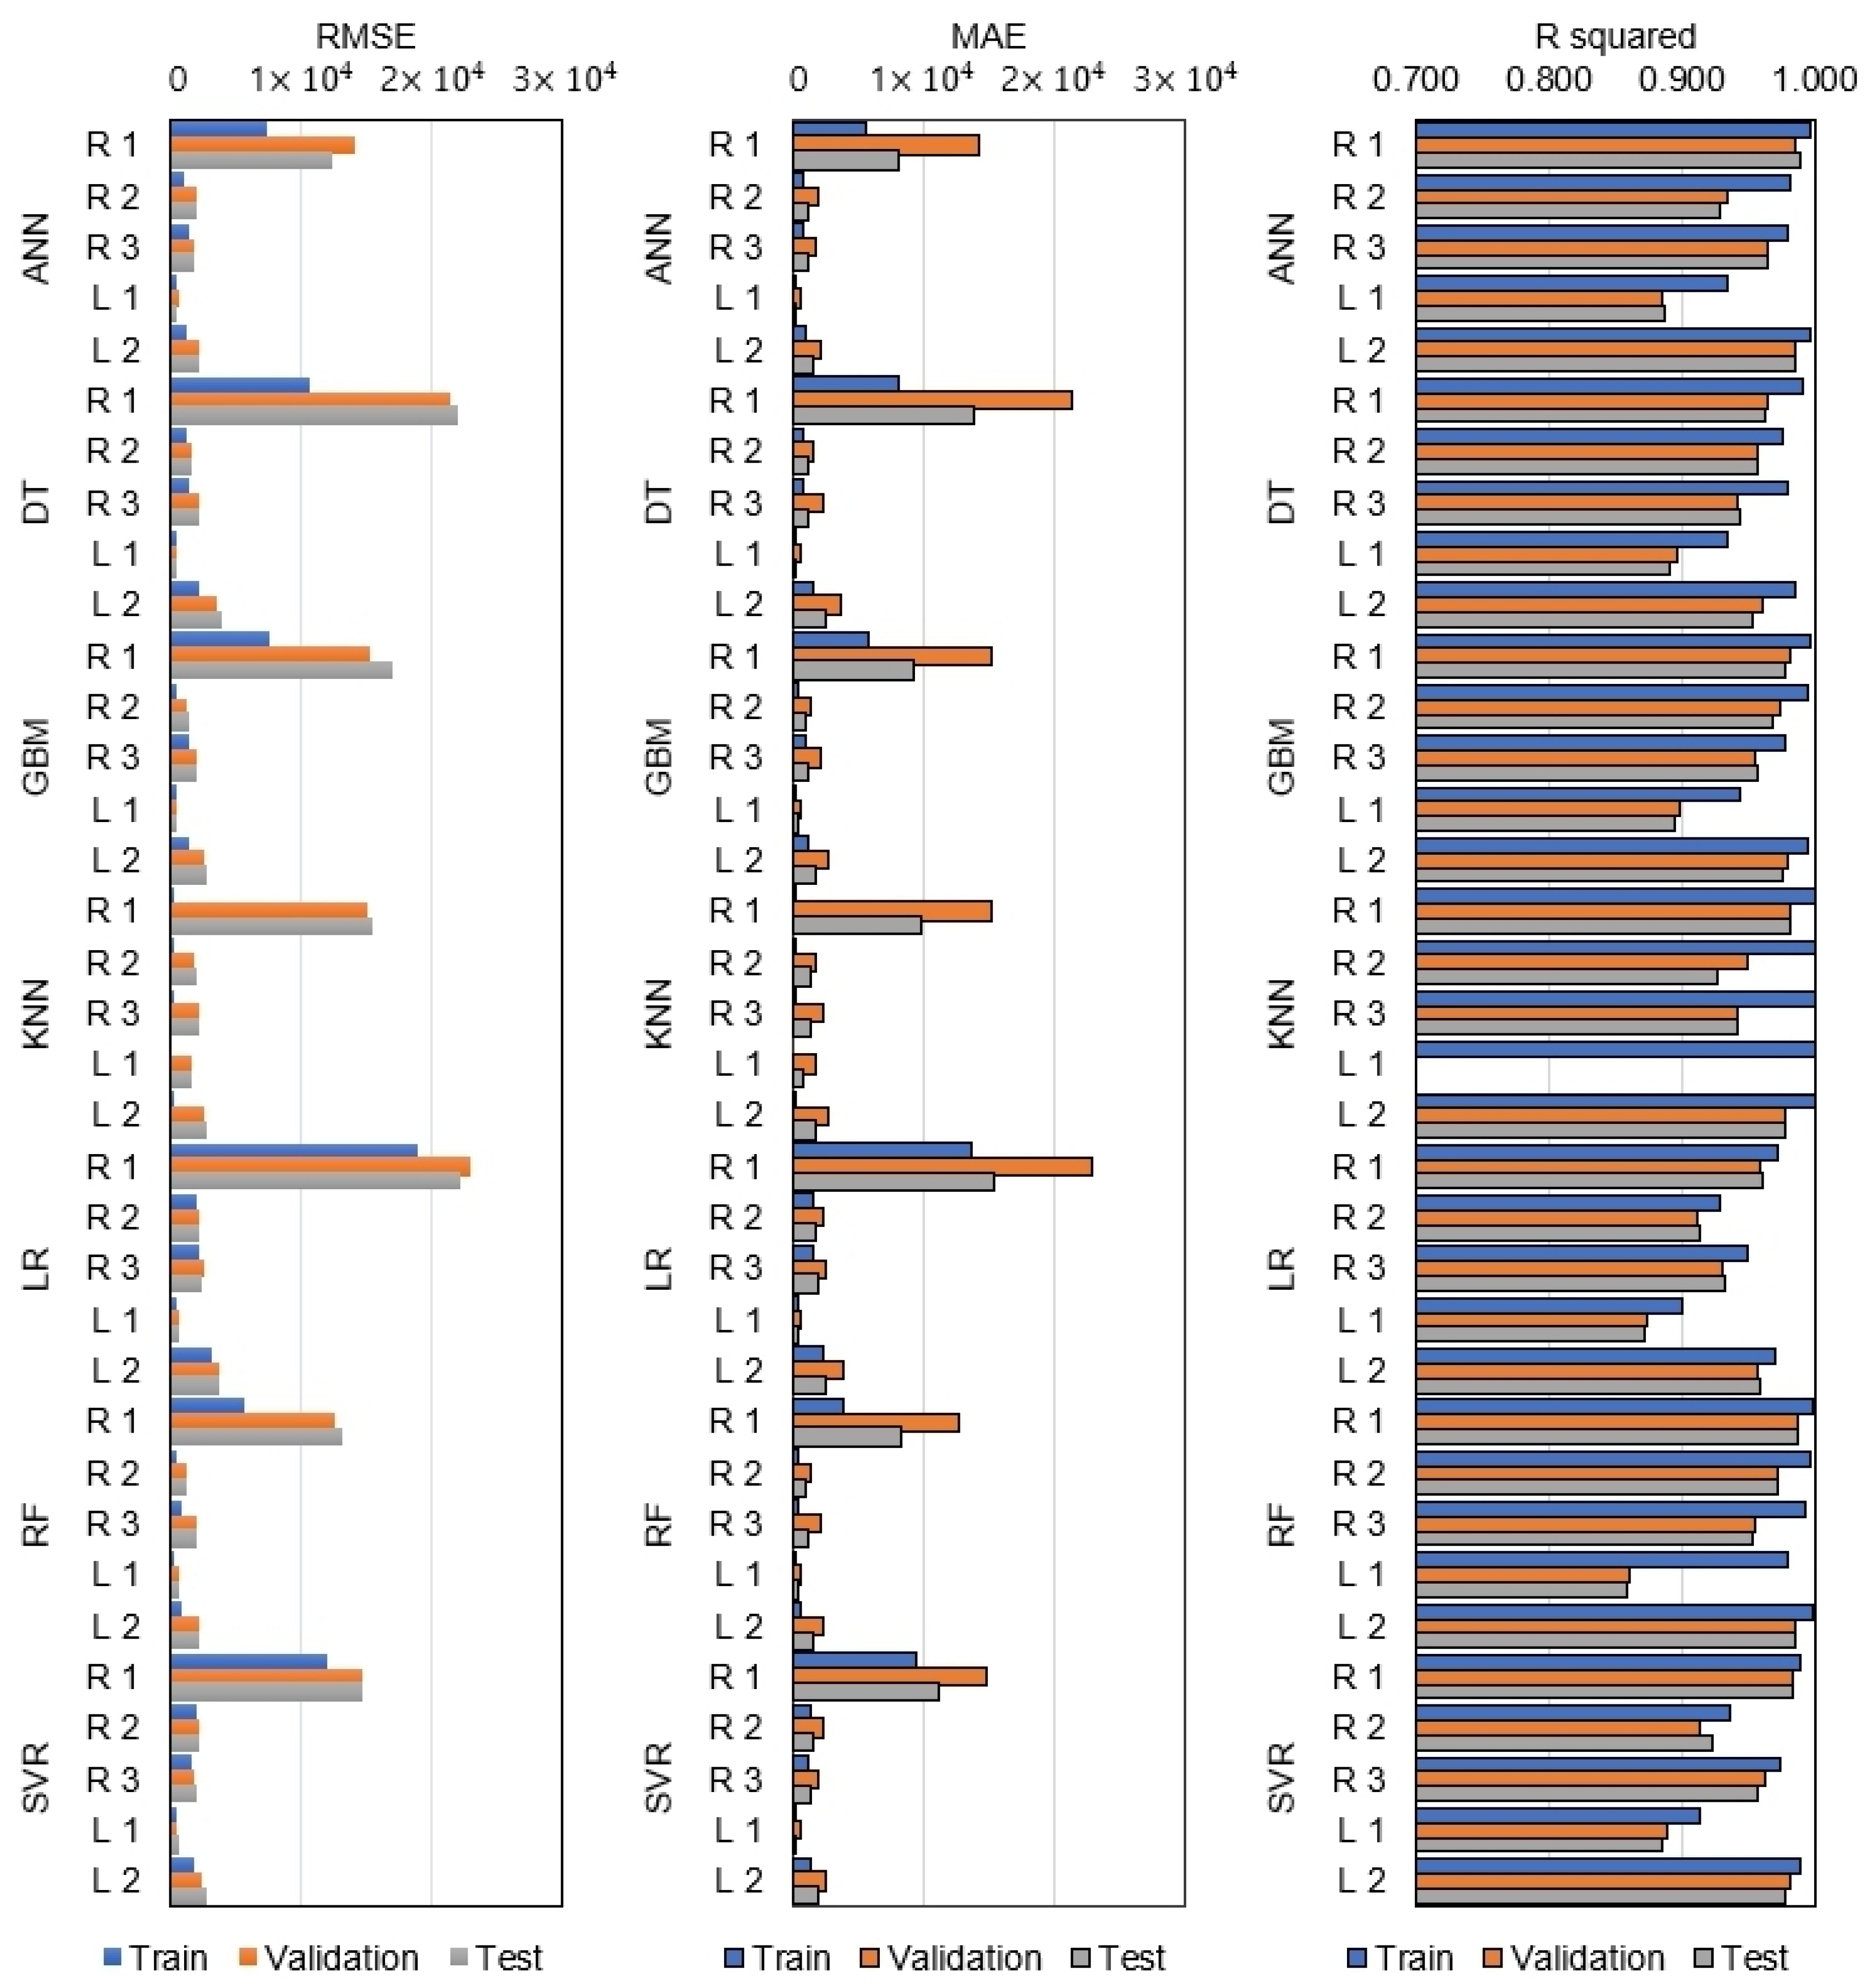
4.1. Assessment of Models

We applied the eight input variables (i.e., region, structure, usage, wall type, roof type, floor area, number of floors, and equipment type) and various ML algorithms to develop a prediction model for recycling and landfill DWG. The RMSE, MAE, and R2 results are presented in Figure 4 and Table 4. Typically, low RMSE and MAE values indicate a low error rate and high prediction accuracy, while a high R2 value signifies excellent model performance. In Figure 4, the RMSE and MAE values for R1 are higher compared to those of other models (R2, R3, L1, and L2), which is primarily due to the significantly higher waste generation volume, as depicted in Table 2 and Figure 2. The ANN, GBM, and RF models demonstrate highly accurate predictions for recycling and landfill waste generation, with R2 values higher than 0.850 in the validation and test models. The KNN model achieved a high R2 value of one in all training models, as presented in Figure 4 and Table 4, while its RMSE and MAE values were notably low, as indicated in Table 4. These results suggest overfitting. The RMSE, MAE, and R2 values of the KNN validation and test models in Table 4 reveal a decline in prediction performance. Considering the average performance results of the five models (R1, R2, R3, L1, and L2) in Table 4, the R2 value of the ANN model is 0.977, 0.951, and 0.950; GBM model is 0.981, 0.957, and 0.954; and RF model is 0.993, 0.951, and 0.951 for the training, validation, and test datasets, respectively. All these values indicate an excellent performance. In terms of the RMSE and MAE outcomes, the RF model yielded lower results compared to the ANN and GBM models, making it a superior model in terms of error reduction and accuracy. Consequently, based on the performance metrics of the RMSE, MAE, and R2 value, the RF model, which was developed using eight input variables (region, structure, usage, wall type, roof type, floor area, number of floors, and equipment type), is considered the most optimal for predicting recycling and landfill waste generation volumes.

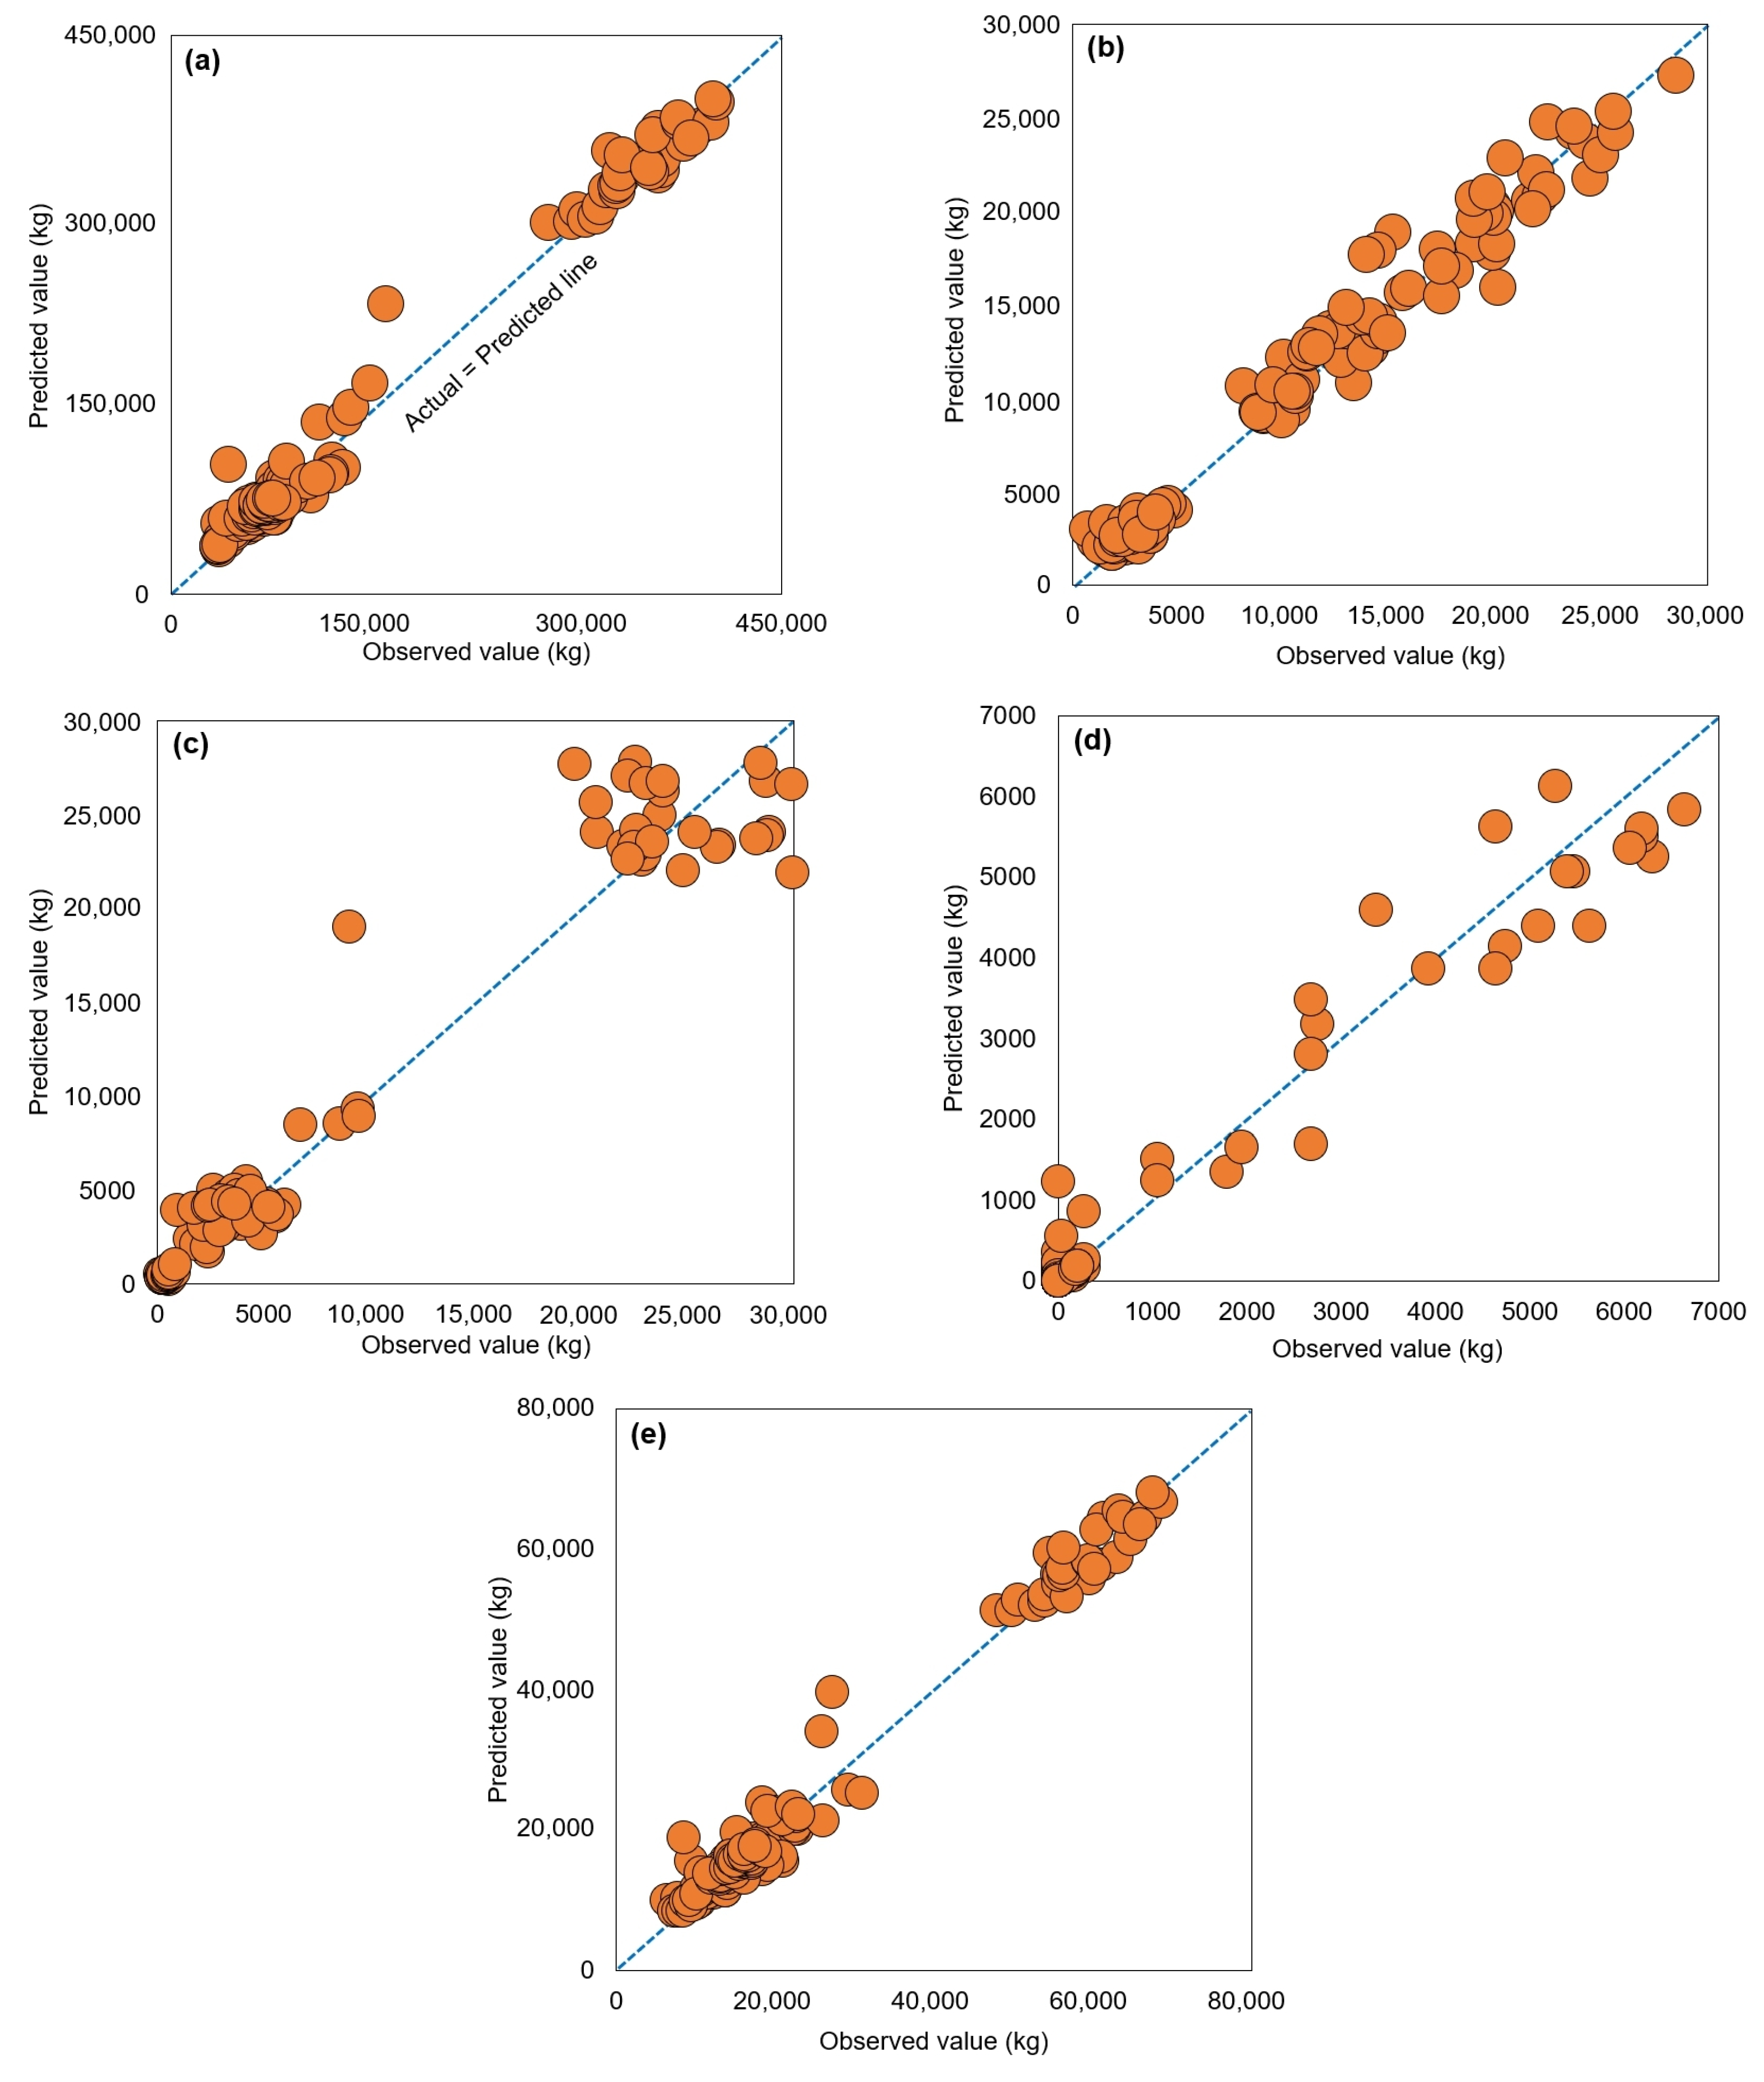
4.2. Prediction Performance of Optimal Model and Comparison with Existing Models

We utilized the RF algorithm to develop five models (R1, R2, R3, L1, and L2) as the most optimal for predicting the generation volumes of recycling waste (recyclable minerals, combustible waste, and metals) and landfill waste (specified landfill waste and mixed waste). The performance of the five models is presented in Table 5. The models (R1, R2, R3, and L2) for predicting the generation of recyclable minerals, combustible waste, metals, and mixed waste all achieved an R2 value of 0.95 or higher across the training, validation, and test datasets, thereby indicating a high level of accuracy. Furthermore, as illustrated in the correlation graphs of the predicted and observed values in Figure 5a–c,e, the predicted and observed values clustering closely around the center line act as evidence of the models’ accuracy. The R2 value of the L1 model is comparatively lower at 0.980, 0.858, and 0.860 in the training, validation, and test datasets (Table 5), respectively, and the predicted and observed values are relatively distant from the center line in Figure 5d. Owing to its focus on the generation of specified waste containing asbestos, the L1 model may have uneven data compared to other models. As Cha et al. [59] demonstrated, asbestos slate material has been commonly utilized when updating roofs of traditional structures with asbestos roofing in Korea. The L1 model still demonstrated an excellent prediction performance, with R2 values of 0.858 and 0.860 in the validation and test datasets, respectively. A graph comparing the predicted and observed values of the developed models is presented in Figure 6. The predicted and observed values of the five models that utilized the RF algorithm, as well as eight input variables, accurately represent the actual patterns.
This study adopted various ML algorithms and eight input variables for predicting the amount of recycling and landfill DW categorized into five different types of processing methods. Ultimately, the RF model was selected as the most optimal model for its precision in predicting the volume of recycling and landfill DWG. Previous studies [35,60] have also used the RF algorithm to predict waste generation and showed excellent prediction performance results. In Nguyen et al.’s study [35], the accuracy of the RF model for MSW prediction was R2 = 0.97, showing a better prediction performance than other algorithms. Additionally, Singh et al. [60] showed that the RF model developed to predict MSW had an excellent prediction performance of R2 = 0.988. The rationale behind the selection is the ability of the RF model to offer comprehensive insights into WM, including efficient resource allocation, cost reduction, minimal environmental impact, and support for decision-making processes. Similarly, Akanbi et al. [25] utilized deep learning to predict the volume of recyclable, reusable, and landfill DW. The R2 value for the three deep learning models (recyclable, reusable, and landfill prediction models) was 0.9475, thereby indicating an excellent prediction performance. Akanbi et al. [25] employed five input variables (GFA, volume, number of floors, building archetype, and usage) and presented the results of recyclable, reusable, and landfill DWG categorized by archetype. This approach is useful for DW management in terms of predicting the DWG of recyclable, reusable, and landfill waste. However, DW needs to be classified in more detail according to its properties. For example, recyclable waste can be categorized into non-combustible (e.g., concrete, bricks, and blocks) and combustible (e.g., paper, plastic, and wood) materials, and the treatment methods would differ based on the recycling purpose and usage. A model for predicting the DWG based on such classifications would be highly beneficial for more detailed DW management. Therefore, the prediction models in Figure 6 developed in this study are distinct from previous models as they consider the properties and treatment methods of DW, showing differentiated results for recycling and landfill DWG.
In addition to the RF model proposed as the most optimal prediction model, the ANN, GBM, and SVR models also exhibit an excellent prediction performance. The RF model exhibited a superior performance compared to other models in terms of the average values of the RMSE, MAE, and R2. Conversely, the L1 model demonstrated a poorer performance than the R1, R2, R3, and L2 models, which could be due to the absence of reliable data or the selection of inappropriate algorithms. For the L1 model, the ANN, GBM, and SVR prediction models exhibited a comparable or slightly improved prediction performance. This result implies that ANN, GBM, and SVR algorithms can be more appropriate as prediction models for DWG targeting the specified waste data. Thus, exploring a range of ML algorithms can be an advantageous approach for constructing ML models with high accuracy, particularly for datasets with limited statistics or high complexity. However, implementing such an approach requires lengthy and energy-intensive processes. Therefore, while identifying highly accurate models is vital for ML model development, a superior solution involves creating an optimal model from a comprehensive perspective.

4.3. Variable Importance

We evaluated the importance of input variables using the SHAP method. The SHAP algorithm is particularly beneficial for determining the contribution of an input variable to the final prediction of a model by quantifying the impact of input variables. In terms of such importance, a SHAP value close to 0 suggests that the input variable makes a minimal contribution to the outcome of a prediction model.
The SHAP analysis results of major input variables that affected the five prediction models are illustrated in Figure 7. The importance of the input variables that affected the results of the R1 model is presented in Figure 7a. The most influential variable for the R1 model was floor area, with structure, number of floors, and equipment also displaying a positive correlation with the model’s results. Akanbi et al. [25] also proved that the floor area and number of floors are critical factors affecting recyclable and reusable models. This is because the floor area generally has a high correlation with the generation of construction, renovation, and demolition wastes [61], and the recycling rate of waste such as concrete, which accounts for a high proportion of waste generation, is high. The current study argues that equipment type is one of the important factors affecting recyclable mineral generation. The importance of input variables for the R2 model—a predictive tool for estimating the generation of combustible DW that can be used for energy recovery—is highlighted in Figure 7b. The region and floor area can be considered highly influential for the R2 model; Region B demonstrates a positive correlation with the R2 model results, whereas Region A exhibits a negative correlation. These findings suggest that the region of a structure can serve as a crucial input variable for predicting combustible DWG, leading to significantly varying outcomes based on the region. These regional differences are an important factor affecting the amount of waste generated, and existing studies [62,63] have also reported results showing that regional differences affect waste generation. The results of the R3 model, which forecasts the volume of metal generation, are presented in Figure 7c. The importance of input variables in this model is similar to that in the R1 model. The input variable importance of the L1 model is illustrated in Figure 7d, where the roof type and floor area are the important input variables for the specified waste generation. Specifically, the slate roof type, predominantly composed of asbestos, exhibits a strong positive correlation with the specified waste generation. The input variable importance of the L2 model is illustrated in Figure 7e, where the floor area is the most important input variable for mixed waste generation. Additionally, the equipment, number of floors, structure, and region have a notable impact. Akanbi et al. [25] identified the number of floors and floor area as the two most influential input variables for the landfill models. However, the current study suggests that equipment also significantly impacts landfill waste generation.

5. Conclusions

Accurate information on the volume of DW generated is essential for achieving a sustainable and effective circular economy in the construction sector. In this respect, accurate data allow for the development of appropriate plans to manage the volume of recycling and landfill waste generated during demolition. However, as DW varies in properties and treatment methods, simply predicting the amounts of recyclable and landfill DW has limitations for detailed DW management. For more detailed DW management, information on the generation of recycling and landfill DW, categorized by its properties and treatment methods, is necessary. Therefore, using data on structural characteristics and demolition equipment, this study created three and two models to predict recycling and landfill waste generation, respectively, based on the classification of DW properties and treatment methods. We tested various ML algorithms (including ANN, DT, GBM, KNN, LR, RF, and SVR) to develop a prediction model with an optimal performance. The findings indicated that the model utilizing the RF algorithm exhibited the highest performance. The average R2 values for the training, validation, and test datasets were 0.993, 0.951, and 0.951, respectively, thus affirming its exceptional performance. In the validation and test results, the “recyclable mineral waste generation” model achieved an accuracy of 0.987, while the “recyclable combustible waste generation” model attained an accuracy of 0.972. For the “recyclable metals generation” and “landfill specified waste generation” models, accuracy reached 0.953 or above and 0.858 or above, respectively. Last, the “landfill mixed waste generation” model exhibited an accuracy of 0.984 or higher. Therefore, the RF model developed through this study demonstrated high predictive performance results, which indicates that the model can help accurately and precisely understand the flow of DW based on how it is recycled and landfilled, thereby aiding in DW management. As emphasized by Liu et al. [64], these results are expected to contribute to improving the recycling rate of CDW through material flow analysis at the end-of-life phase of buildings.
The SHAP analysis established that the floor area emerges as the most crucial input variable across the four models devised in this study: those for recyclable mineral waste, recyclable combustible waste, recyclable metals, and landfill mixed waste. Furthermore, the type of equipment utilized in the demolition process is an important input variable for the generation of recycling and landfill waste. These findings indicate that to develop a management model for DW at the demolition stage of buildings, the equipment used in demolition works should also be considered as a domain-specific characteristic specialized for the recycling and landfill WM sector, along with key factors such as the region, structure, material type, and floor area. Therefore, if researchers or other regions utilize the results of this study to develop WM models in the future, it is expected to aid in the development of superior models.
This study differs from previous research by proposing prediction models with more detailed classifications for recycling and landfills, providing more detailed information for DW management. Thus, it has several noteworthy implications for both academia and industry. In scholarly terms, this study suggests employing various ML algorithms to estimate the quantity of recycling or landfill waste generated from structural demolition. This approach will provide valuable insights for resource acquisition and waste handling, thereby contributing to the pursuit of sustainable and resource-efficient urban planning and construction practices. Practically, the results can aid local government officials or demolition companies in making informed decisions about resource allocation, optimizing workforce and infrastructure, maximizing recycled waste, and minimizing landfill waste.
A limitation of this study was the insufficiency of data for certain types of information. For instance, the landfill-specified waste-generation model resulted in a less-accurate prediction performance than the other four models. The insufficiency of certain data can degrade the predictive capability of models. To address this limitation, data collection should be expanded through a wider range of comprehensive case studies. Consequently, the developed models can be enhanced and validated, ultimately offering detailed insights and information on WM. Continuously updating and retraining the ML algorithms employed to predict recycling and landfill waste volume generation can improve reliability and accuracy, thus offering valuable insights necessary for effective WM.

Author Contributions

Conceptualization, methodology, validation, and supervision, G.-W.C.; resources, writing—review and editing, and funding acquisition, G.-W.C., Y.-C.K. and C.-W.P. All authors have read and agreed to the published version of the manuscript.

Funding

This work was supported by the Commercialization Promotion Agency for R&D Outcomes (COMPA) grant funded by the Korean government (Ministry of Science and ICT) (RS-2023-00304695). This work was also supported in part by the National Research Foundation of Korea (NRF) grant funded by the Korean government (MSIT) (NRF-2022R1F1A107517313-1-3).

Institutional Review Board Statement

Not applicable.

Informed Consent Statement

Not applicable.

Data Availability Statement

No new data were created or analyzed in this study. Data sharing is not applicable to this article.

Conflicts of Interest

The authors declare no conflict of interest. The authors declare that this study received funding from NRF-2019R1A2C1088446 and No. 20212020800120. The funder was not involved in the study design, collection, analysis, interpretation of data, the writing of this article or the decision to submit it for publication.

References

  1. Hossein, A.H.; AzariJafari, H.; Khoshnazar, R. The role of performance metrics in comparative LCA of concrete mixtures incorporating solid wastes: A critical review and guideline proposal. Waste Manag. 2022, 140, 40–54. [Google Scholar] [CrossRef] [PubMed]
  2. Lu, W.; Chen, J. Computer vision for solid waste sorting: A critical review of academic research. Waste Manag. 2022, 142, 29–43. [Google Scholar] [CrossRef]
  3. Chen, D.M.-C.; Bodirsky, B.L.; Krueger, T.; Mishra, A.; Popp, A. The world’s growing municipal solid waste: Trends and impacts. Environ. Res. Lett. 2020, 15, 074021. [Google Scholar] [CrossRef]
  4. Statista. 2023. Available online: https://www.statista.com/topics/4983/waste-generation-worldwide/#topicOverview (accessed on 8 August 2024).
  5. Ma, W.; Hao, J.L. Enhancing a circular economy for construction and demolition waste management in China: A stakeholder engagement and key strategy approach. J. Clean. Prod. 2024, 450, 141763. [Google Scholar] [CrossRef]
  6. Ginga, C.P.; Ongpeng, J.M.C.; Daly, M.K.M. Circular Economy on Construction and Demolition Waste: A Literature Review on Material Recovery and Production. Materials 2020, 13, 2970. [Google Scholar] [CrossRef] [PubMed]
  7. López Ruiz, L.A.; Roca Ramón, X.; Gassó Domingo, S. The circular economy in the construction and demolition waste sector—A review and an integrative model approach. J. Cleaner Prod. 2020, 248, 119238. [Google Scholar] [CrossRef]
  8. Hao, J.; Di Maria, F.; Chen, Z.; Yu, S.; Yu, W.; Di Sarno, L. Comparative study of construction and demolition waste management in China and the European Union. Detritus 2020, 13, 114–121. [Google Scholar] [CrossRef]
  9. Duan, H.; Miller, T.R.; Liu, G.; Tam, V.W.Y. Construction debris becomes growing concern of growing cities. Waste Manag. 2019, 83, 1–5. [Google Scholar] [CrossRef]
  10. Purchase, C.K.; Al Zulayq, D.M.; O’Brien, B.T.; Kowalewski, M.J.; Berenjian, A.; Tarighaleslami, A.H.; Seifan, M. Circular economy of construction and demolition waste: A literature review on lessons, challenges, and benefits. Materials 2021, 15, 76. [Google Scholar] [CrossRef] [PubMed]
  11. Nguyen, H.D.; Macchion, L. Risk management in green building: A review of the current state of research and future directions. Environ. Dev. Sustain. 2023, 25, 2136–2172. [Google Scholar] [CrossRef]
  12. Nasir, M.H.A.; Genovese, A.; Acquaye, A.A.; Koh, S.C.L.; Yamoah, F. Comparing linear and circular supply chains: A case study from the construction industry. Int. J. Prod. Econ. 2017, 183, 443–457. [Google Scholar] [CrossRef]
  13. Oluleye, B.I.; Chan, D.W.; Saka, A.B.; Olawumi, T.O. Circular economy research on building construction and demolition waste: A review of current trends and future research directions. J. Clean. Prod. 2022, 357, 131927. [Google Scholar] [CrossRef]
  14. Mahpour, A. Prioritizing barriers to adopt circular economy in construction and demolition waste management. Resour. Conserv. Recycl. 2018, 134, 216–227. [Google Scholar] [CrossRef]
  15. Wei, Y.; Zhang, L.; Sang, P. Exploring the restrictive factors for the development of the construction waste recycling industry in a second-tier Chinese city: A case study from Jinan. Environ. Sci. Pollut. Res. Int. 2023, 30, 46394–46413. [Google Scholar] [CrossRef] [PubMed]
  16. Song, Y.; Wang, Y.; Liu, F.; Zhang, Y. Development of a hybrid model to predict construction and demolition waste: China as a case study. Waste Manag. 2017, 59, 350–361. [Google Scholar] [CrossRef]
  17. Katz, A.; Baum, H. A novel methodology to estimate the evolution of construction waste in construction sites. Waste Manag. 2011, 31, 353–358. [Google Scholar] [CrossRef]
  18. Hoque, M.M.; Rahman, M.T.U. Landfill area estimation based on solid waste collection prediction using ANN model and final waste disposal options. J. Cleaner Prod. 2020, 256, 120387. [Google Scholar] [CrossRef]
  19. Ma, S.; Zhou, C.; Chi, C.; Liu, Y.; Yang, G. Estimating physical composition of municipal solid waste in China by applying artificial neural network method. Environ. Sci. Technol. 2020, 54, 9609–9617. [Google Scholar] [CrossRef]
  20. Yu, Y.; Yazan, D.M.; Bhochhibhoya, S.; Volker, L. Towards circular economy through industrial symbiosis in the Dutch construction industry: A case of recycled concrete aggregates. J. Cleaner Prod. 2021, 293, 126083. [Google Scholar] [CrossRef]
  21. Abbasi, M.; El Hanandeh, A. Forecasting municipal solid waste generation using artificial intelligence modelling approaches. Waste Manag. 2016, 56, 13–22. [Google Scholar] [CrossRef]
  22. Yazdani, M.; Kabirifar, K.; Frimpong, B.E.; Shariati, M.; Mirmozaffari, M.; Boskabadi, A. Improving construction and demolition waste collection service in an urban area using a simheuristic approach: A case study in Sydney, Australia. J. Cleaner Prod. 2021, 280, 124138. [Google Scholar] [CrossRef]
  23. Lu, W.; Long, W.; Yuan, L. A machine learning regression approach for pre-renovation construction waste auditing. J. Cleaner Prod. 2023, 397, 136596. [Google Scholar] [CrossRef]
  24. Lu, W.; Lou, J.; Webster, C.; Xue, F.; Bao, Z.; Chi, B. Estimating construction waste generation in the Greater Bay Area, China using machine learning. Waste Manag. 2021, 134, 78–88. [Google Scholar] [CrossRef] [PubMed]
  25. Akanbi, L.A.; Oyedele, A.O.; Oyedele, L.O.; Salami, R.O. Deep Learning Model for Demolition Waste Prediction in a Circular Economy. J. Cleaner Prod. 2020, 274, 122843. [Google Scholar] [CrossRef]
  26. Cha, G.-W.; Moon, H.-J.; Kim, Y.-C. Comparison of random forest and gradient boosting machine models for predicting demolition waste based on small datasets and categorical variables. Int. J. Environ. Res. Public Health 2021, 18, 8530. [Google Scholar] [CrossRef] [PubMed]
  27. Cha, G.-W.; Moon, H.J.; Kim, Y.-C. A hybrid machine-learning model for predicting the waste generation rate of building demolition projects. J. Cleaner Prod. 2022, 375, 134096. [Google Scholar] [CrossRef]
  28. Coskuner, G.; Jassim, M.S.; Zontul, M.; Karateke, S. Application of artificial intelligence neural network modeling to predict the generation of domestic, commercial and construction wastes. Waste Manag. Res. 2021, 39, 499–507. [Google Scholar] [CrossRef] [PubMed]
  29. Gulghane, A.; Sharma, R.L.; Borkar, P. A formal evaluation of KNN and decision tree algorithms for waste generation prediction in residential projects: A comparative approach. Asian J. Civ. Eng. 2024, 25, 265–280. [Google Scholar] [CrossRef]
  30. Hu, R.; Chen, K.; Chen, W.; Wang, Q.; Luo, H. Estimation of construction waste generation based on an improved on-site measurement and SVM-based prediction model: A case of commercial buildings in China. Waste Manag. 2021, 126, 791–799. [Google Scholar] [CrossRef] [PubMed]
  31. Ibrahim, M.; Alimi, W.; Assaggaf, R.; Salami, B.A.; Oladapo, E.A. An overview of factors influencing the properties of concrete incorporating construction and demolition wastes. Constr. Build. Mater. 2023, 367, 130307. [Google Scholar] [CrossRef]
  32. Cha, G.-W.; Park, C.-W.; Kim, Y.-C.; Moon, H.J. Predicting Generation of Different Demolition Waste Types Using Simple Artificial Neural Networks. Sustainability 2023, 15, 16245. [Google Scholar] [CrossRef]
  33. Abdallah, M.; Abu Talib, M.A.; Feroz, S.; Nasir, Q.; Abdalla, H.; Mahfood, B. Artificial intelligence applications in solid waste management: A systematic research review. Waste Manag. 2020, 109, 231–246. [Google Scholar] [CrossRef] [PubMed]
  34. Gao, Y.; Wang, J.; Xu, X. Machine learning in construction and demolition waste management: Progress, challenges, and future directions. Autom. Constr. 2024, 162, 105380. [Google Scholar] [CrossRef]
  35. Nguyen, X.C.; Nguyen, T.T.H.; La, D.D.; Kumar, G.; Rene, E.R.; Nguyen, D.D.; Chang, S.W.; Chung, W.J.; Nguyen, X.H.; Nguyen, V.K. Development of machine learning-based models to forecast solid waste generation in residential areas: A case study from Vietnam. Resour. Conserve. Recy. 2021, 167, 105381. [Google Scholar] [CrossRef]
  36. Opitz, D.; Maclin, R. Popular ensemble methods: An empirical study. J. Artif. Intell. Res. 1999, 11, 169–198. [Google Scholar] [CrossRef]
  37. Ghimire, B.; Rogan, J.; Galiano, V.R.; Panday, P.; Neeti, N. An evaluation of bagging, boosting, and random forests for land-cover classification in Cape Cod, Massachusetts, USA. GIScience Remote Sens. 2012, 49, 623–643. [Google Scholar] [CrossRef]
  38. Al Martini, S.; Sabouni, R.; Khartabil, A.; Wakjira, T.G.; Shahria Alam, M.S. Development and strength prediction of sustainable concrete having binary and ternary cementitious blends and incorporating recycled aggregates from demolished UAE buildings: Experimental and machine learning-based studies. Constr. Build. Mater. 2023, 380, 131278. [Google Scholar] [CrossRef]
  39. Jayasinghe, T.; Wei Chen, B.; Zhang, Z.; Meng, X.; Li, Y.; Gunawardena, T.; Mangalathu, S.; Mendis, P. Data-driven shear strength predictions of recycled aggregate concrete beams with/without shear reinforcement by applying machine learning approaches. Constr. Build. Mater. 2023, 387, 131604. [Google Scholar] [CrossRef]
  40. Xu, A.; Chang, H.; Xu, Y.; Li, R.; Li, X.; Zhao, Y. Applying artificial neural networks (ANNs) to solve solid waste-related issues: A critical review. Waste Manag. 2021, 124, 385–402. [Google Scholar] [CrossRef]
  41. Yang, L.; Shami, A. On hyperparameter optimization of machine learning algorithms: Theory and practice. Neurocomputing 2020, 415, 295–316. [Google Scholar] [CrossRef]
  42. Pedregosa, F.; Varoquaux, G.; Gramfort, A.; Michel, V.; Thirion, B.; Grisel, O.; Blondel, M.; Prettenhofer, P.; Weiss, R.; Dubourg, V.; et al. Scikit-learn: Machine learning in Python. J. Mach. Learn. Res. 2011, 12, 2825–2830. [Google Scholar]
  43. Friedman, J.H. Greedy function approximation: A gradient boosting machine. Ann. Statist. 2001, 29, 1189–1232. [Google Scholar] [CrossRef]
  44. Qi, C.; Tang, X. Slope stability prediction using integrated metaheuristic and machine learning approaches: A comparative study. Comput. Ind. Eng. 2018, 118, 112–122. [Google Scholar] [CrossRef]
  45. Dietterich, T.G. Ensemble Methods in Machine Learning. In Multiple Classifier Systems; Springer: Berlin/Heidelberg, Germany, 2000; pp. 1–15. [Google Scholar]
  46. Guo, G.; Wang, H.; Bell, D.; Bi, Y.; Greer, K. KNN Model-Based Approach in Classification. In On the Move to Meaningful Internet Systems 2003: CoopIS, DOA, and ODBASE; Lecture Notes in Computer Science, Meersman, R., Tari, Z., Schmidt, D.C., Eds.; Springer: Berlin/Heidelberg, Germany, 2003; Volume 2888, pp. 986–996. [Google Scholar]
  47. Zuo, W.; Zhang, D.; Wang, K. On kernel difference-weighted k-nearest neighbor classification. Pattern Anal. Appl. 2008, 11, 247–257. [Google Scholar] [CrossRef]
  48. Huang, J.-C.; Ko, K.-M.; Shu, M.-H.; Hsu, B.-M. Application and comparison of several machine learning algorithms and their integration models in regression problems. Neural Comput. Appl. 2020, 32, 5461–5469. [Google Scholar] [CrossRef]
  49. Ogutu, J.O.; Schulz-Streeck, T.; Piepho, H.-P. Genomic selection using regularized linear regression models: Ridge regression, lasso, elastic net, and their extensions. BMC Proc. 2012, 6, S10. [Google Scholar] [CrossRef]
  50. Breiman, L. Random Forests. Mach. Learn. 2001, 45, 5–32. [Google Scholar] [CrossRef]
  51. Zhang, J.; Ma, G.; Huang, Y.; Sun, J.; Aslani, F.; Nener, B. Modelling uniaxial compressive strength of lightweight self-compacting concrete using random forest regression. Constr. Build. Mater. 2019, 210, 713–719. [Google Scholar] [CrossRef]
  52. Deng, C.X.; Xu, L.X.; Li, S. Classification of Support Vector Machine and Regression Algorithm; INTECH Open Access Publisher: London, UK, 2010. [Google Scholar]
  53. Tran, V.Q.; Dang, V.Q.; Ho, L.S. Evaluating compressive strength of concrete made with recycled concrete aggregates using machine learning approach. Constr. Build. Mater. 2022, 323, 126578. [Google Scholar] [CrossRef]
  54. Soliman, O.S.; Mahmoud, A.S. A classification system for remote sensing satellite images using support vector machine with non-linear kernel functions. In Proceedings of the 8th International Conference on Informatics and Systems (INFOS), Giza, Egypt, 14–16 May 2012; p. BIO-181. [Google Scholar]
  55. DeCastro-García, N.; Muñoz Castañeda, Á.L.; Escudero García, D.; Carriegos, M.V. Effect of the sampling of a dataset in the hyperparameter optimization phase over the efficiency of a machine learning algorithm. Complexity 2019, 2019, 1–16. [Google Scholar] [CrossRef]
  56. Cheng, J.; Dekkers, J.C.M.; Fernando, R.L. Cross-validation of best linear unbiased predictions of breeding values using an efficient leave-one-out strategy. J. Anim. Breed. Genet. 2021, 138, 519–527. [Google Scholar] [CrossRef] [PubMed]
  57. Cheng, H.; Garrick, D.J.; Fernando, R.L. Efficient strategies for leave-one-out cross validation for genomic best linear unbiased prediction. J. Anim. Sci. Biotechnol. 2017, 8, 38. [Google Scholar] [CrossRef]
  58. Shao, Z.; Er, M.J. Efficient leave-one-out cross-validation-based regularized extreme learning machine. Neurocomputing 2016, 194, 260–270. [Google Scholar] [CrossRef]
  59. Cha, G.-W.; Kim, Y.-C.; Moon, H.J.; Hong, W.-H. New approach for forecasting demolition waste generation using chi-squared automatic interaction detection (CHAID) method. J. Cleaner Prod. 2017, 168, 375–385. [Google Scholar] [CrossRef]
  60. Singh, T.; Uppaluri, R.V.S. Machine learning tool-based prediction and forecasting of municipal solid waste generation rate: A case study in Guwahati, Assam, India. Int. J. Environ. Sci. Technol. 2023, 20, 12207–12230. [Google Scholar] [CrossRef]
  61. Wu, Z.; Ann, T.W.; Shen, L.; Liu, G. Quantifying construction and demolition waste: An analytical review. Waste Manag. 2014, 34, 1683–1692. [Google Scholar] [CrossRef]
  62. Wang, Z.; Xie, W.; Liu, J. Regional differences and driving factors of construction and demolition waste generation in China. Eng. Constr. Archit. Manag. 2022, 29, 2300–2327. [Google Scholar] [CrossRef]
  63. Wang, Z.; Han, F.; Xia, B.; Liu, J.; Zhang, C. Regional differences and heterogeneity of construction and demolition waste with economic growth: Evidence from China. Constr. Manag. Econ. 2023, 41, 44–59. [Google Scholar] [CrossRef]
  64. Liu, J.; Wu, P.; Jiang, Y.; Wang, X. Explore potential barriers of applying circular economy in construction and demolition waste recycling. J. Clean. Prod. 2021, 326, 129400. [Google Scholar] [CrossRef]
Figure 1. Research methodology.
Sustainability 16 07064 g001
Figure 2. Ratio of recycling and landfill waste generation.
Sustainability 16 07064 g002
Figure 3. Pearson’s correlation between input variables and recycling and landfill waste generation.
Sustainability 16 07064 g003
Figure 4. Performance results for various predictive models for recycling and landfill waste generation.
Sustainability 16 07064 g004
Figure 5. Correlation between observed and predicted values of the validation model by RF algorithm: (a) R1, (b) R2, (c) R3, (d) L1, and (e) L2 model.
Sustainability 16 07064 g005
Figure 6. Comparison of observed and predicted values by RF algorithm: (a) R1, (b) R2, (c) R3, (d) L1, and (e) L2 model.
Sustainability 16 07064 g006
Figure 7. Impact on model output of the important variables influencing demolition waste generation by waste type according to SHAP values. (a) R1, (b) R2, (c) R3, (d) L1, and (e) L2 model.
Sustainability 16 07064 g007
Table 1. Statistical analysis of information comprising the study dataset.
Building Characteristics Count
ProjectA81
B69
UsageResidential135
Residential and commercial15
StructureReinforced concrete81
Concrete block5
Concrete brick35
Wood29
Wall typeBlock121
Brick22
Soil7
Roof typeRoofing tile74
Slab27
Slab and roofing tile33
Slab and slate3
Slate13
No. of floors1114
236
Equipment typeA35
B86
C29
Table 2. Statistical analysis on recycling and landfill waste generation.
ClassificationMaximumMinimumMean
Floor area (m2)295.2252.42133.14
Recycling 1 (mineral) (kg) 402,040.2535,540.20126,319.07
Recycling 2 (combustible) (kg) 28,546.88721.508834.02
Recycling 3 (metals) (kg)30,011.73143.906500.95
Landfill 1 (specified waste) (kg)6642.720.00659.86
Landfill 2 (mixed waste) (kg)68,651.986421.8024,066.29
Table 3. Hyperparameters considered for developing machine learning predictive models.
AlgorithmsPrediction ModelConsidered HP TitleSelected HP
ANNRecycling 1 (R 1)Activation function, no. of neurons, regularization, iteration ReLu, 12, 30, 70
Recycling 2 (R 2)ReLu, 12, 30, 70
Recycling 3 (R 3)ReLu, 12, 30, 70
Landfill 1 (L 1)ReLu, 25, 30, 40
Landfill 2 (L 2)ReLu, 20, 30, 70
DTR 1Min_samples_split, criterion, max_depth3, 11, 4
R 23, 11, 4
R 33, 11, 4
L 12, 6, 2
L 23, 11, 4
GBMR 1n_estimators, criterion, max_depth, learning rate 20, 2, 2, 0.25
R 225, 3, 2, 0.25
R 315, 2, 2, 0.20
L 115, 2, 2, 0.25
L 225, 2, 2, 0.25
KNNR 1No. of neighbors, metric, weight3, Manhattan, distance
R 23, Manhattan, distance
R 33, Manhattan, distance
L 12, Manhattan, distance
L 23, Manhattan, distance
LRR 1Regularization method, alpha valueRidge, 1
R 2Ridge, 1
R 3Ridge, 1
L 1Ridge, 1
L 2Ridge, 1
RFR 1n_estimators, criterion, max_depth, max_features35, 2, 9, 8
R 235, 2, 9, 8
R 335, 2, 9, 8
L 135, 2, 11, 8
L 235, 2, 9, 6
SVRR 1C, epsilon, kernel type (gamma, coefficient, degree)20, 0.35, Polynomial (2, 8, 2)
R 220, 0.3, Polynomial (0.9, 9.5, 2)
R 320, 0.35, Polynomial (1, 8, 2)
L 19, 0.3, Polynomial (1, 8, 2)
L 220, 0.35, Polynomial (1, 8, 2)
Table 4. Average performance indicators of various ML models for predicting the waste generation of recycling and landfills.
AlgorithmRMSEMAER-Squared
TrainingValidationTestTrainingValidationTestTrainingValidationTest
ANN2288.304122.323902.501615.914122.322385.030.9770.9510.950
DT3175.805865.856063.402268.705865.853730.360.9730.9440.941
GBM2245.964320.194740.581682.684320.192649.890.9810.9570.954
KNN33.694685.904832.753.894685.902978.301.0000.7760.779
LR5366.726404.706242.793874.356404.704354.990.9440.9260.927
RF1626.833770.253838.401070.553770.252421.080.9930.9510.951
SVR3560.724359.814420.182679.404359.813222.350.9600.9460.945
Table 5. Performance of optimal models using RF algorithm for predicting waste generation of recycling and landfill.
Model TypeTrainingValidationTest
RMSEMAER-SquaredRMSEMAER-SquaredRMSEMAER-Squared
R 15692.293838.750.99713,100.868326.420.98712,670.488158.930.987
R 2486.62350.450.9961266.54862.930.9721271.18851.980.972
R 3792.42414.480.9932044.361119.730.9532004.551063.500.954
L 1232.78105.660.980620.71285.360.858617.64291.140.860
L 2930.01643.420.9972159.551510.980.9862287.411574.080.984
Disclaimer/Publisher’s Note: The statements, opinions and data contained in all publications are solely those of the individual author(s) and contributor(s) and not of MDPI and/or the editor(s). MDPI and/or the editor(s) disclaim responsibility for any injury to people or property resulting from any ideas, methods, instructions or products referred to in the content.

