Article

Holistic Analysis of the Impact of Power Generation Plants in Mexico during Their Life Cycle

by
Diana L. Ovalle Flores
1,
Rafael Peña Gallardo
1,*,
Elvia R. Palacios Hernández
2,
Carlos Soubervielle Montalvo
1 and
Adalberto Ospino Castro
3
1
Facultad de Ingeniería, Universidad Autónoma de San Luis Potosí, Manuel Nava #8, Zona Universitaria, San Luis Potosí 78290, Mexico
2
Facultad de Ciencias, Universidad Autónoma de San Luis Potosí, Av. Chapultepec 1570, Privadas del Pedregal, San Luis Potosí 78295, Mexico
3
Departamento de Energía, Universidad de la Costa, Calle 58 # 55–66, Barranquilla 080002, Colombia
*
Author to whom correspondence should be addressed.
Sustainability 2024, 16(16), 7041; https://doi.org/10.3390/su16167041
Submission received: 5 June 2024 / Revised: 3 August 2024 / Accepted: 10 August 2024 / Published: 16 August 2024

Abstract

:
This paper assesses the environmental, technical, economic, and social impacts of the main energy generation technologies currently used in Mexico. The study used a life-cycle assessment and a multi-criteria decision-making method. The Analytical Hierarchy Process was employed to assess the social, technical, and economic impacts, while the life-cycle assessment examined the environmental effects. This study innovates the way of analyzing power plants since it provides a classification of these technologies considering different aspects, and the rankings can be obtained for each criterion and in a holistic way. According to the study’s findings, photovoltaics and nuclear power plants are the most environmentally friendly options for Mexico. Considering the economic aspects, solar and wind energy are classified as the best technologies for the country. From a technical point of view, the best power plants are combined cycle and thermoelectric plants. The power plants most accepted by society are efficient cogeneration and turbo gas. Finally, the overall ranking from the experts’ perspective for the development of Mexico shows that the best technologies are combined cycle and hydroelectric, with 14% and 12% acceptance, respectively.

1. Introduction

In recent decades, the study of the impact that the development and use of power-generating technologies have on the environment has gained relevance. Consumers are more interested in how electricity generation can negatively affect the environment, natural resources, and society. These effects can occur throughout the entire life cycle of power plants, beginning with construction, operation, and disassembly. Likewise, they include the use and management of raw materials and waste that may be produced in the generation process. The environmental impacts of power plants can be assessed using a life-cycle assessment (LCA) [1].
Most countries rely on fossil fuels as their primary energy source, accounting for more than 80% of the global energy requirement [2]. Nevertheless, fossil fuels are the primary sources of greenhouse gas emissions, leading to environmental issues like global warming and climate change [2]. This is why, in recent years, renewable energies have gained immense importance as alternative sources for electricity generation [3,4]. However, it is important to assess the environmental effects that these alternative energies have, not only in their operation but in their life cycle.
Multiple research studies have examined this issue. In [5], a comprehensive analysis of 167 case studies was conducted to evaluate the environmental impacts of various electricity generation technologies and concluded that renewable energies emit the least greenhouse gases and, therefore, pollute less, with the cleaner technologies being biomass and nuclear energy. In [6], the environmental effects of electricity generation systems are presented, and the research is based on evaluations using the life-cycle assessment (LCA) methodology. The evaluations take into account the impacts resulting from the extraction, transformation, and transportation of fuels, the construction of power plants, and the generation of electricity, and the results show hydroelectric energy, wind power, and nuclear energy affect the environment less.
Reference [7] applied an LCA to renewable electricity in Turkey, analyzing 305 plants that primarily rely on hydro, wind, and geothermal resources. The results indicate that the impacts from large reservoir hydropower are lower than those from small reservoirs, onshore wind is the worst option overall, and geothermal is the best option except for its global warming potential. Similarly, [8] used an LCA to compare photovoltaic, biomass, and pumped storage hydro plants in the United States. The study found that PV plants are less hazardous to the environment than other renewable energy plants. Focusing specifically on environmental effects, [9] employed a process-based LCA approach for various renewable energy generation systems. The authors created a comprehensive life-cycle inventory using a reliable global database. Finally, [10] proposed a cradle-to-grave LCA of Mexico’s main power plants, presenting a ranking of the cleaner technologies in the study.
Beyond the environmental impact, selecting the optimal power plant for a nation’s development requires a multifaceted approach. Additional factors include technical compatibility with existing electrical grids, technology and generation costs, and social acceptance. In such energy planning scenarios, multiple criteria decision-making methods (MCDMs) prove invaluable. These methods excel at evaluating complex decisions with numerous weighted criteria [11].
The goal of energy planning is to meet the needs of society based on specific quality and technical parameters and affordable and acceptable prices [12]. Correct planning must consider varied factors, and some methods help to make the optimal decision. Since different MCDM methods can yield varying solutions, the final choice should prioritize a balance between minimizing environmental impact, ensuring resource availability, meeting energy demand, and maintaining cost-effectiveness. A clear example of this is in [13], which uses the Analytical Hierarchy Process (AHP) to prioritize a certain number of criteria and make a good selection of the appropriate areas to implement wind energy plants in the Colombian Caribbean Sea.
Examples of studies that address the problem of selecting the best power generation plants for some countries are reported in [14], where the authors compare different methods to carry out a study for Taiwan and conclude, through ranking, what technologies are optimal for the development of their country. An additional step involves sensitivity analysis, and this technique helps us understand how much the chosen power plant changes if the relative importance (weights) assigned to different criteria, like the environmental impact or cost, are adjusted. Likewise, in [15], the MCDMs integrated into an LCA of renewable energies are analyzed to obtain a reduction in uncertainty in decision-making since the LCA only focuses on quantifying environmental impacts, while the MCDMs can address other dimensions, such as social, economic, and technical impacts.
This study evaluates the environmental, technical, economic, and social impacts of Mexico’s main power generation technologies. It employs the Analytical Hierarchical Process (AHP) to rank these technologies. First, an AHP analysis based on life-cycle assessment (LCA) data is conducted. This is followed by separate AHP analyses for economic, technical, and social criteria. Finally, an overall ranking is created that considers all four categories.
This research breaks new ground for Mexico by being the first to assess power generation technologies across these four diverse categories. Additionally, it builds upon previous studies by establishing evaluation criteria specific to the Mexican context, drawing on the existing literature, and incorporating expert and public opinion to weigh the AHP criteria.
This paper is structured as follows: Section 2 provides an overview of Mexico’s current power generation landscape. Section 3 delves into the multi-criteria decision-making method employed in this research. Section 4 outlines the established criteria for evaluating power plants. Section 5 presents the results obtained from the life-cycle assessment (LCA) of Mexico’s primary power plants. Section 6 details and discusses the findings from the AHP analysis across the four considered categories. Finally, Section 7 summarizes the main conclusions of this study.

2. Power Generation in Mexico

Mexico’s National Energy Control Center (CENACE) plays a crucial role in ensuring the efficient, high-quality, dependable, and sustainable operation of the National Electrical System. This government agency goes beyond day-to-day operations by proposing the expansion and modernization of the transmission network and advocating for new power plants that align with the nation’s energy policy [16].
Table 1 shows the key technologies used to generate electricity in Mexico and their classification. A recent report from the Development Program of the National Electrical System of Mexico indicates that Mexico has 158 power plants [17], which are classified into three categories: conventional, clean, and other. The term conventional is used for technologies that can generate a significant amount of energy but that pollute in the generation process; clean technologies are all those that do not generate pollution during the production process or do so below an established limit; while the other category refers to technologies that generate electricity from the waste of another process. Table 1 shows the key technologies used to generate electricity in Mexico and their classification.
Figure 1 shows the installed capacity by type of generation technology as of 31 December 2022 [17]. Combined cycle technology holds the highest installed capacity with 39%, followed by hydroelectric with 14.6% and thermoelectric with 13.70%. The technologies with the least installed capacity are geothermal, internal combustion, and bioenergy, with 1.10%, 0.80%, and 0.40%, respectively. The remaining technologies that appear in Table 1 but do not appear in Figure 1 are those whose installed capacity is less than 0.10% and, therefore, are considered insignificant.
Across the nation, there are ten different generation technologies with installed capacity of at least 1% of the total capacity. This study considers these technologies.

3. Materials and Methods

In this paper, two methodologies are used together, life-cycle analysis (LCA) and multi-criteria decision-making methods (MCDMs), with the aim of reducing the uncertainty of the results and supporting those in charge to make better energy decisions.
An LCA examines the environmental impact of a technology throughout its entire lifespan, from resource extraction and material processing to operation, maintenance, and decommissioning [18]. On the other hand, MCDMs help compare and rank multiple technologies based on various criteria. The inventory used to develop the LCA of the selected technologies is shown in Section 6.

4. Multi-Criteria Decision-Making Methods

MCDMs are valuable techniques for identifying the most suitable option in each scenario or field of study, considering multiple criteria during the decision-making process. These methods can manage both qualitative and quantitative criteria. Various MCDMs exist, with prominent ones including the Analytic Hierarchy Process (AHP), Fuzzy Set Theory (FST), Goal Programming (GP), Technique for Order of Preference by Similarity to Ideal Solution (TOPSIS), and Data Envelopment Analysis (DEA) [19].

4.1. Analytical Hierarchy Process

The AHP has been widely utilized in academic literature due to its ease of use and efficiency. Professor Thomas L. Saaty proposed this method as a solution to facilitate decision-making in situations with multiple criteria [20]. It is based on assigning judgments and weights to factors considered to obtain a good ranking of criteria [21].
It is worth mentioning that the AHP method was used because it has proven effective and easy to apply, and it is the most used method in the literature for these types of studies. Its advantages are as follows:
  • Structured Framework: simplifies complex decisions by organizing them hierarchically;
  • Multiple criteria: considers both qualitative and quantitative factors;
  • Group decision-making: facilitates consensus among groups;
  • Consistency check: ensures logical and reliable judgments;
  • Flexibility: adaptable to various fields and scenarios;
  • Prioritization: focuses on the most critical factors;
  • Transparency: provides a clear audit trail;
  • Quantification: converts subjective assessments into quantitative data;
  • Comprehensive analysis: offers a holistic view of the decision problem.

AHP Methodology

The AHP methodology is based on a peer-to-peer comparison and can be implemented by asking the following question: how important is criterion Ci compared to criterion Cj? [14].
Therefore, when asking the above question, a weight can be assigned to each selected criterion, in addition to determining its importance by comparing each criterion pairwise with the other criteria. This process allows the prioritization and evaluation of alternatives [14]. Therefore, the AHP allows decision-making by segmenting and analyzing the available information and organizing it in a clear and efficient way.
The AHP methodology consists of seven steps [22]. The first step consists of hierarchically ordering the elements of the problem. For this, a decision problem and the objective of the analysis must be clearly stated.
In the second step, the evaluation of the elements takes place. The criteria are evaluated through pairwise comparisons and the alternatives relative to each of the criteria. This process is carried out through judgments issued by the decision-maker regarding importance, preference, or probability and considering a scale. Table 2 shows the scale used in the AHP.
The second step yields two matrices. In the first matrix, each criterion is compared with the others, which is as follows:
C r i t e r i a C 1 C 2 C 3 C n C 1 1 y 12 y 13 y 1 n C 2 y 21 1 y 23 y 2 n C 3 y 31 y 32 1 y 3 n C n y n 1 y n 2 y n 3 1
where y i j ,   i = j = 1,2 , , n are the values issued by the decision-maker according to the scale of Table 2.
The second matrix is very similar to (1), with the only distinction being the comparison of alternatives with each other. This procedure is performed for each of the selected criteria, e.g., the comparison matrix of alternatives for criterion 1 (C1) would look as expressed in (2).
C 1 A 1 A 2 A 3 A m A 1 1 y 12 y 13 y 1 m A 2 y 21 1 y 23 y 2 m A 3 y 31 y 32 1 y 3 m A m y m 1 y m 2 y m 3 1
where A i , i = 1,2 , , m represents the alternatives chosen to solve the problem.
The total number of matrices generated equals the total number of criteria plus one. It should be noted that both types of matrices are square matrices, with all the elements of the main diagonal having a value of one since each alternative or criterion holds the same importance regarding itself.
Once the matrices are obtained, the third step is to normalize them in the following way: let a i j be the element of the comparison matrix, then the normalized element n i j is calculated using (3).
n i j = a i j k = 1 n a k j         i j      
where i = 1,2 , , n ; j = 1,2 , , n .
Formation of the normalized comparison matrix is the fourth step, as shown in (4).
A n o r m a l i z e d = n 11 n 12 n 13 n 1 j n 21 n 22 n 23 n 2 j n 31 n 32 n 33 n 3 j n i 1 n i 2 n i 3 n i j
The fifth step is to obtain the column vector of the averages of the rows of the normalized matrices.
A v e   ( A n o r m a l i z e d ) = 1 n 1 n y 1 j 1 n 1 n y 2 j 1 n 1 n y 3 j 1 n 1 n y m j
Then, the priority vector of the criteria is obtained, as shown in (6), where p c i , j ,   i = j = 1,2 , , n represents the priority value that each criterion has. To verify the results, the sum of the elements of the priority vector must be one.
p = p c 11 p c 12 p c 13 p c 1 n
In the sixth step, the vector p′ is the multiplication of the normalized comparison matrix and the priority vector of the criteria concerning the higher hierarchy criterion.
C 1   C 2     C j     C n
A 1 A 2 A j A m x 11 x 12 x 1 j x 1 n x 21 x 22 x 2 j x 2 n x i 1 x i 2 x i j x i n x m 1 x m 2 x m j x m n p 11 p 12 p 1 j p 1 n = p 11 p 12 p 1 j p 1 n
where xij is the performance of the jth criterion of the ith alternative.
The seventh step is to measure the global inconsistency of the values issued by the decision-maker’s judgment through a consistency proportion and a random index. The consistency index (CI) measures the reliability of the matrix that is created when making comparisons with (1). The calculation of this index involves the following:
C I = λ m a x n n 1
where λmax is obtained by dividing the vector p′ by its corresponding average element. The average of the elements of d is λmax, and n is the dimension of the matrix. On the other hand, Table 3 shows the random index, which represents a consistency index determined by the dimension of the matrix [22]. That is, depending on the dimension of the matrix, the researcher can determine a random index based on the table provided by the AHP method. The values selected for this study can be found in [22].
Finally, the consistency index is divided by the average random consistency index (IA) to calculate the consistency ratio or CR, as defined by (9).
C R = C I I A

5. Criteria for the Evaluation of Generation Plants

The criteria used for the application of the MCDM were grouped into four categories to make them easier to handle. The typical categories used in the literature are environmental, technical, economic, and social.
Also, more complete results can be obtained by grouping the criteria into categories. In this way, the AHP can be applied individually to each category or globally by considering the four categories together.
After carefully reviewing the literature, twenty-two criteria were selected out of seventy reported. The selection was based on their frequency of use and the type of study conducted, the similarities between criteria, and the circumstances and the scope of this research. Table 4 shows the twenty-two criteria used in this study and classified into the four categories previously mentioned.

Weighting of Criteria

The criteria weights were calculated by surveying two groups of people. In the first group were experts or people with some knowledge of the topic, such as researchers, teachers, students, and professionals in energy issues, who have an expert opinion on the importance of the criteria in the four selected categories. The second group was composed of the general population because, in Mexico, decisions are not always made by experts in the energy field but by politicians with little knowledge about the subject or through surveys of public opinion. Therefore, applying the survey to two groups allows us to compare the different responses and how these responses affect the results.
The surveys applied consist of ten sections. Each section represents an alternative (each generating technology). The participants ranked the level of importance, choosing from the values shown in Table 2, in which each criterion is selected according to their judgment and level of knowledge. The surveys were applied using a web form and were sent to 50 participants, with the aim of targeting people from different sectors of society and having neutrality in the information. After that, the responses were collected, and the information was analyzed.
For example, Table 5 shows the weight assignment process for criterion C13 for the first group, where total means the sum of the values obtained for each criterion on each response. This lets us know which criterion has the highest score and assigns it a weight. This process was the same for each criterion, and with the results, the comparison matrix was calculated, as shown in Table 6.

6. Life-Cycle Assessment

An LCA was used to evaluate the environmental effects of power generation at each stage of its life cycle: construction, operation, and decommissioning.
An LCA is a quantitative and comparative method for identifying environmentally preferable product options and design options since the main objectives of an LCA are to compare products, provide information about some products, and provide information on how to improve an existing product or design into a new and better one, reducing the pollution produced during all its life stages [23]. An LCA has several advantages:
  • Comprehensive evaluation: assesses environmental impacts throughout the entire life cycle;
  • Informed decision-making: guides strategies for improvement and sustainability;
  • Comparison of alternatives: helps choose the most sustainable option;
  • Identification of trade-offs: balances various sustainability goals;
  • Regulatory compliance: supports adherence to environmental regulations;
  • Market differentiation: enhances reputation and competitive advantage;
  • Resource efficiency: identifies inefficiencies and reduces costs and environmental burdens;
  • Transparency and credibility: ensures reliable and credible results through standardized methodologies;
  • Stakeholder engagement: provides clear data to communicate sustainability efforts.

6.1. LCA Methodology

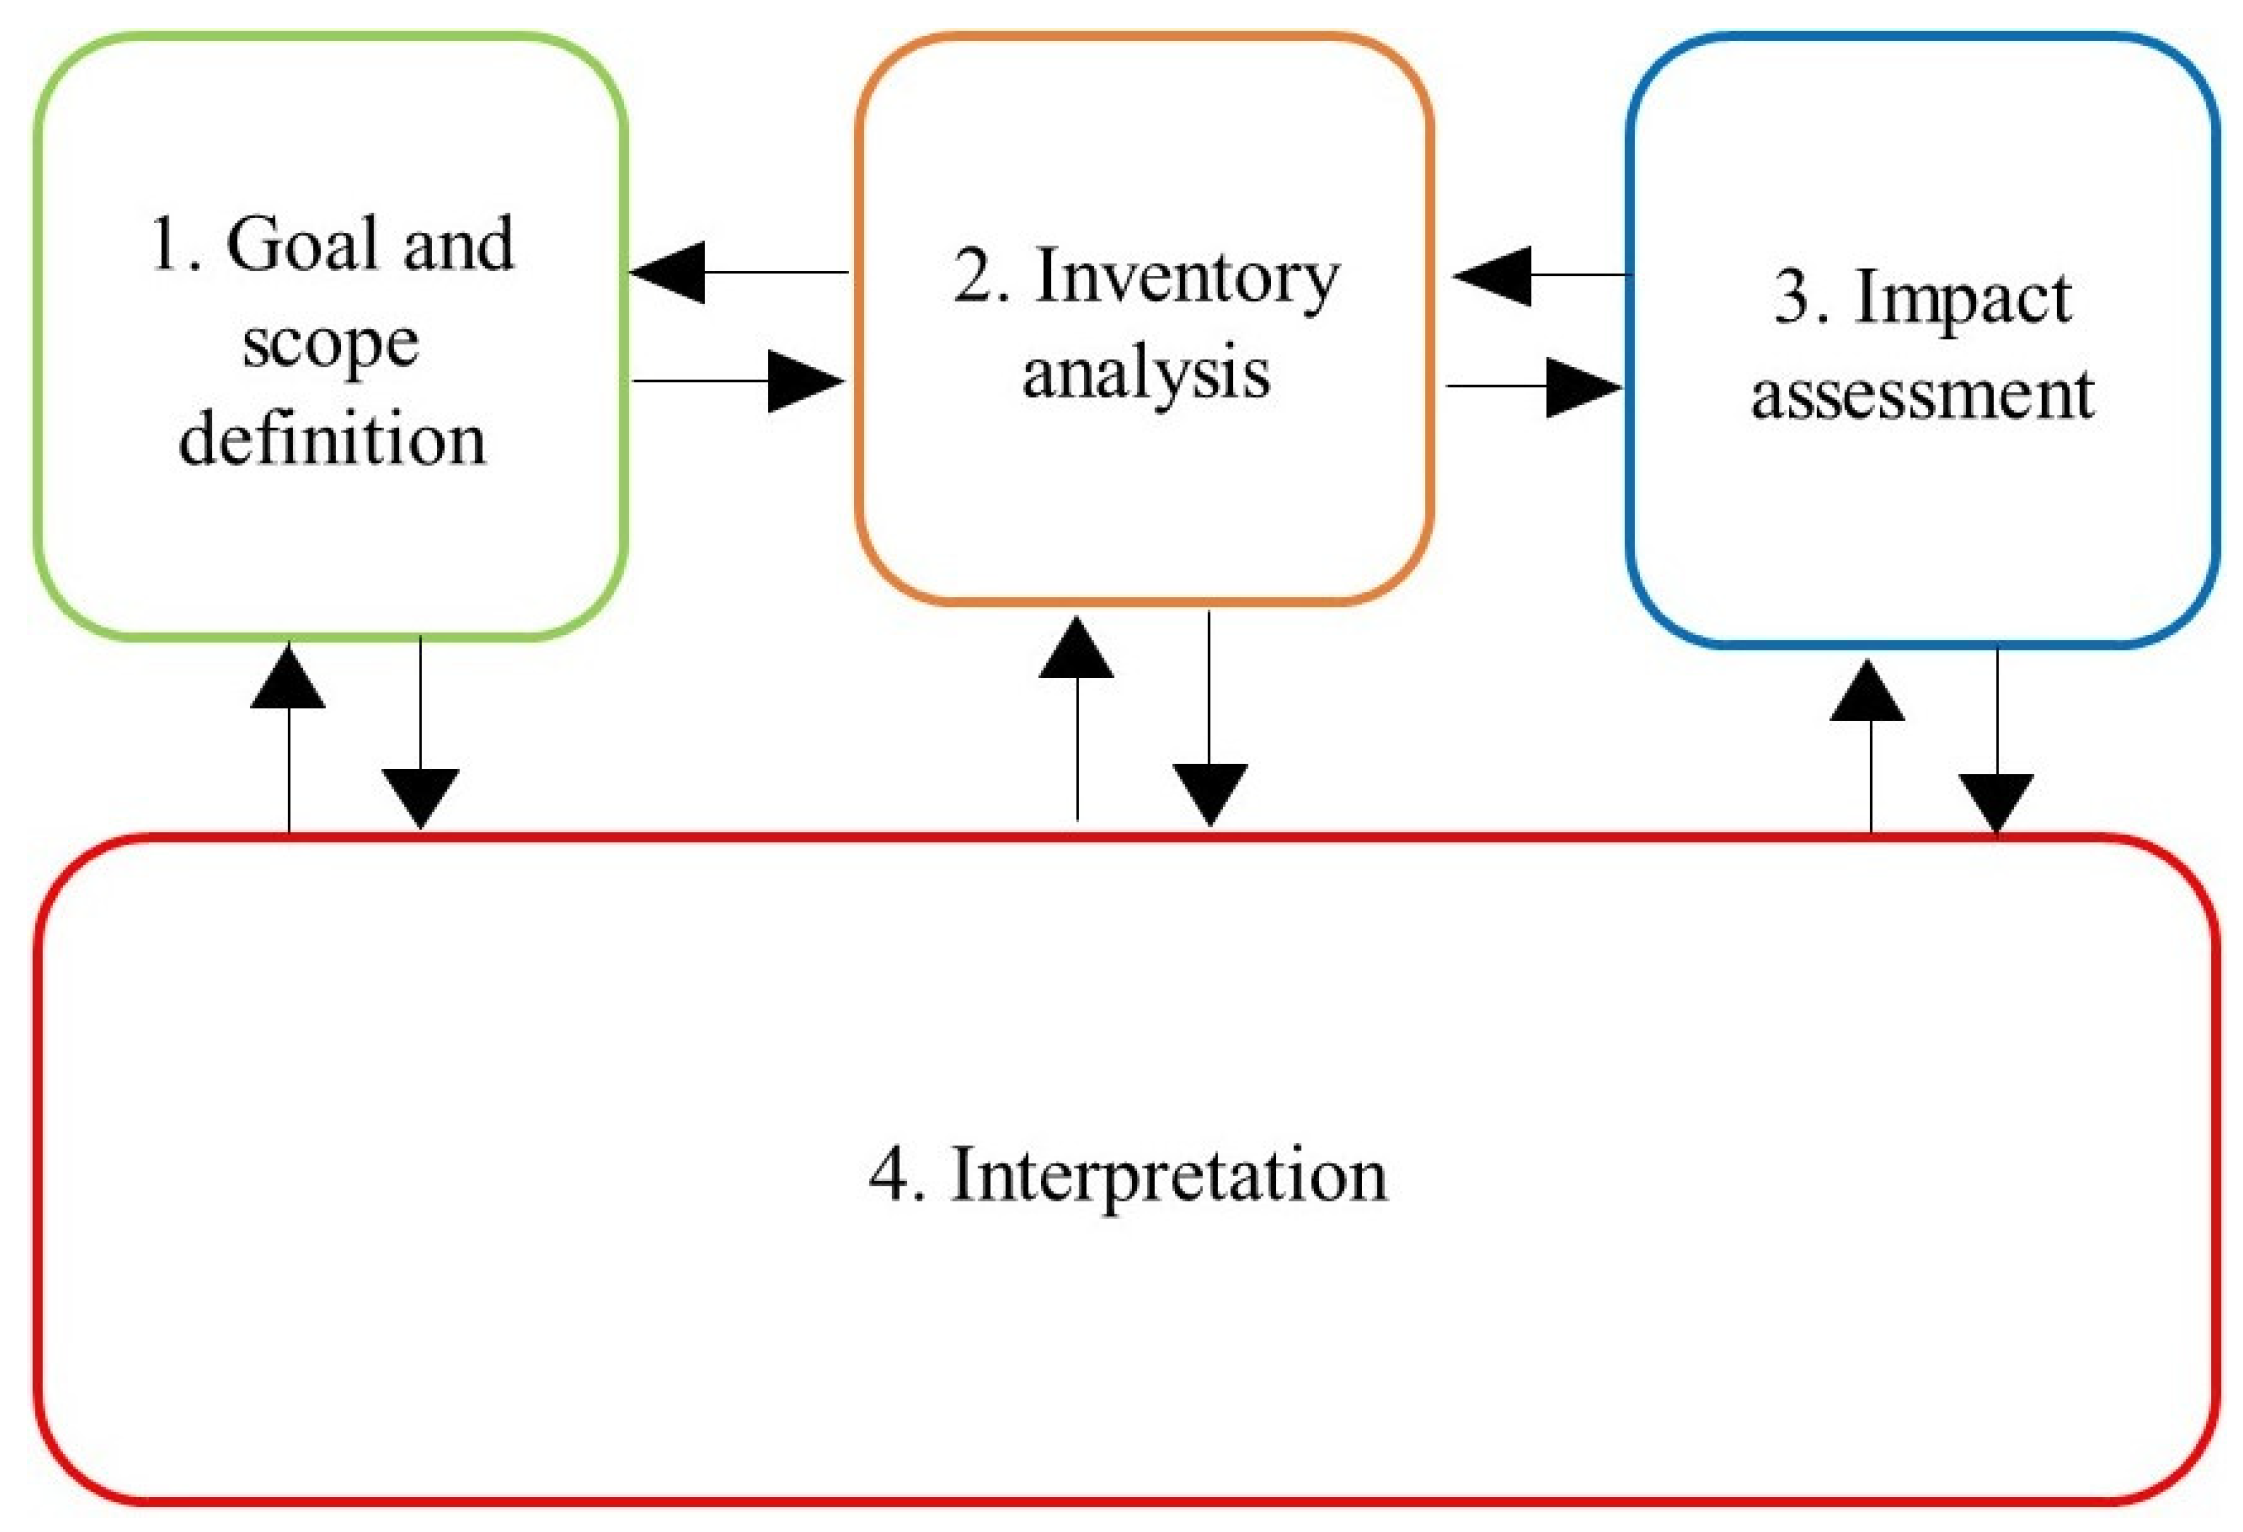
Reference [24] states that several international organizations have reached an agreement that an LCA must follow four steps, as shown in Figure 2.

6.1.1. Definition of Objectives and Scope

An LCA begins by defining the study’s objective and the information to be obtained. The purpose of this research is to calculate the pollution generated by Mexican power plants throughout their life cycle. This study’s scope is from cradle to grave, encompassing all phases of raw material extraction, processing, utilization, and waste disposal.

6.1.2. Inventory Analysis

The inventory includes data on the raw materials needed, the transportation and distribution of materials, the energy used to build and maintain power plants, and, finally, waste management at the end of their life cycle. Below is a list of each power plant included in the study, as well as the references that were used to compile the inventory. Each reference contains detailed information to meet the purpose of the study.
  • Combined cycle plant—[25];
  • Thermoelectric—[25];
  • Coal electric—[26];
  • Turbo gas—[15,27];
  • Wind energy—[28];
  • Hydroelectric—[28];
  • Photovoltaic plants—[29];
  • Geothermal—[30];
  • Efficient cogeneration—[31,32];
  • Nuclear—[33].

6.1.3. Impact Evaluation

This phase links the inventory analysis with the environmental impacts that the system under study could cause, with the importance of quantifying the potential damage caused. SimaPro 9.0 is a sustainability analysis and monitoring tool that was used to conduct the LCA study. To perform the LCA study, a set of environmental impact categories needs to be defined in this software.
The selection included the following categories:
  • Global warming;
  • Ionizing radiation;
  • Ozone formation and human health;
  • Ozone formation and terrestrial ecosystems;
  • Stratospheric ozone depletion;
  • Fine particulate matter formation;
  • Freshwater eutrophication;
  • Freshwater ecotoxicity;
  • Water consumption;
  • Marine eutrophication;
  • Marine ecotoxicity;
  • Human non-carcinogenic toxicity;
  • Human carcinogenic toxicity;
  • Terrestrial acidification;
  • Terrestrial ecotoxicity;
  • Land use;
  • Mineral resource scarcity;
  • Fossil resource scarcity.
SimaPro enables the creation of a network diagram to illustrate each phase of the LCA, as well as every raw material and energy needed for building the power plant. This visualization facilitates the identification of the most environmentally impactful processes, materials, or stages.
Figure 3 depicts a sample network diagram designed for a wind energy system, assuming 1 kWh power generation with a tolerance of 1.7%. It is important to note that the more detailed and extensive the study, the lower the resolution of the network diagram will be.
The network diagram depicts various materials, fuels, energy sources, and processes within the evaluated system. Each box includes internal measurement lines that illustrate the level of pollution produced throughout the system’s life cycle. An alternative method to identify components responsible for significant pollution is by examining the thickness of lines connecting the boxes, which indicates components with a more pronounced impact.
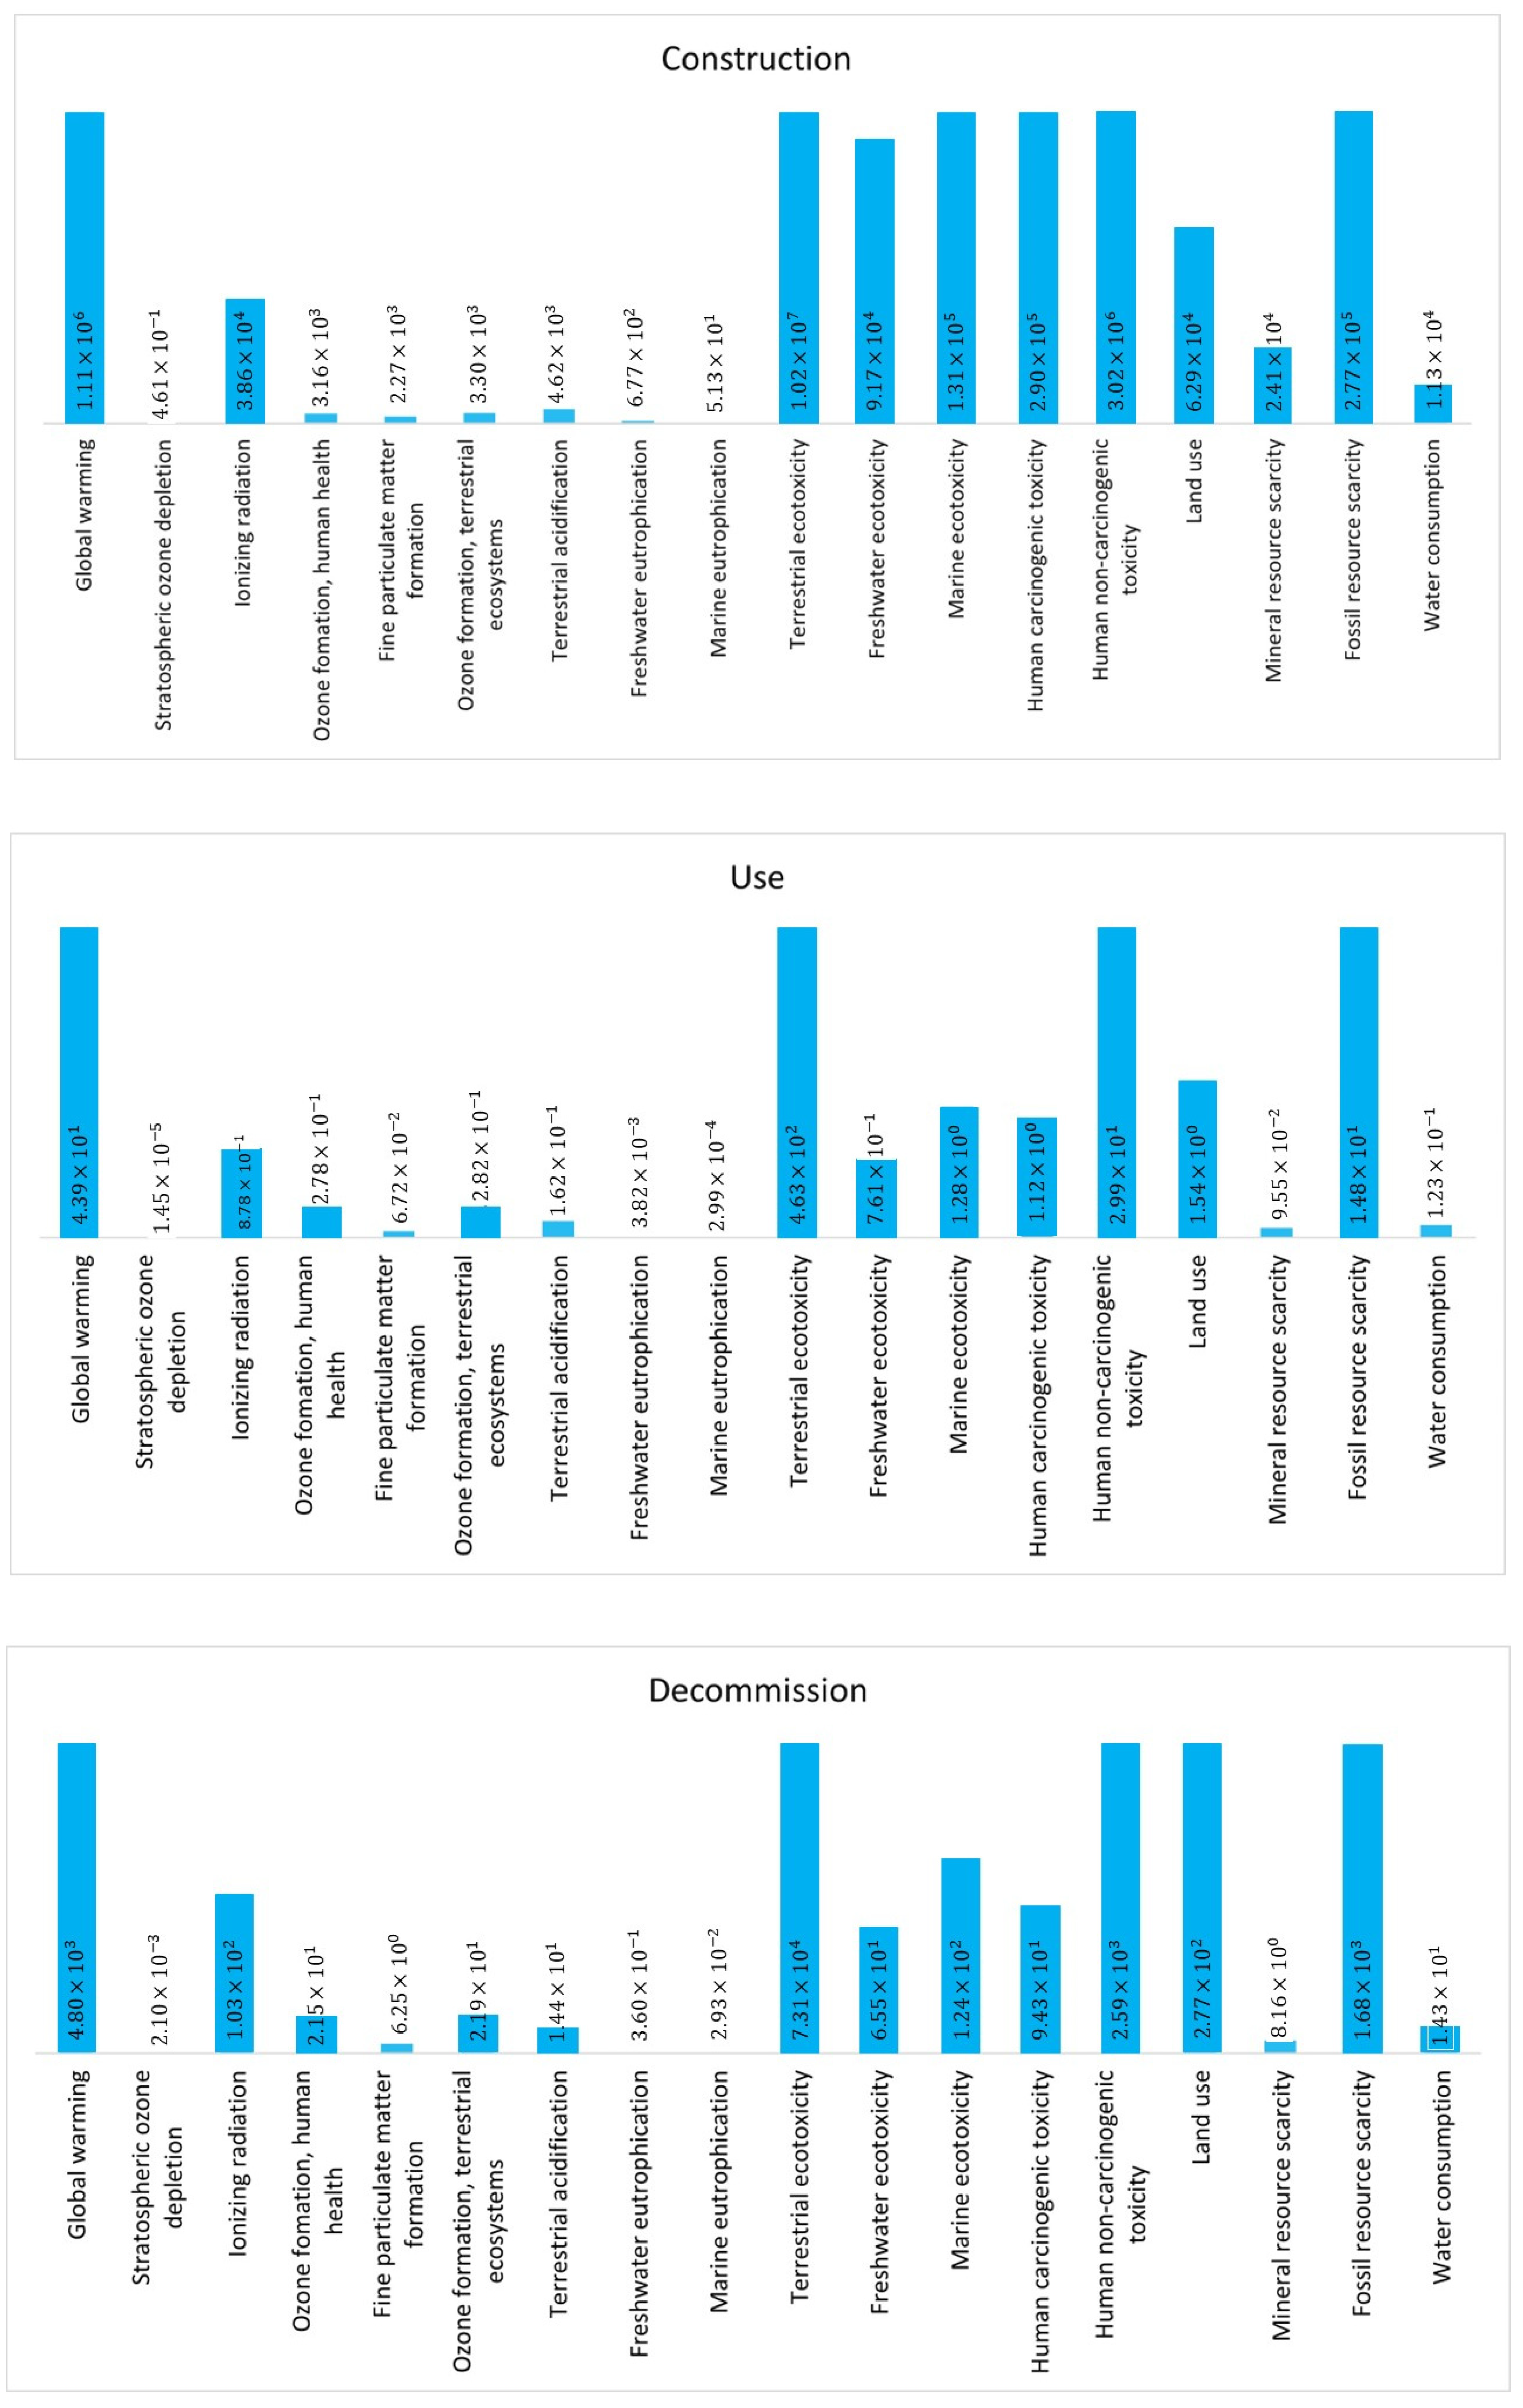
The program also employs bar charts to present the findings. Figure 4 shows a bar graph depicting the impact assessment of the wind energy system. The impacts are categorized into the previously mentioned eighteen and divided across three stages of the system’s life cycle. The units of each category are according to the pollutants that they generate.
Network diagrams and bar graphs were generated for every power plant included in this research.

6.1.4. Interpretation

The final stage of the LCA involves suggesting alterations or remedies to the system to minimize its environmental impact concerning raw materials, energy usage, transportation, and emissions. These suggested changes may encompass both qualitative and quantitative enhancements, such as modifications to processes, systems, raw materials, or waste management practices [34].
The premise of this research is that decision-makers should propose at least a 5% increase in the share of cleaner power plants in the national energy mix based on the obtained results. Additionally, to enhance social and political acceptance, economic support for cleaner technologies should be increased, thereby promoting their use.

7. AHP Simulations and Results

Using the AHP with the results from the LCA and the applied surveys, different rankings of the power plants were obtained. The rankings were classified into the following classes: environmental, by survey applied, and global, considering the results of the first two classes.

7.1. Results by Categories

As mentioned above, the criteria for the assessment of power plants were grouped into four categories: environmental, economic, technical, and social. The ranking of the environmental category was obtained by mapping the results of the LCA. On the other hand, the economic, technical, and social rankings were obtained with the results of the two groups of people surveyed.

7.1.1. Ranking of Power Plants: Environmental Category

The environmental ranking obtained is presented in two ways. The first way considers the three rankings according to each stage of the power plant’s life cycle (construction, use, and decommission), while the second way shows a ranking considering the complete life cycle. The reference value used for the LCA was the power output of each power plant of 1 kWh. This value helped to standardize the obtained results.
A ranking is provided for each stage of the life cycle of a power plant in Table 7. The results are ordered from the less polluting technology to the most polluting. In the construction stage, the less polluting power plants are nuclear, coal, and thermoelectric, while the most polluting are hydroelectric, turbo gas, and wind power. During their use, the less polluting is nuclear, followed by renewable energies, hydroelectric, PV plants, and wind power; the most polluting power plants are those based on fossil fuel burning, such as combined cycle and thermoelectric. The nuclear plants remain the cleanest power plants after decommissioning, while the combined cycle is the most polluting.
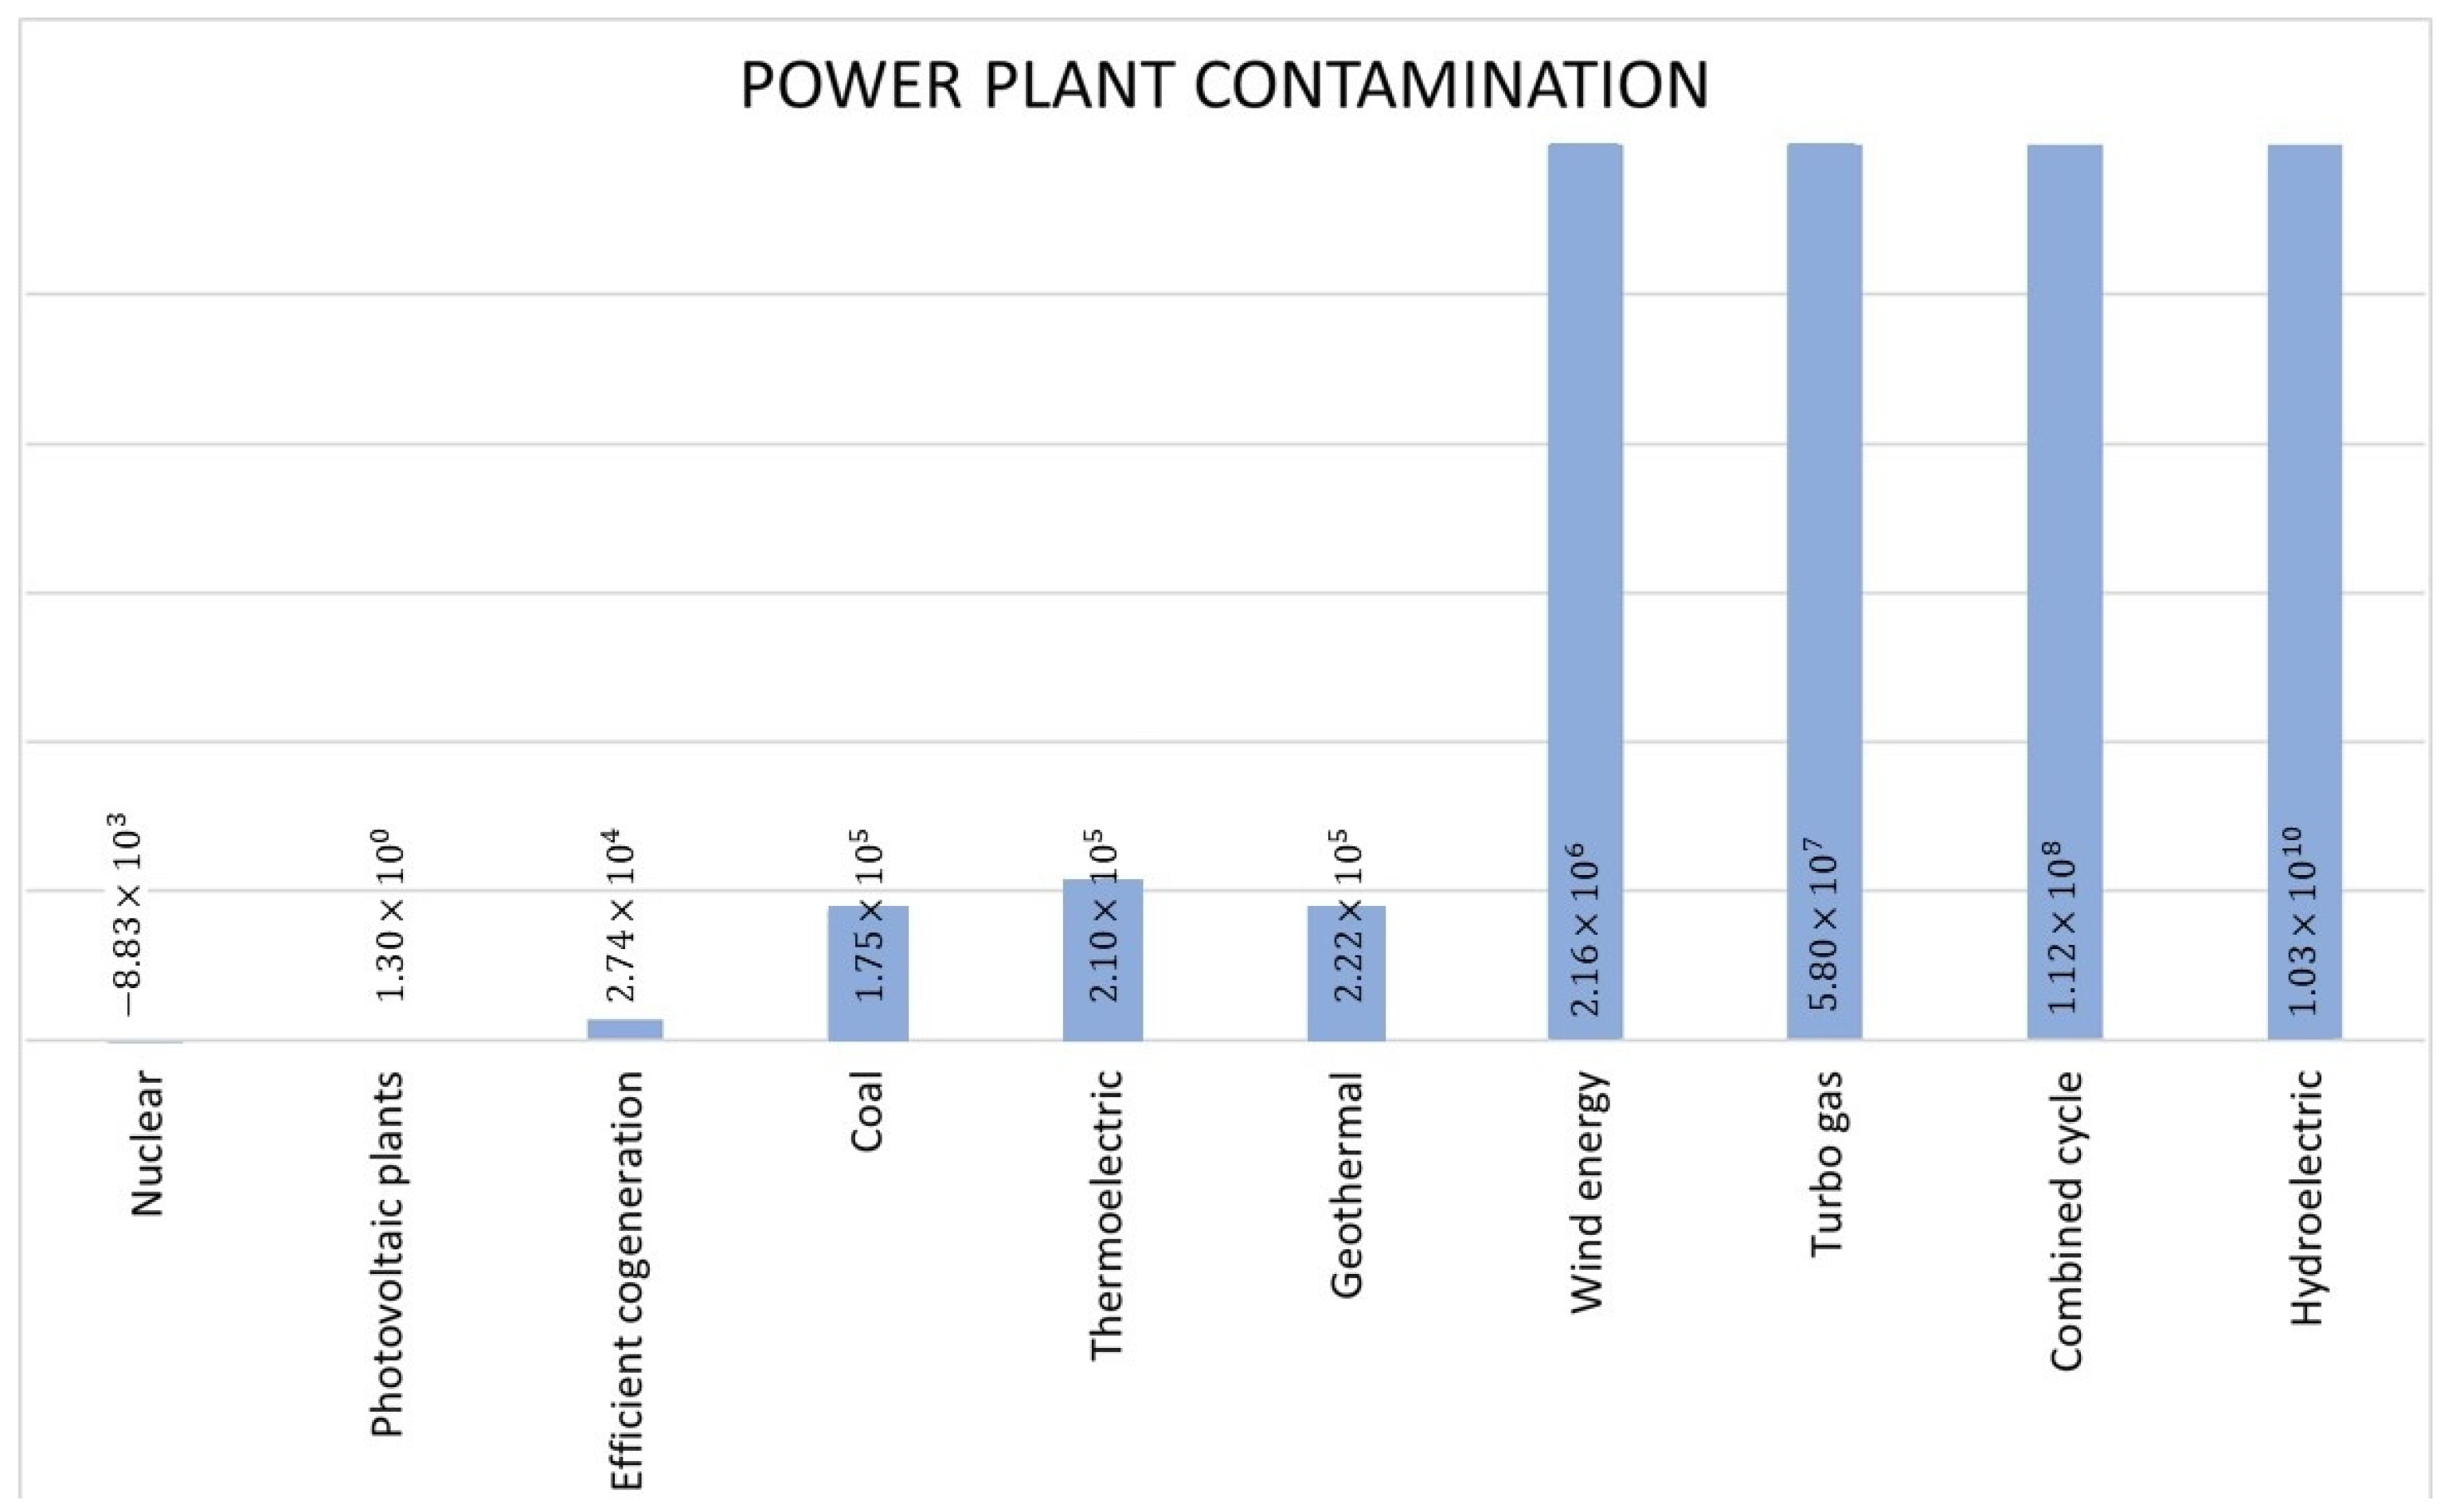
Furthermore, a general ranking can be made considering the three life-cycle stages, as shown in Figure 5. From this figure, nuclear plants are the cleanest technology, followed by PV plants. The most polluting power plant is hydroelectric, but this is because the assembly stage requires a lot of material and energy to build the dam; during its use and disassembly, it is a clean technology. It is worth mentioning that if a hydroelectric plant of lower capacity is considered in the simulations, the impact obtained is lower, and the general ranking changes. In addition, even though wind energy is a type of renewable energy, the production of wind turbines is energy-intensive and uses materials that cause significant emissions, its transportation and installation require heavy machinery and long-distance shipping, adding to greenhouse gas emissions, and the end-of-life disposal or recycling of wind turbine components also generate environmental impacts.

7.1.2. Results According to the First Group of People Surveyed

With the results of the first group surveyed, the economic, technical, and social rankings were obtained. These people are all those who are experts or know about energy issues. Furthermore, to obtain these rankings, the MCDM was used to score the alternatives.
Table 8 shows the obtained rankings. Considering the opinion of the experts for the economic ranking, PV plants, turbo gas, and coal plants are the first in the ranking; the combined cycle, thermoelectric, and hydroelectric plants are the best options for the nation from a technical point of view; while for the social ranking, the efficient cogeneration, combined cycle, and hydroelectric plants are the best evaluated.

7.1.3. Results According to the Second Group of People Surveyed

With the results of the general population survey, three rankings were calculated. Table 9 shows the results. Based on the public’s opinions about each type of generation plant, the results tend to be quite different from those obtained from experts.
As can be seen, there are differences between the results when comparing the perspectives of experts and the public. This discrepancy is due to the lack of information available to society or the low importance given to certain categories, such as social and environmental aspects. Additionally, considering different sectors of society introduces some level of similarity, as some survey respondents indicated knowledge in one category but not in others. In Mexico, where society participates in decision-making, it is crucial to be well-informed about the topic and promote a culture of consulting experts and seeking reliable information.

7.2. Overall Results

For a holistic perspective on the best power plants to use in Mexico, the four categories were composited together. The MCDM and the results of surveys were used to obtain a global ranking. It is considered that each of the four categories has the same weight and level of importance. Additionally, we do not aim to alter the results with our personal opinions. This study seeks results that accurately represent the current state of the country and can serve as an important reference for better decision-making based on the country’s environmental, political, economic, and social conditions.

7.2.1. Global Ranking According to the First Group of People

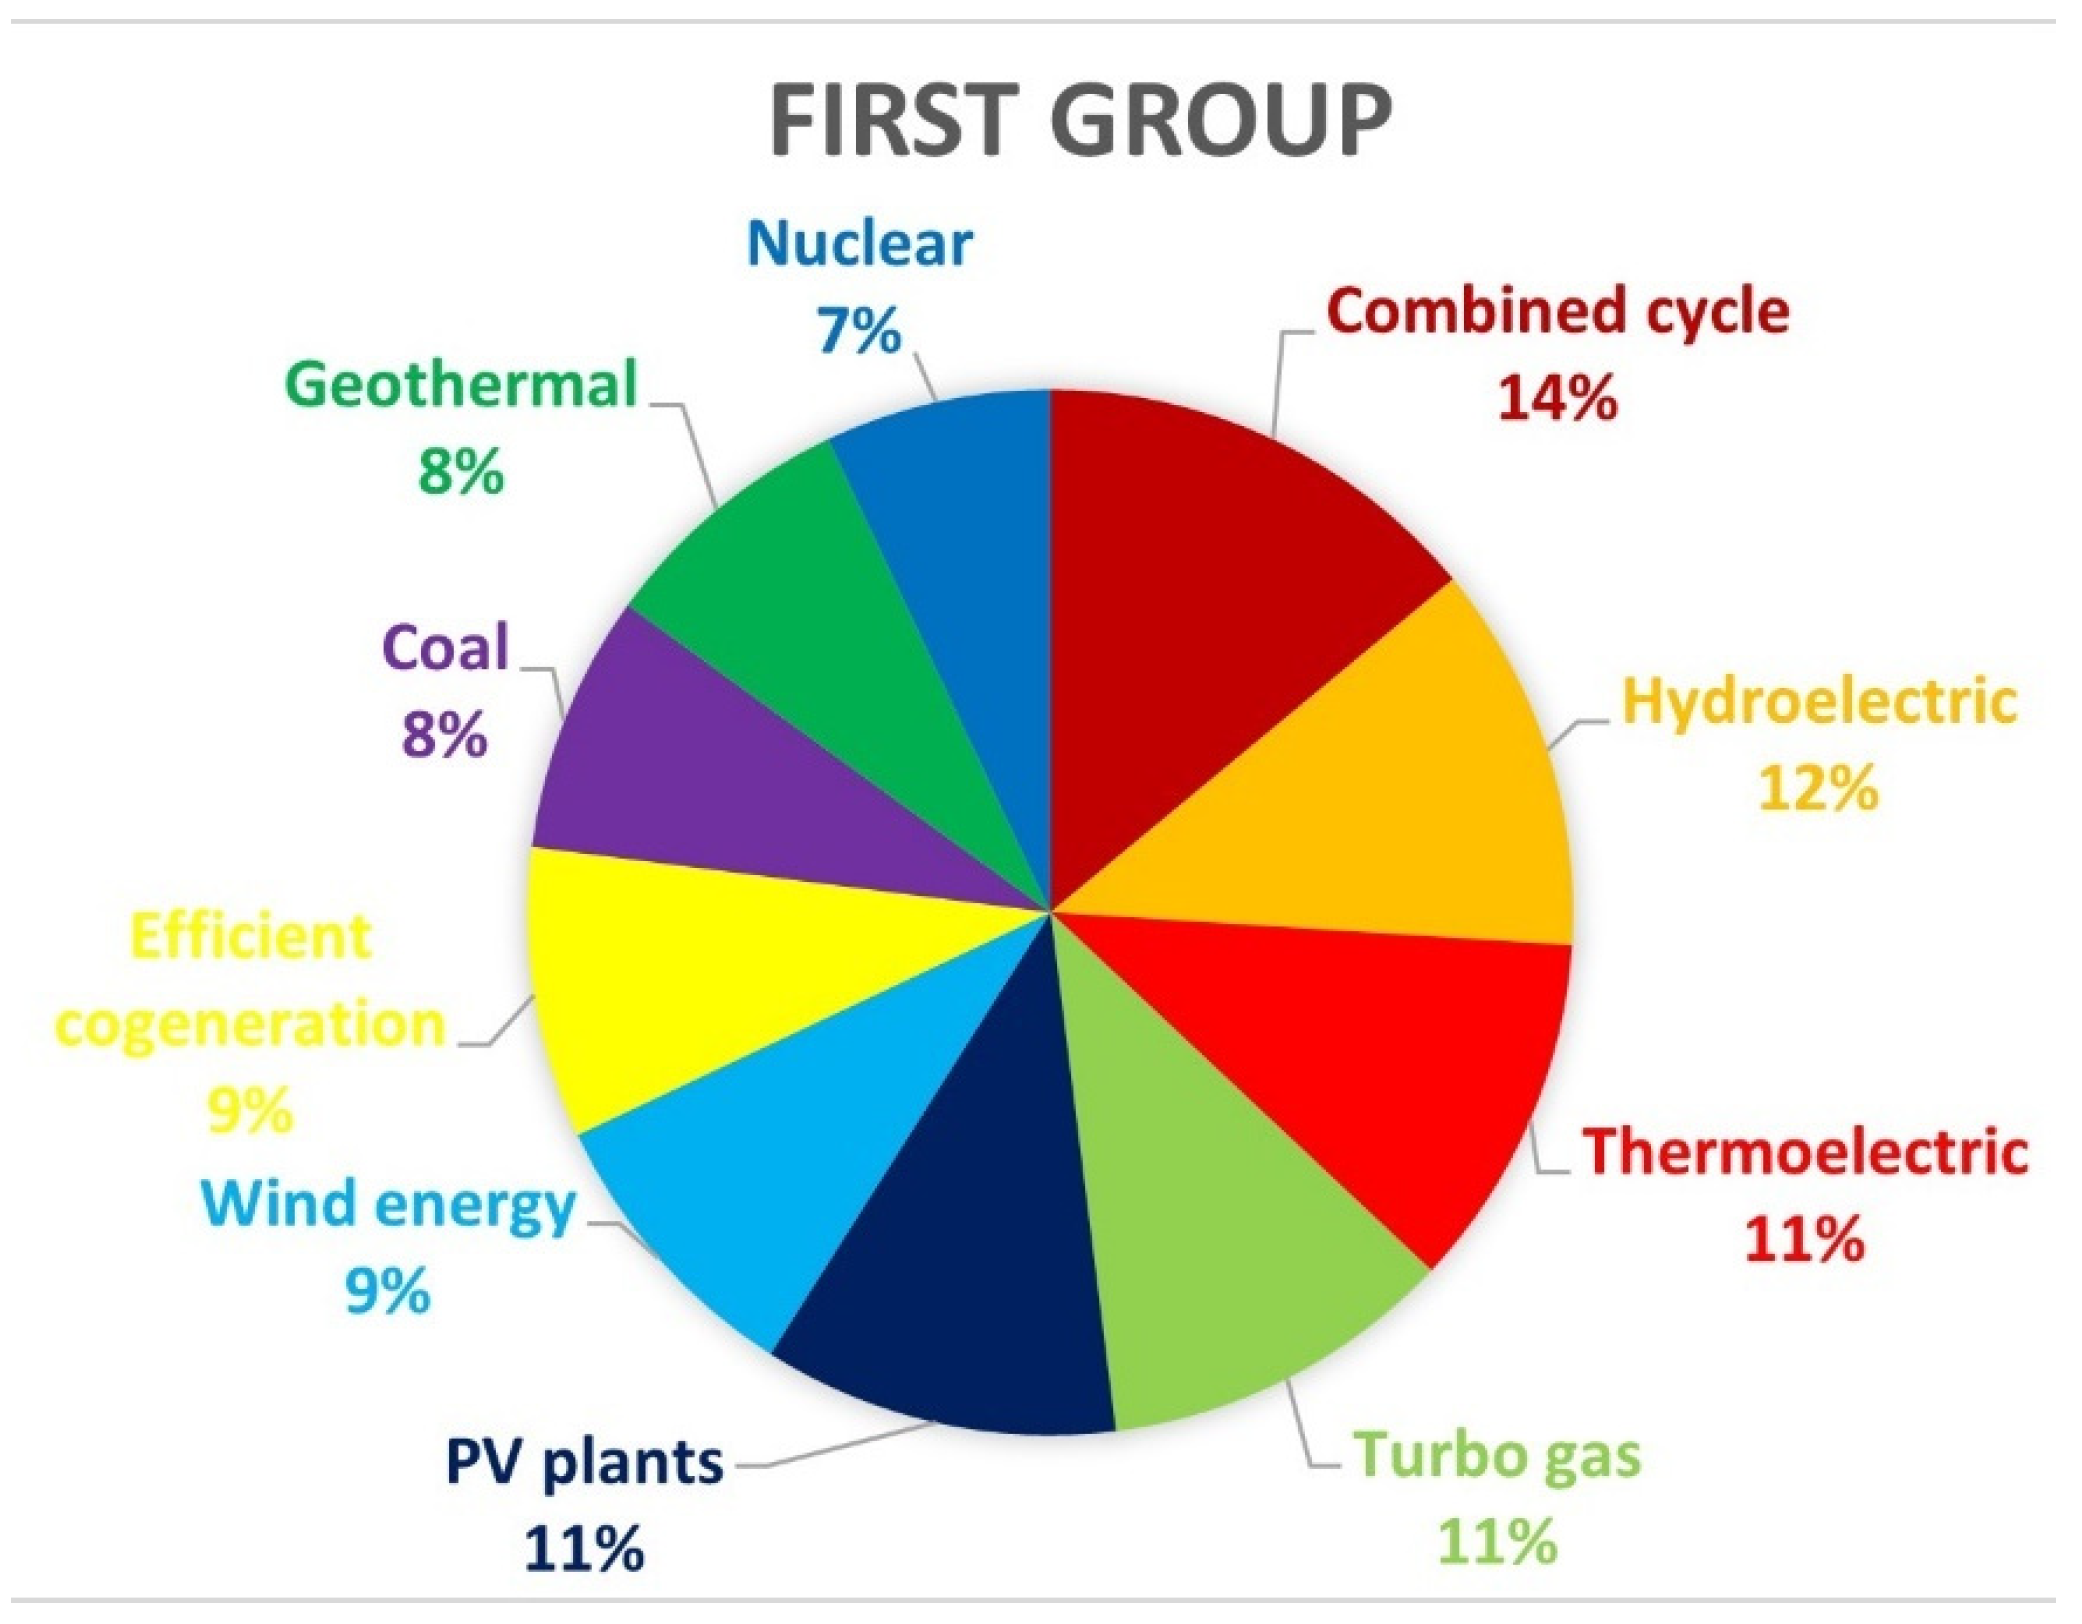
An interesting finding in the results is that the first three technologies that appear in the ranking are the three technologies with the highest installed capacity in the nation. They even appear in the same order, as shown in Figure 1 and Figure 6. The above suggests, according to the opinion of experts and life-cycle analysis, the largest installed capacity in the country is with adequate technologies. However, it would be beneficial to increase the installed capacity using turbo gas plants, PV plants, and hydroelectric power.

7.2.2. Global Ranking According to the Second Group of People

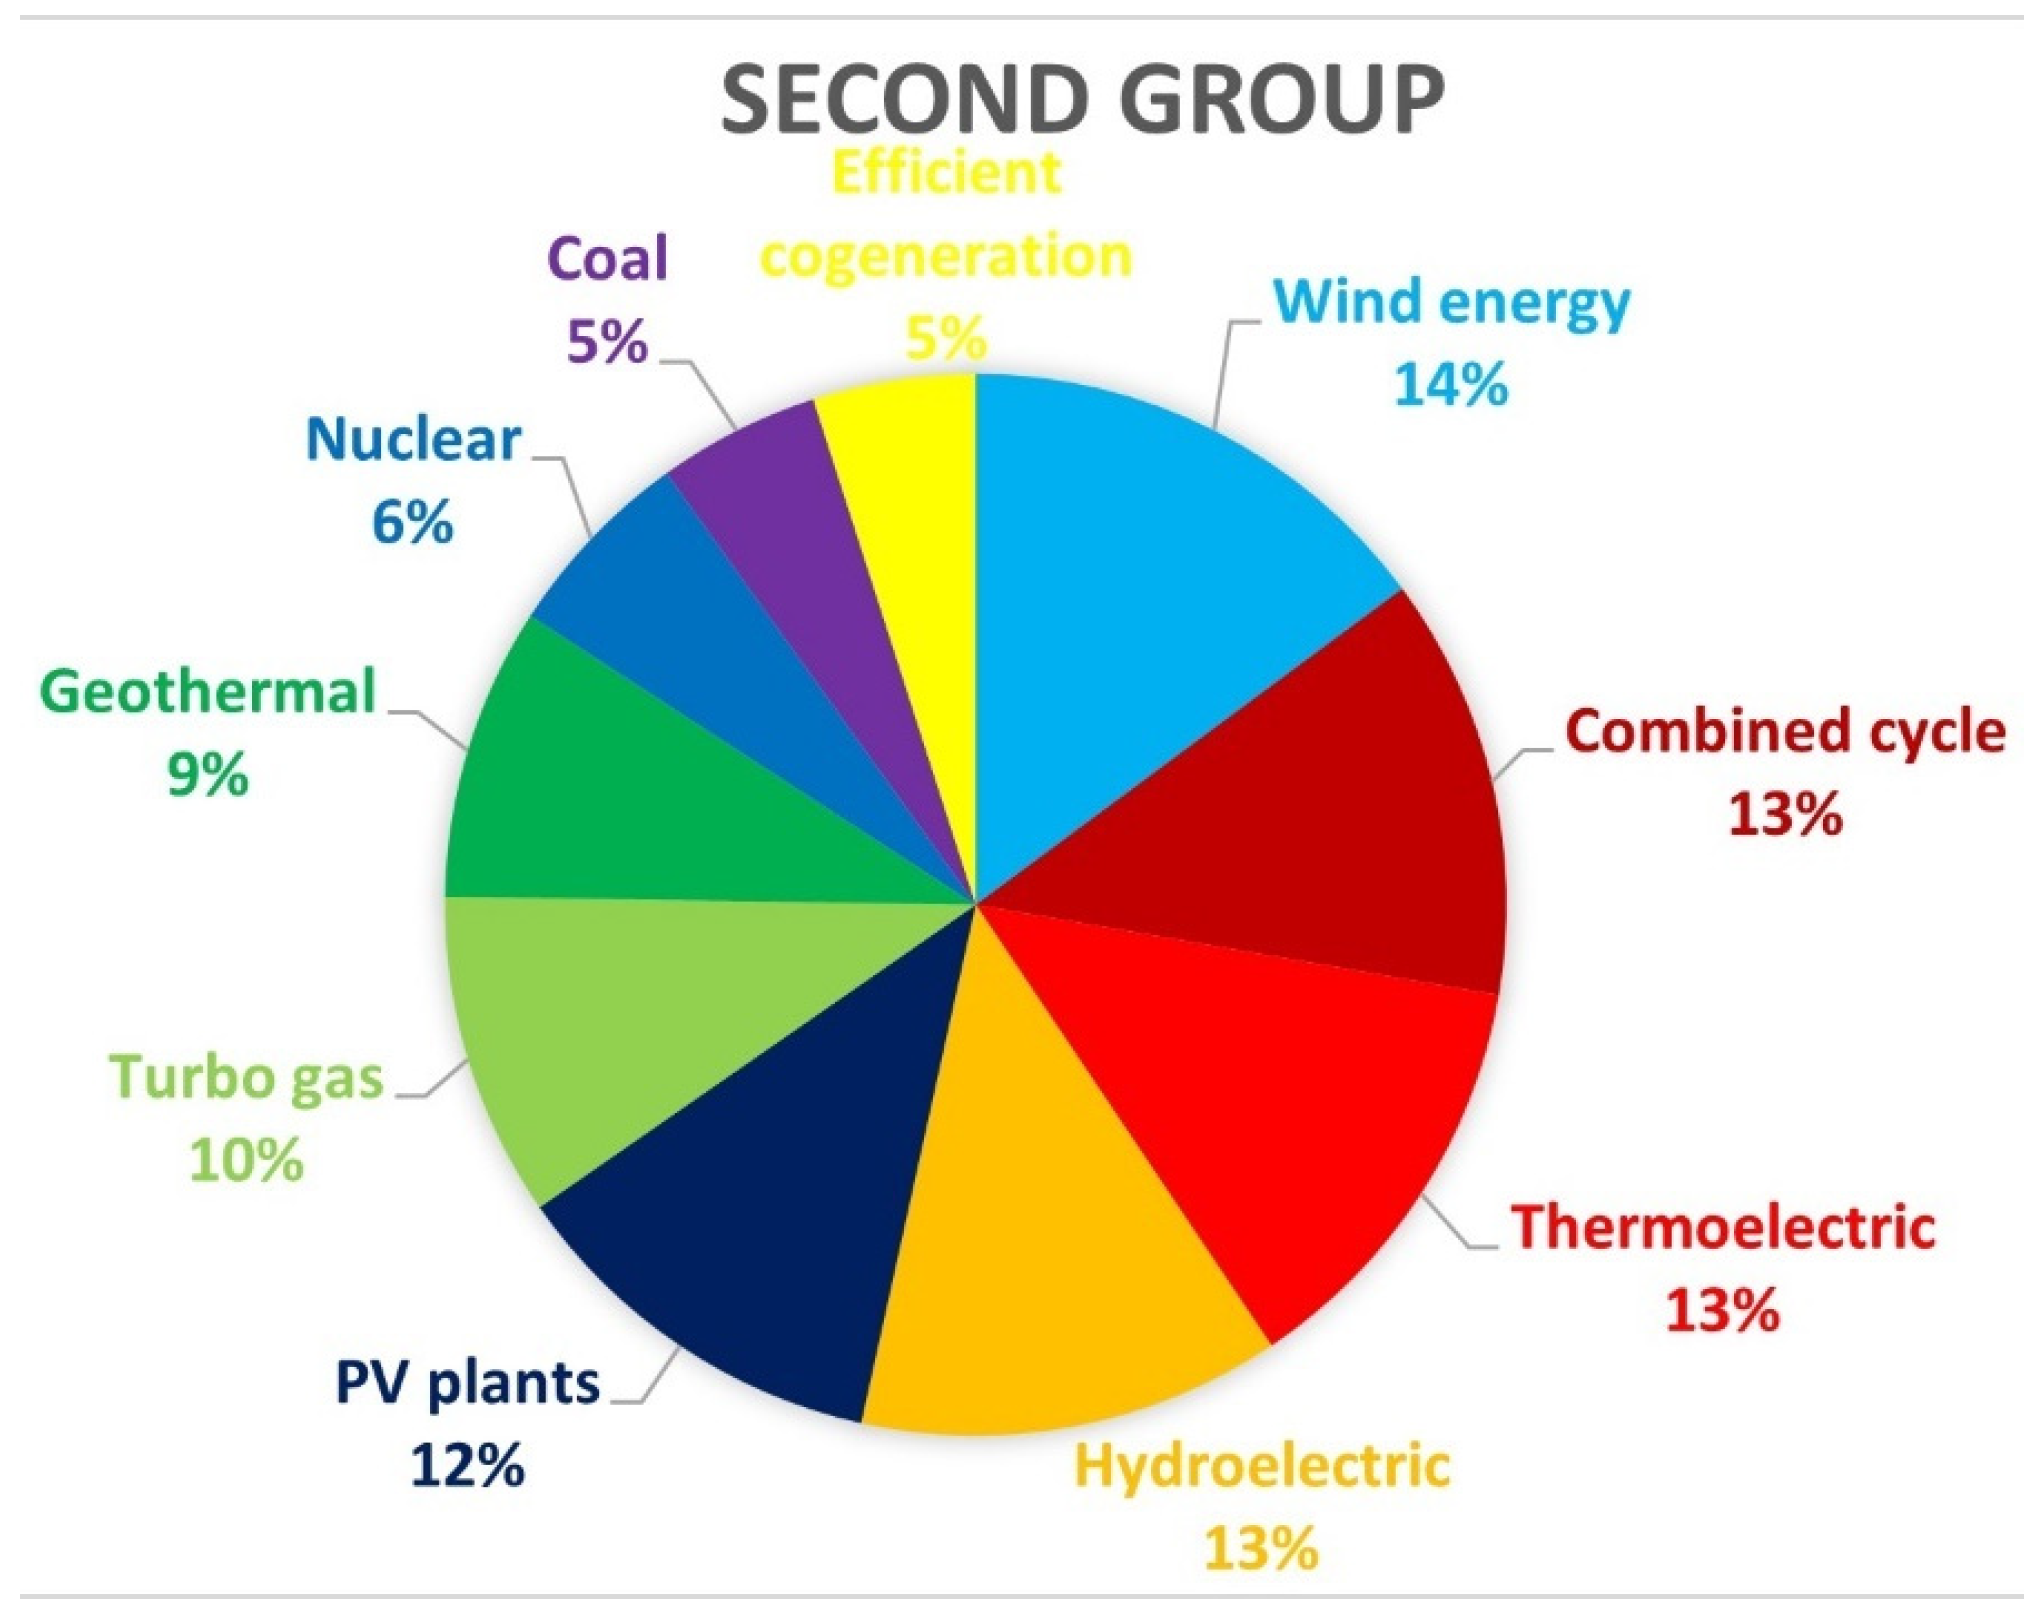
Figure 7 shows the results for the second group of people surveyed and considering the four categories. It should be noted that the combined cycle, thermoelectric, and hydroelectric plants have the same score (13%), occupying second place in the ranking, and these same three technologies appear in first place in the previous ranking. In addition, wind power plants appear in first place, indicating that, according to public opinion, this technology should increase its participation in the country’s energy mix. Comparable results between both global rankings are obtained for PV plants and turbo gas plants. The obtained results suggest that even though the public surveyed are not experts in the topic, they agree to increase the participation in the energy mix of some technologies that they consider friendly to the environment.
The percentage of priority refers to the percentage obtained with the AHP method, and it means the level of importance or priority that each technology has. It is important to consider that the highest priority level is 100%.

8. Discussion of the Results

The rankings obtained provide relevant information about the opinions that experts and the general population have on energy issues and can be used by decision-makers in the country to propose improvements or changes in the energy mix. This analysis can be useful to promote the rational use of generation power plants and give more importance to social and environmental criteria. The results cover four categories often considered individually, depending on the expert opinion on social, technical, economic, or environmental issues.
In addition, there is a certain similarity between the results obtained in the global ranking with the opinions of the experts and the global ranking with the general population, even with the capacity currently installed in the country. This is valuable information that indicates how Mexico is performing in energy matters and whether the decisions made are correct.
Using the results of the LCA, an environmental classification of the technologies was obtained. However, it is important to keep in mind that despite nuclear power and PV plants being the best options, there are some drawbacks; for instance, the waste material of nuclear plants requires long-term management. In addition, there are safety concerns that must be addressed to protect public health and the environment, and some measures need to be enforced to ensure the safe use of nuclear materials and prevent nuclear proliferation [35]. In the case of PV plants, efficient recycling processes are still developing, and not all components are easily recyclable [36]. The results of the AHP, where weight plays a vital role, show that these topics are not important for people or are poorly understood. On the other hand, it can be observed that technical criteria are the most important, with the highest weight, followed by economic criteria. The results show that the opinions of different groups of people affect the outcomes. If only the opinions of the experts are considered, they favored combined cycle, hydroelectric, and thermoelectric plants, while the public prioritized wind power, combined cycle, and thermoelectric plants.
Based on these combined findings, the study recommends increasing the share of wind, turbo gas, and PV plants in Mexico’s energy mix. Maintaining the current capacity of combined cycle, hydroelectric, and thermoelectric plants seems sufficient.
Finally, optimal technology selection must consider numerous factors, such as energy demand, climate conditions, and environmental goals. Nonetheless, this research offers a clear classification of the most suitable power-generating plants for Mexico, empowering key decision-makers to navigate energy projects and policies with a sustainability focus.

9. Conclusions

This paper discusses the current state of power generation plants in Mexico, considering their environmental, economic, technical, and social impacts. It employs a life-cycle assessment to evaluate the environmental effects and a multi-criteria decision-making method for assessing the technical, economic, and social impacts.
It calculated rankings to classify the best technology for use in the country. First, an environmental ranking was obtained for ten different generation technologies contributing at least 1% of the total installed capacity. Twenty-two environmental impact categories were selected in SimaPro software to conduct life-cycle assessments of each power plant. The scope of this study extended from cradle to grave. The global environmental ranking indicates that nuclear energy, PV plants, and efficient cogeneration are among the cleanest options available.
Two other global rankings were obtained by considering the economic, technical, and social categories and surveying two groups: experts and the public. The experts ranked combined cycle, hydroelectric, and thermoelectric plants as the best options for the country, with 14% 12%, and 11%, respectively, whereas the public ranked wind power (14%), combined cycle (13%), and thermoelectric plants (13%) as their top choices.
The results suggest that increasing the participation of wind power, turbo gas, and PV plants in the country’s energy mix would be beneficial, while the current installed capacity of combined cycle, hydroelectric, and thermoelectric is sufficient to meet the country’s needs.
Therefore, the joint use of LCA data with MCDM techniques is very important for providing valuable information to prioritize sustainable energy development in Mexico. This approach recommends the use of the best technologies by considering environmental, economic, technical, and social aspects. If Mexican policy takes this research into account, future studies could expand on these results by exploring the integration of energy storage solutions and assessing the impact of grid modernization efforts on the overall life-cycle impacts of Mexico’s power generation portfolio.

Author Contributions

Conceptualization: D.L.O.F., R.P.G. and E.R.P.H.; Methodology: D.L.O.F., R.P.G. and E.R.P.H.; Software: D.L.O.F.; Validation: D.L.O.F. and R.P.G.; Formal analysis: D.L.O.F., R.P.G., E.R.P.H., C.S.M. and A.O.C.; Investigation: D.L.O.F. and R.P.G.; Resources: R.P.G.; Data curation: D.L.O.F.; Writing—original draft preparation: D.L.O.F. and R.P.G.; Writing—review and editing: D.L.O.F., R.P.G., E.R.P.H., C.S.M. and A.O.C.; Visualization: D.L.O.F.; Supervision: R.P.G. and E.R.P.H.; Project administration: R.P.G.; Funding acquisition: R.P.G. All authors have read and agreed to the published version of the manuscript.

Funding

This research received no external funding.

Institutional Review Board Statement

Not applicable.

Informed Consent Statement

Not applicable.

Data Availability Statement

The data presented in this study are available on request from the first author.

Acknowledgments

The authors would like to express their gratitude to the Universidad Autónoma de San Luis Potosí for providing the necessary facilities for this research. Diana L. Ovalle Flores is thankful to CONAHCYT for providing financial support for her Ph.D. studies.

Conflicts of Interest

The authors declare no conflicts of interest.

References

  1. Jordaan, S.M.; Combs, C.; Guenther, E. Life cycle assessment of electricity generation: A systematic review of spatiotemporal methods. Adv. Appl. Energy 2021, 3, 100058. [Google Scholar] [CrossRef]
  2. International Energy Agency. World Energy Outlook 2022. International Energy Agency (IEA). Available online: https://www.iea.org/reports/world-energy-outlook-2022/executive-summary?language=es (accessed on 20 December 2023).
  3. Barragán, E. Factores que influyen en la selección de energías renovables en la ciudad. EURE 2019, 45, 259–277. [Google Scholar] [CrossRef]
  4. SENER. Reporte de Avance de Energías Limpias: Primer Semestre 2018. Secretaría de Energía (SENER), México. 2018. Available online: https://www.gob.mx/cms/uploads/attachment/file/418391/RAEL_Primer_Semestre_2018.pdf (accessed on 20 December 2023).
  5. Turconi, R.; Boldrin, A.; Astrup, R. Life cycle assessment (LCA) of electricity generation technologies: Overview, comparability, and limitations. Renew. Sustain. Energy Rev. 2013, 28, 555–565. [Google Scholar] [CrossRef]
  6. Gagnon, L.; Bélanger, C.; Uchiyama, Y. Life-cycle assessment of electricity generation options: The status of research in year 2001. Energy Policy 2002, 30, 1267–1278. [Google Scholar] [CrossRef]
  7. Atilgan, B.; Azapagic, A. Renewable electricity in Turkey: Life cycle environmental impacts. Renew. Energy 2016, 89, 649–657. [Google Scholar] [CrossRef]
  8. Parvez-Mahmud, M.A.; Huda, N.; Hisan-Farjana, S.; Lang, C. Life-cycle impact assessment of renewable electricity generation systems in the United States. Renew. Energy 2020, 151, 1028–1045. [Google Scholar] [CrossRef]
  9. Parvez-Mahmud, M.A.; Hisan-Farjana, S. Comparative life cycle environmental impact assessment of renewable electricity generation systems: A practical approach towards Europe, North America and Oceania. Renew. Energy 2022, 193, 1106–1120. [Google Scholar] [CrossRef]
  10. Ovalle-Flores, D.L.; Peña-Gallardo, R.; Palacios-Hernández, E.R. The current state of power generation plants in Mexico from the life cycle assessment point of view. In Proceedings of the 2023 IEEE International Autumn Meeting on Power, Electronics and Computing (ROPEC), Ixtapa, Mexico, 9–11 November 2023; pp. 1–6. [Google Scholar]
  11. Álvarez, A.; Jiménez, R.; López, E.; Monteagudo, J. Multicriterium Decision Methods in Renewable Energy Planning; Universidad de Cienfuegos: Cienfuegos, Cuba, 2021. [Google Scholar]
  12. Kumar, A.; Sah, B.; Singh, A.R.; Deng, Y.; He, X.; Kumar, P.; Bansal, R.C. A review of multi criteria decision making (MCDM) towards sustainable renewable energy development. Renew. Sustain. Energy Rev. 2017, 69, 596–609. [Google Scholar] [CrossRef]
  13. Ospino-Castro, A.; Robles-Algarín, C.; Mangones-Cordero, A.; Romero-Navas, S. An Analytic Hierarchy Process Based Approach for Evaluating Feasibility of Offshore Wind Farm on the Colombian Caribbean Coast. Int. J. Energy Econ. Policy (IJEEP) 2023, 64–73. Available online: https://www.zbw.eu/econis-archiv/bitstream/11159/631309/1/1871296358_0.pdf (accessed on 10 November 2023). [CrossRef]
  14. Muñoz, B.; Romana, M. Aplicación de Métodos de Decisión Multicriterio Discretos al Análisis de Alternativas en Estudios Informativos de Infraestructuras de Transporte. Investigación 2016, 6, 27–45. [Google Scholar]
  15. Caldeira-Pires, A.; Da, R.; Ribeiro, S. Life cycle assessment (LCA) of a gas turbine power plant. In Proceedings of the 17th International Congress of Mechanical Engineering, São Paulo, Brazil, 10–14 November 2003. [Google Scholar]
  16. GOB. Reforma Energética. Gobierno de la República (GOB). 2013. Available online: https://www.gob.mx/cms/uploads/attachment/file/164370/Resumen_de_la_explicacion_de_la_Reforma_Energetica11_1_.pdf (accessed on 20 December 2023).
  17. PRODESEN. Informe 2022-2036. Secretaría de Energía (SENER). Programa para el Desarrollo del Sistema Eléctrico Nacional (PRODESEN), SENER. 2022. Available online: https://www.gob.mx/cenace/documentos/programa-para-el-desarrollo-del-sistema-electrico-nacional-2022-2036 (accessed on 15 January 2024).
  18. Mannan, S. Lees’ Loss Prevention in the Process Industries, 4th ed.; Butterworth-Heinemann: Oxford, UK, 2012; pp. 2507–2521. [Google Scholar]
  19. Taherdoost, H.; Madanchian, M. Multi-Criteria Decision Making (MCDM) Methods and Concepts. Encyclopedia 2023, 3, 77–87. [Google Scholar] [CrossRef]
  20. Saaty, T.L. The Analytic Hierarchy Process; McGraw Hill: New York, NY, USA, 1980. [Google Scholar]
  21. Infante, A. Técnicas multicriterio hibridas para la selección de proyectos renovables eólicos. Polo Conoc. 2021, 6, 363–380. [Google Scholar]
  22. Mayor, J.; Botero, S.; González-Ruiz, J. Modelo de decisión multicriterio difuso para la selección de contratistas en proyectos de infraestructura: Caso Colombia. Obras Proy. 2016, 20, 56–74. Available online: https://www.scielo.cl/pdf/oyp/n20/art05.pdf (accessed on 10 January 2024). [CrossRef]
  23. Rebitzer, G.; Ekvall, T.; Frischknecht, R.; Hunkeler, D.; Norris, G.; Rydberg, T.; Schmidt, W.P.; Suh, S.; Weidema, B.P.; Pennington, D.W. Life cycle assessment: Part 1: Framework, goal and scope definition, inventory analysis, and applications. Environ. Int. 2004, 30, 701–720. [Google Scholar] [CrossRef] [PubMed]
  24. Lefebvre, D.; Goglio, P.; Williams, A.; Manning, D.A.C.; de Azevedo, A.C.; Bergmann, M.; Meersmans, J.; Smith, P. Assessing the potential of soil carbonation and enhanced weathering through Life Cycle Assessment: A case study for Sao Paulo State, Brazil. J. Clean. Prod. 2019, 233, 468–481. [Google Scholar] [CrossRef]
  25. Ramírez-Cruz, R. Analysis of the Life Cycle Applied to Conventional and Combined Cycle Thermoelectric Plants. Bachelor’s Thesis, Universidad Nacional Autónoma de México, Mexico City, Mexico, 2014. Available online: http://132.248.9.195/ptd2014/junio/0714732/0714732.pdf (accessed on 5 May 2024).
  26. Wibawa, B.S.; Iswara, A.P.; Boedisantoso, R. Impact assessment of coal power plant using life cycle assessment (LCA). IOP Conf. Ser. Earth Environ. Sci. 2020, 506, 012023. [Google Scholar] [CrossRef]
  27. López, G.; Sirenia, P. Life Cycle Analysis of Electric Power from Fossil Fuels. Master’s Thesis, Universidad Autónoma de Baja California, Tijuana, Mexico, 2013. [Google Scholar]
  28. Sánchez-Relaño, L. Analysis of the Life Cycle of Wind and Hydraulic Technologies in Spain; Proyecto de Fin de Grado, Escuela Técnica Superior de Ingenieros de Minas y Energía: Madrid, Spain, 2018. [Google Scholar]
  29. Castillo-Calderón, V. Análisis del Ciclo de Vida de Sistemas Solares Fotovoltaicos Policristalinos Centralizados en Instalaciones de Generación Distribuida para Autoconsumo. Proyecto Final de Graduación para optar por el grado de Licenciatura en Ingeniería Ambiental, Instituto Tecnológico de Costa Rica, Cartago, Costa Rica. 2019. Available online: https://repositoriotec.tec.ac.cr/bitstream/handle/2238/11228/analisis_ciclo_vida_sistemas_solares.pdf?sequence=1&isAllowed=y (accessed on 5 May 2024).
  30. Thomas, L.K.; Tinjum, J.M.; Holcomb, F.H. Environmental life cycle assessment of a deep direct-use geothermal system in Champaign, Illinois. In Proceedings of the 45th Workshop on Geothermal Reservoir Engineering, Stanford, CA, USA, 10–12 February 2020; Available online: https://pangea.stanford.edu/ERE/db/GeoConf/papers/SGW/2020/Thomas.pdf (accessed on 20 May 2024).
  31. Zaky, A.S.; Carter, C.E.; Meng, F.; Frech, C.E. A preliminary life cycle analysis of bioethanol production using seawater in a coastal biorefinery setting. Processes 2021, 9, 1399. [Google Scholar] [CrossRef]
  32. Usubharatana, P.; Phungrassami, H. Life cycle assessment for enhanced efficiency of small power plants by reducing air input temperature. Pol. J. Environ. Stud. 2018, 27, 1781–1793. Available online: https://www.pjoes.com/pdf-78433-24605?filename=Life%20Cycle%20Assessment%20for.pdf (accessed on 20 May 2024). [CrossRef]
  33. CCHEN. Study for the Identification and Evaluation of Possible Effects and Environmental Impacts Produced by the Generation of Nuclear Power in Chile. IDOM; Chilean Nuclear Energy Commission (CCHEN): Santiago de Chile, Chile, 2018. [Google Scholar]
  34. Pérez, F. Analysis of the Life Cycle, Comparative of An Organic and Non-Organic Orange Marmalade. Bachelor’s Thesis, Proyecto fin de carrera, Escuela de ingenierías industriales, Universidad de Valladolid, Valladolid, Spain, 2013. [Google Scholar]
  35. Park, S.; Yang, H.; Heo, G.; Zubair, M.; Khalil Ur, R. Study on Nuclear Accident Precursors Using AHP and BBN. Sci. Technol. Nucl. Install. 2014, 2014, 206258. [Google Scholar] [CrossRef]
  36. Tsanakas, J.A.; Van der Heide, A.; Radavičius, T.; Denafas, J.; Lemaire, E.; Wang, K.; Poortmans, J.; Voroshazi, E. Towards a circular supply chain for PV modules: Review of today’s challenges in PV recycling, refurbishment and re-certification. Prog. Photovolt. 2020, 28, 454–464. [Google Scholar] [CrossRef]
Figure 1. Percentage of installed capacity in Mexico by type of technology, 31 December 2022.
Sustainability 16 07041 g001
Figure 2. LCA methodology.
Sustainability 16 07041 g002
Figure 3. The life-cycle network of a wind power system for generating 1 kWh, with a resolution level of 1.7%.
Sustainability 16 07041 g003
Figure 4. Bar chart showing the pollution of a wind energy system throughout its life cycle.
Sustainability 16 07041 g004
Figure 5. General ranking of power plant contamination.
Sustainability 16 07041 g005
Figure 6. Percentage of priority given by the AHP for power plants for the first group of people surveyed.
Sustainability 16 07041 g006
Figure 7. Percentage of priority given by the AHP for power plants for the second group of people surveyed.
Sustainability 16 07041 g007
Table 1. Classification and types of power plants.
ConventionalCleanOther
Combined cycle
Thermoelectric
Coal
Turbo gas
Internal combustion
Fluidized bed
Wind energy
Hydroelectric
PV plants
Bioenergy
Geothermal
Solar thermal
Efficient cogeneration
Nuclear
Regenerative brakes
Table 2. Rating scale used in the AHP.
ValueDefinition
9Extremely more important.
7Strongly more important.
5Much more important.
3Slightly more important.
1Equally important.
1/3Slightly less important.
1/5Much less important.
1/7Strongly less important.
1/9Extremely less important.
Table 3. Randomly generated index based on the matrix’s dimensions.
n3456789101112
Random index0.5250.8821.1151.2521.3411.4041.4521.4841.5131.535
n13141516171819202122
Random index1.5551.5701.5831.5951.60751.6201.63251.6451.65751.670
Table 4. Selected criteria for the MCDM.
CategoryCriteria
EnvironmentalGreenhouse gas emission (C1).
Acidification (C2).
Eutrophication (C3).
Area availability and urban obstacles (C4).
Visual impact (C5).
Noise (C6).
Waste production (C7).
TechnicalEfficiency (C8).
Technical maturity and ability (C9).
Supply quantity (C10).
Useful life (C11).
Spare parts and maintenance (C12).
Network integration problems (C13).
Availability of the primary source (C14).
EconomicInvestment and installation cost (C15).
Operation and maintenance cost (C16).
Investment recovery period (C17).
Energy cost (C18).
SocialJob creation (C19).
Social acceptance (C20).
Compatibility with international, regional, or local policies (C21).
Home and social benefits (C22).
Table 5. Weight assignment process with respect to criterion C13.
CriteriaTotalsAllocated Weight
C820349
C1520179
C1120107
C920047
C1819937
C1019805
C1719725
C1219715
C1619623
C1419163
C1918993
C1318871
C2118831/3
C718491/3
C2218201/3
C417651/5
C117461/5
C2017141/5
C216571/7
C315871/7
C615821/9
C514621/9
Table 6. Criteria comparison matrix according to the first group of people surveyed.
C1C2C3C4C5C6C7C8C9C10C11C12C13C14C15C16C17C18C19C20C21C22
C11571991/31/91/91/71/91/71/51/51/91/51/71/71/531/31/3
C21/5133751/31/91/91/71/91/71/71/51/91/51/71/71/51/31/51/3
C31/71/311/3531/51/91/91/71/91/71/71/71/91/71/71/91/51/31/51/5
C411/331991/31/91/91/71/91/71/51/51/91/51/71/71/551/31/3
C51/91/71/51/711/31/51/91/91/71/91/71/91/71/91/71/71/91/51/31/51/5
C61/91/51/31/9311/51/91/91/71/91/71/91/71/91/71/51/71/351/33
C733535511/91/71/71/91/51/31/31/91/51/51/71/351/33
C89999999133359535535977
C999999971/311/31/31/371/551/51/31/31/51/91/51/7
C1077777771/3311/73531/7331/35755
C1199999991/33713751/35335757
C1277777751/531/31/31531/731/31/53755
C1357759931/91/71/51/71/511/31/91/31/51/71/3533
C1455757731/551/31/51/3311/91/31/51/73735
C1599999991/31/57379915335757
C1655757751/551/31/51/3331/511/31/53735
C1777777751/531/31/33551/3311/33755
C1877979971/3331/35771/35315757
C1955555531/551/51/51/331/31/51/31/31/51533
C201/3331/5331/51/991/71/71/71/51/71/71/71/71/71/511/51/3
C2135535531/751/51/51/51/31/31/51/31/51/51/3513
C223353551/31/771/51/71/51/31/51/71/51/51/71/331/31
Table 7. A ranking of generation plants based on their life-cycle stages.
No.ConstructionUseDecommission
1.NuclearNuclearNuclear
2.CoalHydroelectricHydroelectric
3.ThermoelectricPV plantsPV plants
4.PV plantsWind energyEfficient cogeneration
5.Combined cycleTurbo gasTurbo gas
6.Efficient cogenerationEfficient cogenerationCoal
7.GeothermalCoalGeothermal
8.Wind energyGeothermalThermoelectric
9.Turbo gasThermoelectricWind energy
10.HydroelectricCombined cycleCombined cycle
Table 8. Ranking of technologies according to the first group of people surveyed.
No.EconomicTechnicalSocial
1.PV plantsCombined cycleEfficient cogeneration
2.Turbo gasThermoelectricCombined cycle
3.CoalHydroelectricHydroelectric
4.Wind energyEfficient cogenerationThermoelectric
5.GeothermalTurbo gasGeothermal
6.HydroelectricGeothermalWind energy
7.NuclearWind energyPV plants
8.Efficient cogenerationNuclearNuclear
9.Combined cyclePV plantsTurbo gas
10.ThermoelectricCoalCoal
Table 9. Ranking of technologies according to the second group of people surveyed.
No.EconomicTechnicalSocial
1.Wind energyThermoelectricTurbo gas
2.NuclearGeothermalThermoelectric
3.HydroelectricCombined cycleCombined cycle
4.CoalCoalHydroelectric
5.Combined cycleTurbo gasGeothermal
6.Efficient cogenerationHydroelectricPV plants
7.PV plantsPV plantsCoal
8.ThermoelectricWind energyEfficient cogeneration
9.GeothermalNuclearWind energy
10.Turbo gas Efficient cogenerationNuclear
Disclaimer/Publisher’s Note: The statements, opinions and data contained in all publications are solely those of the individual author(s) and contributor(s) and not of MDPI and/or the editor(s). MDPI and/or the editor(s) disclaim responsibility for any injury to people or property resulting from any ideas, methods, instructions or products referred to in the content.