Impact of ISO Certifications on Corporate Financial Performance: Evidence from Istanbul Stock Exchange-Listed Manufacturing Companies


Abstract
1. Introduction
- What is the effect of ISO certification on manufacturing companies’ CFP?
- Which underlying mechanism explains the ISO certification-CFP relationship at best?
- What are the impacts of different ISO certifications on manufacturing companies’ CFP?
2. Literature Review on ISO Certifications and CFP
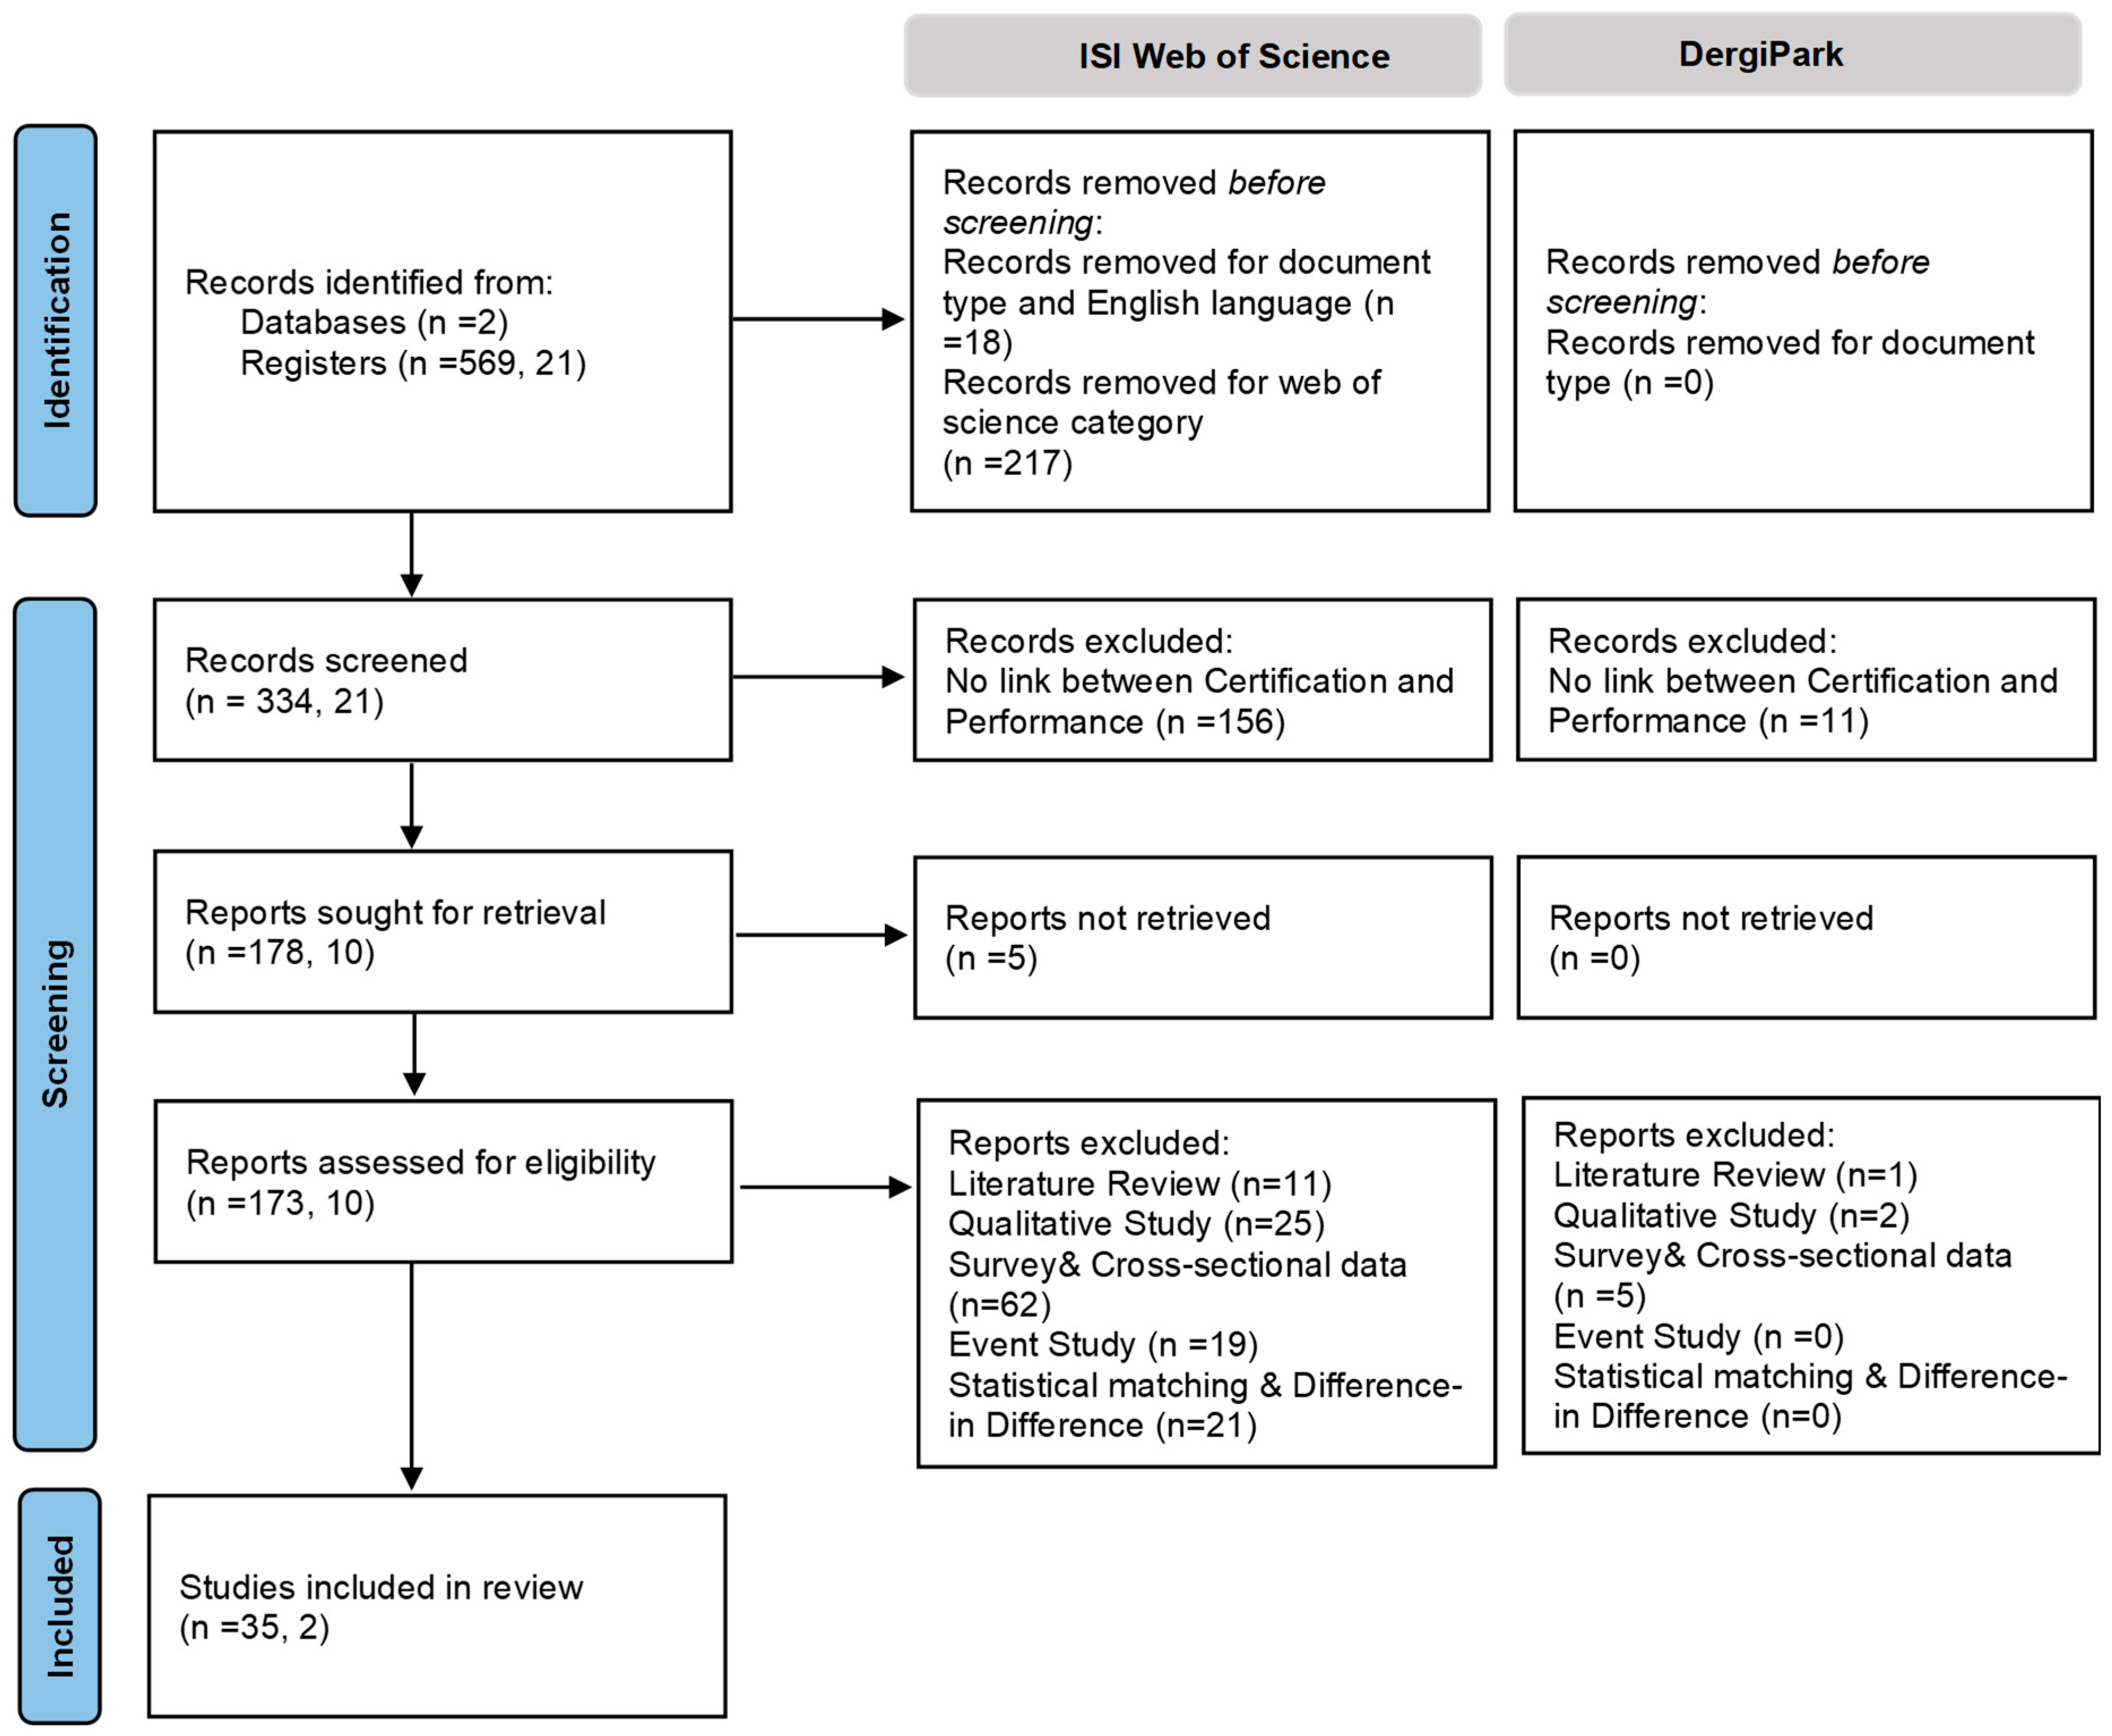
2.1. Scientometric Analysis
2.2. Literature Review on ISO Certifications and CFP
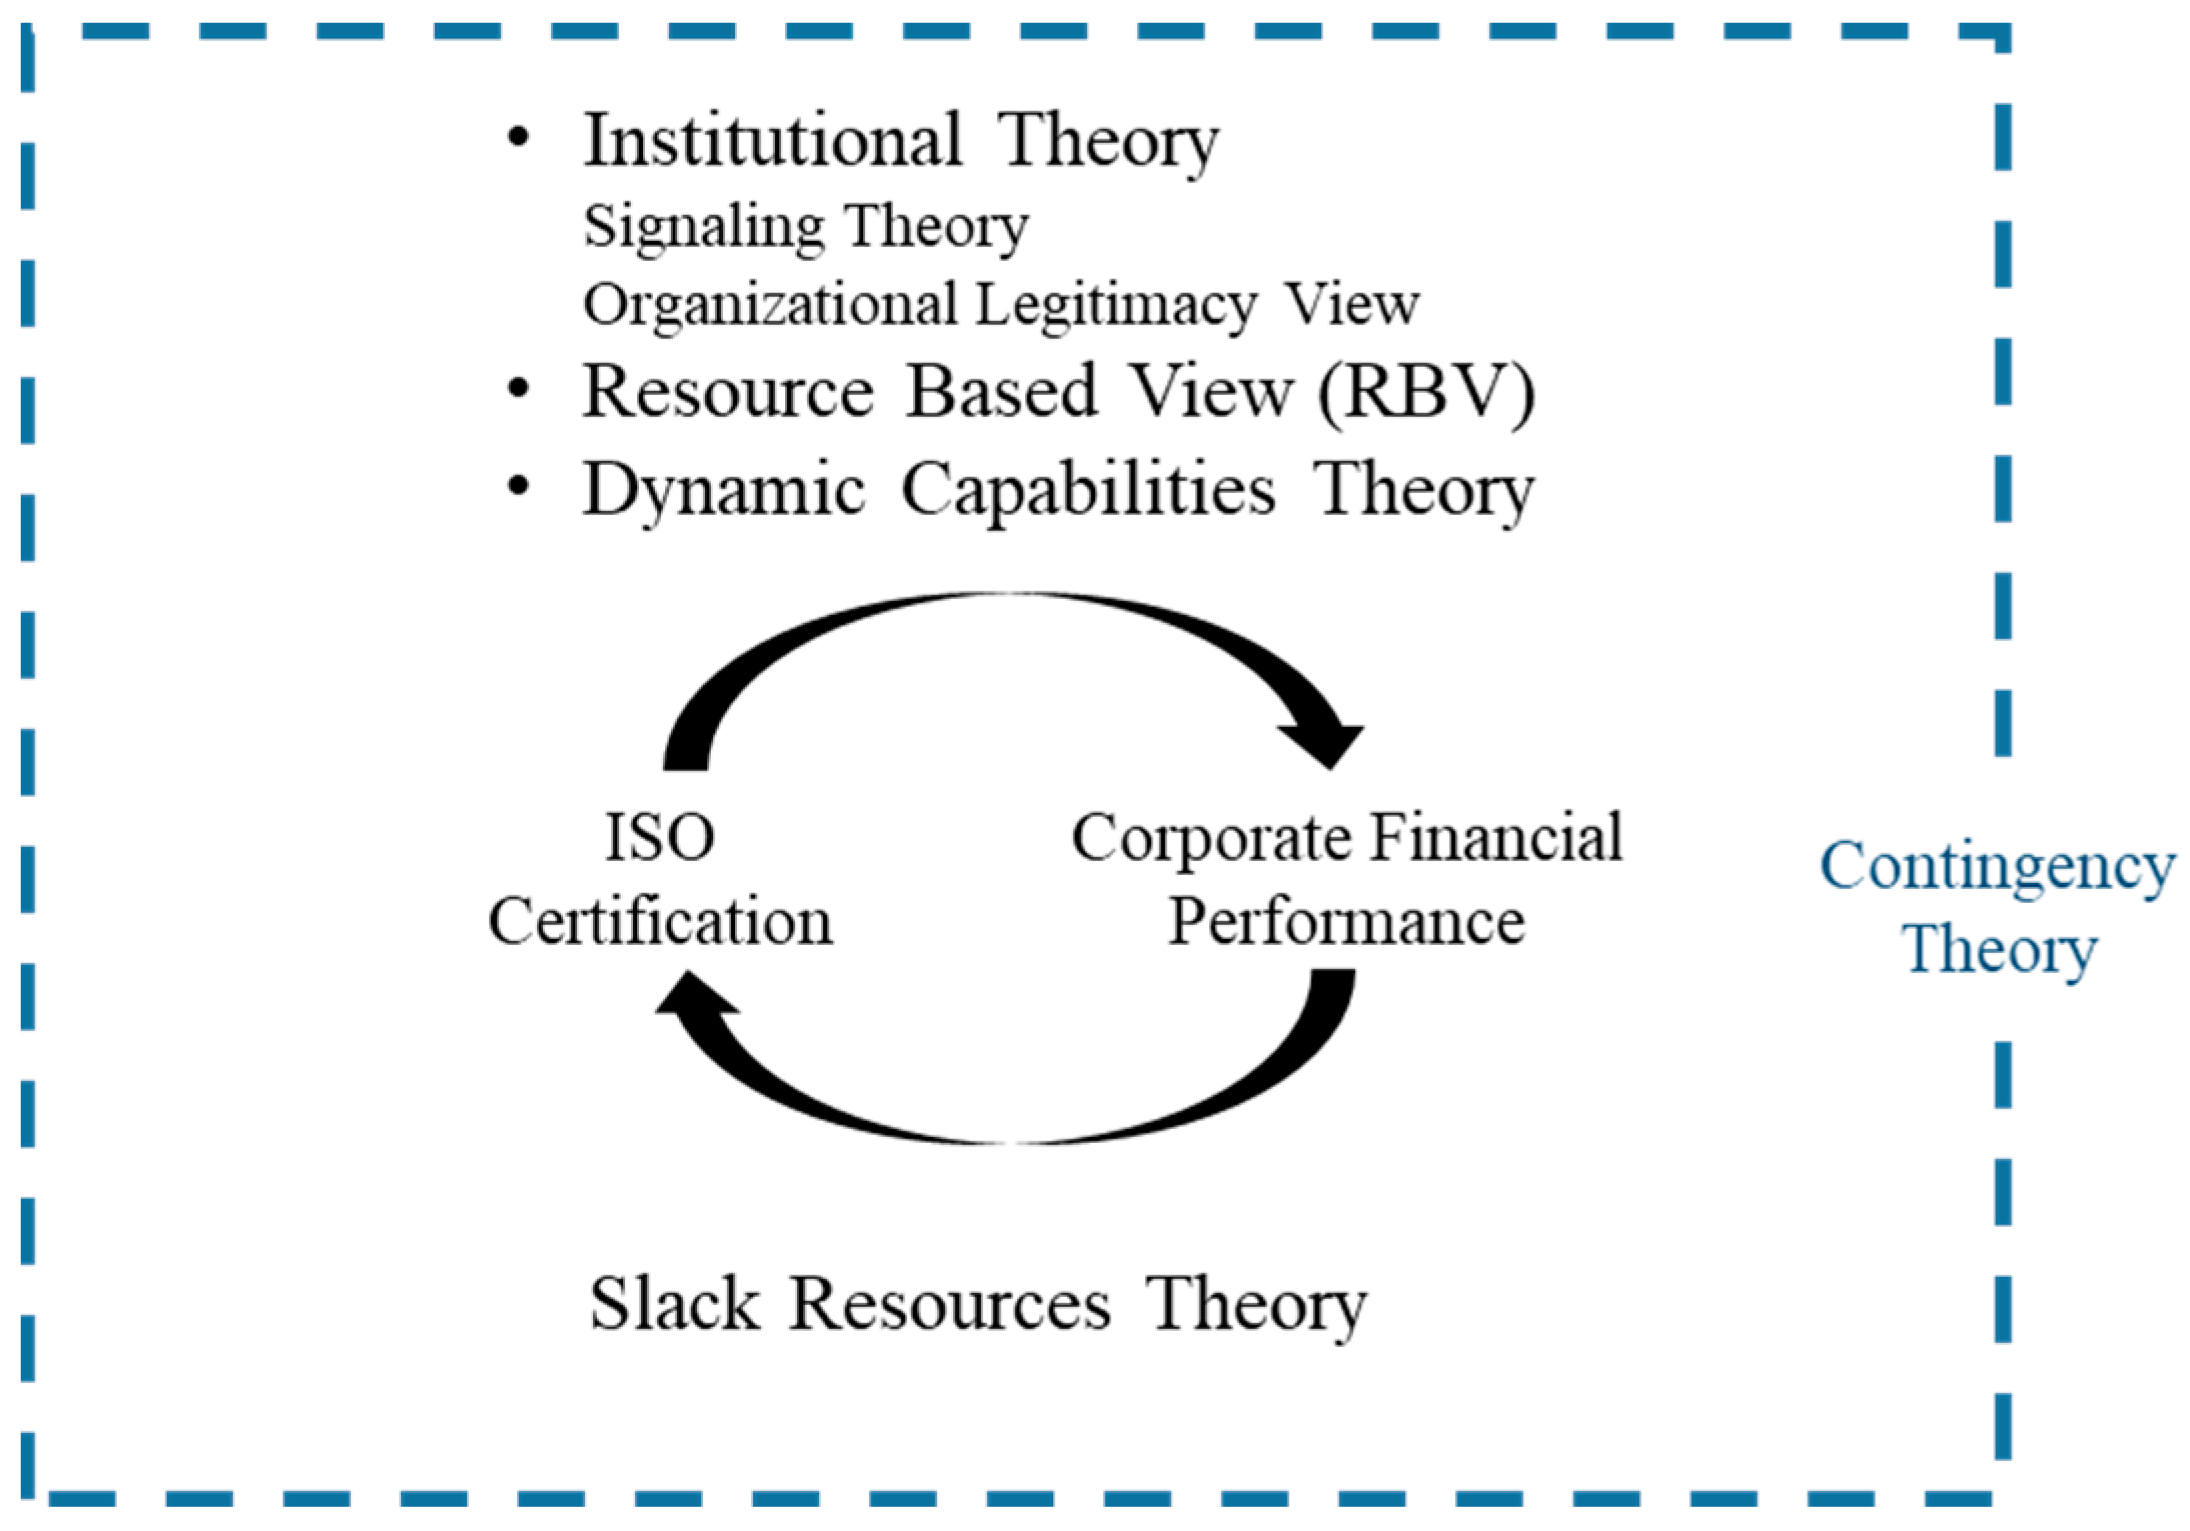
2.3. Theoretical Background and Hypothesis Development
3. Estimation Framework
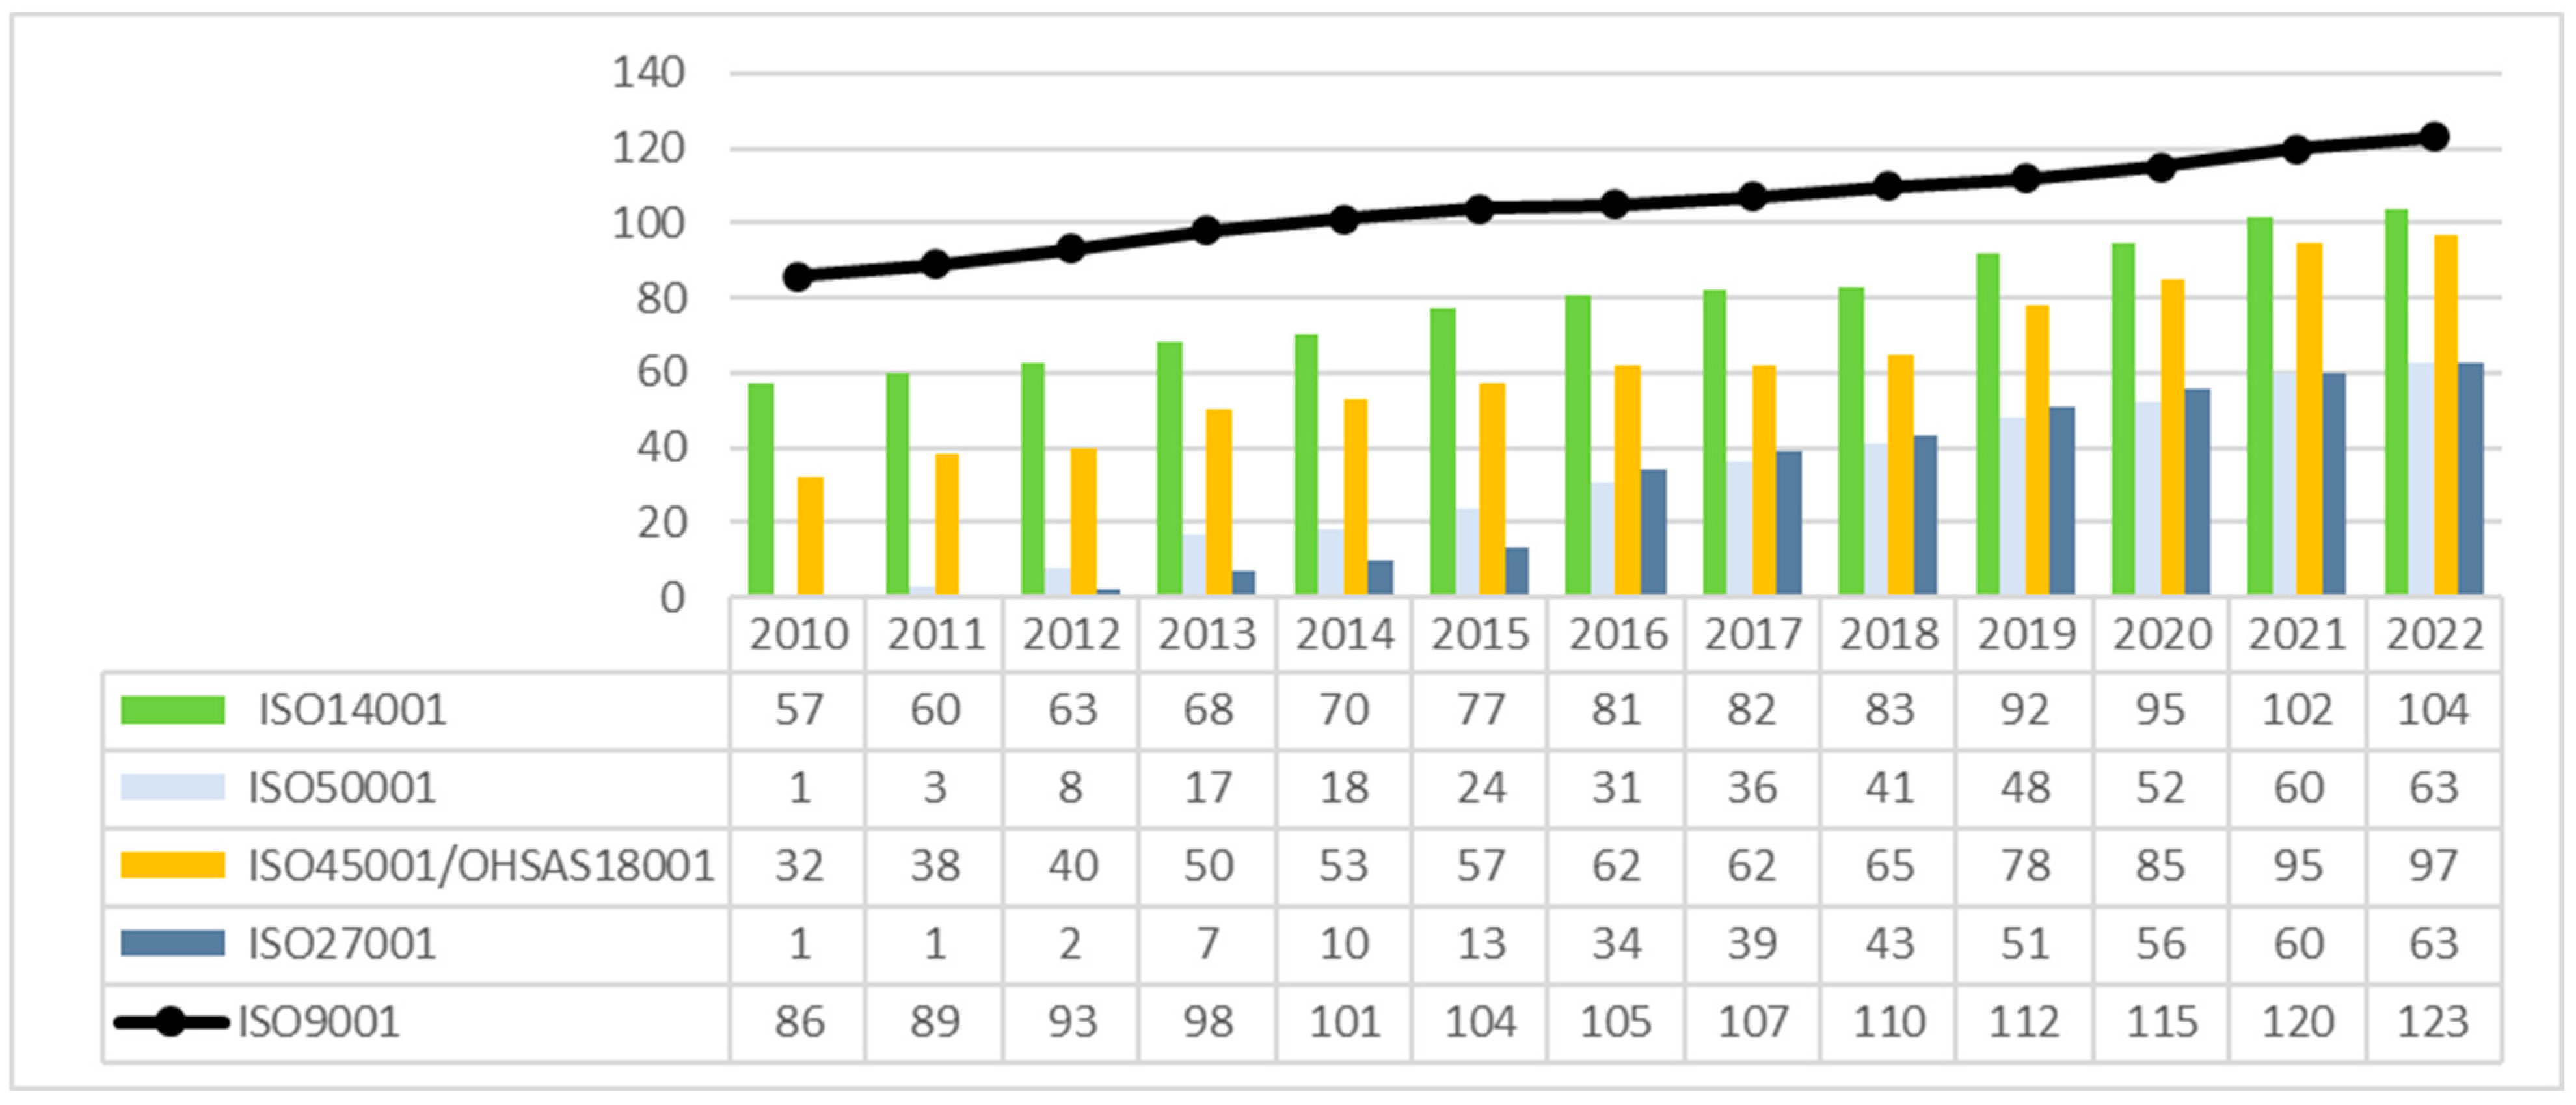
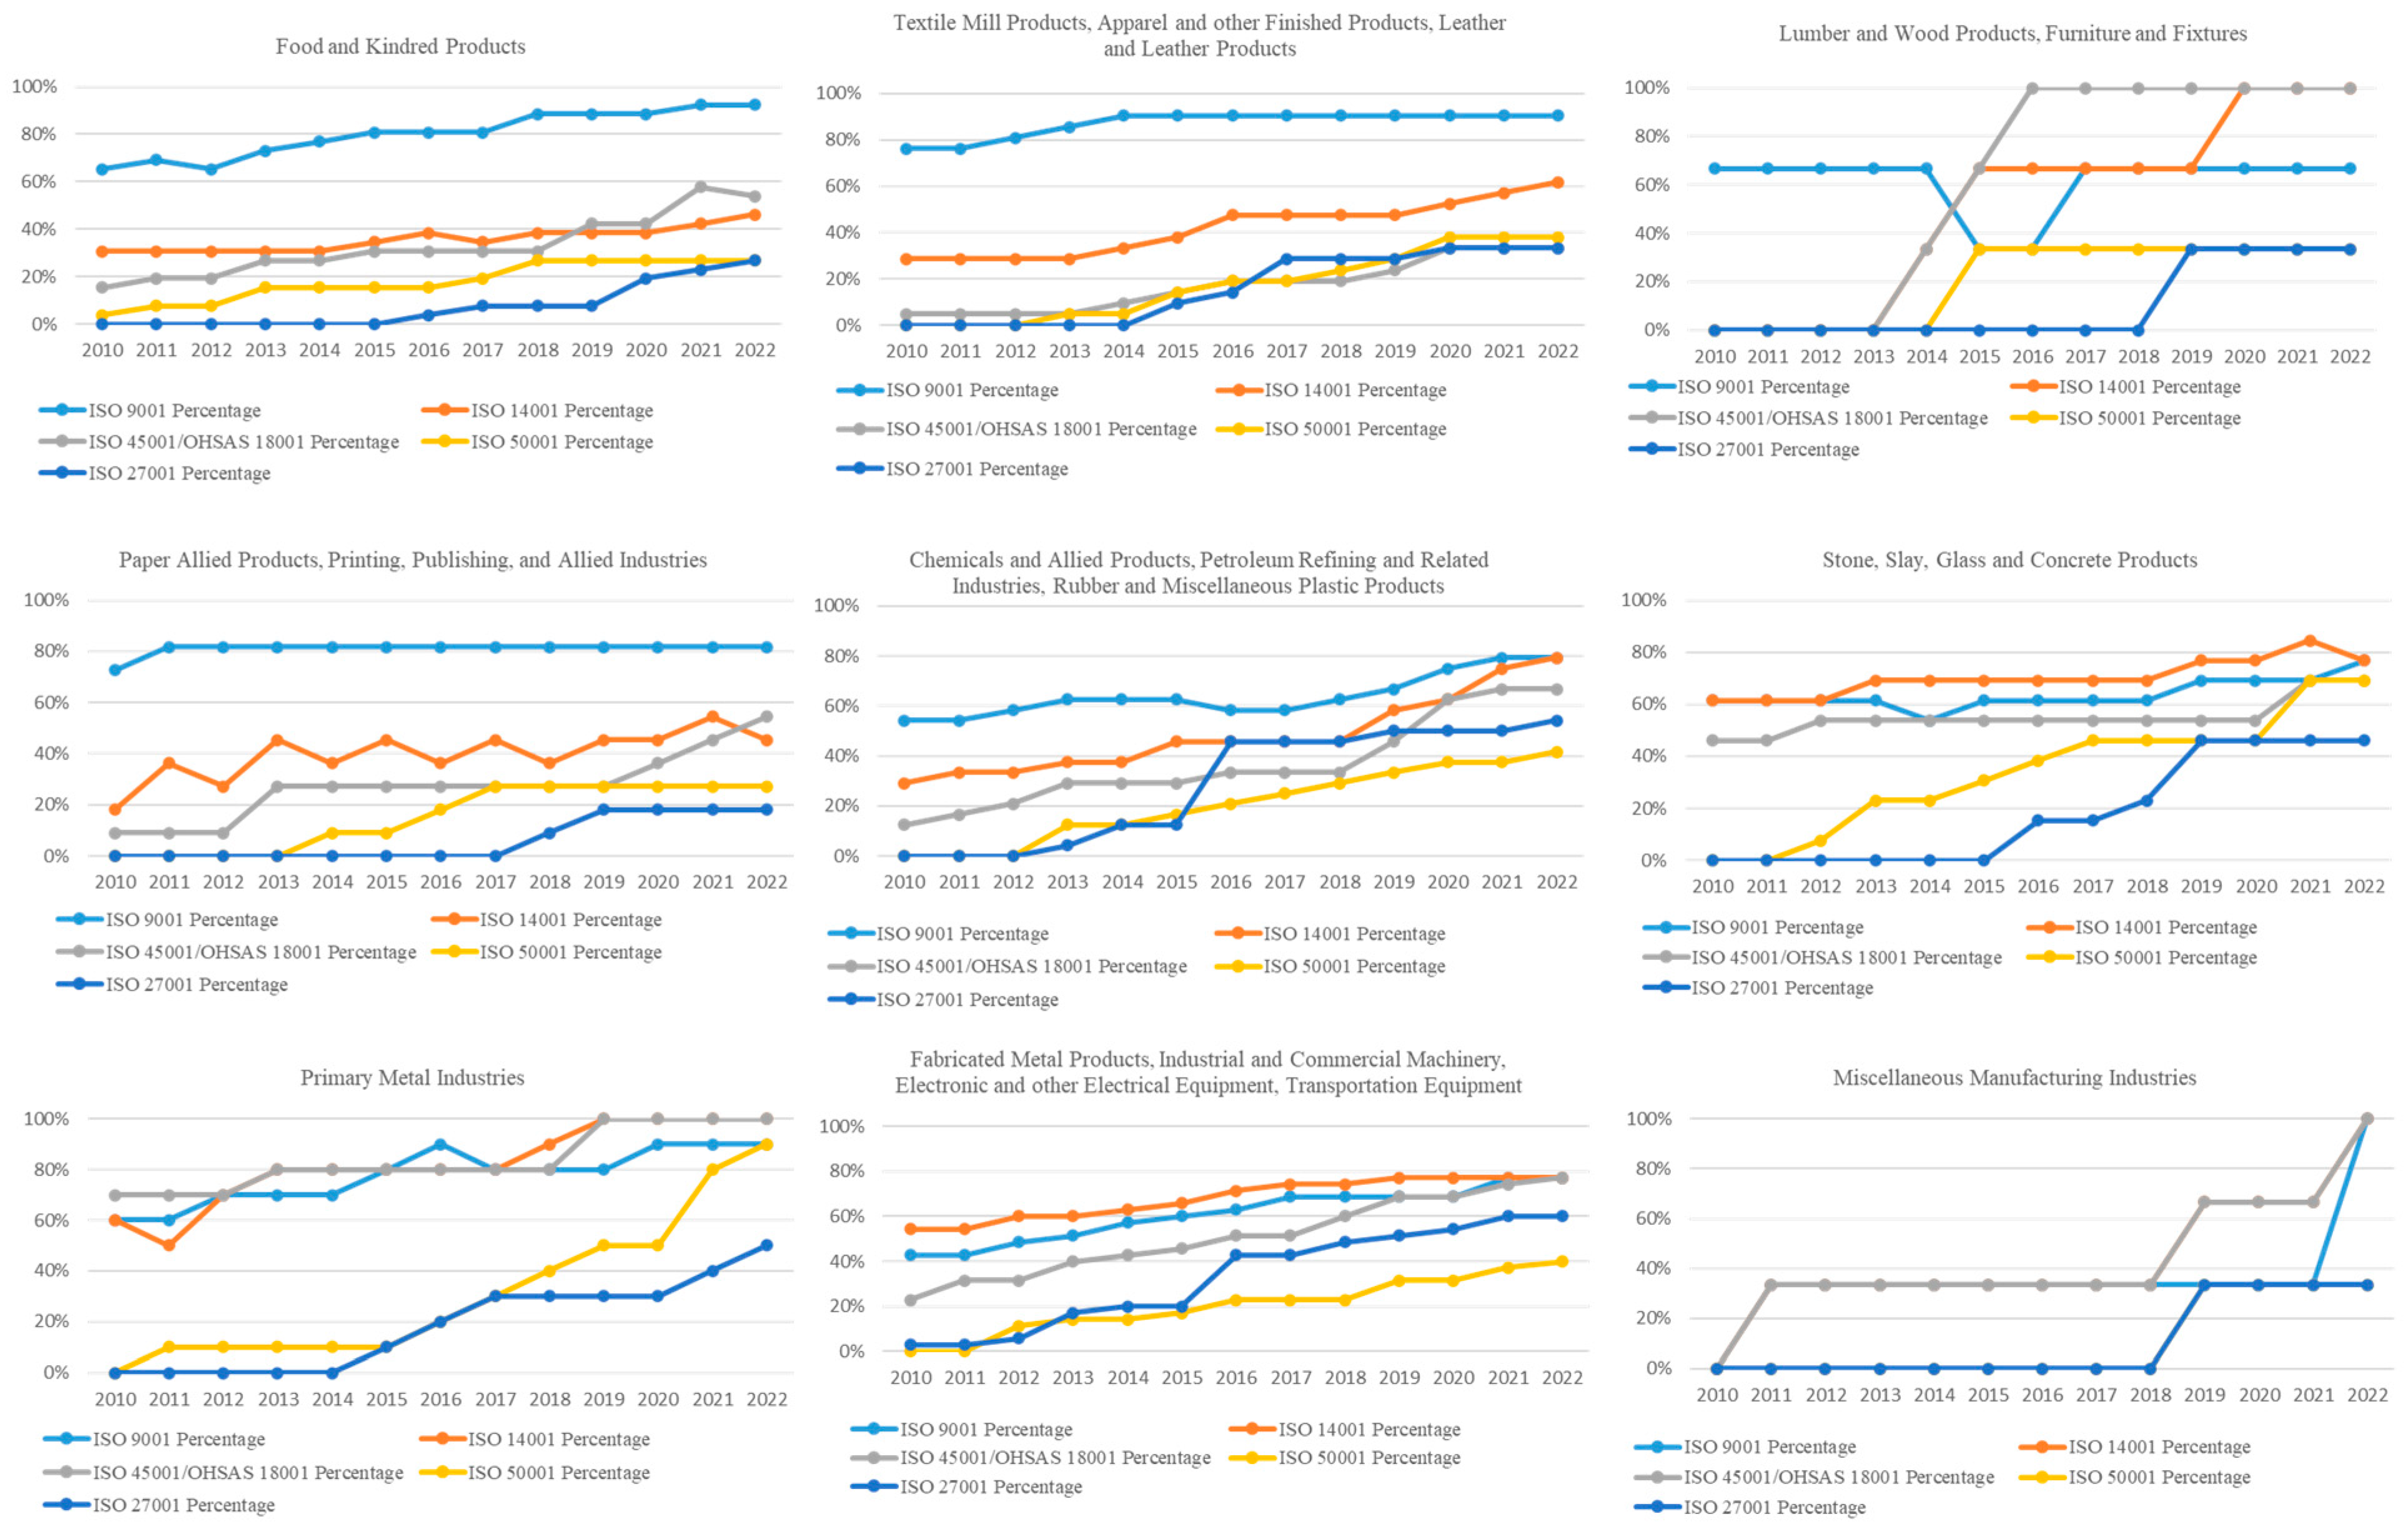
3.1. Data Set
3.2. Variables
3.3. Model
4. Results and Discussion
4.1. Impact of Number of ISO Certifications on CFP
4.2. Impact of Different ISO Certifications on CFP
4.3. Robustness
4.4. Theoretical and Policy Implications
5. Conclusions
Funding
Institutional Review Board Statement
Informed Consent Statement
Data Availability Statement
Conflicts of Interest
Appendix A. Review of Studies Evaluating the Link between ISO Certification and CFP
| Author | Publication Year | Data Period | Sample Size | Sector | Country | Dependent Variable | Independent Variable | Control Variables | Method | Findings |
| Arocena, Orcos, and Zouaghi [34] | 2021 | 2009–2018 | 583 | Multiple Sectors | Multiple Countries | Tons of CO2 emitted by the firm per unit of output, return on assets (ROA) | ISO 140001 Certification | Company size, environmental awareness of society | Two-step system generalized method of moments | positive significant effect |
| Aslam, Rehman, Naeem, and Taghizadeh-Hesary [38] | 2022 | 2007–2018 | 237 | Multiple Sectors | USA and Japan | Tobin’s Q | Total carbon emissions in tons | Company size (log total assets), capital expenditure to total assets, research & development (R&D) expenditure to total sales, leverage-total debt to total assets, board size, clean technology-binary variable | Generalized Method of Moments | negative significant effect (The market penalizes companies with high carbon emissions) |
| Chakroun, Salhi, Ben Amar, and Jarboui [27] | 2019 | 2010–2017 | 311 | Multiple | France | ROA, Return on Equity (ROE), Tobin’s Q and Marris ratio | Sum of the affirmative responses per item/number of sub-items per item regarding ISO 26000 standards | Company size, debt, and firm age | generalized least squares (FGLS) | positive significant effect |
| de Paula, Vélez, Ceballos, and Trujillo [24] | 2020 | 2014–2016 | 5169 | Multiple Sectors | Colombia | ROA | ISO 140001 Certification | Asset ratio, industry | Random-effects panel regression | positive significant effect |
| Durak Uşar, Aylak, and Kayıkcı [21] | 2021 | 2010–2018 | 165 | Manufacturing | Türkiye | ROA | ISO 9001 Certification | Company size, leverage, industry, market concentration, market certification concentration, industry, supply chain position | Random Effects Model | positive significant effect |
| Franceschini, Galetto, and Mastrogiacomo [39] | 2018 | 2008–2010 | 63,400 | Manufacturing | Italy | Synthetising a set of economic/ financial indexes | ISO 9000 certification | Company size, regional development | three-factor ANOVA | negative significant effect |
| Galetto, Franceschini, and Mastrogiacomo [31] | 2017 | 2008–2010 | 63,400 | Manufacturing | Italy | Synthetising a set of economic/ financial indexes | not certified companies, certified for less than three years, certified for more than three years | Company size, regional development and manufacturing sub-sector. | analysis of variance (ANOVA) and contingency tables | no significant effect |
| Hanjani and Kusumadewi [26] | 2023 | 2015–2019 | 174 | Multiple Sectors | Indonesia | Environmental performance, financial performance | ISO 140001 Certification and PROPER ranking | Company size | Regression | positive significant effect |
| He, Ren, and Zeng [46] | 2022 | 2008–2016 | 1325 | Manufacturing | China | Annual operating income (AOI), ROA, Tobin’s Q | ISO 140001 Certification | Company size, ownership, financial leverage, board independence, organizational slack, ISO 9000 certification, Emission trading system | Fixed-effects panel regression | positive significant effect on annual operating income (AOI) and Tobin’s q, but no significant effect on return on assets (ROA) |
| Hernandez-Vivanco, Domingues, Sampaio, Bernardo, and Cruz-Cázares [33] | 2019 | 2007–2015 | 247 | Multiple Sectors | Portugal | Return on Sales (ROS), Return on Capital Employed (ROCE) and ROA | ISO 9001, ISO 14001 and OHSAS 18001 Certification | Industry dummies, company size, year | Generalized Method of Moments | positive significant effect of ISO 9001, positive significant effect of 140001 when combined with ISO 9001, no significant effect of OHSAS 18001 |
| Iyer, Saranga, and Seshadri [20] | 2013 | 1993–2006 | 220 | Auto component industry | India | Productivity change calculated with Data Envelopment Analysis (DEA) | ISO 9001 Certification | Timig of certification, age, company size, average inventory, distribution expenses, working capital cycle, capital intensity, proportion of debt | fixed effect, Cobb–Douglas production function-based parametric estimation | positive significant effect |
| Miroshnychenko, Barontini, and Testa [29] | 2017 | 2002–2014 | 3490 | Multiple Sectors | Multiple Countries | Tobin’s Q and ROE | Pollution Prevention, Green Supply Chain Management, Green product development and ISO 14001 Certification | leverage, sales growth, company size, country, industry and year dummies | OLS regression | negative significant effect |
| Muda and Wahyuni [36] | 2019 | 2012–2016 | 20 | Manufacturing | Indonesia | Earning Per Share | ISO 140001 Certification and Environmental Performance (PROPER ranking) | N/A | Random-effects panel regression | no significant effect |
| Neves, Reis, Reis, and Dias [28] | 2023 | 2015–2019 | 33 | Multiple sectors excluding financial companies and sports corporations | Portugal | ROA, ROE, Tobin’s Q, and earnings before interest, taxes, depreciation, and amortization (EBITDA) Margin | ISO 9001& ISO 14000 Certification | Company size (ln total assets), leverage, Current ratio (ratio of current assets to liabilities), Sustainability report (binary variable), Tangible Fixed Assets, Personnel expenses | Generalized Method of Moments | inconclusive |
| Sampaio, Saraiva, and Rodrigues [19] | 2011 | 2003–2005 | 207 | Multiple Sectors | Portugal | Sales growth (SG), Productivity (Prod), Operational results over Asset (OR/A), Operational results over Sales (OR/S) | ISO 9001 Certification | N/A | Wilcoxon–Mann–Whitney non-parametric test, t-test | positive significant effect |
| San, Heng, Hwa, and Bee [23] | 2015 | N/A | 68 | Multiple Sectors | Malaysia | ROA, ROE | ISO 140001 Certification | Company size, ownership | Regression, ANOVA | positive significant effect |
| Soedjatmiko, Tjahjadi, and Soewarno [37] | 2021 | 2012–2017 | 144 | Manufacturing | Indonesia | ROA, Tobin’s Q | ISO 140001 Certification and PROPER ranking | N/A | Multiple regression | no significant effect |
| Starke, Eunni, Fouto, and de Angelo [35] | 2012 | 1995–2006 | 44 | Multiple sectors excluding financial companies | Brazil | Sales revenue, cost of goods sold/sales revenue, ROS | ISO 9000 certification | Company size, operating risk, profitability measured by net margin, long-term debt to equity ratio, | the pooling of cutting data with ordinary least squares, the fixed effects and the random effects | positive significant effect |
| Teng, Wu, and Chou [30] | 2014 | 1996–2008 | 975 | Multiple Sectors | Taiwan | Market value to book value ratio, ROA and ROE | ISO 140001 certification and the duration | Company size, age and the R&D ratio, year dummies | Fixed-effects panel regression | U-shaped relationship |
| Terlaak and King [43] | 2006 | 1988–1998 | 19713 | Manufacturing | U.S.A | Growth-changes in production volume | ISO 9000 certification, R&D intensity and advertising intensity | Operational performance, industry size, Industry Certification (percentage of certified facilities in each subindustry and year.), Company size, log of the (annual) number of employees, percentage of exports of shipments, year fixed effect | general estimation equations (GEE) model | positive significant effect |
| Wang and Mao [25] | 2020 | 2008–2016 | 1751 | Manufacturing | China | ROE, ratio of operating cost to sales revenue, the ratio of marketing and sales expenses to sales revenue, ratio of general and administrative expenses to sales revenue | ISO 140001 Certification | Ratio of the number of ISO 14001-certified companies to the number of listed companies, registered capital, age, number of employees, liability/asset ratio, gross revenue, ownership, sub- industry | Sobel test, PROCESS procedure analysis and causal mediation analysis | no significant effect |
| Wang and Liu [32] | 2023 | 2009–2019 | 2037 | Multiple sectors | China | ROE, ROA, earnings before interests and taxes (EBIT)/asset, sustainable growth rate (SGR), sales growth, Tobin’s Q, operating efficiency and operating cycle | ISO 9001 and ISO 14001 certification, impact of three integration strategies | 3-levels: firm characteristics (age, natural logarithm of total assets to measure firm size, strategic orientation, cost-leadership and differentiation, slack resources using the three variables of debt to equity, debt to assets and working capital to assets), industry, institutional development in various regions | Mann–Whitney non-parametric test-difference between certified and non certificed firms, cross-sectional time-series feasible generalized least squares (FGLS) regression model | significant effect: simultaneous integration strategy has a positive impact, whereas sequential integration strategy has negative impact |
| Zayas-Mateo and Martínez-Lorente [22] | 2021 | 2004–2012 | 333 | Manufacturing and Services | Spain | Net sales and operating income | ISO 9001 Certification | N/A | Mann–Whitney non-parametric test | Positive significant effect, results more profound for manufacturing companies compared to service companies |
References
- Le, D.-N.; Nguyen, V.-H. Does Quality Certification or Product Diversification Improve the Performance of Small and Medium Enterprises? Sustainability 2024, 16, 2023. [Google Scholar] [CrossRef]
- Pacheco, L.; Lobo, C.; Maldonado, I. Do ISO Certifications Enhance Internationalization? The Case of Portuguese Industrial SMEs. Sustainability 2022, 14, 1335. [Google Scholar] [CrossRef]
- Zimon, D.; Madzik, P.; Sroufe, R. The Influence of ISO 9001 & ISO 14001 on Sustainable Supply Chain Management in the Textile Industry. Sustainability 2020, 12, 4282. [Google Scholar] [CrossRef]
- ISO 50001:2018; Energy Management Systems—Requirements with Guidance for Use—Amendment 1. International Organization for Standardization: Geneva, Switzerland, 2018.
- Uriarte-Romero, R.; Gil-Samaniego, M.; Valenzuela-Mondaca, E.; Ceballos-Corral, J. Methodology for the Successful Integration of an Energy Management System to an Operational Environmental System. Sustainability 2017, 9, 1304. [Google Scholar] [CrossRef]
- Viswanathan, K.; Johnson, M.S.; Toffel, M.W. Do safety management system standards indicate safer operations? Evidence from the OHSAS 18001 occupational health and safety standard. Saf. Sci. 2024, 171, 106383. [Google Scholar] [CrossRef]
- Lo, C.K.Y.; Pagell, M.; Fan, D.; Wiengarten, F.; Yeung, A.C.L. OHSAS 18001 certification and operating performance: The role of complexity and coupling. J. Oper. Manag. 2014, 32, 268–280. [Google Scholar] [CrossRef]
- ISO/IEC 27001:2022; Information Security, Cybersecurity and Privacy Protection—Information Security Management Systems —Requirements—Amendment 1. International Organization for Standardization: Geneva, Switzerland, 2022.
- Podrecca, M.; Culot, G.; Nassimbeni, G.; Sartor, M. Information security and value creation: The performance implications of ISO/IEC 27001. Comput. Ind. 2022, 142, 103744. [Google Scholar] [CrossRef]
- Wu, W. Research on the Impact of Information Security Certification and Concealment on Financial Performance: Impact of ISO 27001 and Concealment on Performance. J. Glob. Inf. Manag. 2022, 30, 1–16. [Google Scholar] [CrossRef]
- Preston, L.E.; O’Bannon, D.P. The Corporate Social-Financial Performance Relationship: A Typology and Analysis. Bus. Soc. 1997, 36, 419–429. [Google Scholar] [CrossRef]
- Mazzi, A.; Toniolo, S.; Manzardo, A.; Ren, J.; Scipioni, A. Exploring the Direction on the Environmental and Business Performance Relationship at the Firm Level. Lessons from a Literature Review. Sustainability 2016, 8, 1200. [Google Scholar] [CrossRef]
- Heras-Saizarbitoria, I.; Molina-Azorín, J.F.; Dick, G.P.M. ISO 14001 certification and financial performance: Selection-effect versus treatment-effect. J. Clean. Prod. 2011, 19, 1–12. [Google Scholar] [CrossRef]
- ISO 9001:2015; Quality Management Systems—Requirements—Amendment 1. International Organization for Standardization: Geneva, Switzerland, 2015.
- ISO 14001:2015; Environmental Management Systems—Requirements with Guidance for Use—Amendment 1. International Organization for Standardization: Geneva, Switzerland, 2015.
- ISO 45001:2018; Occupational Health and Safety Management Systems—Requirements with Guidance for Use—Amendment 1. International Organization for Standardization: Geneva, Switzerland, 2018.
- ISO 26000:2010; Guidance on Social Responsibility. International Organization for Standardization: Geneva, Switzerland, 2010.
- Page, M.J.; McKenzie, J.E.; Bossuyt, P.M.; Boutron, I.; Hoffmann, T.C.; Mulrow, C.D.; Shamseer, L.; Tetzlaff, J.M.; Akl, E.A.; Brennan, S.E.; et al. The PRISMA 2020 statement: An updated guideline for reporting systematic reviews. Syst. Rev. 2021, 10, 89. [Google Scholar] [CrossRef] [PubMed]
- Sampaio, P.; Saraiva, P.; Rodrigues, A.G. The economic impact of quality management systems in Portuguese certified companies: Empirical evidence. Int. J. Qual. Reliab. Manag. 2011, 28, 929–950. [Google Scholar] [CrossRef]
- Iyer, A.; Saranga, H.; Seshadri, S. Effect of Quality Management Systems and Total Quality Management on Productivity Before and After: Empirical Evidence from the Indian Auto Component Industry. Prod. Oper. Manag. 2013, 22, 283–301. [Google Scholar] [CrossRef]
- Durak Uşar, D.; Aylak, B.L.; Kayıkcı, Y. The Effect of Supply Chain Tier on the ISO 9001 Quality Management Certification and Financial Performance Relationship: The Case of Turkey. J. Yaşar Univ. 2021, 16, 1454–1479. [Google Scholar] [CrossRef]
- Zayas-Mateo, R.A.; Martínez-Lorente, A.R. ISO 9001: A vaccine for time of crisis. Meas. Bus. Excell. 2021, 25, 287–299. [Google Scholar] [CrossRef]
- San, O.T.; Heng, T.B.; Hwa, G.H.; Bee, T.S. ISO14001 Certification and Financial Performance of Companies. Asia-Pac. Manag. Account. J. 2015, 10, 58–77. [Google Scholar]
- de Paula, L.B.; Vélez, S.L.P.; Ceballos, H.V.; Trujillo, V.M.O. Exploring the Link between Environmental Practices and Financial Performance: An Empirical Study. J. Environ. Sci. Manag. 2020, 23, 29–39. [Google Scholar]
- Wang, J.; Mao, Y.S. Pains and gains of environmental management system certification for the sustainable development of manufacturing companies: Heterogeneous effects of industry peer learning. Bus. Strategy Environ. 2020, 29, 2092–2109. [Google Scholar] [CrossRef]
- Hanjani, A.; Kusumadewi, R.K. Environmental performance and financial performance: Empirical evidence from Indonesian companies. Corp. Soc. Responsib. Environ. Manag. 2023, 30, 1508–1513. [Google Scholar] [CrossRef]
- Chakroun, S.; Salhi, B.; Ben Amar, A.; Jarboui, A. The impact of ISO 26000 social responsibility standard adoption on firm financial performance Evidence from France. Manag. Res. Rev. 2019, 43, 545–571. [Google Scholar] [CrossRef]
- Neves, M.E.D.; Reis, S.; Reis, P.; Dias, A.G. Impact of ISO 14001 and ISO 9001 adoption on corporate performance: Evidence on a bank-based system. Int. J. Product. Perform. Manag. 2023, 73, 1641–1667. [Google Scholar] [CrossRef]
- Miroshnychenko, I.; Barontini, R.; Testa, F. Green practices and financial performance: A global outlook. J. Clean. Prod. 2017, 147, 340–351. [Google Scholar] [CrossRef]
- Teng, M.J.; Wu, S.Y.; Chou, S.J. Environmental Commitment and Economic Performance—Short-Term Pain for Long-Term Gain. Environ. Policy Gov. 2014, 24, 16–27. [Google Scholar] [CrossRef]
- Galetto, M.; Franceschini, F.; Mastrogiacomo, L. ISO 9001 certification and corporate performance of Italian companies. Int. J. Qual. Reliab. Manag. 2017, 34, 231–250. [Google Scholar] [CrossRef]
- Wang, J.G.; Liu, F.H. Examining the link between integrated management systems and firm performance: Do the integration strategies matter? Int. J. Oper. Prod. Manag. 2023, 43, 332–372. [Google Scholar] [CrossRef]
- Hernandez-Vivanco, A.; Domingues, P.; Sampaio, P.; Bernardo, M.; Cruz-Cázares, C. Do multiple certifications leverage firm performance? A dynamic approach. Int. J. Prod. Econ. 2019, 218, 386–399. [Google Scholar] [CrossRef]
- Arocena, P.; Orcos, R.; Zouaghi, F. The impact of ISO 14001 on firm environmental and economic performance: The moderating role of size and environmental awareness. Bus. Strategy Environ. 2021, 30, 955–967. [Google Scholar] [CrossRef]
- Starke, F.; Eunni, R.V.; Fouto, N.M.M.D.; de Angelo, C.F. Impact of ISO 9000 certification on firm performance: Evidence from Brazil. Manag. Res. Rev. 2012, 35, 974–997. [Google Scholar] [CrossRef]
- Muda, I.; Wahyuni, E. An Analysis on the Effect of Environmental Performance and the Implementation of Environmental Management System (ISO 14001) on the Issuer Financial Performance. Qual.-Access Success 2019, 20, 113–117. [Google Scholar]
- Soedjatmiko, S.; Tjahjadi, B.; Soewarno, N. Do Environmental Performance and Environmental Management Have a Direct Effect on Firm Value? J. Asian Financ. Econ. Bus. 2021, 8, 687–696. [Google Scholar] [CrossRef]
- Aslam, S.; Rehman, R.U.; Naeem, M.A.; Taghizadeh-Hesary, F. Nexus of Corporate Environmental Strategy, Environmental Performance, and Financial Performance. Singap. Econ. Rev. 2022, 1–21. [Google Scholar] [CrossRef]
- Franceschini, F.; Galetto, M.; Mastrogiacomo, L. ISO 9001 certification and failure risk: Any relationship? Total Qual. Manag. Bus. Excell. 2018, 29, 1279–1293. [Google Scholar] [CrossRef]
- He, W.; Shen, R. ISO 14001 Certification and Corporate Technological Innovation: Evidence from Chinese Firms. J. Bus. Ethics 2019, 158, 97–117. [Google Scholar] [CrossRef]
- Baltagi, B.H. Econometric Analysis of Panel Data: Third Edition; Wiley Publisher: Chichester, West Sussex, UK, 2005; pp. 135–168. [Google Scholar]
- Bansal, P.; Hunter, T. Strategic explanations for the early adoption of ISO 14001. J. Bus. Ethics 2003, 46, 289–299. [Google Scholar] [CrossRef]
- Terlaak, A.; King, A.A. The effect of certification with the ISO 9000 Quality Management Standard: A signaling approach. J. Econ. Behav. Organ. 2006, 60, 579–602. [Google Scholar] [CrossRef]
- Zhang, Y.; Ruan, H.; Tang, G.; Tong, L. Power of sustainable development: Does environmental management system certification affect a firm’s access to finance? Bus. Strategy Environ. 2021, 30, 3772–3788. [Google Scholar] [CrossRef]
- Russo MVFout, P.A. A resource-based perspective on corporate environmental performance and profitability. Acad. Manag. J. 1997, 40, 534–559. [Google Scholar] [CrossRef]
- He, D.; Ren, S.; Zeng, H. Environmental labeling certification and firm environmental and financial performance: A resource management perspective. Bus. Strategy Environ. 2022, 31, 751–767. [Google Scholar] [CrossRef]
- Russo, M.V. Explaining the impact of ISO 14001 on emission performance: A dynamic. Bus. Strategy Environ. 2009, 18, 307–319. [Google Scholar] [CrossRef]
- Nishitani, K. An empirical study of the initial adoption of ISO 14001 in Japanese manufacturing firms. Ecol. Econ. 2009, 68, 669–679. [Google Scholar] [CrossRef]
- Hernandez-Vivanco, A.; Bernardo, M. Are certified firms more prone to eco-product innovation? The moderating role of slack resources. J. Clean. Prod. 2022, 377, 134364. [Google Scholar] [CrossRef]
- Lafuente, E.; Bayo-Moriones, A.; Garcia-Cestona, M. ISO-9000 Certification and Ownership Structure: Effects upon Firm Performance. Br. J. Manag. 2009, 21, 649–665. [Google Scholar] [CrossRef]
- Donaldson, L. The Contingency Theory of Organizational Design: Challenges and Opportunities. In Organization Design. Information and Organization Design Series; Burton, R.M., Håkonsson, D.D., Eriksen, B., Snow, C.C., Eds.; Springer: Boston, MA, USA, 2006; pp. 19–40. [Google Scholar] [CrossRef]
- Sea-Jin, C.; van Witteloostuijn, A.; Eden, L. From the Editors: Common method variance in international business research. J. Int. Bus. Stud. 2010, 41, 178–184. [Google Scholar] [CrossRef]
- Corbett, C.J.; Montes-Sancho, M.J.; Kirsch, D.A. The financial impact of ISO 9000 certification: An empirical analysis. Manag. Sci. 2005, 51, 1046–1059. [Google Scholar] [CrossRef]
- Naveh, E.; Marcus, A. Achieving competitive advantage through implementing a replicable management standard: Installing and using ISO 9000. J. Oper. Manag. 2005, 24, 1–26. [Google Scholar] [CrossRef]
- Lo, C.K.Y.; Yeung, A.C.L.; Cheng, T.C.E. The impact of environmental management systems on financial performance in fashion and textiles industries. Int. J. Prod. Econ. 2012, 135, 561–567. [Google Scholar] [CrossRef]
- Hansen, L.P. Large sample properties of generalized method of moment estimators. Econometrica 1982, 50, 1029–1054. [Google Scholar] [CrossRef]
- Arellano, M.; Bond, S. Some Tests of Specification for Panel Data: Monte Carlo Evidence and an Application to Employment Equations. Rev. Econ. Stud. 1991, 58, 277–297. [Google Scholar] [CrossRef]
- Driscoll, J.C.; Kraay, A.C. Consistent covariance matrix estimation with spatially dependent panel data. Rev. Econ. Stat. 1998, 80, 549–560. [Google Scholar] [CrossRef]
- Hoechle, D. Robust standard errors for panel regressions with cross-sectional dependence. Stata J. 2007, 7, 281–312. [Google Scholar] [CrossRef]
- Chen, Y.-Y.; Wu, L.; Zhai, Q.-G. Does ISO 9000 Certification Benefit Service Firms? Sustainability 2019, 11, 5886. [Google Scholar] [CrossRef]
- Goedhuys, M.; Sleuwaegen, L. The Impact of International Standards Certification on the Performance of Firms in Less Developed Countries. World Dev. 2013, 47, 87–101. [Google Scholar] [CrossRef]
- Terziovski, M.; Guerrero, J. ISO 9000 quality system certification and its impact on product and process innovation performance. Int. J. Prod. Econ. 2014, 158, 197–207. [Google Scholar] [CrossRef]

| Data Base: ISI Web of Science (WoS) | Reports Assessed for Eligibility | Reports Excluded for | Studies Included in Review | ||||
|---|---|---|---|---|---|---|---|
| Literature Review | Qualitative Studies & Small Sample Size | Survey & Cross Sectional Data | Event Study | Statistical Matching & Difference-In Difference Model | |||
| ISO 9001 | 82 | 4 | 9 | 41 | 6 | 11 | 11 |
| ISO 14000 | 60 | 3 | 10 | 14 | 9 | 6 | 18 |
| ISO 50001 | 6 | 0 | 3 | 1 | 1 | 0 | 1 |
| ISO 45001/OHSAS 18001 | 4 | 0 | 1 | 0 | 2 | 1 | 0 |
| ISO 26000 | 2 | 0 | 0 | 0 | 0 | 0 | 2 |
| ISO 27001 | 2 | 0 | 0 | 0 | 1 | 1 | 0 |
| Multiple Certification | 17 | 4 | 2 | 6 | 0 | 2 | 3 |
| Total | 173 | 11 | 25 | 62 | 19 | 21 | 35 |
| Data Base: DergiPark | Reports Assessed for Eligibility | Reports Excluded for | Studies Included in Review | ||||
| Literature Review | Qualitative Studies & Small Sample Size | Survey & Cross Sectional Data | Event Study | Statistical Matching & Difference-In Difference Model | |||
| ISO 9001 | 4 | 2 | 1 | 1 | |||
| ISO 14000 | 2 | 1 | 1 | ||||
| ISO 50001 | 0 | ||||||
| ISO 45001/OHSAS 18001 | 0 | ||||||
| ISO 26000 | 1 | 1 | |||||
| ISO 27001 | 1 | 1 | |||||
| Multiple Certification | 2 | 2 | |||||
| Total | 10 | 1 | 2 | 5 | 2 | ||
| Sectors | SIC Codes | Supply Chain Position | n = 146 | |||
|---|---|---|---|---|---|---|
| OEM | Tier 1 | Tier 2 | Total | % | ||
| Food and Kindred Products | 20, 21 | 21 | 1 | 4 | 26 | 17.81% |
| Textile Mill Products, Apparel and other Finished Products, Leather and Leather Products | 22, 23, 31 | 9 | 4 | 8 | 21 | 14.38% |
| Lumber and Wood Products, Furniture and Fixtures | 24, 25 | 3 | 0 | 0 | 3 | 2.05% |
| Paper Allied Products, Printing, Publishing, and Allied Industries | 26, 27 | 4 | 4 | 3 | 11 | 7.53% |
| Chemicals and Allied Products, Petroleum Refining and Related Industries, Rubber and Miscellaneous Plastic Products | 28, 29, 30 | 14 | 2 | 8 | 24 | 16.44% |
| Stone, Slay, Glass and Concrete Products | 32 | 4 | 4 | 5 | 13 | 8.90% |
| Primary Metal Industries | 33 | 0 | 3 | 7 | 10 | 6.85% |
| Fabricated Metal Products, Industrial and Commercial Machinery, Electronic and other Electrical Equipment, Transportation Equipment | 34, 35, 36, 37, 38 | 17 | 12 | 6 | 35 | 23.97% |
| Miscellaneous Manufacturing Industries | 39 | 2 | 1 | 0 | 3 | 2.05% |
| Total | 74 | 31 | 41 | 146 | 100% | |
| Observations | Mean | Std. Dev. | Min | Max | Skewness | Kurtosis | |
|---|---|---|---|---|---|---|---|
| Total Assets (Million TL) | 1897 | 3079.635 | 11,608.39 | 1.134 | 174,893.6 | 0.0000 | 0.0000 |
| Stakeholder Equity (Million TL) | 1898 | 1344.398 | 5595.906 | −390.7246 | 118,662.2 | 0.0000 | 0.0000 |
| Revenue (Million TL) | 1894 | 2837.542 | 14,836.77 | 0 | 481,764.7 | 0.0000 | 0.0000 |
| Net Income (Million TL) | 1894 | 256.8924 | 1478.861 | −2422.925 | 41,260.57 | 0.0000 | 0.0000 |
| Cost of Goods Sold (GOGS) (Million TL) | 1872 | 2239.435 | 12,530.75 | 0 | 418,987.7 | 0.0000 | 0.0000 |
| Marketvalue (Million TL) | 1809 | 2799.828 | 11,507.43 | 2.368651 | 248,999.6 | 0.0000 | 0.0000 |
| Number of Employees (Thousand) | 1882 | 2.463083 | 30.86817 | 0.001 | 1330 | 0.0000 | 0.0000 |
| Long Term Debt (Million TL) | 1898 | 439.3414 | 1900.053 | 0 | 28,324.38 | 0.0000 | 0.0000 |
| R&D Expenditure (Million TL) | 1888 | 14.93951 | 81.91762 | 0 | 1532.88 | 0.0000 | 0.0000 |
| Age by 2022 | 146 | 50.26 | 15.23 | 12 | 95 | 0.7945 | 0.2510 |
| R&D Expenditure/revenue | 1873 | 0.004794 | 0.018231 | 0 | 0.303121 | 0.0000 | 0.0000 |
| GOGS/Revenue | 1855 | 0.7782437 | 0.2473318 | 0 | 4.509441 | 0.0000 | 0.0000 |
| ROA | 1893 | 0.04684 | 0.120191 | −2.05094 | 1.57487 | 0.0000 | 0.0000 |
| ROE | 1894 | 0.045196 | 1.4451 | −48.9169 | 24.1917 | 0.0000 | 0.0000 |
| Tobin’s Q | 1782 | 1.293835 | 2.710669 | 0.0574678 | 61.20941 | 0.0000 | 0.0000 |
| Leverage (Long Term Dept/Total Asset) | 1897 | 0.098771 | 0.140826 | 0 | 3.103579 | 0.0000 | 0.0000 |
| Age (ln age) | 1898 | 3.731494 | 0.4536431 | 0 | 4.564348 | 0.0000 | 0.0000 |
| Model 1.1 (R&D Intensity) | Model 1.2 (GOGS/Revenue) | |||||||
|---|---|---|---|---|---|---|---|---|
| Coefficient | Robust Std. Err. | Z | p > |z| | Coefficient | Robust Std. Err. | z | p >|z| | |
| dependent variable.lag | 0.9164655 | 0.0913792 | 10.03 | 0.000 | −1.013724 | 3.224766 | −0.31 | 0.753 |
| Number of certificates | −0.0000871 | 0.0001377 | −0.63 | 0.527 | −0.0712818 | 0.1621543 | −0.44 | 0.660 |
| Leverage | 0.0004668 | 0.0006543 | 0.71 | 0.476 | −0.3885818 | 1.118042 | −0.35 | 0.728 |
| Number of employees | 6.27 × 10⁻⁶ | 0.0000247 | 0.25 | 0.799 | −0.0090246 | 0.0228205 | −0.40 | 0.693 |
| Lnage | 0.0000766 | 0.0002531 | 0.30 | 0.762 | 0.0361254 | 0.2793436 | 0.13 | 0.897 |
| tier_1 | −0.0000915 | 0.000503 | −0.18 | 0.856 | −0.3283477 | 0.6719115 | −0.49 | 0.625 |
| tier_2 | −0.0001806 | 0.0004711 | −0.38 | 0.701 | −0.2583642 | 0.6512045 | −0.40 | 0.692 |
| _cons | 0.000084 | 0.0010413 | 0.08 | 0.936 | 1.523519 | 2.694314 | 0.57 | 0.572 |
| Number of Observations | 1554 | 1556 | ||||||
| Hansen J statistic | 0.886, Chi-sq(1) p-val = 0.6421 | 0.793, Chi-sq(1) p-val = 0.6728 | ||||||
| AR (1) p value | z = −1.09 Pr > z = 0.2752 | z = −0.91 Pr > z = 0.3611 | ||||||
| AR (2) p value | z = −1.43 Pr > z = 0.1516 | z = −0.91 Pr > z = 0.3611 | ||||||
| Model 1.3 (ROA) | Model 1.4 (Tobins’ Q) | |||||||
| Coefficient | Robust Std. Err. | z | p > |z| | Coefficient | Robust Std. Err. | z | p >|z| | |
| dependent variable.lag | 0.5520088 | 0.0817362 | 6.75 | 0.000 | 0.6076748 | 0.0922316 | 6.59 | 0.000 |
| Number of certificates | 0.0115833 | 0.0023409 | 4.95 | 0.000 | 0.1086216 | 0.0401953 | 2.70 | 0.007 |
| Leverage | −0.1118339 | 0.0317571 | −3.52 | 0.000 | −1.316951 | 0.6421696 | −2.05 | 0.040 |
| Number of employees | −0.0012794 | 0.0003529 | −3.63 | 0.000 | −0.0426905 | 0.0096442 | −4.43 | 0.000 |
| Lnage | 0.0144103 | 0.0065979 | 2.18 | 0.029 | 0.4155525 | 0.1869997 | 2.22 | 0.026 |
| tier_1 | 0.0181414 | 0.0072843 | 2.49 | 0.013 | 0.2380513 | 0.1456362 | 1.63 | 0.102 |
| tier_2 | 0.0074475 | 0.0065956 | 1.13 | 0.259 | 0.1885341 | 0.111777 | 1.69 | 0.092 |
| _cons | −0.0411942 | 0.0292477 | −1.41 | 0.159 | −0.9932993 | 0.6480631 | −1.53 | 0.125 |
| Number of Observations | 1578 | 1504 | ||||||
| Hansen J statistic | 4.681, Chi-sq(1) p-val = 0.0963 | 2.083, Chi-sq(1) p-val = 0.3530 | ||||||
| AR (1) p value | z = −1.40 Pr > z = 0.1629 | z = −2.29 Pr > z = 0.0221 | ||||||
| AR (2) p value | z = 1.81 Pr > z = 0.0706 | z = 1.77 Pr > z = 0.0766 | ||||||
| Model 2.1 | Model 2.2 | |||||||
|---|---|---|---|---|---|---|---|---|
| Coefficient | Robust Std. Err. | Z | p > |z| | Coefficient | Robust Std. Err. | Z | p > |z| | |
| roa.lag | 0.5607376 | 0.0809877 | 6.92 | 0.000 | 0.5614217 | 0.0815476 | 6.88 | 0.000 |
| ISO 9001 | 0.0154015 | 0.0062461 | 2.47 | 0.014 | 0.0153144 | 0.006311 | 2.43 | 0.015 |
| ISO 14001 | 0.0133234 | 0.0082635 | 1.61 | 0.107 | 0.0161586 | 0.0083233 | 1.94 | 0.052 |
| ISO 45001 | 0.0076847 | 0.007421 | 1.04 | 0.300 | ||||
| ISO 50001 | 0.0100436 | 0.0070965 | 1.42 | 0.157 | 0.0118694 | 0.0067144 | 1.77 | 0.077 |
| ISO 27001 | 0.0113846 | 0.0074897 | 1.52 | 0.129 | −0.1099235 | 0.0313568 | −3.51 | 0.000 |
| Leverage | −0.111983 | 0.0308079 | −3.63 | 0.000 | −0.0012523 | 0.000356 | −3.52 | 0.000 |
| Number of employees | −0.0012635 | 0.0003541 | −3.57 | 0.000 | −0.0012523 | 0.0003561 | −3.52 | 0.000 |
| lnage | 0.0144944 | 0.00645 | 2.25 | 0.025 | 0.0147369 | 0.006543 | 2.25 | 0.024 |
| tier_1 | 0.0170392 | 0.0071405 | 2.39 | 0.017 | 0.0165838 | 0.0073803 | 2.25 | 0.025 |
| tier_2 | 0.0062727 | 0.0068192 | 0.92 | 0.358 | 0.0067138 | 0.0068101 | 0.99 | 0.324 |
| Constant | −0.0395708 | 0.0287254 | −1.38 | 0.168 | −0.0386828 | 0.0290922 | −1.33 | 0.184 |
| industry | industry effects are included in the estimations | industry effects are included in the estimations | ||||||
| Number of Observations | 1437 | 1437 | ||||||
| Hansen J statistic | 9.796, Chi-sq(10) p-val = 0.4585 | 9.652, Chi-sq(8) p-val = 0.2903 | ||||||
| AR (1) p value | z = −1.59 Pr > z = 0.1123 | z = −1.65 Pr > z = 0.0983 | ||||||
| AR (2) p value | z = 1.74 Pr > z = 0.0815 | z = 1.74 Pr > z = 0.0824 | ||||||
| Model 2.3 | Model 2.4 | |||||||
|---|---|---|---|---|---|---|---|---|
| Coefficient | Robust Std. Err. | Z | p > |z| | Coefficient | Robust Std. Err. | z | p > |z| | |
| TobinsQ.lag | 0.5652461 | 0.0853422 | 6.62 | 0.000 | 0.536038 | 0.0888145 | 6.04 | 0.000 |
| ISO 9001 | 0.1822074 | 0.0891764 | 2.04 | 0.041 | 0.1877296 | 0.0888575 | 2.11 | 0.035 |
| ISO 14001 | −0.0800243 | 0.1412061 | −0.57 | 0.571 | −0.1542967 | 0.144231 | −1.07 | 0.285 |
| ISO 45001 | 0.0856484 | 0.1369664 | 0.63 | 0.532 | ||||
| ISO 50001 | −0.1126909 | 0.0987593 | −1.14 | 0.254 | −0.1234731 | 0.1009166 | −1.22 | 0.221 |
| ISO 27001 | 0.1606696 | 0.1117754 | 1.44 | 0.151 | 0.198241 | 0.1080534 | 1.83 | 0.067 |
| Leverage | −1.222295 | 0.5838707 | −2.09 | 0.036 | −1.32432 | 0.5872056 | −2.26 | 0.024 |
| Number of employees | −0.0260502 | 0.0059737 | −4.36 | 0.000 | −0.0305983 | 0.0068743 | −4.45 | 0.000 |
| lnage | 0.34378 | 0.1348504 | 2.55 | 0.011 | 0.6563635 | 0.2835178 | 2.32 | 0.021 |
| tier_1 | 0.2223122 | 0.1370581 | 1.62 | 0.105 | 0.2295241 | 0.1379038 | 1.66 | 0.096 |
| tier_2 | 0.2463476 | 0.1146058 | 2.15 | 0.032 | 0.282484 | 0.115056 | 2.46 | 0.014 |
| Constant | −0.6307342 | 0.4730502 | −1.33 | 0.182 | −1.624504 | 0.942284 | −1.72 | 0.085 |
| Industry | industry effects are included in the estimations | industry effects are included in the estimations | ||||||
| Number of Observations | 1378 | 1378 | ||||||
| Hansen J statistic | 14.958, Chi-sq(10) p-val = 0.1336 | 13.484, Chi-sq(8) p-val =0.0963 | ||||||
| AR (1) p value | z = −1.06 Pr > z = 0.2898 | z = −0.70 Pr > z = 0.4833 | ||||||
| AR (2) p value | z = 1.79 Pr > z = 0.0733 | z = 1.85 Pr > z = 0.0646 | ||||||
| Model 1.1 (R&D Intensity) | Model 1.2 (GOGS/Revenue) | Model 1.3 (ROA) | Model 1.4 (Tobins’ Q) | Model 2.1 (ROA) | Model 2.3 (Tobins’ Q) | |
|---|---|---|---|---|---|---|
| Number of certificates | −0.0000673 | −0.3389804 | 0.0099449 *** | 0.0634517 | ||
| ISO 9001 | 0.0090738 * | 0.226618 ** | ||||
| ISO 14001 | 0.0150345 *** | −0.1237565 | ||||
| ISO 45001 | 0.0048694 | 0.3384095 | ||||
| ISO 50001 | 0.0061371 * | −0.2619176 | ||||
| ISO 27001 | 0.0166118 *** | 0.1724123 | ||||
| dependent variable.lag | 0.8505042 *** | −6.408547 | 0.5695793 *** | 0.5929838 *** | 0.569488 *** | 0.5865831 *** |
| Leverage | 0.0001237 | −1.703022 | −0.105576 *** | −1.405957 *** | −0.1099927 *** | −1.352853 *** |
| Number of employees | 0.0000388 | −0.0434484 | −0.001071 | −0.0405156 *** | −0.0009245 | −0.0339429 *** |
| lnage | −0.0000135 | 0.2097061 | 0.0143774 ** | 0.690438 * | 0.0144684 ** | 0.6287225 * |
| tier_1 | 0.0003776 | −1.491006 | 0.0119395 * | 0.297591 ** | 0.0131486 ** | 0.2892051 ** |
| tier_2 | −0.0001857 | −1.334499 | 0.0037172 | 0.2427555 ** | 0.0052754 ** | 0.2744535 *** |
| Constant | 0.0004785 | 5.536562 | −0.0348519 | −1.846177 | −0.032749 | −1.70171 |
| industry | industry effects are included in all estimations | |||||
| Number of Observations | 1559 | 1561 | 1583 | 1509 | 1583 | 1509 |
| Hypotheses | Findings |
|---|---|
| H1: According to signaling theory, ISO certification leads to improved accounting-based financial performance. | Supported |
| H2: Based on the organizational legitimacy perspective, ISO certification leads to improved market-based financial performance. | partially supported |
| H3: According to resource-based view, ISO certification leads to improved operational performance. | not supported |
| H4: According to dynamic capabilities theory, ISO certification leads to improved R&D performance. | not supported |
| H5: According to slack resources theory, companies with slack resources are more likely to adopt ISO certification. | Supported |
| H6: Companies with certain characteristics such as size and age are more likely to acquire ISO certification. | Supported |
| H7: According to the contingency theory, subsectors influence the ISO certification-CFP relationship. | not supported |
| H8: Different ISO certifications have unique impacts on CFP | Supported |
Disclaimer/Publisher’s Note: The statements, opinions and data contained in all publications are solely those of the individual author(s) and contributor(s) and not of MDPI and/or the editor(s). MDPI and/or the editor(s) disclaim responsibility for any injury to people or property resulting from any ideas, methods, instructions or products referred to in the content. |
© 2024 by the author. Licensee MDPI, Basel, Switzerland. This article is an open access article distributed under the terms and conditions of the Creative Commons Attribution (CC BY) license (https://creativecommons.org/licenses/by/4.0/).
Share and Cite
Durak Uşar, D. Impact of ISO Certifications on Corporate Financial Performance: Evidence from Istanbul Stock Exchange-Listed Manufacturing Companies. Sustainability 2024, 16, 7021. https://doi.org/10.3390/su16167021
Durak Uşar D. Impact of ISO Certifications on Corporate Financial Performance: Evidence from Istanbul Stock Exchange-Listed Manufacturing Companies. Sustainability. 2024; 16(16):7021. https://doi.org/10.3390/su16167021
Chicago/Turabian StyleDurak Uşar, Damla. 2024. "Impact of ISO Certifications on Corporate Financial Performance: Evidence from Istanbul Stock Exchange-Listed Manufacturing Companies" Sustainability 16, no. 16: 7021. https://doi.org/10.3390/su16167021
APA StyleDurak Uşar, D. (2024). Impact of ISO Certifications on Corporate Financial Performance: Evidence from Istanbul Stock Exchange-Listed Manufacturing Companies. Sustainability, 16(16), 7021. https://doi.org/10.3390/su16167021