1. Introduction
Digital finance (DF) represents an advanced evolution in the financial sector, emerging from the profound fusion of finance and technology [
1]. It assumes a vital role in driving high-quality economic development by facilitating diverse financial activities [
2]. Considering new developmental perspectives, the environmental, social, and governance (ESG) concept has gained prominence among governments, enterprises, and investors, guiding their efforts toward sustainable and high-quality growth [
3]. ESG extends the principles of responsible and green investment, making it a crucial indicator of a company’s sustainability [
4]. By improving the assessment and transparency of corporate activities, DF supports these ESG goals and promotes more sustainable and responsible business practices [
5]. Moreover, DF makes evaluating the actual activities of companies concerning ESG criteria easier [
6]. This capability indirectly influences companies to better implement ESG practices. Many studies have explored the causality between DF and corporate ESG performance [
7,
8], but most of them have only considered the influence of DF on the ESG performance of companies in local regions. The revolutionary force of DF has given birth to ‘borderless finance’, which is characterised by network externalities and transcends geographic boundaries. This shift from traditional finance to highly Internet-based and digital formats has facilitated the cross-regional mobility of production factors like capital and labour. Consequently, financial efficiency has improved, creating a spatial spillover effect across different regions [
9]. Numerous studies have delved into the spatial spillover characteristics of DF. For example, Yilmaz, Haynes, and Dinc [
10] examined the spatial spillover effects due to information infrastructure using a geographic distance matrix, while Guo et al. [
11] argued that Internet finance has certain spatial characteristics and strong spatial aggregation. Therefore, ignoring the spatial spillover effects caused by the externalities of DF would result in an incomplete and inaccurate assessment of how DF influences corporate ESG outcomes.
Existing studies on the spatial spillover effects of DF mainly focus on two aspects: high-quality economic development and industrial structure upgrading. Regarding high-quality economic development, focus has been directed at the spatial effects of DF on economic growth, low-carbon development, and rural poverty alleviation. DF can enhance the economic growth not only of local regions but also that of neighbouring regions through the spillover effects of knowledge and technology [
12]; digital technology enables DF to reduce the carbon emissions of local agriculture and create a spillover effect in neighbouring regions [
13]. An empirical study of the poverty alleviation effect of DF shows that DF exhibits a positive spatial spillover effect on rural revitalisation [
14]. DF can generate beneficial spatial spillover effects on the upgrading of industrial structures through factor allocation, capital formation, and technological progress [
15]. Using a spatial econometrics model, Sun et al. [
16] analysed the intra-regional diffusion effect of DF on technological progress and found a positive spillover effect between them. Therefore, although many studies have investigated the spatial spillover effects of DF from different perspectives, few have considered the spatial spillover triggered by DF in corporate ESG performance. Furthermore, existing research lacks sufficient depth and comprehensiveness, as it only utilises panel data fixed-effects models to empirically verify the connection between them.
Given this context, this study delves deeper into the spatial spillover effects of DF on corporate ESG performance, considering the network externalities of DF. Our findings provide policy implications for effectively leveraging DF to achieve cross-regional and cross-spatiotemporal allocation of market factors and improving corporate the ESG performance in neighbouring regions. Our contributions are threefold. First, this paper enriches the current literature on the relationship between DF and corporate ESG performance. Prior studies have mostly focused on the direct effect of DF on corporate ESG [
8,
9]. Our findings represent a pioneering investigation of the spatial spillover effects of DF. This expanded perspective highlights how DF surpasses the temporal and spatial limitations inherent in traditional finance. Second, this paper enhances the understanding of the mechanism underpinning the spatial spillover effects of DF on corporate ESG performance. Through empirical tests of DF’s impact on labour mobility, capital mobility, and technology diffusion, we conclude that factor mobility serves as the channel in the spatial spillover effects of DF on corporate ESG performance. Third, we explore the variations in the spatial spillover effects of DF on corporate ESG performance concerning its economic scale and digital infrastructure level. This exploration establishes a theoretical foundation for crafting corporate ESG strategies tailored to local conditions.
The remainder of this paper is structured as follows.
Section 2 formulates the hypotheses development.
Section 3 describes the dataset and research methods.
Section 4 outlines the regression results.
Section 5 presents heterogeneity analysis.
Section 6 concludes this paper and illustrates policy implications. Finally,
Section 7 presents the limitations and future research.
2. Theoretical Analysis and Hypotheses Development
2.1. Direct Effect of DF on Corporate ESG
Driven by technologies such as big data, artificial intelligence, and cloud computing, DF has revolutionised traditional financial services. These advancements effectively address problems like inefficient resource allocation and high entry barriers that previously impeded financial services [
17], thereby providing new momentum for enhancing corporate ESG performance. On one hand, DF offers more accessible financial support to companies focused on green development through innovative financial products and services, thereby boosting their environmental impact [
9]. On the other hand, its networked and disintermediated nature expands public involvement in environmental protection efforts, increasing the scrutiny of corporate environmental responsibilities and promoting positive changes in corporate social responsibility [
18]. Additionally, DF supplies data support and technological infrastructure that enhance corporate self-monitoring mechanisms, aiding the optimisation of internal governance structures and encouraging departments within companies to actively adopt ESG development principles [
19]. DF impacts corporate ESG performance through the following two paths.
First, DF enhances corporate ESG performance by advancing the level of green innovation within enterprises. Green innovation, reflecting a company’s dedication to green development and innovation-driven strategies, balances economic efficiency with environmental impact, making it a vital element of corporate ESG performance [
20]. However, green innovation often encounters challenges like high risk, lengthy development cycles, and uncertain returns, which can impede progress and affect sustainability. DF addresses the limitations of traditional financial services in supporting innovation, through advanced technologies such as big data and artificial intelligence [
21]. By mitigating the risks associated with green innovation, DF offers essential technological support to improve corporate ESG performance.
Second, DF improves corporate ESG performance by alleviating financing constraints for enterprises. The advancement of new-generation digital technologies has produced DF models such as mobile payments, Internet lending, and supply chain finance. These innovations have effectively overcome the long-standing challenges of difficult and costly financing faced by enterprises, providing substantial financial support for enhancing corporate ESG performance. DF can impact corporate credit and funding availability through both banks and fintech companies, alleviating financing constraints and improving capital allocation [
22]. This shift promotes the flow of financial capital toward environmentally friendly and sustainable development, thereby bolstering corporate ESG initiatives [
6]. Building on the analysis above, we put forward the following hypothesis:
Hypothesis 1. DF enhances corporate ESG performance by advancing the level of green innovation and alleviating financing constraints.
2.2. Spatial Spillover Effects of DF on Corporate ESG
DF can break bottlenecks in ESG development and information barriers, pool various factor resources regardless of spatial and geographical boundaries, and promote ESG development in neighbouring regions through the ‘demonstration effect’ [
23]. In contrast to traditional finance, DF alleviates the difficulties in economic exchanges between enterprises due to geographical factors. Due to its externality and diffusion effects, DF transcends the spatial constraints imposed by geographic distances. It facilitates the seamless flow of production factors across diverse regions, thereby enhancing the efficiency of resource utilisation. Leveraging cutting-edge digital technologies, such as big data and the Internet of Things (IoT), DF can integrate and allocate available funds in the market [
24]. Consequently, it effectively alleviates the financing constraints experienced by enterprises in both local and neighbouring regions. Thus, it offers crucial financial support to fulfil corporate ESG objectives. Moreover, DF can accelerate technological upgrades and transformations in local businesses, not only effectively promoting digitalisation and greening in local enterprises, but also alleviating environmental pollution problems in surrounding areas caused by outdated technologies [
25]. Given this context, the following hypothesis was proposed:
Hypothesis 2. DF improves the ESG performance of not only enterprises in local regions, but also enterprises in neighbouring regions through the spatial spillover effects.
DF exerts a spatial spillover effect on corporate ESG performance by primarily enhancing factor mobility and minimising deviations from the optimal allocation of factor resources across various regions. Factor mobility denotes the geospatial transfer of the three key factors: labour, capital, and technology.
Regarding labour mobility, DF facilitates the mobility of neighbouring enterprises in the production and consumption sectors, creates new market demand, and promotes the mobility of labour across neighbouring regions [
26]. For the destinations of labour mobility, labour is the main driver of enterprises’ business growth; an increase in the total amount of labour can significantly improve enterprises’ productivity and help enterprises fulfil their ESG objectives. For the source regions of labour mobility, DF can promote the optimisation and integration of labour resources and improve labour efficiency and the production environment, thus laying a foundation for enterprises to value and improve their ESG performance [
27,
28].
Regarding capital mobility, DF can promote the balanced and fair allocation of capital and bridge the digital gap among different regions [
29]. For the destinations of capital mobility, the influx of capital reduces financial pressure for local companies, allowing them to concentrate on R&D for profit or low-carbon development, thus improving their ESG performances. For the source regions of capital mobility, the outflow of capital optimises market resources and governance structure, continuously improves enterprises’ operating efficiency, and helps enterprises fully integrate the ESG concept into their management systems [
30,
31].
Regarding technology diffusion, information asymmetry issues could be significantly mitigated by using digital financial technologies. This capability empowers neighbouring enterprises to effortlessly stay abreast of each other’s innovative activities and glean new knowledge from value networks [
32]. Consequently, it fosters an environment that is conducive to the sharing of technological knowledge, inspiring enterprises to innovate in green technology and autonomously fulfill their social and environmental responsibilities. For the destinations of technology diffusion, the inflow of technology can effectively alleviate any deficiencies in their innovative and technological abilities. This enables local enterprises to absorb and learn from the knowledge and technology of neighbouring regions, thereby reducing innovation costs, enhancing technological innovation capabilities, and ultimately improving corporate ESG performance. For the source regions of technology diffusion, local enterprises exchange their internal knowledge with the information technology of neighbouring enterprises, which stimulates the enterprises to proactively innovate in green technologies and adopt digital and green technologies to enhance their innovativeness and competitiveness, thus improving their ESG performance [
33,
34]. Consequently, we proposed the following hypothesis:
Hypothesis 3. DF positively affects the ESG performance of enterprises in local and neighbouring regions through labour mobility, capital mobility, and technology diffusion.
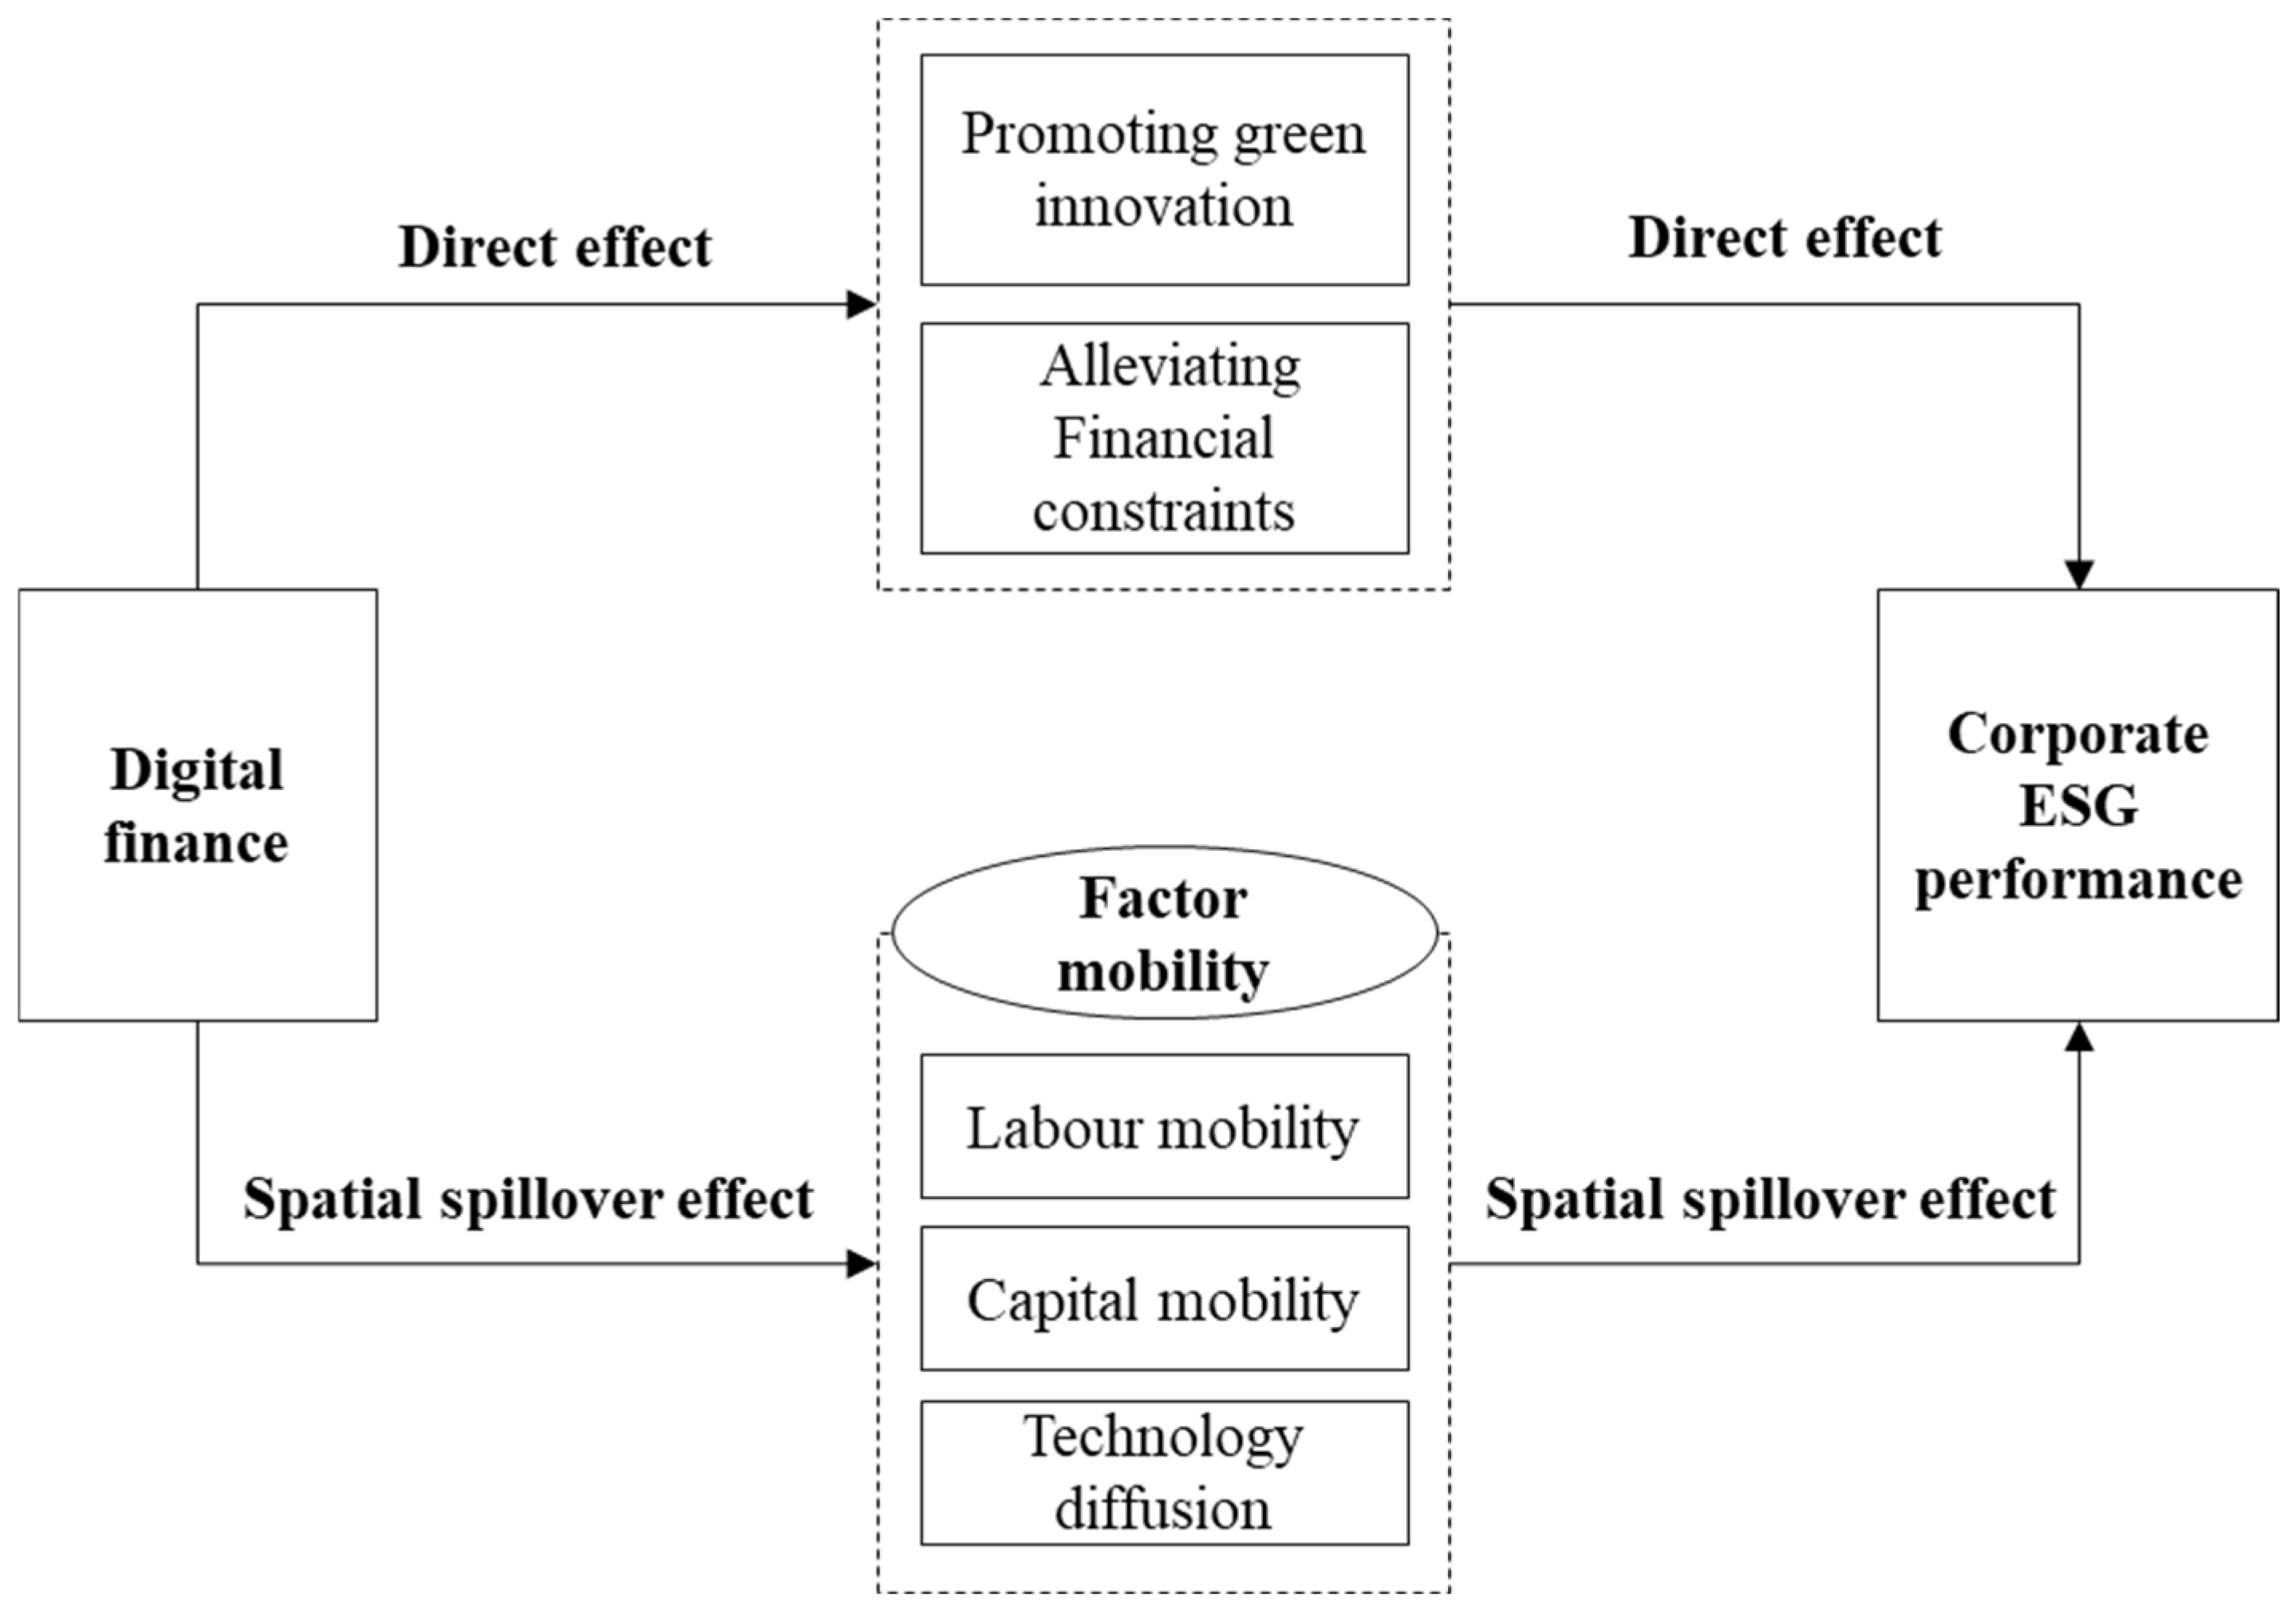
Figure 1 illustrates the mechanisms of the direct and spatial spillover effects of DF on corporate ESG performance.
3. Research Design
3.1. Variable Definition
3.1.1. Dependent Variable
Corporate ESG performance (
ESG) was the dependent variable. Referring to Wang, Liao, and Zhang [
35], we employed the ESG data from Bloomberg as a representation of corporate ESG performance. Bloomberg’s ESG data, comprising 120 indicators, was divided into three dimensions, environment (E), social (S), and governance (G), whose weights were identical. Aggregating the indicators within each dimension resulted in the dimension’s score, and aggregating the scores of the three dimensions produced the overall ESG performance score. The environmental (E) dimension focused primarily on information regarding air quality, climate change, pollution, renewable energy, water usage, and energy consumption. The social (S) dimension emphasised community relations, human rights, employee turnover, and the presence of women in management. The governance (G) dimension mainly considered corporate governance information represented by the board size, board duality, independent directors, female directors, number of meetings, and meeting attendance rate. After conducting an initial assessment of a company’s ESG scores, Bloomberg adjusted the scores based on the specific standards of different industries to ensure the comparability of the ESG scores across various sectors. All ESG scores were transformed using the natural logarithm to align their magnitude with that of other variables.
3.1.2. Key Explanator Variable
Digital finance (
Digfin) was the key explanatory variable in this study. The digital inclusive finance index developed by Guo et al. [
36], commonly known as the Peking University’s Index, has been widely used to characterise DF [
37,
38]. However, Liao et al. [
39] highlighted that while the Peking University’s Index is closely associated with DF, it mainly emphasises DF’s service level aspect. This focus still differs from that of the broader, comprehensive concept of DF. This study adopted the DF index proposed by Liao et al. [
39] to measure China’s urban DF. The index consists of one composite indicator (urban DF index) and three sub-indicators (digital financial services, digital financial technology, and digital financial environment). We used a combination of subjective and objective methods to assign weights to each indicator, creating the composite index. First, we calculated the secondary indicators of urban DF using grey target theory. Next, we determined the weights of the primary indicators through the analytic hierarchy process. Finally, we derived the composite index by applying a weighted average to the scores and weights of the primary indicators. For robustness checks, we also applied the digital inclusive index formulated by Guo et al. [
36].
3.1.3. Control Variables
To avoid bias in the regression analysis results due to omitted variables, the following firm-level control variables were chosen based on related studies [
5,
8,
9]: (1) return on assets (
Roa), calculated as the ratio of net profit to total assets; (2) Tobin’s Q value (
TobinQ), measured by the ratio of an enterprise’s market value to its replacement cost; (3) independent boards (
Indep), measured by the ratio of the number of independent directors of the board to the total number of the board directors; (4) ownership concentration (
Share), measured by the proportion of shareholdings of the top five shareholders; (5) firm age (
Age), measured by the natural logarithm of an enterprise’s years after establishment; (6) firm size (
Scale), measured by the natural logarithm of an enterprise’s year-end total assets; (7) cash flow capacity (
Cflow), measured by the ratio of net operating cash flow to total assets; (8) innovative R&D ability (
NL), measured by the ratio of an enterprise’s intangible assets to total assets; and (9) leverage ratio (
Lev), measured by the ratio of an enterprise’s liabilities to total assets.
Moreover, to ensure that the results were not influenced by city heterogeneity, we included the following control variables to account for city characteristics: (1) economic development (
Pgdp), defined as the natural logarithm of per-capita GDP in a prefectural-level city; (2) industrial structure (
Sec), assessed by the ratio of the value-added of the secondary sector to the GDP in a prefectural-level city; (3) technological level (
RD), reflected by the proportion of R&D employees to total employees; (4) economic agglomeration (
AG), quantified as the ratio of non-agricultural output to the total administrative area of a prefectural-level city; and (5) environmental regulation (
ER), following Huang and Liu [
40], a comprehensive variable that accounted for the reduction rates of various pollutants, including sulphur dioxide (SO
2), soot, and dust, as well as the wastewater treatment attainment rate were used to measure the stringency of environmental regulation.
To further control for the impact of time-invariant factors at the enterprise, industry, and city levels on the regression results, we also included dummy variables for enterprises, industries, and cities in the model.
3.2. Data Description and Sources
This study selected A-shares listed firms in China during the period from 2011 to 2022 as the main sample. The sample consisted of 634 firms (the number of excluded firms due to incomplete ESG data was considerable), with a total of 7608 annual observations. Furthermore, all continuous variables in the model were winsorized at the 1% and 99% levels to reduce the interference of extreme outliers on the regression results.
This study used ESG score data from Bloomberg. The DF index was sourced from the China City Statistical Yearbook and China Urban Construction Statistical Yearbook. The financial data for the listed firms were obtained from the China Stock Market and Accounting Research database. Prefecture-level city data were gathered from the China Statistical Yearbook and the Chinese Research Data Services platform. Descriptive statistics for the main variables are provided in
Table 1.
3.3. Model Specifications
This study aimed to reveal the spatial spillover effects of DF on corporate ESG performance. Following Sun et al. [
41], we adopted a spatial weight matrix (commonly used in spatial econometrics) to create the DF variable of a neighbouring city (
) and construct a triple fixed-effects model with the spatial spillover effects.
where
i denotes the firm,
j denotes the city’s location, and
t denotes the time.
is the ESG score of firm
i in year
t. is the total DF index in year
t in the city
j. is a series of firm-level control variables.
is a series of city-level control variables. Firm, Industry, City, and Year are the fixed effects for firm, industry, city, and year, respectively.
is a random disturbance term. According to the above analysis, the enterprise’s ESG performance is affected by the DF both within the local city and in neighbouring cities. Using the spatial econometric approach, the spatial weight
is introduced to Equation (1) to calculate the DF development level of a related neighbouring city, as follows:
where
N denotes the number of cities, and
denotes the spatial weight assigned to the DF development level in city
j, based on enterprises in city
p.
3.4. Settings of Geospatial Weight Matrices
DF can accelerate the circulation of financial resources across different regions but must still follow the basic laws of the financial market and is subject to geographical factors [
36]. Therefore, the effect of DF on corporate ESG performance may be geospatially correlated. The common geospatial weight matrices include the following. (1) 0–1 spatial weight matrix. As one of the most common geospatial weight matrices, a 0–1 spatial weight matrix can be used to determine whether two cities are neighbouring. That is, the matrix element (
) is assigned the value 1 if cities
j and
p share a border and
otherwise [
42]. (2) Geographic distance weight matrix. The interaction between regions diminishes with the increase in geographic distance. According to Ermagun and Levinson [
43], the inverse of the geographic distance between cities was used in this study to measure the extent to which the effect of DF on corporate ESG performance diminishes with the increase in geographic distance.
4. Empirical Results and Analysis
4.1. Spatial Correlation Test Results
To determine if DF possesses a spatial spillover effect, the Moran’s I index method was employed to gauge the spatial autocorrelation of DF.
Table 2 presents the values of Moran’s I index for DF as determined by the 0–1 spatial weight matrix and geographic distance weight matrix. The Moran’s I index values of DF were positive at the 1% significance level throughout the sample period, indicating that the level of DF is influenced by geographic location and exhibits spatial dependence among neighbouring regions. The spatial autocorrelation of DF suggests that establishing a panel model which considers spatial spillovers is vital.
4.2. Baseline Results
Table 3 shows the DF’s impact on corporate ESG performance, as estimated by Equation (1). The coefficients on DF were significant and positive at the 1% level. This suggests that DF significantly enhances corporate ESG performance, which aligns with previous findings [
8,
9]. Preliminary evidence supports Hypothesis 1. DF assumes a vital role in boosting corporate ESG performance by facilitating green innovation and easing financial barriers. It encourages companies to adopt more sustainable and responsible business practices, contributing to a better overall social and environmental landscape. Moreover, the coefficients of
WDigfin were significantly positive at the 5% level, indicating that DF exerts a positive spatial spillover effect on corporate ESG performance, thus supporting Hypothesis 2. This demonstrates that DF can overcome geographical barriers and exert a positive influence on corporate ESG performance in neighbouring areas.
Additionally, the coefficient of
Share was significant and positive at the 1% level, implying that high ownership concentration contributes to better ESG performance. The Coefficients of both
Age and
Scale were significantly positive at a statistical level of no more than 5%. This suggests that established and large firms have good ESG performance. The coefficient of
NL was also positive and significant, verifying that firms with stronger innovation capabilities will invest more in ESG initiatives.
Lev and
Sec both had a negative influence on corporate ESG performance. Therefore, debt financing may weaken the ESG performance, making it harder for companies to meet social and environmental responsibilities. Enterprises in regions with a higher proportion of polluting industries had worse ESG performance. Environmental regulation (
ER) was positively correlated with corporate ESG performance. A company that operates in an environment with strict environmental regulations is more likely to invest in sustainable practices, which leads to an improvement in its ESG performance. Generally, the effects of the control variables were congruent with expectations and the discoveries of existing studies [
44,
45]. The results of the Variance Inflation Factor (VIF) test for each variable showed that all VIF values were less than 5, and the maximum overall VIF value for each model was 4.7, which is far below 10. Therefore, no severe multicollinearity issues exist in our regressions.
4.3. Identification of Spatial Spillover Effects
As the economy continues to evolve, the economic development models of different regions demonstrate similar features and even verge on being the same [
46]. This implies that at the macro level, some uncontrollable factors can influence the development level of DF, creating an illusion of significant spatial correlations. Therefore, distinguishing whether this spatial spillover effect arises from uncontrollable variables or the causality between DF and corporate ESG performance is imperative. Specifically, when production trading activities occur between enterprises in different cities, a highly developed DF market can facilitate capital mobility. If DF is highly developed in neighbouring regions, enterprises in local regions will proactively innovate in green technology and endeavour to enhance their digitalisation level and development patterns to seize more financing and investment opportunities, ultimately improving their ESG performance. Otherwise, DF in neighbouring regions cannot notably influence corporate ESG performance in local regions. According to the above analysis, we tested the cause of the spatial spillover effects.
Following Li and Li [
47], the spatial spillover effects were identified through a quasi-natural experiment in which the sampled enterprises were classed into two groups: one being the control group and the other the experimental group. The control group comprised enterprises whose suppliers and clients were in the same city in the year
t, suggesting that the enterprises were not influenced by the DF in other regions; the experimental group comprised enterprises whose suppliers or customers were not in the same city in the year t, suggesting that the enterprises were partly affected by the DF in other regions. Suppose the spatial spillover effects of DF on corporate ESG performance is mainly due to the causality between them. Then, enterprises in the control group would not exhibit a positive spatial effect, whereas enterprises in the experimental group would exhibit a significant and positive spatial effect. To test the above theory, we needed to investigate whether the regression analysis results significantly differed between the experimental group and control group (
Table 4).
As shown in
Table 4, consistent regression results and conclusions were achieved. For the control group samples, the coefficients of local effect (
Digfin) were significantly positive at the 5% level, while the coefficients of neighbouring effect (
WDigfin) were not significant. This indicates that DF merely has a positive effect but has no spatial spillover effect on corporate ESG performance. For enterprises in the experimental group, the coefficients of local (
Digfin) and neighbouring (
WDigfin) effects were both positive and significant, implying that DF can significantly boost corporate ESG performance in both local and neighbouring regions. The regression results prove that the spatial spillover effect is caused by the direct effect of the DF of neighbouring regions on the ESG performance of local regions, thereby avoiding the endogeneity issue due to uncontrollable factors.
4.4. Robustness Check
4.4.1. Alternative Measurement for Key Variables
We performed regressions using the ESG ratings of the listed companies published by the Huazheng Index to ensure the baseline results were robust. These ratings served as an alternative measurement for the dependent variable, assigning scores from one to nine corresponding to the nine rating categories, ranging from C to AAA [
44]. The results are presented in Columns (1) and (3) of
Table 5. The coefficients of
Digfin and
WDigfin were both positive at the 5% level, suggesting that DF has a positive spatial spillover effect on corporate ESG performance.
Following previous studies [
37,
38], we utilised the digital inclusive finance index developed by Guo et al. [
36] to remeasure DF. The regression results after replacing the measurements for independent variables are given in Columns (2) and (4) of
Table 5. The coefficients of
Digfin and
WDigfin were still statistically significant. The above analysis confirms the robustness of our baseline results.
4.4.2. Replacing Geospatial Weight Matrices
As mentioned above, geospatial weight matrices were used to measure the spatial spillover effects. To prevent errors being caused by the section of geospatial weight matrices, we adopted an economic geographic distance matrix and an Internet geographic matrix instead to perform a regression analysis again. The Internet triggers the evolution of financial technology and accelerates the digitalisation and automation of the financial sector; economic development significantly affects the demand for DF products and services, promoting the development of the DF market. The impact of DF is inseparable from the Internet and economic development. Therefore, the Internet and economic development contribute significantly to the spatial spillover influence of DF. The economic geographic distance matrix or Internet geographic matrix is expressed as follows:
where
denotes the geographic distance matrix,
denotes the average annual GDP of city
i during 2011 to 2022, and
denotes the average GDP of all cities during 2011 to 2022 (for the economic geographic distance matrix); for the Internet geographic matrix,
denotes the geographic distance matrix,
denotes the average Internet development level of city
i during 2011 to 2022, and
denotes the average Internet development level of all cities during 2011 to 2022. Here, the Internet development level was measured by the number of Internet broadband access subscribers per 100 people.
Using the economic geographic distance matrix and Internet geographic matrix, we re-examined the spatial correlation between DF and corporate ESG performance. As shown by the regression analysis results (
Table 6), the local and neighbouring effects of DF on corporate ESG performance were significantly positive, regardless of whether it is based on the economic geographic distance matrix or the Internet geographic matrix. This conclusion aligns with the baseline regression results.
4.4.3. Endogeneity Issue: Instrumental Variable Method
The baseline results may be biased due to endogeneity, which originates from three major aspects: omitted variables, measurement errors, and reverse causality. This study utilised a triple fixed-effects panel model. Besides incorporating various time-varying variables at the firm, industry, and city levels that influence corporate ESG performance, it also included dummy variables for firms, industries, and cities to control for the impact of other time-invariant variables. This method effectively addressed the issue of omitted variables to a certain extent. For measurement errors, we used two approaches to assess DF: the index developed by Liao et al. [
39] and that developed by Guo et al. [
36]. Both methods are well-recognised in the academic community and produced consistent results in this study. There may be reverse causality between DF and corporate ESG. On the one hand, DF could influence corporate ESG performance by providing tools for better transparency and efficiency. On the other hand, improvements in corporate ESG practices might drive the adoption of DF solutions as companies seek to align with regulatory requirements and market expectations.
The instrumental variable method can effectively address issues of endogeneity such as omitted variables, measurement errors, and reverse causality [
48]. We chose a suitable instrumental variable to resolve the issue of endogeneity. Following Li et al. [
37], to address the possible endogeneity issue arising from bidirectional causality, we utilised the per capita number of mobile phones (Pmobile) as the instrumental variable for DF [
37]. On the one hand, mobile phones have made it easier for residents to avail financial services and can therefore be related to the DF level of a city. Nonetheless, the average number of mobile phones in cities hardly affects corporate ESG performance. Thus, theoretically, this instrumental variable satisfies the criteria of relevance and exogeneity.
Table 7 reports the results using the instrumental variable method. Column (1) presents the regression results of the first stage. The results show that the instrumental variable (
Pmobile) significantly and positively correlated with DF. Moreover, the weak instrumental variable test indicates that it meets the assumption of relevance, as both the Cragg–Donald F-statistic and the Kleibergen–Paap rk F-statistic were larger than the threshold of the 5% significance level (16.85). Columns (2) and (3) report the regression results of the second stage under two types of spatial weight matrix, where the coefficients of
Digfin and
WDigfin remained significantly positive. This implies that the basic finding that DF can boost corporate ESG performance both in the local region and neighbouring regions remains unchanged.
4.5. Mechanism Tests
4.5.1. Mechanism of Direct Effect
This section examined the potential mechanisms of the direct effect of DF influence on corporate ESG. According to above theoretical analysis, DF affects corporate ESG by promoting green innovation and alleviating financial constraints. Following Ren, Zeng, and Zhao [
9], green innovation (
GI) was measured by the number of green patent applications in this study. A higher number of green patent applications indicated a stronger capability for green innovation within a firm. Following Mu et al. [
8], we used the SA index as a proxy for corporate financial constraints (
Fincon). The detailed calculation process of the SA index can be found in Hadlock and Pierce [
49]. A firm with a higher absolute value of the SA index was regarded as being more financially constrained. The results of the mechanisms for the direct effect are displayed in
Table 8. The coefficient for
Digfin on
GI was significantly positive. This indicates that DF has a significant promoting effect on green innovation, stimulating enterprises’ enthusiasm and investment in ESG practices. Additionally, the coefficient for
Digfin on
Fincon was significantly negative, implying that DF can alleviate the financial burdens and restrictions faced by enterprises. Overall, the above results support our assumption that DF affects corporate ESG performance through promoting green innovation and alleviating financial constraints.
4.5.2. Mechanism of Spatial Spillover Effects
In this section, we examined whether DF could affect corporate ESG performance in neighbouring regions through labour mobility, capital mobility, and technology diffusion. Specifically, whether DF promotes capital flows to enterprises in neighbouring regions, innovation and diffusion of digital technology, and the cooperation and exchange of professional personnel, thus stimulating enterprises to improve their ESG performance. To test this hypothesis, we used the ratio of the year-end employed population to the total population to proxy labour mobility (
Lab) [
50]. The ratio of fixed investment to GDP in a city was a proxy for capital mobility (
Cap) [
51]. According to Sergio, Iandolo, and Ferragina [
52], technology diffusion (
IT) was measured by inter-regional R&D technology spillover, which is expressed as follows:
where
Sciencekt is the scientific research expenditure of city
k in year
t.
is the distance from city
j to city
k. Following Xiong, Dong, and Xu [
53], we replaced the individual dependent variable in Equation (1) with
Lab,
Cap, and
IT.
Columns (1) and (4) of
Table 9 report the results of the mechanism on DF affecting corporate ESG performance through labour mobility. Under two types of geospatial weight matrices, the coefficients of DF in local and neighbouring regions (
Digfin,
WDigfin) were significantly positive, suggesting that DF can promote labour mobility between neighbouring regions. For the destinations of labour mobility, the increased labour supply reduces labour costs, increases enterprises’ competitiveness, and reduces their consumption of environmental resources, thus improving their environmental performance [
54]. For the source regions of labour mobility, the reduced labour supply optimises the allocation of labour resources, and improves labour efficiency and resource utilisation, thus helping enterprises achieve ESG objectives [
41].
Columns (2) and (5) of
Table 9 report the results of the mechanism of DF affecting corporate ESG performance through capital mobility. Under two types of geospatial weight matrices, the coefficients of
Digfin and
WDigfin were positive at the 1% level, indicating that DF can accelerate capital inflows and outflows across different regions. For the destinations of capital mobility, the influx of capital can alleviate enterprises’ financing constraints, optimise the capital structure, and promote enterprises’ ESG practices. For the source regions of capital mobility, the outflow of capital leads to the increased price and return of capital, and boosts enterprises’ competitiveness, improving corporate ESG performance [
55].
Columns (3) and (6) of
Table 9 show that the coefficients for
Digfin and
WDigfin on
IT were significantly positive, supporting that DF can promote the diffusion of R&D technologies, thus having the positive spillover effects on corporate ESG performance.
The above results imply that DF positively affects the ESG performance of enterprises in local and neighbouring regions through labour mobility, capital mobility, and technology diffusion, thus confirming Hypothesis 3.
5. Heterogeneity Analysis
5.1. Heterogeneity on City’s Economic Development Level
Cities with different economic development levels differ significantly in development characteristics and market scales. Against the backdrop of varying market service demands, the spatial spillover effects of DF may also differ. This study assessed a city’s economic development level using per-capita GNP. Based on this measure, all sampled cities were categorised into two groups: those with high economic development and those with low economic development. If the per-capita GNP of the city where an enterprise is located was greater than the average per-capita GNP of all sampled cities in the current year, the city was classified as a city with a high economic development level; otherwise, the city was classified as a city with a low economic development level.
The results are displayed in
Table 10. From the regression coefficients of
WDigfin, the positive spatial spillover effects of DF on corporate ESG performance were significant in cities with a high economic development level, but the effects were not significant in cities with a low economic development level. This may be because, compared to cities with a high economic development level, cities with a low economic level are still in the process of perfecting their financial market structures and operating mechanisms, having smaller market scales and demands for digital financial services and products [
56]. Investors in cities with a low economic development level may be more concerned with enterprises’ financial performance than their ESG performance. In cities with a high economic development level, however, economic agglomeration creates a favourable environment for the spatial spillover effects of DF, the developed DF ecosystem attracts large quantities of enterprises, and the externality of economic agglomeration promotes the sharing of resources among enterprises, thus facilitating the spillover effects of DF and improving corporate ESG performance.
5.2. Heterogeneity on City’s Digital Infrastructure Level
Digital infrastructure is the key to promoting enterprises’ digital and intelligent development. A high level of digital infrastructure can facilitate the innovation and development of DF, promote the circulation of corporate information in the market, and make corporate behaviours and decisions more accessible to the market, thus boosting enterprises’ image and social reputation [
57]. Following Hong, Shi, and Zheng [
58], the sampled cities were divided into two groups: those included in the ‘Broadband China’ demonstration project, categorised as the group with a high digital infrastructure level, and those not included, categorised as the group with a low digital infrastructure level. The regression results are demonstrated in
Table 11.
The results revealed that for cities with a low digital infrastructure level, DF does not significantly affect corporate ESG performance; for cities with a high digital infrastructure level, the local and neighbouring effects of DF on corporate ESG performance were both statistically positive at the 5% level. One reason for this may be that, in cities with highly developed digital infrastructure, adequate digital infrastructure can effectively help enterprises in local and neighbouring regions implement digital transformation and alleviate environmental pollution emissions by using digital technologies (e.g., big data, IoT, and cloud computing), thus improving corporate ESG performance.
6. Conclusions and Policy Suggestions
DF has transcended regional limitations by using big data and advanced technology. Some studies have recognised the significance of DF for the sustainable development of enterprises [
8,
9,
33], but tend to overlook the spatial spillover effects of DF. By combining the data of corporate ESG performance and urban DF, this study investigated the spatial spillover effects of DF on corporate ESG performance and explored its mechanisms. The findings are as follows:
First, the impact of DF on corporate ESG performance extends beyond local boundaries, significantly enhancing the sustainability practices of enterprises in neighbouring regions as well. This underscores the notable spatial spillover effects resulting from the positive influence of DF on broader environmental, social, and governance considerations. Second, DF enhances the ESG performance of enterprises by fostering green innovation and easing financial constraints. The spatial spillover effects operate through three main channels: labour mobility, capital mobility, and technology diffusion. Third, the heterogeneity analysis indicates that in regions with a substantial economy and advanced digital infrastructure, DF has a more pronounced impact on improving the ESG performance of enterprises in both local and neighbouring regions.
The following policy implications can be gathered from the above findings:
First, enterprises should fully recognise the positive impact of DF on their own and neighbouring enterprises’ ESG performance and proactively utilise digital financial tools and services. They should strengthen their cooperation and communication with surrounding enterprises to jointly promote regional sustainable development, form industrial cluster advantages, and share the benefits brought by DF. For instance, enterprises can establish cooperative alliances to conduct environmental protection projects or social responsibility activities, such as jointly investing in regional sewage treatment facilities or organising public welfare activities to support local education and healthcare. Additionally, enterprises should actively invest resources in technological research and development to better utilise the technology diffusion effect of DF, thereby enhancing their ESG performance. For example, manufacturing enterprises can develop intelligent energy-saving production equipment or renewable energy technologies to reduce their carbon emissions. Furthermore, enterprises should consider the economic development and digital infrastructure of their region, adjusting their development strategies accordingly to maximise the role of DF. In developed regions, they can leverage DF to access high-end talent and expand into international markets, while in regions with weaker digital infrastructure, they can collaborate with local governments to improve digital infrastructure.
Second, the government should enhance the promotion and regulation of DF to boost the ESG performance of enterprises. It is crucial to formulate and improve policies that encourage the broader development and application of DF, promote regional coordinated development, and reduce development imbalances. For example, the government can provide tax incentives or subsidies to DF enterprises operating in economically underdeveloped areas, such as tax reductions for digital financial institutions that establish service outlets in remote areas or low-interest loans to support their growth. Increasing investment in digital infrastructure, especially in economically backward areas, is essential to improve the coverage and service quality of DF. This can include building high-speed network facilities and promoting electronic payment systems to ensure that remote areas have access to stable network services, and encouraging financial institutions to popularise mobile payment and online financial services. Moreover, the government should guide the rational flow of labour, capital, and technology to create a favourable market environment for DF’s spatial spillover effects. Establishing unified labour and capital markets can promote optimal resource allocation, and talent exchange platforms can facilitate the flow of professional talents across regions. The government should also improve capital market regulations to encourage investment in high-potential enterprises and regions. Finally, establishing and refining the ESG evaluation system and regulatory mechanisms is vital for encouraging enterprises to focus on ESG performance. This includes formulating clear ESG standards and disclosure requirements, recognising and rewarding outstanding enterprises, prioritising them in government procurement and project approvals, and imposing penalties on enterprises that fail to meet ESG standards.
7. Limitations and Future Research
While this study provides valuable insights into the spatial spillover effects of DF on corporate ESG performance, some limitations need to be acknowledged. First, our findings indicate that DF positively impacts corporate ESG performance beyond local boundaries, significantly enhancing the sustainability practices of enterprises in neighbouring regions. However, the study did not fully explore the potential variations in this impact across different industries or sectors. Future research should consider industry-specific analyses to better understand how DF influences ESG performance in various contexts. Second, we identified three primary channels through which DF enhances ESG performance in neighbouring regions: labour mobility, capital mobility, and technology diffusion. While these mechanisms are crucial, other factors such as regulatory frameworks, cultural differences, and local economic conditions may also be significant. Future studies should incorporate these additional variables to provide a more comprehensive understanding of the mechanisms at play. Finally, the spatial spillover effects of DF may evolve over time. This study provides a snapshot of the current impact, but longitudinal studies are necessary to understand how these effects change and develop. Future research should focus on temporal dynamics to capture the evolving nature of DF’s influence on corporate ESG performance.
Author Contributions
Conceptualisation, H.W. and B.H.; methodology, Y.L.; software, Y.L.; validation, B.H.; formal analysis, Y.L.; investigation, H.W.; data curation, B.H. and Y.L.; writing—original draft preparation, H.W. and B.H.; writing—review and editing, Y.L.; supervision, B.H. All authors have read and agreed to the published version of the manuscript.
Funding
This work was supported by the Natural Science Foundation of Hunan Province (2023JJ40453), the Scientific Research Project of Education Department of Hunan Province (23B0086), and the Water Resources Science and Technology Program of Hunan Province (XSKJ2023059-52).
Institutional Review Board Statement
Not applicable.
Informed Consent Statement
Not applicable.
Data Availability Statement
The data are contained within the article.
Conflicts of Interest
The authors declare no conflicts of interest.
References
- Jiang, X.; Wang, X.; Ren, J.; Xie, Z. The nexus between digital finance and economic development: Evidence from China. Sustainability 2021, 13, 7289. [Google Scholar] [CrossRef]
- Lv, C.; Song, J.; Lee, C.C. Can digital finance narrow the regional disparities in the quality of economic growth? Evidence from China. Econ. Anal. Policy 2022, 76, 502–521. [Google Scholar] [CrossRef]
- Arvidsson, S.; Dumay, J. Corporate ESG reporting quantity, quality and performance: Where to now for environmental policy and practice? Bus. Strategy Environ. 2022, 31, 1091–1110. [Google Scholar] [CrossRef]
- Pedersen, L.H.; Fitzgibbons, S.; Pomorski, L. Responsible investing: The ESG-efficient frontier. J. Financ. Econ. 2021, 142, 572–597. [Google Scholar] [CrossRef]
- Li, W.; Pang, W. The impact of digital inclusive finance on corporate ESG performance: Based on the perspective of corporate green technology innovation. Environ. Sci. Pollut. Res. 2023, 30, 65314–65327. [Google Scholar] [CrossRef]
- Li, G.; Zhang, R.; Feng, S.; Wang, Y. Digital finance and sustainable development: Evidence from environmental inequality in China. Bus. Strategy Environ. 2022, 31, 3574–3594. [Google Scholar] [CrossRef]
- Xie, Q.; Wang, D.; Bai, Q. “Cooperation” or “competition”: Digital finance enables green technology innovation—A new assessment from dynamic spatial spillover perspectives. Int. Rev. Econ. Financ. 2024, 93, 587–601. [Google Scholar] [CrossRef]
- Mu, W.; Liu, K.; Tao, Y.; Ye, Y. Digital finance and corporate ESG. Financ. Res. Let. 2023, 51, 103426. [Google Scholar] [CrossRef]
- Ren, X.; Zeng, G.; Zhao, Y. Digital finance and corporate ESG performance: Empirical evidence from listed companies in China. Pac.-Basin Financ. J. 2023, 79, 102019. [Google Scholar] [CrossRef]
- Yilmaz, S.; Haynes, K.E.; Dinc, M. Geographic and network neighbors: Spillover effects of telecommunications infrastructure. J. Reg. Sci. 2002, 42, 339–360. [Google Scholar] [CrossRef]
- Guo, B.; Wang, Y.; Zhang, H.; Liang, C.; Feng, Y.; Hu, F. Impact of the digital economy on high-quality urban economic development: Evidence from Chinese cities. Econ. Model. 2023, 120, 106194. [Google Scholar] [CrossRef]
- Dong, Q.; Li, W.; Wu, Y.; Li, W.; Sun, D. The impact of digital inclusive finance on the high-quality development of Guangdong’s real economy: An analysis based on spatial econometric models. Theor. Econ. Lett. 2023, 13, 953–973. [Google Scholar] [CrossRef]
- Chang, J. The role of digital finance in reducing agricultural carbon emissions: Evidence from China’s provincial panel data. Environ. Sci. Pollut. Res. 2022, 29, 87730–87745. [Google Scholar] [CrossRef] [PubMed]
- Hui, P.; Zhao, H.; Liu, D.; Li, Y. How does digital finance affect regional innovation capacity? A spatial econometric analysis. Econ. Model. 2023, 122, 106250. [Google Scholar] [CrossRef]
- Ren, X.; Zeng, G.; Gozgor, G. How does digital finance affect industrial structure upgrading? Evidence from Chinese prefecture-level cities. J. Environ. Manag. 2023, 330, 117125. [Google Scholar] [CrossRef] [PubMed]
- Sun, Z.; Cao, C.; He, Z.; Feng, C. Examining the coupling coordination relationship between digital inclusive finance and technological innovation from a spatial spillover perspective: Evidence from China. Emerg. Mark. Financ. Trade 2023, 59, 1219–1231. [Google Scholar] [CrossRef]
- Lin, B.; Ma, R. How does digital finance influence green technology innovation in China? Evidence from the financing constraints perspective. J. Environ. Manag. 2022, 320, 115833. [Google Scholar] [CrossRef]
- He, F.; Guo, X.; Yue, P. Media coverage and corporate ESG performance: Evidence from China. Int. Rev. Financ. Anal. 2024, 91, 103003. [Google Scholar] [CrossRef]
- Wang, D.; Peng, K.; Tang, K.; Wu, Y. Does FinTech development enhance corporate ESG performance? Evidence from an emerging market. Sustainability 2022, 14, 16597. [Google Scholar] [CrossRef]
- Long, H.; Feng, G.F.; Gong, Q.; Chang, C.P. ESG performance and green innovation: An investigation based on quantile regression. Bus. Strategy Environ. 2023, 32, 5102–5118. [Google Scholar] [CrossRef]
- Li, X.; Shao, X.; Chang, T.; Albu, L.L. Does digital finance promote the green innovation of China’s listed companies? Energy Econ. 2022, 114, 106254. [Google Scholar] [CrossRef]
- Wu, Y.; Huang, S. The effects of digital finance and financial constraint on financial performance: Firm-level evidence from China’s new energy enterprises. Energy Econ. 2022, 112, 106158. [Google Scholar] [CrossRef]
- Zhang, M.; Liu, Y. Influence of digital finance and green technology innovation on China’s carbon emission efficiency: Empirical analysis based on spatial metrology. Sci. Total Environ. 2022, 838, 156463. [Google Scholar] [CrossRef]
- Sahut, J.M.; Dana, L.P.; Teulon, F. Corporate governance and financing of young technological firms: A review & introduction. Technol. Forecast. Soc. Chang. 2021, 163, 120425. [Google Scholar]
- Tang, Y.; Zhang, X.; Lu, S.; Taghizadeh-Hesary, F. Digital finance and air pollution in China: Evolution characteristics, impact mechanism and regional differences. Resour. Policy 2023, 86, 104073. [Google Scholar] [CrossRef]
- Feng, R.; Shen, C.; Guo, Y. Digital finance and labor demand of manufacturing enterprises: Theoretical mechanism and heterogeneity analysis. Int. Rev. Econ. Financ. 2024, 89, 17–32. [Google Scholar] [CrossRef]
- Jepsen, M.; Drahokoupil, J. The digital economy and its implications for labour. 2. The consequences of digitalisation for the labour market. Transf. Eur. Rev. Labour Res. 2017, 23, 249–252. [Google Scholar] [CrossRef]
- Zhang, X. The impact of digital finance on corporate labor productivity: Evidence from Chinese-listed companies. J. Ind. Econ. 2023, 50, 527–550. [Google Scholar] [CrossRef]
- Zhan, M.; Li, S.; Wu, Z. Can digital finance development improve balanced regional investment allocations in developing countries?—The evidence from China. Emerg. Mark. Rev. 2023, 56, 101035. [Google Scholar] [CrossRef]
- Zhang, D.; Lucey, B.M. Sustainable behaviors and firm performance: The role of financial constraints’ alleviation. Econ. Anal. Policy 2022, 74, 220–233. [Google Scholar] [CrossRef]
- Li, C.; Wang, Y.; Zhou, Z.; Wang, Z.; Mardani, A. Digital finance and enterprise financing constraints: Structural characteristics and mechanism identification. J. Bus. Res. 2023, 165, 114074. [Google Scholar] [CrossRef]
- Feng, S.; Zhang, R.; Li, G. Environmental decentralization, digital finance and green technology innovation. Struct. Chang. Econ. Dyn. 2022, 61, 70–83. [Google Scholar] [CrossRef]
- Kong, T.; Sun, R.; Sun, G.; Song, Y. Effects of digital finance on green innovation considering information asymmetry: An empirical study based on Chinese listed firms. Emerg. Mark. Financ. Trade 2022, 58, 4399–4411. [Google Scholar] [CrossRef]
- Razzaq, A.; Sharif, A.; Ozturk, I.; Skare, M. Asymmetric influence of digital finance, and renewable energy technology innovation on green growth in China. Renew. Energy 2023, 202, 310–319. [Google Scholar] [CrossRef]
- Wang, Z.; Liao, K.; Zhang, Y. Does ESG screening enhance or destroy stock portfolio value? Evidence from China. Emerg. Mark. Financ. Trade 2022, 58, 2927–2941. [Google Scholar] [CrossRef]
- Guo, F.; Wang, J.; Wang, F.; Kong, T.; Zhang, X.; Cheng, Z. Measuring China’s digital financial inclusion: Index compilation and spatial characteristics. China Econ. Q. 2020, 19, 1401–1418. [Google Scholar]
- Li, J.; Wu, Y.; Xiao, J.J. The impact of digital finance on household consumption: Evidence from China. Econ. Model. 2020, 86, 317–326. [Google Scholar] [CrossRef]
- Guo, C.; Wang, X.; Yuan, G. Digital finance and the efficiency of household investment portfolios. Emerg. Mark. Financ. Trade 2022, 58, 2895–2909. [Google Scholar] [CrossRef]
- Liao, G.; Li, Z.; Wang, M.; Albitar, K. Measuring China’s urban digital finance. Quant. Financ. Econ. 2022, 6, 385–404. [Google Scholar] [CrossRef]
- Huang, X.; Liu, X. The impact of environmental regulation on productivity and exports: A firm-level evidence from China. Emerg. Mark. Financ. Trade 2019, 55, 2589–2608. [Google Scholar] [CrossRef]
- Su, X.; Wang, S.; Li, F. The impact of digital transformation on ESG performance based on the mediating effect of dynamic capabilities. Sustainability 2023, 15, 13506. [Google Scholar] [CrossRef]
- Lam, C.; Souza, P.C. Estimation and selection of spatial weight matrix in a spatial lag model. J. Bus. Econ. Stat. 2020, 38, 693–710. [Google Scholar] [CrossRef]
- Ermagun, A.; Levinson, D. An introduction to the network weight matrix. Geogr. Anal. 2018, 50, 76–96. [Google Scholar] [CrossRef]
- Luo, Y.; Tian, N.; Wang, D.; Han, W. Does Digital Transformation Enhance Firm’s ESG Performance? Evidence from an Emerging Market. Emerg. Mark. Financ. Trade 2024, 60, 825–854. [Google Scholar] [CrossRef]
- Fang, M.; Nie, H.; Shen, X. Can enterprise digitization improve ESG performance? Econ. Model. 2023, 118, 106101. [Google Scholar] [CrossRef]
- Lall, S.V.; Yilmaz, S. Regional economic convergence: Do policy instruments make a difference? Ann. Reg. Sci. 2001, 35, 153–166. [Google Scholar] [CrossRef]
- Li, H.; Li, Z. Road investments and inventory reduction: Firm level evidence from China. J. Urban Econ. 2013, 76, 43–52. [Google Scholar] [CrossRef]
- Baiocchi, M.; Cheng, J.; Small, D.S. Instrumental variable methods for causal inference. Stat. Med. 2014, 33, 2297–2340. [Google Scholar] [CrossRef]
- Hadlock, C.J.; Pierce, J.R. New evidence on measuring financial constraints: Moving beyond the KZ index. Rev. Financ. Stud. 2010, 23, 1909–1940. [Google Scholar] [CrossRef]
- Boschma, R.; Eriksson, R.H.; Lindgren, U. Labour market externalities and regional growth in Sweden: The importance of labour mobility between skill-related industries. Reg. Stud. 2014, 48, 1669–1690. [Google Scholar] [CrossRef]
- Duan, L.; Sun, W.; Zheng, S. Transportation network and venture capital mobility: An analysis of air travel and high-speed rail in China. J. Transp. Geogr. 2020, 88, 102852. [Google Scholar] [CrossRef]
- Sergio, I.; Iandolo, S.; Ferragina, A.M. Inter-sectoral and inter-regional knowledge spillovers: The role of ICT and technological branching on innovation in high-tech sectors. Technol. Forecast. Soc. Chang. 2023, 194, 122728. [Google Scholar] [CrossRef]
- Xiong, W.; Dong, M.; Xu, C. Institutional investors and corporate social responsibility: Evidence from China. Emerg. Mark. Financ. Trade 2023, 59, 3281–3292. [Google Scholar] [CrossRef]
- Flachenecker, F.; Kornejew, M. The causal impact of material productivity on microeconomic competitiveness and environmental performance in the European Union. Environ. Econ. Policy Stud. 2019, 21, 87–122. [Google Scholar] [CrossRef]
- Schramade, W. Integrating ESG into valuation models and investment decisions: The value-driver adjustment approach. J. Sustain. Financ. Invest. 2016, 6, 95–111. [Google Scholar] [CrossRef]
- Frick, S.A.; Rodríguez-Pose, A. Change in urban concentration and economic growth. World Dev. 2018, 105, 156–170. [Google Scholar] [CrossRef]
- Niu, G.; Jin, X.; Wang, Q.; Zhou, Y. Broadband infrastructure and digital financial inclusion in rural China. China Econ. Rev. 2022, 76, 101853. [Google Scholar] [CrossRef]
- Hong, J.; Shi, F.; Zheng, Y. Does network infrastructure construction reduce energy intensity? Based on the “Broadband China” strategy. Technol. Forecast. Soc. Chang. 2023, 190, 122437. [Google Scholar] [CrossRef]
| Disclaimer/Publisher’s Note: The statements, opinions and data contained in all publications are solely those of the individual author(s) and contributor(s) and not of MDPI and/or the editor(s). MDPI and/or the editor(s) disclaim responsibility for any injury to people or property resulting from any ideas, methods, instructions or products referred to in the content. |
© 2024 by the authors. Licensee MDPI, Basel, Switzerland. This article is an open access article distributed under the terms and conditions of the Creative Commons Attribution (CC BY) license (https://creativecommons.org/licenses/by/4.0/).


