Article

Techno-Economic Assessment of Bifacial Photovoltaic Systems under Desert Climatic Conditions

by
Osama Ayadi
1,*,
Bilal Rinchi
1,
Sameer Al-Dahidi
2,*,
Mohammed E. B. Abdalla
1 and
Mohammed Al-Mahmodi
1
1
Mechanical Engineering Department, School of Engineering, The University of Jordan, Amman 11942, Jordan
2
Department of Mechanical and Maintenance Engineering, School of Applied Technical Sciences, German Jordanian University, Amman 11180, Jordan
*
Authors to whom correspondence should be addressed.
Sustainability 2024, 16(16), 6982; https://doi.org/10.3390/su16166982
Submission received: 30 June 2024 / Revised: 26 July 2024 / Accepted: 13 August 2024 / Published: 15 August 2024
(This article belongs to the Section Energy Sustainability)

Abstract

The decaying prices and improving efficiency of bifacial solar photovoltaic (PV) technologies make them most promising for harnessing solar radiation. Deserts have a high solar potential, but harsh conditions like high temperatures and dust negatively affect the performance of any proposed solar system. The most attractive aspect of deserts is their long-term sustainability, as they are free from urban and agricultural expansion. In this work, the System Advisor Model (SAM) software version 2023.12.17 was used to model a 100 MW PV plant and evaluate the techno-economic performance of fixed, 1-axis, and 2-axis bifacial systems under the climatic conditions of six deserts from around the world. This study explores technical parameters such as the performance ratio, specific yield, and capacity factor. Additionally, the levelized cost of energy (LCOE) indicator was used to compare the economic performance of the different systems. Results showed high specific yield: the averages for the three systems in six deserts were 2040, 2372, and 2555 kWh/kWp, respectively. Economic analysis found that an LCOE below 4 ¢/kWh is achievable in all deserts, reaching a minimum of 2.45 ¢/kWh under favorable conditions. These results emphasize the high potential of utility-scale PV projects in deserts to advance a green, sustainable energy future.

1. Introduction

The increasing global demand for electricity and the high energy consumption of buildings are two of the most pressing energy challenges today. The International Energy Agency (IEA) reported a 2.2% rise in global electricity demand in 2023, with projections indicating an average annual increase of 3.4% until 2026 [1]. Buildings play a significant role in this scenario, representing 30% of the world’s total energy consumption and contributing to 26% of energy-related emissions [2]. Since 2000, the energy demand of space-cooling systems has grown by about 4% annually, twice that of water-heating systems [3].
In response to these energy challenges, solar power offers a promising sustainable solution. Predictions indicate that the combined installations of solar photovoltaic (PV) and wind energy will more than double by 2028 compared to 2022, highlighting their increasing importance in the global energy landscape [4]. According to the International Renewable Energy Agency (IRENA), the renewable energy portion of the global energy mix is expected to rise from 16% in 2020 to 77% by 2050 under a 1.5 °C global warming scenario [5].
Achieving climate targets requires a significant increase in renewable energy from about a 15% share of the total primary energy supply in 2015 to around two-thirds by 2050. Additionally, the energy intensity of the global economy must decrease by roughly two-thirds within the same timeframe [6]. The rapid expansion and increased adoption of solar energy technologies are essential in mitigating the impacts of rising electricity demand and energy consumption in buildings. Solar energy, with its abundant and renewable nature [7], offers a sustainable pathway to enhance energy security [8], reduce greenhouse gas emissions [9,10], and support global climate goals [11].
With the pressing energy challenges and the potential of solar energy as a sustainable solution, research into the best locations for large-scale solar installations is being pursued. Sustainable practices in energy production and consumption are necessary for addressing these challenges. Deserts are singled out as being one of these highly favorable places to implement solar PV projects due to their unique environmental characteristics. Deserts are vast regions covering approximately 17% of the Earth’s land surface [12], and mostly have great access to high amounts of solar radiation [13]. Prior research has already highlighted that the highest solar potential is attributed to the Atacama Desert in Chile, and the Sahara Desert which receives up to 9.4 GJ/m2 [14]. Another study has also noted that a 20% coverage of the Sahara Desert with solar PV can produce enough energy to cover the world’s energy consumption [15]. Chang et al. [16] suggested that the PV-induced climate effects, like increased humidity, reduced evaporation, and reduced wind speeds, could offer environmental and ecological advantages to desert areas, contributing to improved local vegetation growth and desertification control. The beneficial effects have been further confirmed in other similarly targeted studies [17]. There are some major disadvantages of utilizing deserts that must also be considered, such as the lifetime of PV modules [13], soiling, hailstorms, and electricity transmission [18].
In addition to traditional monofacial PV technology, bifacial solar modules have been widely considered in sustainability practices as they offer a higher efficiency and greater energy yield [19,20,21,22]. These modules can capture sunlight on both the front and the back, harnessing reflected light from the ground and surrounding surfaces. Elevating bifacial solar panels to a height of 1 m above the ground and increasing the surface reflectivity (albedo) to 0.5 can enhance their energy output by up to 30% compared to monofacial panels under the same conditions [23]. As such, previous studies in the literature have used albedo values of 0.43–0.45 for bifacial systems in some desert environments [22,24]. From an economic perspective, bifacial modules are expected to capture 40% of the market share by 2028 [25]. Electricity prices for PV installations in the Middle East have reached 3 ¢ per kWh [26], while a bid as low as 1.79 ¢ per kWh was reached for a bifacial solar project in Saudi Arabia [27]. The overall economic viability for PV systems in desert environments is sampled in [28], where the electricity cost of a 1600 MWac system in Western Desert, Egypt, named the Benban Solar Park was found to be 8.1 ¢ per kWh with a 10.1-year payback period. In addition to these projects, many notable installations like the New England Solar project in Australia [29] and the Guanchoi solar plant in Chile [30] have commenced commercial operation. However, detailed performance data from these plants is largely unavailable in academic research, with limited information occasionally accessible through their respective online platforms.
Analyzing different studies from the literature across several desert climatic conditions, Ayala et al. [31] conducted a study in the Atacama Desert, Chile, comparing the performance of monocrystalline, polycrystalline, thin-film, and bifacial PV modules. The bifacial module showed a performance ratio (PR) of 96%, significantly higher than monocrystalline (78%), polycrystalline (88%), and thin-film (90%) technologies. The experimental study highlighted the minimal soiling impact on bifacial modules due to natural cleaning effects from early morning humidity known as “camanchaca”, maintaining a soiling ratio of 0.94 ± 0.01. Similarly, Cabrera et al. [32] examined how soiling affects the energy yield (YA) of bifacial solar modules with various mounting configurations in the Atacama Desert. The authors fabricated nine types of one-cell bifacial modules and conducted electrical characterization using bifacial and monofacial measurement setups. The results showed that under no soiling conditions, tilted mounted bifacial modules (TMBM) produced higher YA values compared to vertically mounted bifacial modules (VMBM); however, VMBM outperformed TMBM when the soiling rate exceeded 0.10% per day. Cordero et al. [33] investigated the impact of soiling on PV modules in the Atacama Desert over a 12-month period. The study measured energy losses by comparing the outputs of clean and soiled modules across five different locations. Results indicated that annual energy losses due to soiling were highest in Arica, peaking at 39%, while high-altitude sites like Calama experienced much lower losses of 3% or less. The study highlighted significant variations in soiling rates depending on location and season, with northern coastal areas exhibiting the highest losses due to a combination of high deposition rates and infrequent rainfall. The effect of soiling was additionally studied by Olivares et al. [34], who found that the accumulated surface dust density reached up to 0.17 mg/cm2 per month, leading to current losses of 19% and a relative efficiency reduction of 13.5% after four months.
In Dubai, Haider et al. [35] conducted a simulation study using the System Advisor Model (SAM) software (version not specified) to evaluate the performance of 19 different scenarios, involving various combinations of monofacial and bifacial modules under different tracking modes, thermal management strategies, tilt angles, orientations, and albedo levels. The findings revealed that for monofacial PV modules, the implementation of thermal management increased energy yield by approximately 12%, while the use of solar trackers enhanced yield by 17.2–34.2%. Combining both thermal management and solar trackers resulted in an energy yield boost of 33.6–52.8%. The highest energy production for monofacial modules was achieved with 2-axis trackers, particularly under high albedo conditions, where energy production exceeded the base case by over 82.6%. In contrast, the highest energy yield increase for bifacial modules was 71.8% compared to the base case. The study also found a direct linear relationship between energy yield and albedo levels, although changes in albedo had a minimal effect on the energy yield of monofacial PV systems.
In Qatar, Baloch et al. [25] investigated the degradation of bifacial PV modules under desert climatic conditions. Bifacial modules showed an 8.6% gain in energy yield and remained cost-effective if the additional investment did not exceed 10% of monofacial costs. The study found that vertical bifacial PV modules in an E-W orientation had comparable performance to tilted N-S modules at 22°, with annual energy yields of 390.2 kWh/m2 and 417.5 kWh/m2, respectively. Additionally, Abdallah et al. [22] conducted a comparative study on the performance of monofacial and bifacial modules installed at a 22° tilt angle. The results indicated that bifacial modules achieved a 15% higher energy yield than monofacial modules, largely due to the contribution of the rear side and an albedo measurement of 0.43. Additionally, bifacial modules exhibited lower sensitivity to soiling, which reduced the frequency and cost of cleaning operations. Abotaleb and Abdallah [36] studied the performance of bifacial silicon heterojunction modules, comparing standard south-facing tilt (22°) and vertical east-west (90°) configurations. They found that the 22° tilted bifacial module showed a 14% higher energy yield compared to the vertical configuration. Finally, Figgis and Abdallah [37] investigated the performance of 26 PV systems over 1 year, to assess how well their nameplate power temperature coefficients (PTC) predicted energy yield in a desert climate. Contrary to expectations, the authors found no significant correlation between the specific yield of the PV systems and their PTC values.
Other studies in the Arabian Peninsula include Ba Samer et al. [24] who conducted a simulation study using PVsyst in Riyadh, Saudi Arabia, evaluating a 3.37 MWac PV system using bifacial modules. The study simulated two scenarios: a fixed mounting system installed at a tilt angle of 25° with an albedo of 0.45, and a 2-axis tracking system. For the fixed system, the annual energy yield, performance ratio, and specific production were 6684 MWh/year, 82%, and 1984 kWh/kWp, while for the 2-axis configuration the system achieved 8897 MWh/year, 81.47%, and 2640 kWh/kWp. The 2-axis tracking system showed a 25% energy gain, demonstrating the potential of bifacial modules to reduce the levelized cost of energy (LCOE) in desert environments. Al Siyabi et al. [38] investigated the effects of soiling and tilt angle on the performance of a 2 MWp car park PV plant in Oman. The study revealed that soiling significantly diminished power generation, with output dropping from 1460 kW for a clean system to 904 kW after five weeks without cleaning, amounting to a 38.1% reduction in power output due to soiling. Furthermore, the research indicated that a soiling rate of 7.5% and 12.5% could decrease monthly electricity generation by 5.6% and 10.8%, respectively.
In the Sahara environment, Younes et al. [13] examined the impact of desert stressors on the performance of standard PV panels in Algeria’s desert climate. The research identified high solar irradiation and elevated ambient temperatures as the primary factors accelerating the degradation of PV panels. These conditions contributed to the discoloration and damage of the ethyl vinyl acetate (EVA) encapsulant material. Their findings from the literature indicate that the actual operational lifespan of crystalline silicon PV panels in such an environment is significantly shorter than the generally optimistic 20–25 years, often limited to just 5–10 years, with power degradation rates reaching up to 2.7%/year.
Comparative studies of bifacial tracking systems, such as the one conducted by Patel et al. [39], analyzed the performance of bifacial PV solar farms utilizing 1-axis tracking systems worldwide. The authors discovered that these tracking systems could produce up to 45% more energy compared to fixed-tilt bifacial systems, particularly in regions near the equator. The energy gain varied with latitude and land type, showing greater benefits in regions with more direct sunlight. The study highlighted the importance of optimizing the pitch between rows to minimize the LCOE and suggested future research on the mechanical reliability of tracking systems and their integration with agro-photovoltaic applications. Praveenkumar et al. [40] assessed the techno-economic performance of a 20 MW solar PV power plant using fixed, 1-axis, and 2-axis tracking mechanisms across five South Indian locations. The study revealed that 2-axis tracking provided the highest annual energy output and capacity factor (CF), while the LCOE ranged between 3.25 to 4.25 ¢/kWh. The 2-axis tracking mechanism was found to be the most economically feasible option.
Considering this comprehensive review of the studies in the literature, while the great potential, viability, and sustainability of bifacial systems in several desert climatic environments has been highlighted, several critical gaps have been identified which have not been addressed yet:
  • Numerous deserts worldwide have not been studied in the context of bifacial PV systems, leaving significant geographical gaps in the research. Specifically, the lack of comparative studies focusing on fixed, 1-axis, and 2-axis bifacial PV systems in these under-researched deserts limits the comprehensive understanding of their performance.
  • Despite numerous studies conducted in various deserts, there remains a significant gap in research directly comparing the performance of fixed, 1-axis, and 2-axis bifacial PV systems under identical environmental conditions.
  • There is a deficiency in techno-economic studies specific to bifacial PV systems in desert climates, impeding the evaluation of their economic viability and performance under harsh conditions. Existing studies often focus on technical performance metrics without adequately addressing the economic implications, such as the LCOE, in a consistent and comparable manner.
  • Information in the literature is highly fragmented, with studies employing varying assumptions, methodologies, and performance metrics, making it challenging to draw meaningful comparisons. A consolidated study that standardizes the evaluation criteria and combines data from multiple deserts worldwide would provide more comprehensive and comparable insights.
This study addresses significant research gaps through a comprehensive techno-economic assessment of bifacial PV systems, comparing fixed, 1-axis, and 2-axis configurations across six different deserts worldwide. The objective of this research is to standardize evaluation criteria and integrate both technical performance metrics and economic implications, including the LCOE, by evaluating the techno-economic viability of such systems in desert climatic environments. Utilizing the SAM software (version 2023.12.17), the study provides a unified framework for understanding the feasibility, operation, and sustainability of bifacial PV systems in harsh desert climates, thus filling geographical and comparative gaps.

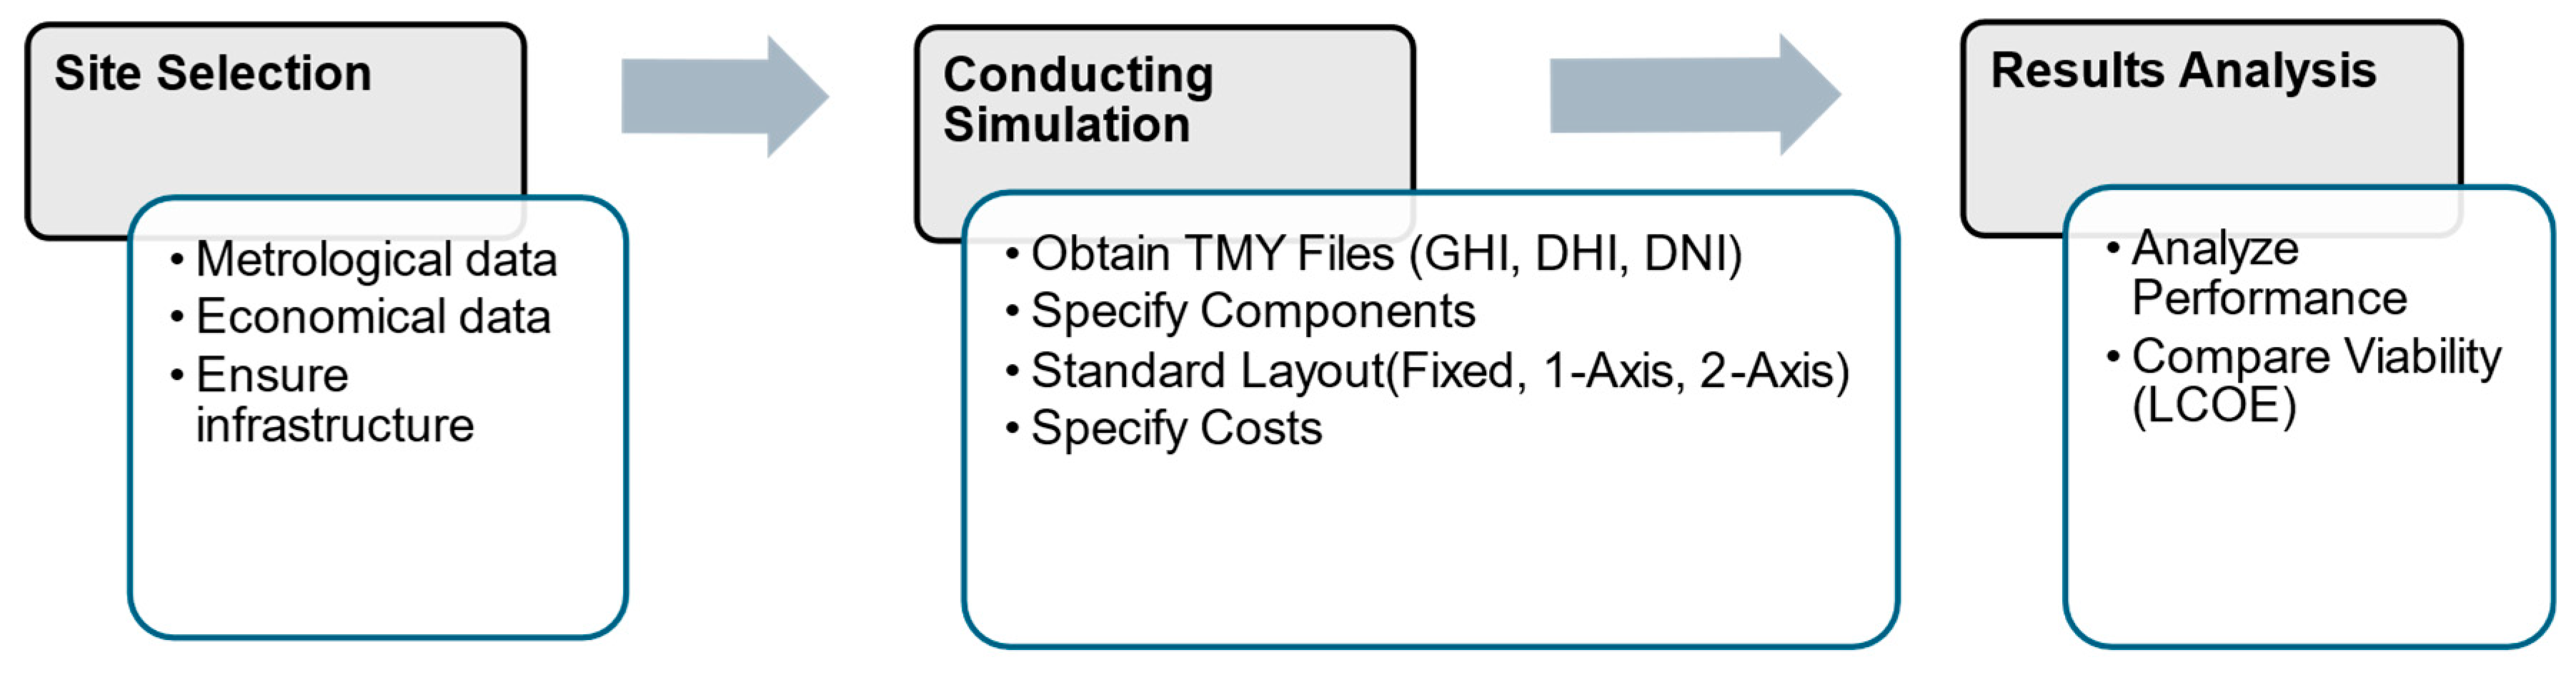
2. Materials and Methods

In this study, three models of 100 MWac utility-scale solar PV plants (fixed, 1-axis, and 2-axis tracking systems) were developed using the National Renewable Energy Laboratory (NREL) SAM software [41], version 2023.12.17. System costs were acquired from the latest global reports, while typical meteorological data for the simulation were obtained from the Photovoltaic Geographical Information System (PVGIS) database [42]. PVGIS is a free web application which provides free access to global databases of meteorological data which are based on satellite imaging and meteorological models covering various locations and timeframes. The simulation was carried out to analyze the techno-economic performance of the PV plants under the climatic conditions of six of the world’s main deserts. In the following sections, details about each step in this study are presented.

2.1. Site Selection

The Sahara, Arabian, Gobi, Atacama, Sturt Stony, and Mojave deserts are the set of large deserts selected for this study, each of which contains a representative location with an existing utility-scale solar PV plant. This ensures the presence of essential infrastructure, such as a well-developed electrical network and accessible roads which are crucial for practical implementations. Additionally, selecting locations with existing plants provides real-world performance data facilitating the validation of the simulation outcomes. These deserts were chosen based on their status as some of the largest globally, ensuring a comprehensive representation of diverse environmental conditions and solar energy potential. Geographically, the deserts span both the Northern and Southern Hemispheres. Thus, while many other desert areas exist, the focused inclusion of these six deserts minimizes the need for investigating additional areas that may yield redundant data for the purpose of this study.
The selected geographical locations, along with their latitude, longitude, elevation, daily average global horizontal irradiation (GHI), and average temperature, are presented in Table 1 and the specific sites are mapped in Figure 1.

2.2. Weather Conditions and Metrological Data

The main input for the SAM software is the weather file, which includes hourly meteorological data over a one-year span. SAM utilizes these data to project annual electricity generation from the system throughout the designated analysis period, including any predefined degradation rates. It is essential that the weather file accurately represents a “typical” year. To meet this requirement, a typical meteorological year (TMY) file for locations in this study has been obtained from PVGIS. PVGIS has been widely utilized in the literature, demonstrating its significant application across various fields [43,44,45,46,47,48,49,50]. PVGIS version 5.2 represents a substantial improvement from its predecessor, v5.1, showcasing significant enhancements in functionality and accuracy [51]. Similarly, the SAM software has been widely recognized in the literature across several applications [52,53,54,55,56,57,58,59,60,61].

2.3. Technical Parameters and System Design

In this section, the technical specifications of the PV system components, the simulation software selected, and the main system design parameters are presented. Various simulation programs are available for designing and analyzing PV systems, including PVsyst, TRNSYS, PV*SOL, and SAM. For this study, the NREL-SAM software, version 2023.12.17, was used.
To compare the PV plant performance under different climatic conditions, a standard PV plant layout with a capacity of 100 MWac and 130 MWp (DC ratio of 1.3) was designed. The PV plant design was based on real utility-scale project designs [62]. Both the PV panels and the inverter used in the design are already deployed in utility-scale PV projects in deserts. The PV panels used in this design are bifacial with a peak power of 665 W, an efficiency of 21.4%, and a bifaciality factor of 0.7 [63]. Inverters with a capacity of 250 kW each are used in this plant design [64]. Table 2 presents the main technical parameters used in the model.
The same PV plant designed in SAM was simulated with a fixed PV system and then with 1-axis and 2-axis tracking systems. For the fixed system, the surface azimuth of the panels was oriented south for deserts in the Northern Hemisphere and north for deserts in the Southern Hemisphere. The tilt angle was set to match the latitude of each specific location. From a data-driven perspective, study [65] demonstrated that optimal accuracy in predicting PV power output was achieved when the tilt angle was set equal to the latitude for a location in Morocco. For the 1-axis tracking system, there are basically two options: an E/W 1-axis tracker that follows the hourly movement of the Sun and a N/S 1-axis tracker that primarily tracks the Sun’s seasonal or monthly movement. The study of Patel et al. [39] shows that E/W 1-axis tracking provides better overall performance for locations close to the equator (latitudes between 50° S and 50° N), where all the selected deserts are located, and thus, this option was selected. For the 2-axis tracking system, the tracking system ensures that the solar beams are perpendicular to the panels.
This study does not explore energy management or storage technologies such as batteries, which are crucial for enhancing renewable energy integration and grid stability. Topics such as policy-based management and optimization of energy storage systems are extensively discussed in recent works [66,67], highlighting their significance in future research and practical applications.

2.4. Economic Parameters

The LCOE is used to compare the economic viability of the PV plants under different climatic conditions. The LCOE is widely used to compare the cost of electricity production from different technologies, or to compare the cost of electricity production using the same technology but in different locations. It is the present or current value of the project’s cost in relation to the electricity produced by the plant over its entire lifetime expressed in USD per kWh. Table 3 outlines the key parameters and inputs used to derive the LCOE, ensuring a comprehensive assessment of the economic viability of PV plants under various climatic conditions. This method allows for consistent and comparable analysis across different locations and technologies.
The LCOE approach leverages the FCR, essential for annualizing the total capital cost (TCC) over the project’s lifespan. The FCR is calculated as a combination of CRF and PFF. The relationship is expressed in Equation (1) as follows:
F C R = C R F × P F F
The LCOE calculation in SAM is simplified as shown in Equation (2):
L C O E = F C R × T C C + F O C A E P + V O C
where F O C is the fixed annual operating cost and A E P is the annual electricity production in kWh.
The utility-scale PV installed costs for the selected deserts in this study were obtained from reports by the IRENA and the NREL [68,69]. According to these reports, in 2022, the average total installed costs of utility-scale solar PV ranged from USD 640/kW in India to USD 1905/kW in Japan. The weighted average cost for utility-scale systems installed worldwide in 2022 was USD 876/kW. These costs vary by country due to differences in hardware costs, installation costs, and soft costs related to financing, permitting, and incentives. The capital costs of the fixed, 1-axis, and 2-axis utility-scale PV projects in the selected deserts are presented in Table 4. The fixed annual operating costs for the fixed, 1-axis, and 2-axis systems were USD 10/kW, USD 12/kW, and USD 15/kW, respectively.

2.5. Performance Indicators

The performance of fixed, 1-axis, and 2-axis photovoltaic systems is assessed using several key metrics: hourly production curves, specific yield, PR, and CF. Here, the specific yield is the annual energy production of each system divided by its capacity, measured in kWh/kWp. The PR is defined as the useful energy output of the system in kWh divided by the reference yield, which is numerically equal to the irradiance on the array’s plane measured in kWh/m2 times the system capacity in kWp. The formula for PR is presented in Equation (3) as follows [70]:
P R = N e t   A n n u a l   E n e r g y k W h y e a r S y s t e m   C a p a c i t y k W p × A r r a y   I r r a d i a n c e k W h m ² × 100
The CF is the ratio of the system’s energy output to the system’s output if it operated at its nameplate capacity for every hour of the year. The capacity factor is calculated using Equation (4) as follows [71]:
C F = N e t   A n n u a l   E n e r g y k W h y e a r S y s t e m   C a p a c i t y   ( k W ) × 8760 h y e a r × 100
Finally, this methodological procedure is summarized in Figure 2.

3. Results and Discussion

In this section, the techno-economic outcomes for the modeled 100 MW solar PV power plants in the six selected deserts are presented. The results discussed were obtained using the SAM software, based on the technical and financial input parameters described previously.

3.1. Hourly Production Curves

Figure 3, Figure 4, Figure 5, Figure 6, Figure 7 and Figure 8 present the hourly production profiles of the PV system for an average day in the six selected deserts. The daily profiles can vary widely across different months and seasons due to changes in the available solar radiation and the angle of incidence. However, the average daily production curves were used to provide a foundational understanding of the differences in annual energy production, which is the main parameter used for the techno-economic assessment.
The first figure from the left compares the hourly profiles of the fixed and 1-axis tracking systems, where the green area represents the additional energy produced by the 1-axis system compared to the fixed system, and the yellow area indicates times when the fixed system produces more energy than the 1-axis system. The middle figure compares the 2-axis and fixed systems in the same manner. Finally, the third figure on the right presents the power outputs of all three systems.
The comparison between the fixed and 1-axis tracking PV systems reveals that the 1-axis tracking system surpasses the fixed system, especially during early mornings and late afternoons when the sun is at low elevations in the east and west. During these periods, the 1-axis tracking system orients the panels toward the sun, resulting in increased energy production compared to the fixed system, which is oriented toward the equator. On the other hand, during solar noon, the fixed system’s tilt angle enhances its exposure to direct solar radiation, thereby producing more energy than the 1-axis tracking system with the horizontal surface at this period. This effect is more pronounced in locations farther from the equator, where low sun elevations are better captured by tilted surfaces, as observed in the Gobi Desert. Furthermore, the 2-axis tracking system, with its ability to track both solar azimuth and elevation, consistently outperforms both the fixed and 1-axis tracking systems throughout the day.
Figure 9 displays three subplots (Figure 9a–c), each illustrating the power production over a 24 h period for six selected deserts using three solar power systems: fixed, 1-axis tracking, and 2-axis tracking. The fixed system (Figure 9a) shows power production concentrated around midday, with a sharp increase and decrease. Variations in peak power production are observed among locations; for instance, the Atacama Desert exhibits higher peak values compared to others, while the Gobi Desert shows the lowest values, correlating with the global horizontal irradiation received by these regions. The 1-axis tracking system (Figure 9b) demonstrates broader curves, indicating more consistent power production throughout the day, particularly in the early morning and before sunset. However, for high-latitude locations such as the Gobi and Sturt Stony deserts, peak power during solar noon is lower than that of fixed systems with tilted angles oriented toward the equator. The 2-axis tracking system (Figure 9c) exhibits the highest and broadest peaks, indicating the highest energy generation, with less pronounced differences in power output between locations.

3.2. Annual Specific Yield

Figure 10 illustrates the annual specific yield (in kWh/kWp) for six selected desert locations utilizing three different solar power systems: fixed, 1-axis tracking, and 2-axis tracking. The fixed systems consistently yield the lowest annual energy across all locations. The specific yield for fixed systems in the six deserts ranges from 1911 kWh/kWp in the Gobi Desert to 2100 kWh/kWp in the Atacama Desert, with these values directly correlating to the solar radiation available in each location. The 1-axis tracking systems enhance energy yield by 9% in the high-latitude Gobi Desert and by 18–19% in the other deserts, with annual specific yields ranging from 2091 to 2497 kWh/kWp. Furthermore, the 2-axis tracking system demonstrates a further enhancement compared to the 1-axis tracking system, with improvements ranging from 5% to 11%. The annual specific yield for the 2-axis tracking systems varies from 2329 to 2677 kWh/kWp.

3.3. Performance Ratio (PR)

The PR of the fixed, 1-axis, and 2-axis tracking system under the different deserts ranged from 71% to 88%, respectively, and is presented in Figure 11. The results consistently show that fixed-tilt systems achieve the highest PR, followed by 1-axis systems, and 2-axis systems exhibit the lowest PR. Per Figure 10, 2-axis systems consistently yield the highest annual production and specific yields in all deserts studied. However, despite their improved energy-harvesting capabilities, 2-axis systems exhibit the lowest PR compared to fixed-tilt and 1-axis systems due to inverter clipping. This trade-off between specific yield and PR occurs when the energy produced by the PV array exceeds the capacity of the inverter, leading to lost energy and reduced PR. The lowest PR of 71% was achieved in 2-axis systems in the Atacama Desert, while the highest PR of 88% was achieved in both the fixed-tilt and 1-axis systems in the Gobi Desert.

3.4. Capacity Factor (CF)

The capacity factors of the systems in this study ranged from 21.8% for a fixed system in the Gobi Desert to 30.6% for a 2-axis system in the Mojave Desert. The capacity factors of all systems investigated in this study are presented in Figure 12.

3.5. Levelized Cost of Energy (LCOE)

Figure 13 presents the LCOE of the different tracking systems in the six deserts. A notable finding based on the graphical comparison shows that 1-axis tracking systems demonstrate the lowest LCOE compared to both fixed and 2-axis tracking systems in five out of the six selected deserts. The lowest LCOE in all deserts is found to be 2.45 ¢/kWh using 1-axis tracking systems in the Arabian Desert. This finding can largely be attributed to the increased energy production of the 1-axis tracking system compared to the fixed-tilt system, justifying its additional initial costs. The 2-axis tracking systems exhibited a lower LCOE than the fixed-tilt systems in three locations, indicating that the additional investment in the 2-axis tracking systems paid off due to enhanced energy production in these areas. However, compared to the 1-axis system, the 2-axis system did not show an advantage in any of the locations. Additionally, the LCOE is significantly influenced not only by hardware costs but also by installation costs and the various soft costs associated with financing, permitting, and incentives.
The highest LCOE in the Mojave Desert of 4.24 ¢/kWh for fixed-tilt systems shows a 73% increase in the LCOE compared to the lowest LCOE of 2.45 ¢/kWh. Both findings can be attributable to the lowest and highest capital costs in the Arabian and Mojave deserts, respectively.
Comparing these findings with conventional energy sources provides further context. According to projections by the IEA [72], the LCOE of coal-fired power plants in China is expected to increase from 6.5 to 9 ¢/kWh by 2030 compared to 2022, significantly higher than the LCOE values in China’s Gobi Desert of 3.16, 3.23, and 3.27 ¢/kWh for fixed-tilt, 1-axis, and 2-axis systems, respectively. Similarly, natural gas-fired power generation in the USA is projected to have an LCOE of 7 ¢/kWh by 2030. In contrast, the LCOE values of all tracking systems in the Mojave Desert show an LCOE of nearly 4 ¢/kWh. In addition to the substantial cost savings, the deployment of solar PV systems to replace conventional fossil fuel power generation in these deserts can help protect public health by reducing pollution and contribute to fighting climate change by cutting greenhouse gas emissions.

4. Discussion and Conclusions

In this work, SAM software was used to evaluate the techno-economic performance of 100 MW fixed, 1-axis, and 2-axis bifacial systems under the climatic conditions of six major deserts from around the world. This comprehensive assessment offers significant insights into the potential and challenges of deploying bifacial PV systems in harsh desert environments, providing a critical understanding of their performance, feasibility, and sustainability.
This study demonstrates the high potential of solar PV plants in desert regions around the world. The annual specific yield of fixed systems ranged from 1911 kWh/kWp to 2100 kWh/kWp. These values increased by 9–19% when a 1-axis tracking system was utilized, reaching up to 2497 kWh/kWp, and a further enhancement of 5–11% was achieved using a 2-axis system, reaching up to 2677 kWh/kWp. The average performance ratios for the six deserts using fixed, 1-axis, and 2-axis tracking systems were 85%, 82%, and 77%, respectively. And the average capacity factors increased from 23.3% for fixed systems to 29.5% for 2-axis systems.
The techno-economic analysis showed that the enhancement in energy production using 1-axis tracking systems compared to fixed systems always justifies the extra cost required. In contrast, 2-axis tracking systems consistently exhibited a higher LCOE compared to 1-axis tracking systems. This finding aligns with the current mainstream utility-scale projects around the world, which predominantly adopt 1-axis bifacial PV systems. The market status of PV projects in each of the studied deserts demonstrates that capital, installation, and soft costs play an important role in the attractiveness of the projects. Results showed that an LCOE of less than 4 ¢/kWh is achievable in all the studied deserts, with a minimum LCOE of 2.45 ¢/kWh achieved under the most favorable conditions.
Understanding sustainability aspects positively skews deserts as favorable target locations for future projects. The abundance of empty desert land, availability of solar radiation, lack of competing interests for the land (not suitable for urbanization or agriculture), and the consistency of their climatic conditions makes them the most sustainable locations for long-term energy production. As far as sustainability is concerned, each of the selected assessment cites already hosts a solar PV project which directly contributes to its respective national energy sustainability goals. The contribution is quantified by the increased energy capacity and the annual CO2 offset; the latter is further bolstered by efficiency-boosting technologies that are being utilized. Once a sizable portion of a location’s energy portfolio is renewably sourced, the decreased dependance on non-renewables further solidifies the sustainability of energy production and pricing.
This study presented a generalized approach for desert regions in the case of bifacial systems; however, considerations for country-specific regulations and economic parameters should be taken into consideration. Further related research is recommended to ensure that the high potential of utility-scale bifacial PV projects in desert regions are fully utilized. First, there should be an exploration of the infrastructure requirements for these projects in the deserts, such as the electrical network and access. This includes examining electricity transmission options to satisfy the electricity needs in populated areas. Second, research should explore the hybridization of solar PV with other renewable technologies such as concentrated solar power with thermal storage and wind power. This hybridization would enhance the dispatchability of the plants and thereby contribute significantly to the global transition toward a green, sustainable energy future.

Author Contributions

Conceptualization, O.A.; methodology, O.A., B.R., M.E.B.A. and M.A.-M.; software, O.A., M.E.B.A. and M.A.-M.; validation, O.A., B.R., S.A.-D., M.E.B.A. and M.A.-M.; formal analysis, O.A., M.E.B.A. and M.A.-M.; investigation, O.A., B.R. and M.E.B.A.; resources, O.A. and S.A.-D.; data curation, O.A. and M.E.B.A.; writing—original draft preparation, O.A., B.R., M.E.B.A. and M.A.-M.; writing—review and editing, O.A., B.R., S.A.-D., M.E.B.A. and M.A.-M.; visualization, O.A., M.E.B.A. and M.A.-M.; supervision, O.A. and S.A.-D.; project administration, O.A. All authors have read and agreed to the published version of the manuscript.

Funding

This research received no external funding.

Institutional Review Board Statement

Not applicable.

Informed Consent Statement

Not applicable.

Data Availability Statement

Data are contained within the article. TMY weather data were extracted from PVGIS which is publicly available using “https://re.jrc.ec.europa.eu/pvg_tools/en/ (accessed on 20 July 2024)”.

Acknowledgments

This research was conducted during a sabbatical leave granted to Osama Ayadi from The University of Jordan for the academic year 2021/2022.

Conflicts of Interest

The authors declare no conflicts of interest.

Abbreviations

The following abbreviations are used in this manuscript.
AEPAnnual Electricity Production
CFCapacity Factor
CFFConstruction Financing Factor
CRFCapital Recovery Factor
EVAEthyl Vinyl Acetate
FCRFixed Charge Rate
GHIGlobal Horizontal Irradiation
IEAInternational Energy Agency
IRENAInternational Renewable Energy Agency
LCOELevelized Cost of Energy
NRELNational Renewable Energy Laboratory
PFFProject Financing Factor
PRPerformance Ratio
PTCPower Temperature Coefficients
PVPhotovoltaic
PVGISPhotovoltaic Geographical Information System
SAMSystem Advisor Model
TCCTotal Capital Cost
TMYTypical Meteorological Year
TMBMTilted Mounted Bifacial Modules
VMBMVertically Mounted Bifacial Modules
VOCVariable Operating Charge
YAEnergy Yield

References

  1. IEA Electricity. 2024. Available online: https://www.iea.org/reports/electricity-2024/executive-summary (accessed on 29 June 2024).
  2. IEA Buildings. Available online: https://www.iea.org/energy-system/buildings (accessed on 29 June 2024).
  3. IEA Space Cooling. Available online: https://www.iea.org/energy-system/buildings/space-cooling (accessed on 29 June 2024).
  4. IEA Solar PV. Available online: https://www.iea.org/energy-system/renewables/solar-pv#overview (accessed on 29 June 2024).
  5. IRENA World Energy Transitions Outlook. 2023. Available online: https://www.irena.org/Digital-Report/World-Energy-Transitions-Outlook-2023 (accessed on 29 June 2024).
  6. IRENA Global Energy Transformation: A Roadmap to 2050. Available online: https://www.irena.org/-/media/Files/IRENA/Agency/Publication/2018/Apr/IRENA_Report_GET_2018.pdf (accessed on 29 June 2024).
  7. Ribeiro, F.C.P.; Santos, J.L.; da S. Chaar, J.; de Souza, L.K.C. Introduction to Renewable Energies. In Encyclopedia of Renewable Energy, Sustainability and the Environment; Elsevier: Amsterdam, The Netherlands, 2024. [Google Scholar]
  8. Khan, K.; Khurshid, A.; Cifuentes-Faura, J.; Xianjun, D. Does Renewable Energy Development Enhance Energy Security? Util Policy 2024, 87, 101725. [Google Scholar] [CrossRef]
  9. Soto, E.A.; Wollega, E.; Ortega, A.V.; Hernandez-Guzman, A.; Bosman, L. Reduction in Emissions by Massive Solar Plant Integration in the US Power Grid. Energies 2024, 17, 1611. [Google Scholar] [CrossRef]
  10. Kuşkaya, S. Residential Solar Energy Consumption and Greenhouse Gas Nexus: Evidence from Morlet Wavelet Transforms. Renew. Energy 2022, 192, 793–804. [Google Scholar] [CrossRef]
  11. Hassan, Q.; Viktor, P.; Al-Musawi, T.J.; Ali, B.M.; Algburi, S.; Alzoubi, H.M.; Al-Jiboory, A.K.; Sameen, A.Z.; Salman, H.M.; Jaszczur, M. The Renewable Energy Role in the Global Energy Transformations. Renew. Energy Focus 2024, 48, 100545. [Google Scholar] [CrossRef]
  12. Durant, S.M.; Pettorelli, N.; Bashir, S.; Woodroffe, R.; Wacher, T.; De Ornellas, P.; Ransom, C.; Abáigar, T.; Abdelgadir, M.; El Alqamy, H.; et al. Forgotten Biodiversity in Desert Ecosystems. Science 2012, 336, 1379–1380. [Google Scholar] [CrossRef]
  13. Younes, M.; Kahoul, N.; Labed, D.; Neçaibia, A.; Cheghib, H.; Affari, B.C.; Kherici, Z. Understanding the Impact of Desert Stressors Factors on Standard PV Panel Performance: Case Study of Algeria’s Desert. Sci. Afr. 2023, 21, e01771. [Google Scholar] [CrossRef]
  14. Gelsor, N.; Gelsor, N.; Wangmo, T.; Chen, Y.-C.; Frette, Ø.; Stamnes, J.J.; Hamre, B. Solar Energy on the Tibetan Plateau: Atmospheric Influences. Sol. Energy 2018, 173, 984–992. [Google Scholar] [CrossRef]
  15. Lu, Z.; Zhang, Q.; Miller, P.A.; Zhang, Q.; Berntell, E.; Smith, B. Impacts of Large-Scale Sahara Solar Farms on Global Climate and Vegetation Cover. Geophys. Res. Lett. 2021, 48, e2020GL090789. [Google Scholar] [CrossRef]
  16. Chang, R.; Yan, Y.; Wu, J.; Wang, Y.; Gao, X. Projected PV Plants in China’s Gobi Deserts Would Result in Lower Evaporation and Wind. Sol. Energy 2023, 256, 140–150. [Google Scholar] [CrossRef]
  17. Xia, Z.; Li, Y.; Zhang, W.; Chen, R.; Guo, S.; Zhang, P.; Du, P. Solar Photovoltaic Program Helps Turn Deserts Green in China: Evidence from Satellite Monitoring. J. Environ. Manag. 2022, 324, 116338. [Google Scholar] [CrossRef] [PubMed]
  18. Vo, T.T.E.; Je, S.-M.; Jung, S.-H.; Choi, J.; Huh, J.-H.; Ko, H.-J. Review of Photovoltaic Power and Aquaculture in Desert. Energies 2022, 15, 3288. [Google Scholar] [CrossRef]
  19. Abdelsalam, E.; Alnawafah, H.; Almomani, F.; Mousa, A.; Qandil, H. Enhancing the Efficiency of Bi-Facial Photovoltaic Panels: An Integration Approach. Sustainability 2023, 15, 14786. [Google Scholar] [CrossRef]
  20. Park, H.; Chang, S.; Park, S.; Kim, W.K. Outdoor Performance Test of Bifacial N-Type Silicon Photovoltaic Modules. Sustainability 2019, 11, 6234. [Google Scholar] [CrossRef]
  21. Ayadi, O.; Jamra, M.; Jaber, A.; Ahmad, L.; Alnaqep, M. An Experimental Comparison of Bifacial and Monofacial PV Modules. In Proceedings of the 2021 12th International Renewable Engineering Conference (IREC), Amman, Jordan, 14–15 April 2021; pp. 1–8. [Google Scholar]
  22. Abdallah, A.A.; Kivambe, M.; Aïssa, B.; Figgis, B.W. Performance of Monofacial and Bifacial Silicon Heterojunction Modules under Desert Conditions and the Impact of PV Soiling. Sustainability 2023, 15, 8436. [Google Scholar] [CrossRef]
  23. Ganesan, K.; Winston, D.P.; Nesamalar, J.J.D.; Pravin, M. Output Power Enhancement of a Bifacial Solar Photovoltaic with Upside down Installation during Module Defects. Appl. Energy 2024, 353, 122070. [Google Scholar] [CrossRef]
  24. Samer, R.A.B.; Ismail, B.B.; Abdullah, A.Z.; Ali, I.M. Simulation Analysis of a 3.37 MW PV System Using Bifacial Modules in Desert Environment. J. Phys. Conf. Ser. 2021, 1878, 12026. [Google Scholar] [CrossRef]
  25. Baloch, A.A.B.; Hammat, S.; Figgis, B.; Alharbi, F.H.; Tabet, N. In-Field Characterization of Key Performance Parameters for Bifacial Photovoltaic Installation in a Desert Climate. Renew. Energy 2020, 159, 50–63. [Google Scholar] [CrossRef]
  26. Apostoleris, H.; Sgouridis, S.; Stefancich, M.; Chiesa, M. Evaluating the Factors That Led to Low-Priced Solar Electricity Projects in the Middle East. Nat. Energy 2018, 3, 1109–1114. [Google Scholar] [CrossRef]
  27. Apostoleris, H.; Ghaferi, A.A.; Chiesa, M. What Is Going on with Middle Eastern Solar Prices, and What Does It Mean for the Rest of Us? Prog. Photovolt. Res. Appl. 2021, 29, 638–648. [Google Scholar] [CrossRef]
  28. Mohamed, A.S.A.; Maghrabie, H.M. Techno-Economic Feasibility Analysis of Benban Solar Park. Alex. Eng. J. 2022, 61, 12593–12607. [Google Scholar] [CrossRef]
  29. New England Solar Project. Available online: https://acenrenewables.com.au/project/new-england-solar/ (accessed on 20 July 2024).
  30. Guanchoi Solar Plant. Available online: https://www.enel.cl/en/meet-enel/our-power-plants/guanchoi-photovoltaic-plant.html (accessed on 20 July 2024).
  31. Ayala, P.; Munoz, C.; Osorio, N.; Hernandez, C.; Zurita, F.; Gutierrez, V.; Ramirez, G.; Mancilla, F.; Valdivia, P.; Cuevas, F.; et al. Bifacial Technology Performance Compared with Three Commercial Monofacial PV Technologies under Outdoor High Irradiance Conditions at the Atacama Desert. In Proceedings of the 2018 IEEE 7th World Conference on Photovoltaic Energy Conversion (WCPEC) (A Joint Conference of 45th IEEE PVSC, 28th PVSEC & 34th EU PVSEC), Waikoloa, HI, USA, 10–15 June 2018; pp. 672–675. [Google Scholar]
  32. Cabrera, E.; Araya, F.; Schneider, A.; Marzo, A.; Roescu, R.; Rabanal, J.; Ferrada, P.; Ayala, P.; Berrian, D.; Libal, J.; et al. AtaMoS TeC Project: Soiling Impact on Bifacial Modules with Different Mounting Geometry in the Atacama Desert in Chile. In Proceedings of the 2018 IEEE 7th World Conference on Photovoltaic Energy Conversion (WCPEC) (A Joint Conference of 45th IEEE PVSC, 28th PVSEC & 34th EU PVSEC), Waikoloa, HI, USA, 10–15 June 2018; pp. 3653–3659. [Google Scholar]
  33. Cordero, R.R.; Damiani, A.; Laroze, D.; MacDonell, S.; Jorquera, J.; Sepúlveda, E.; Feron, S.; Llanillo, P.; Labbe, F.; Carrasco, J.; et al. Effects of Soiling on Photovoltaic (PV) Modules in the Atacama Desert. Sci. Rep. 2018, 8, 13943. [Google Scholar] [CrossRef] [PubMed]
  34. Olivares, D.; Ferrada, P.; Bijman, J.; Rodríguez, S.; Trigo-González, M.; Marzo, A.; Rabanal-Arabach, J.; Alonso-Montesinos, J.; Batlles, F.J.; Fuentealba, E. Determination of the Soiling Impact on Photovoltaic Modules at the Coastal Area of the Atacama Desert. Energies 2020, 13, 3819. [Google Scholar] [CrossRef]
  35. Haider, U.; Qureshi, O.A.; Shahzad, A.A.; Baloch, A.A.B.; Rodriguez-Ubinas, E. Assessment of PV Performance-Enhancing Technologies in Desert Climate Conditions of Dubai. In Proceedings of the 2023 Middle East and North Africa Solar Conference (MENA-SC), Dubai, United Arab Emirates, 15–18 November 2023; pp. 1–4. [Google Scholar]
  36. Abotaleb, A.; Abdallah, A. Performance of Bifacial-Silicon Heterojunction Modules under Desert Environment. Renew. Energy 2018, 127, 94–101. [Google Scholar] [CrossRef]
  37. Figgis, B.; Abdallah, A. Investigation of PV Yield Differences in a Desert Climate. Sol. Energy 2019, 194, 136–140. [Google Scholar] [CrossRef]
  38. Al Siyabi, I.; Al Mayasi, A.; Al Shukaili, A.; Khanna, S. Effect of Soiling on Solar Photovoltaic Performance under Desert Climatic Conditions. Energies 2021, 14, 659. [Google Scholar] [CrossRef]
  39. Patel, M.T.; Ahmed, M.S.; Imran, H.; Butt, N.Z.; Khan, M.R.; Alam, M.A. Global Analysis of Next-Generation Utility-Scale PV: Tracking Bifacial Solar Farms. Appl. Energy 2021, 290, 116478. [Google Scholar] [CrossRef]
  40. Praveenkumar, S.; Gulakhmadov, A.; Kumar, A.; Safaraliev, M.; Chen, X. Comparative Analysis for a Solar Tracking Mechanism of Solar PV in Five Different Climatic Locations in South Indian States: A Techno-Economic Feasibility. Sustainability 2022, 14, 11880. [Google Scholar] [CrossRef]
  41. NREL System Advisor Model. Available online: https://sam.nrel.gov/ (accessed on 29 June 2024).
  42. Photovoltaic Geographical Information System (PVGIS). Available online: https://re.jrc.ec.europa.eu/pvg_tools/en/ (accessed on 29 June 2024).
  43. Muhammed, E.; El-Shazly, A.; Morsy, S. Building Rooftop Extraction Using Machine Learning Algorithms for Solar Photovoltaic Potential Estimation. Sustainability 2023, 15, 11004. [Google Scholar] [CrossRef]
  44. Djordjević, L.; Pekez, J.; Novaković, B.; Bakator, M.; Djurdjev, M.; Ćoćkalo, D.; Jovanović, S. Increasing Energy Efficiency of Buildings in Serbia—A Case of an Urban Neighborhood. Sustainability 2023, 15, 6300. [Google Scholar] [CrossRef]
  45. Gaman, F.; Iacoboaea, C.; Aldea, M.; Luca, O.; Stănescu, A.A.; Boteanu, C.M. Energy Transition in Marginalized Urban Areas: The Case of Romania. Sustainability 2022, 14, 6855. [Google Scholar] [CrossRef]
  46. Usta, Y.; Carioni, G.; Mutani, G. Modeling and Mapping Solar Energy Production with Photovoltaic Panels on Politecnico Di Torino University Campus. Energy Effic. 2024, 17, 53. [Google Scholar] [CrossRef]
  47. Tahir, M.F.; Tzes, A.; Yousaf, M.Z. Enhancing PV Power Forecasting with Deep Learning and Optimizing Solar PV Project Performance with Economic Viability: A Multi-Case Analysis of 10 MW Masdar Project in UAE. Energy Convers. Manag. 2024, 311, 118549. [Google Scholar] [CrossRef]
  48. Georgiou, L.; Afxentiou, N.; Fokaides, P.A. Numerical Investigation of a Novel Controlled-Temperature Double-Skin Façade (DSF) Building Element. Energies 2023, 16, 1836. [Google Scholar] [CrossRef]
  49. Ashetehe, A.A.; Gessesse, B.B.; Shewarega, F. A Generalized Approach for the Determination of Optimum Tilt Angle for Solar Photovoltaic Modules with Selected Locations in Ethiopia as Illustration Examples. Sci. Afr. 2022, 18, e01433. [Google Scholar] [CrossRef]
  50. Rinchi, B.; Ayadi, O.; Al-Dahidi, S.; Dababseh, R. A Universal Tool for Estimating Monthly Solar Radiation on Tilted Surfaces from Horizontal Measurements: A Machine Learning Approach. Energy Convers. Manag. 2024, 314, 118703. [Google Scholar] [CrossRef]
  51. Kulesza, K.; Martinez, A.; Taylor, N. Assessment of Typical Meteorological Year Data in Photovoltaic Geographical Information System 5.2, Based on Reanalysis and Ground Station Data from 147 European Weather Stations. Atmosphere 2023, 14, 1803. [Google Scholar] [CrossRef]
  52. Díaz, A.J.; Pinto, C.; Neira, T.; Sarmiento-Laurel, C.; Cáceres-González, R. An Exergoeconomic Exploration of Solar-Geothermal Integration. Energy Convers. Manag. 2024, 314, 118673. [Google Scholar] [CrossRef]
  53. Batgi, S.U.; Dincer, I. Design and Analysis of a Floating Photovoltaic Based Integrated Energy System with Ammonia Production. Appl. Therm. Eng. 2024, 252, 123676. [Google Scholar] [CrossRef]
  54. Agyekum, E.B.; Khan, T.; Giri, N.C. Evaluating the Technical, Economic, and Environmental Performance of Solar Water Heating System for Residential Applications–Comparison of Two Different Working Fluids (Water and Glycol). Sustainability 2023, 15, 14555. [Google Scholar] [CrossRef]
  55. Ramírez, A.T.O.; Tovar, M.R.; Silva-Marrufo, O. Rice Husk Reuse as a Sustainable Energy Alternative in Tolima, Colombia. Sci. Rep. 2024, 14, 10391. [Google Scholar] [CrossRef]
  56. Esparza, I.; Olábarri Candela, Á.; Huang, L.; Yang, Y.; Budiono, C.; Riyadi, S.; Hetharia, W.; Hantoro, R.; Setyawan, D.; Utama, I.K.A.P.; et al. Floating PV Systems as an Alternative Power Source: Case Study on Three Representative Islands of Indonesia. Sustainability 2024, 16, 1345. [Google Scholar] [CrossRef]
  57. Gamil, A.; Li, P.; Khammash, A.L.; Ali, B. Comparative Techno-Economic and Environmental Analysis of a Relocatable Solar Power Tower for Low to Medium Temperature Industrial Process Heat Supply. Energy 2024, 304, 132085. [Google Scholar] [CrossRef]
  58. Rami, Y.; Allouhi, A. A Comprehensive Multi-Criteria Assessment of Solar-Driven Refrigeration Systems for Fish Preservation in Africa Based on Energy, Economic, Environmental and Social Dimensions. Energy Convers. Manag. 2024, 306, 118183. [Google Scholar] [CrossRef]
  59. Rigby, A.; Baker, U.; Lindley, B.; Wagner, M. Generation and Validation of Comprehensive Synthetic Weather Histories Using Auto-Regressive Moving-Average Models. Renew. Energy 2024, 224, 120157. [Google Scholar] [CrossRef]
  60. Sadiq, M.; Kokchang, P.; Kittipongvises, S. Comparative Techno-Economic Evaluation of a Standalone Solar Power System for Scaled Implementation in Off-Grid Areas. Energies 2023, 16, 6262. [Google Scholar] [CrossRef]
  61. Battisti, F.G.; Klein, C.F.; Escobar, R.A.; Cardemil, J.M. Exergy Analysis and Off-Design Modeling of a Solar-Driven Supercritical CO2 Recompression Brayton Cycle. Energies 2023, 16, 4755. [Google Scholar] [CrossRef]
  62. Al Dhafrah Solar Power Project. Available online: https://www.adpv2.ae/ (accessed on 29 June 2024).
  63. Trina Solar TSM-DEG21C.20 Modules. Available online: https://static.trinasolar.com/sites/default/files/DT_M_0013_B%20Datasheet_Vertex_DEG21C.20_EN_2022_A_web.pdf (accessed on 20 July 2024).
  64. Sungrow SG250HX Inverter. Available online: https://en.sungrowpower.com/upload/file/20210108/DS_20201121_SG250HX%20Datasheet_V1.5.4_EN.pdf.pdf (accessed on 20 July 2024).
  65. Riad, S.; Bekkioui, N.; Simo-Tagne, M.; Macmanus Chinenye, N.; Lamrani, B.; Ez-Zahraouy, H. Application of Artificial Neuronal Networks for the Prediction of Monthly Photovoltaic Power Using Tilt Angle as Input in Rabat City, Morocco. Int. J. Ambient. Energy 2024, 45, 2365809. [Google Scholar] [CrossRef]
  66. Ma, Y.; Hu, Z.; Song, Y. Hour-Ahead Optimization Strategy for Shared Energy Storage of Renewable Energy Power Stations to Provide Frequency Regulation Service. IEEE Trans. Sustain. Energy 2022, 13, 2331–2342. [Google Scholar] [CrossRef]
  67. Yang, L.; Li, X.; Sun, M.; Sun, C. Hybrid Policy-Based Reinforcement Learning of Adaptive Energy Management for the Energy Transmission-Constrained Island Group. IEEE Trans. Industr. Inform. 2023, 19, 10751–10762. [Google Scholar] [CrossRef]
  68. Feldman, D.; Dummit, K.; Zuboy, J.; Smith, B.; Stright, D.; Heine, M.; Margolis, R. Fall 2023 Solar Industry Update. Available online: https://www.nrel.gov/docs/fy24osti/88026.pdf (accessed on 29 June 2024).
  69. IRENA Renewable Power Generation Costs in 2022. Available online: https://www.irena.org/-/media/Files/IRENA/Agency/Publication/2023/Aug/IRENA_Renewable_power_generation_costs_in_2022.pdf (accessed on 29 June 2024).
  70. PVsyst Normalized Performance Index. Available online: https://www.pvsyst.com/help/performance_index.htm (accessed on 29 June 2024).
  71. Iñigo-Labairu, J.; Dersch, J.; Hirsch, T.; Giuliano, S.; Loevenich, M.; Córdoba, D. Techno-Economic Evaluation of CSP–PV Hybrid Plants with Heat Pump in a Temperature Booster Configuration. Energies 2024, 17, 2634. [Google Scholar] [CrossRef]
  72. IEA-Coal and Natural Gas LCOE. Available online: https://www.iea.org/data-and-statistics/charts/lcoe-and-value-adjusted-lcoe-for-solar-pv-plus-battery-storage-coal-and-natural-gas-in-selected-regions-in-the-stated-policies-scenario-2022-2030 (accessed on 20 July 2024).
Figure 1. Map of the selected locations around the world.
Sustainability 16 06982 g001
Figure 2. Research methodology.
Sustainability 16 06982 g002
Figure 3. Sahara Desert results: (a) hourly production of the fixed and 1-axis systems; (b) hourly production of the fixed and 2-axis systems; (c) hourly production of the three systems.
Sustainability 16 06982 g003
Figure 4. Arabian Desert results: (a) hourly production of the fixed and 1-axis systems; (b) hourly production of the fixed and 2-axis systems; (c) hourly production of the three systems.
Sustainability 16 06982 g004
Figure 5. Gobi Desert results: (a) hourly production of the fixed and 1-axis systems; (b) hourly production of the fixed and 2-axis systems; (c) hourly production of the three systems.
Sustainability 16 06982 g005
Figure 6. Atacama Desert results: (a) hourly production of the fixed and 1-axis systems; (b) hourly production of the fixed and 2-axis systems; (c) hourly production of the three systems.
Sustainability 16 06982 g006
Figure 7. Sturt Stony Desert results: (a) hourly production of the fixed and 1-axis systems; (b) hourly production of the fixed and 2-axis systems; (c) hourly production of the three systems.
Sustainability 16 06982 g007
Figure 8. Mojave Desert results: (a) hourly production of the fixed and 1-axis systems; (b) hourly production of the fixed and 2-axis systems; (c) hourly production of the three systems.
Sustainability 16 06982 g008
Figure 9. Direct comparison of daily power production: (a) Fixed-tilt systems; (b) 1-axis tracking systems; (c) 2-axis tracking systems.
Sustainability 16 06982 g009
Figure 10. The annual specific yield of the fixed, 1-axis, and 2-axis system under the six selected deserts.
Sustainability 16 06982 g010
Figure 11. The performance ratio of the fixed, 1-axis, and 2-axis system under the six selected deserts.
Sustainability 16 06982 g011
Figure 12. The capacity factor of the fixed, 1-axis, and 2-axis system under the six selected deserts.
Sustainability 16 06982 g012
Figure 13. The LCOE of the fixed, 1-axis, and 2-axis system under the six selected deserts.
Sustainability 16 06982 g013
Table 1. Selected locations in the deserts.
No.DesertLocationLatitude (°N)Longitude (°E)Elevation (m)GHI (kWh/m2/day)Average
Temperature (°C)
1SaharaOuarzazat31.018−6.83112246.1417.9
2ArabianAl Dafrah24.15154.53286.0927.9
3GobiXinjiang40.0894.4512354.9311.2
4AtacamaAntofagasta−27.879−70.2016196.7116.6
5Sturt StonyBroken Hill−31.98141.392815.6319.1
6MojaveBarstow35.015−117.326296.0118.7
Table 2. Main technical parameters used in the SAM model.
DescriptionCharacteristicsValue
PV ModulesPanel modelTrina Solar: TSM-DEG21C.20
Maximum power (Pmp)665 W
Maximum power voltage (Vmp)38.3 V
Maximum power current (Imp)17.39 A
Open circuit voltage (Voc)46.1 V
Short circuit current (Isc)18.50 A
Module efficiency ( η )21.40%
InverterInverter modelSungrow Power Supply Co., Ltd. (Hefei, China): SG250HX
Maximum AC power250 kW
Maximum DC voltage1500 V
Number of inverters441
System DesignModules per string in array27
Strings in parallel array7182
Modules in subarray193,914
String Voc at reference condition1244
String Vmp at reference condition1031
Table 3. Economic parameters used to calculate the LCOE.
ParameterValue
Analysis Period20 years
Inflation Rate2.5% per year
Internal Rate of Return (Nominal)13% per year
Project Term Debt60% of capital cost
Nominal Debt Interest Rate7% per year
Effective Tax Rate28%
Nominal Construction Interest Rate3.5% per year
Capital Recovery Factor (CRF)0.084
Project Financing Factor (PFF)1.075
Construction Financing Factor (CFF)1.012
Variable Operating Cost (VOC)USD 0.00/kWh
Fixed Charge Rate (FCR)0.0903
Table 4. The capital cost of the fixed, 1-axis, and 2-axis utility scale PV projects in the selected deserts.
No.DesertLocationCapital Cost
FixedFixed1-Axis2-Axis
USD/kWacUSD/kWpUSD/kWpUSD/kWp
1SaharaOuarzazat778598658724
2ArabianAl Dafrah578445489538
3GobiXinjiang715550605666
4AtacamaAntofagasta888683751827
5Sturt StonyBroken Hill923710781859
6MojaveBarstow11198619471042
Disclaimer/Publisher’s Note: The statements, opinions and data contained in all publications are solely those of the individual author(s) and contributor(s) and not of MDPI and/or the editor(s). MDPI and/or the editor(s) disclaim responsibility for any injury to people or property resulting from any ideas, methods, instructions or products referred to in the content.

