Article

Analysis of Surface Runoff Characteristics in Zhengzhou City under Extreme Rainfall Conditions

Institute of Geographical Sciences, Henan Academy of Sciences, Zhengzhou 450052, China
*
Author to whom correspondence should be addressed.
Sustainability 2024, 16(16), 6980; https://doi.org/10.3390/su16166980
Submission received: 14 June 2024 / Revised: 25 July 2024 / Accepted: 5 August 2024 / Published: 14 August 2024

Abstract

:
In recent years, global climate change has become more and more obvious, and extreme rainfall weather has occurred frequently, which has a serious impact on people’s life and property safety. In order to reduce the risk of urban flooding and contribute to the sustainable development of the urban economy, society, and environment, this study takes Zhengzhou City as the study area. The surface runoff during extreme rainfall events from 2005 to 2023 was simulated using the SCS-CN model, and the spatiotemporal patterns of surface runoff during extreme rainfall conditions and their influencing factors were investigated. The results showed that (1) the average annual extreme rainfall in the study area was 95.6 mm, and the average annual surface runoff was 76.5 mm, with cultivated land contributing the most to surface runoff, accounting for more than 50%. The annual average frequency of extreme rainfall in the study area ranged from 0 to 3 times. (2) During the extreme rainfall events in 2021 and 2023, the surface runoff of the main urban area was relatively great. Under the influence of impermeable surfaces, the surface runoff of the main urban area was greater than that of the surrounding area, even when the rainfall in the main urban area was less than that in the surrounding urban area. In addition, during these two extreme rainfall events, the surface runoff in the slight slope (<5°) area was the greatest; overall, the larger the slope was, the smaller the surface runoff. (3) Differences between rainfall and surface runoff (DRS) of the different administrative districts in the study area showed three trends from 2005 to 2020, with those of most areas showing a clear decreasing trend, which was affected mainly by the surface runoff potential of the land use type. Under the same rainfall conditions (110 mm), the surface runoff of urban land and construction land was 1.4–2.5 times that of various types of woodland and grassland. From 2005 to 2020, the area of urban land and other construction land increased by 104.13%, the coverage area of woodland and grassland decreased by 35.90%, and the surface runoff potential increased in most areas of the study area. To reduce the risk of urban waterlogging, most areas of Zhengzhou, especially the main urban area and slight slope areas, need to rationally regulate land use and increase the coverage ratio of woodland and grassland.

1. Introduction

In recent decades, global climate change has become more and more obvious [1,2,3], causing some changes in atmospheric circulation, which has a profound impact on water vapor cycle and rainfall pattern, resulting in the frequent occurrence of extreme weather [4,5,6]. In addition, with the further acceleration of the urbanization process [7,8,9], the expansion of impervious areas in cities and the reduction in the area of lakes, woodlands, and grasslands have led to an increase in surface runoff. Surface runoff is prone to form urban waterlogging during the rainstorm season. Urban waterlogging is not conducive to sustainable urban development, and not only does it damage urban buildings and facilities, resulting in traffic paralysis, some industries stopping work, and urban economic and social disorders, but a large amount of rubbish and waste is also washed into the water after urban waterlogging, which causes serious damage to the cities and their surrounding ecosystems and has a serious impact on the public health environment. Frequent urban waterlogging is a great threat to people’s lives and property safety [10,11]. Therefore, controlling surface runoff and mitigating flooding disasters through rational land use planning as well as flood control engineering measures is an important way to improve people’s living standards and an important aspect of ensuring sustainable urban development. In addition, early warning to accurately predict urban runoff and quantitatively evaluate the impact of urbanization on surface runoff is of great significance for urban planning and waterlogging.
Currently, there are many reports on extreme rainfall in different regions [12,13] and on urban hydrological models [14,15,16,17]. Among them, the SWMM model is mainly based on the capacity of urban drainage networks, surface water storage capacity, and surface runoff generated by rainfall [16,17]. The STORM model is a model that studies the relationship between rainfall and runoff, and the model is more refined and can be applied to a wider range of urban types. The Wallingford proceed model, which was developed by a British water conservancy institution, has been improved to narrow the scope of the study and become a model dedicated to the study of sewage systems and rainwater–sewage confluence [15]. However, for many urban hydrological models, insufficient consideration of the influencing factors, difficulty in obtaining parameters, and a lack of sufficient data accuracy negatively impact their results [18]. The Soil Conservation Service Curve Number (SCS-CN) hydrological model comprehensively considers the underlying surface factors and meteorological factors of the watershed; reflects the effects of different soil types and different land use types on runoff formation; and uses GIS and RS technology to rapidly acquire necessary the parameters. Moreover, the model structure is simple. The required parameters are easy to obtain, the practicability is better than other models in watersheds with no data or with a lack of data, and the simulation accuracy is higher; thus, this method is widely used [19,20]. In this study, we used the SCS-CN hydrological model to simulate surface runoff in the study area.
In recent years, extreme rainfall and waterlogging have occurred frequently in Henan Province. In particular, during 17–23 July 2021, Henan Province experienced torrential rainstorms, which caused severe urban waterlogging, river floods, flash floods and landslides, and heavy casualties and property losses. Among them, 380 people died or were missing in Zhengzhou. The direct economic loss was CNY 40.9 billion, accounting for 95.5% and 34.1%, respectively, of the province’s total. Zhengzhou, as the capital of Henan Province, is now a new first-tier city with a high degree of urbanization and a concentrated population. However, due to the concentrated rainfall in the region, the low standard of the urban pipeline network, the small number of drainage canals in the city, and the limited level of sponge city construction, coupled with a high hardening rate of the ground surface, waterlogging often occurs in the region in the summer months of each year, especially in July, when there are extreme rains, which brings major potential risks to the daily life and safety of people’s lives and property in the region. Therefore, in this study, Zhengzhou was used as the study area, and the SCS-CN hydrological model was used to simulate the surface runoff in Zhengzhou City under extreme rainfall conditions of different intensities to investigate the effects of land use change and extreme rainfall on surface runoff. This study is expected to provide data support and a reference for optimizing land use in Zhengzhou, thus enhancing its ability to cope with extreme rainfall, improving the overall level of urban disaster prevention and mitigation, strengthening the integrated management of early warning and response, and promoting the healthy and sustainable development of the city.

2. Regional Overview and Research Methods

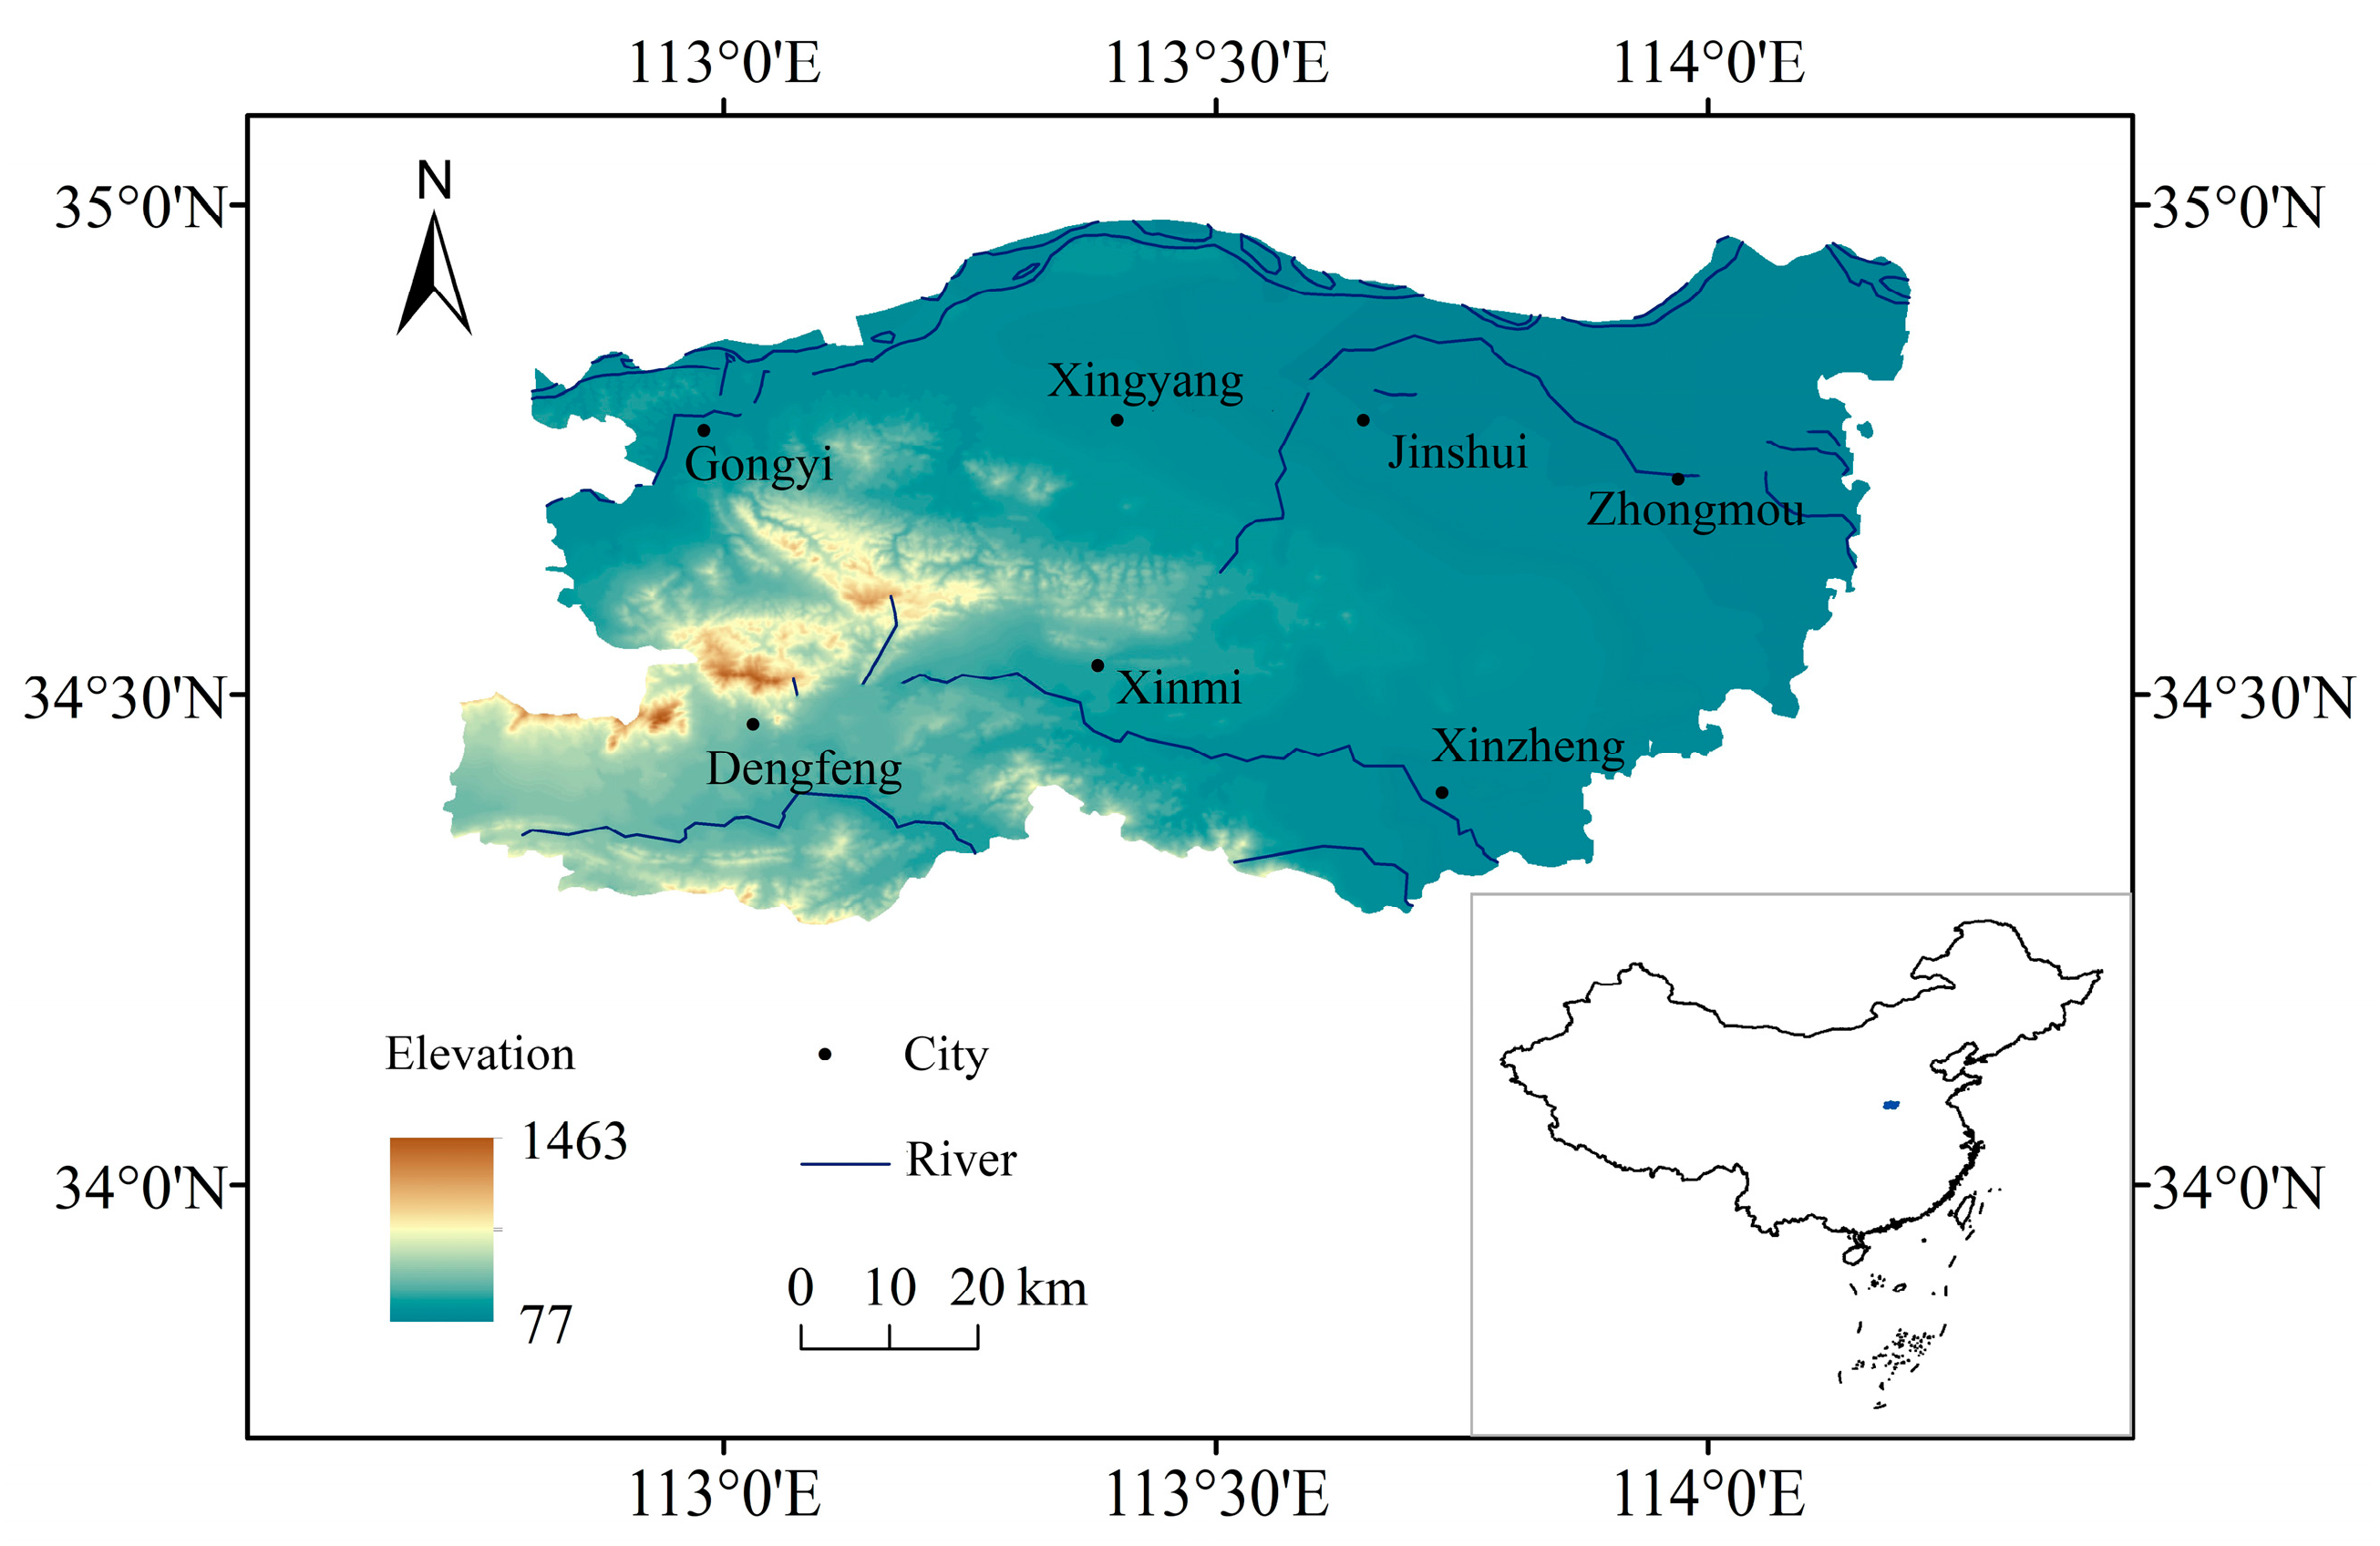
2.1. Regional Overview

Zhengzhou City is bordered by the Yellow River in the north, the Songshan Mountain in the west, and the vast Huanghuai Plain in the southeast. Zhengzhou belongs to the warm temperate–north subtropical transitional continental monsoon climate, and the main features are droughts in spring with less rain, hot and rainy summers, sunny and long-sunshine autumns, and cold winters with less rain. The average annual temperature in Zhengzhou is 14.8 °C, and the average annual rainfall is 586.1 mm. The temperature in Zhengzhou (except Songshan) increases or remains unchanged with the gradual increase in the terrain from northeast to southwest. The administrative regions of Zhengzhou include Gongyi, Dengfeng, Shangjie, Xingyang, Xinmi, Huiji, Zhongyuan, Jinshui, Erqi, Guancheng, Xinzheng, and Zhongmou (Figure 1).
Zhengzhou City is high in the west and low in the east, with ladder-like terrain, and the mountains, hills, and plains are regularly distributed. The landform types are diverse, and the regional differences are obvious. The average altitude of the mountain is between 400 and 1000 m, the hills are distributed in the west of the Beijing–Guangzhou line, and the altitude is mostly between 200 and 300 m. The plain can be divided into eastern and western parts, and the eastern plain is located in the south wing of the Yellow River alluvial fan, mainly distributed in the central urban areas of Zhengzhou, Zhongmu, and Xinzheng. The western plain is located in the lower reaches of the Yiluo River and the Ku River Basin, mainly distributed in Gongyi and Xingyang. There are more than 100 rivers in Zhengzhou, and there are 29 rivers with a large watershed area, which belong to the Yellow River and Huaihe River, respectively. There are 14 medium-sized reservoirs, and the surface water resources are abundant. Affected by human activities and rainfall changes, the interannual variation of runoff in the city is very large, and waterlogging is frequent.

2.2. Research Methods

Taking Zhengzhou City as the research area and the SCS-CN hydrological model as the research method, the surface runoff under extreme rainfall conditions in Zhengzhou city from 2005 to 2023 was simulated based on soil texture, soil type, land use type, rainfall, and other data. In the model simulation, extreme rainfall with daily rainfall greater than 50 mm was selected for simulation, and since the extreme rainfall in the study area basically occurs from May to September, only the extreme rainfall data between May and September were selected for simulation in this study. The SCS-CN model is shown in Equations (1) and (2).
Q = P I a 2 P + S I a   P I a 0   P < I a
S = 25400 / C N S 254
In the formula, Q is the surface runoff (mm), P is the rainfall (mm), S is the potential maximum retention of soil (mm), and Ia is the initial loss value of rainfall (mm), which is often calculated by Ia = 0.2 S. CNS is the modified CN, which is related to soil type, soil texture, soil moisture, and other factors. The CNS value in the model is applicable to areas with a slope less than 5%. According to the characteristics of the terrain slope in Zhengzhou, the CNS value is corrected by using the Huang slope correction formula [21].
C N S = C N × 322.79 + 15.63 × S L P S L P + 323.52
In the formula, CN is a dimensionless parameter and SLP is the slope.
The CN values corresponding to different soil hydrological combinations are different, and different soil hydrological combinations can be divided into four categories: A, B, C, and D (Table 1). The CN values corresponding to different soil moisture levels are different. Based on the rainfall in the 5 days before the rainfall event, the soil moisture level can be divided into three levels: AMCI (drought condition), AMCII (normal condition), and AMCIII (wet condition); AMCI, AMCII, and AMCIII correspond to CNI, CNII, and CNIII, respectively. According to the local land use type and soil texture, the CNII value is determined. On the basis of obtaining CNII, the CNI and CNIII values under different land use types and soil hydrological combinations are obtained according to Equations (4) and (5) [22,23,24] (Table 2).
C N I = 4.2 C N II 10 0.058 C N II
C N III = 23 C N II 10 + 0.13 C N II
Data sources: The spatial distribution data of soil texture (Figure 2), the spatial distribution data of soil types, and the data of land use types are mainly from the Resource and Environmental Science and Data Center of the Chinese Academy of Sciences. The rainfall data (2005–2023) are from the China Meteorological Data Center (Table 3), and the elevation data are from the geospatial data cloud.

3. Results

3.1. Extreme Rainfall and Surface Runoff in the Study Area from 2005 to 2020

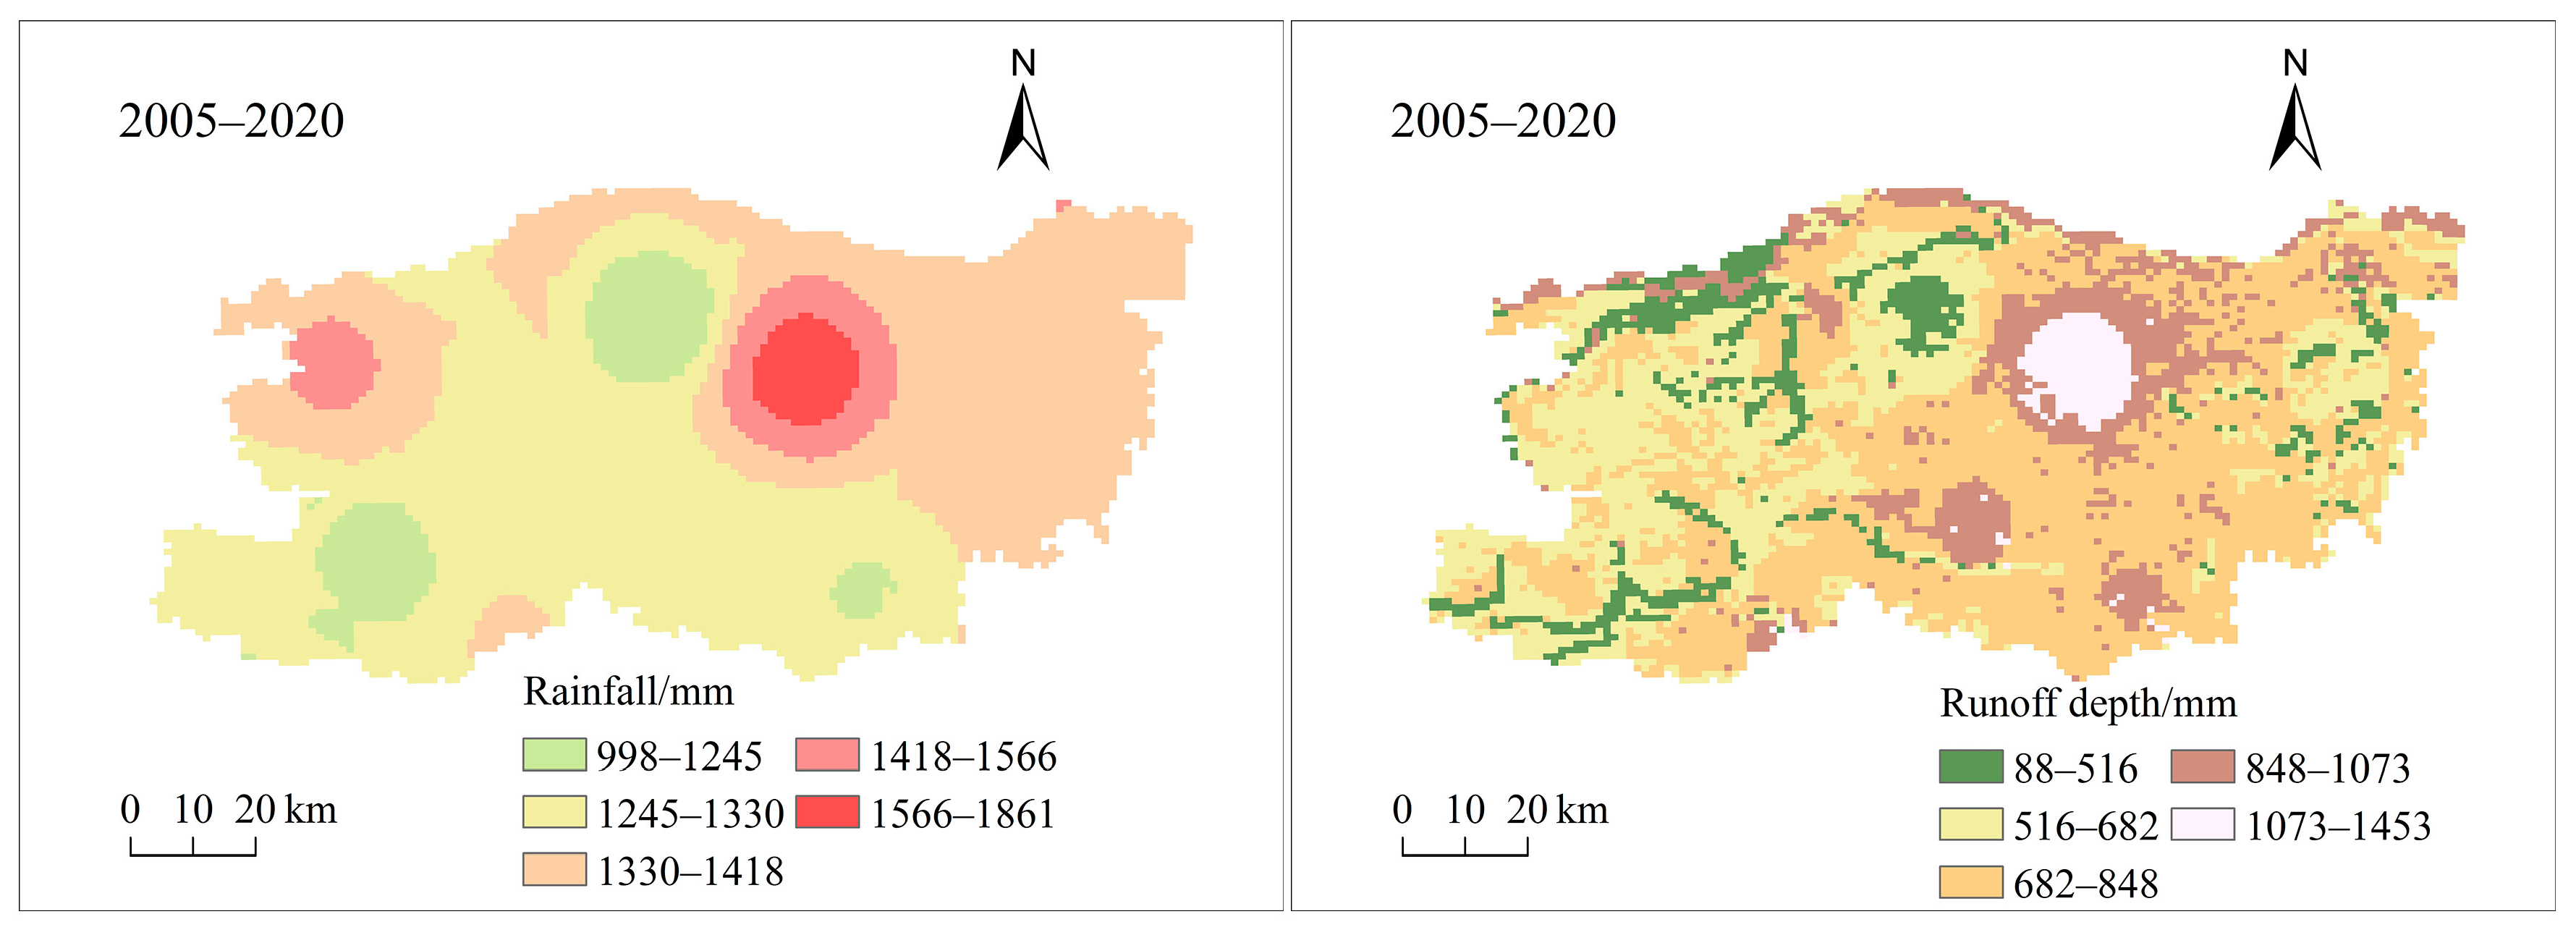
3.1.1. Characteristics of Extreme Rainfall and Surface Runoff in the Study Area from 2005 to 2020

According to the extreme rainfall and surface runoff in the study area (Figure 3), the total amount of extreme rainfall in the study area from 2005 to 2020 was 1529 mm; the annual average extreme rainfall was 95.6 mm, causing a total amount of surface runoff of 1224 mm; the annual average surface runoff was 76.5 mm. The main urban area had the heaviest rainfall and the highest surface runoff.
In the study area, from 2005 to 2008, the total amount of extreme rainfall was the heaviest at 517 mm, and the total surface runoff was 435 mm. From 2005 to 2008, the total amount of extreme rainfall in different administrative regions in the study area was between 280 and 702 mm, and the total surface runoff in different administrative regions was between 202 and 628 mm (Figure 4). The above analyses show that there are relatively large differences in extreme rainfall in different administrative regions. From 2013 to 2016, the total amount of extreme rainfall in the study area was the smallest, at 210 mm, and the total surface runoff was 143 mm. The total amount of extreme rainfall in the study area from 2005 to 2008 was 2.46 times that of 2013–2016. The extreme rainfall and surface runoff between 2005 and 2008 and 2013 and 2016 were quite different. This indicates that strong extreme rainfall events are more concentrated in time. In addition, the frequency of extreme rainfall in different administrative regions was relatively close, mainly between 0 and 3 times per year.

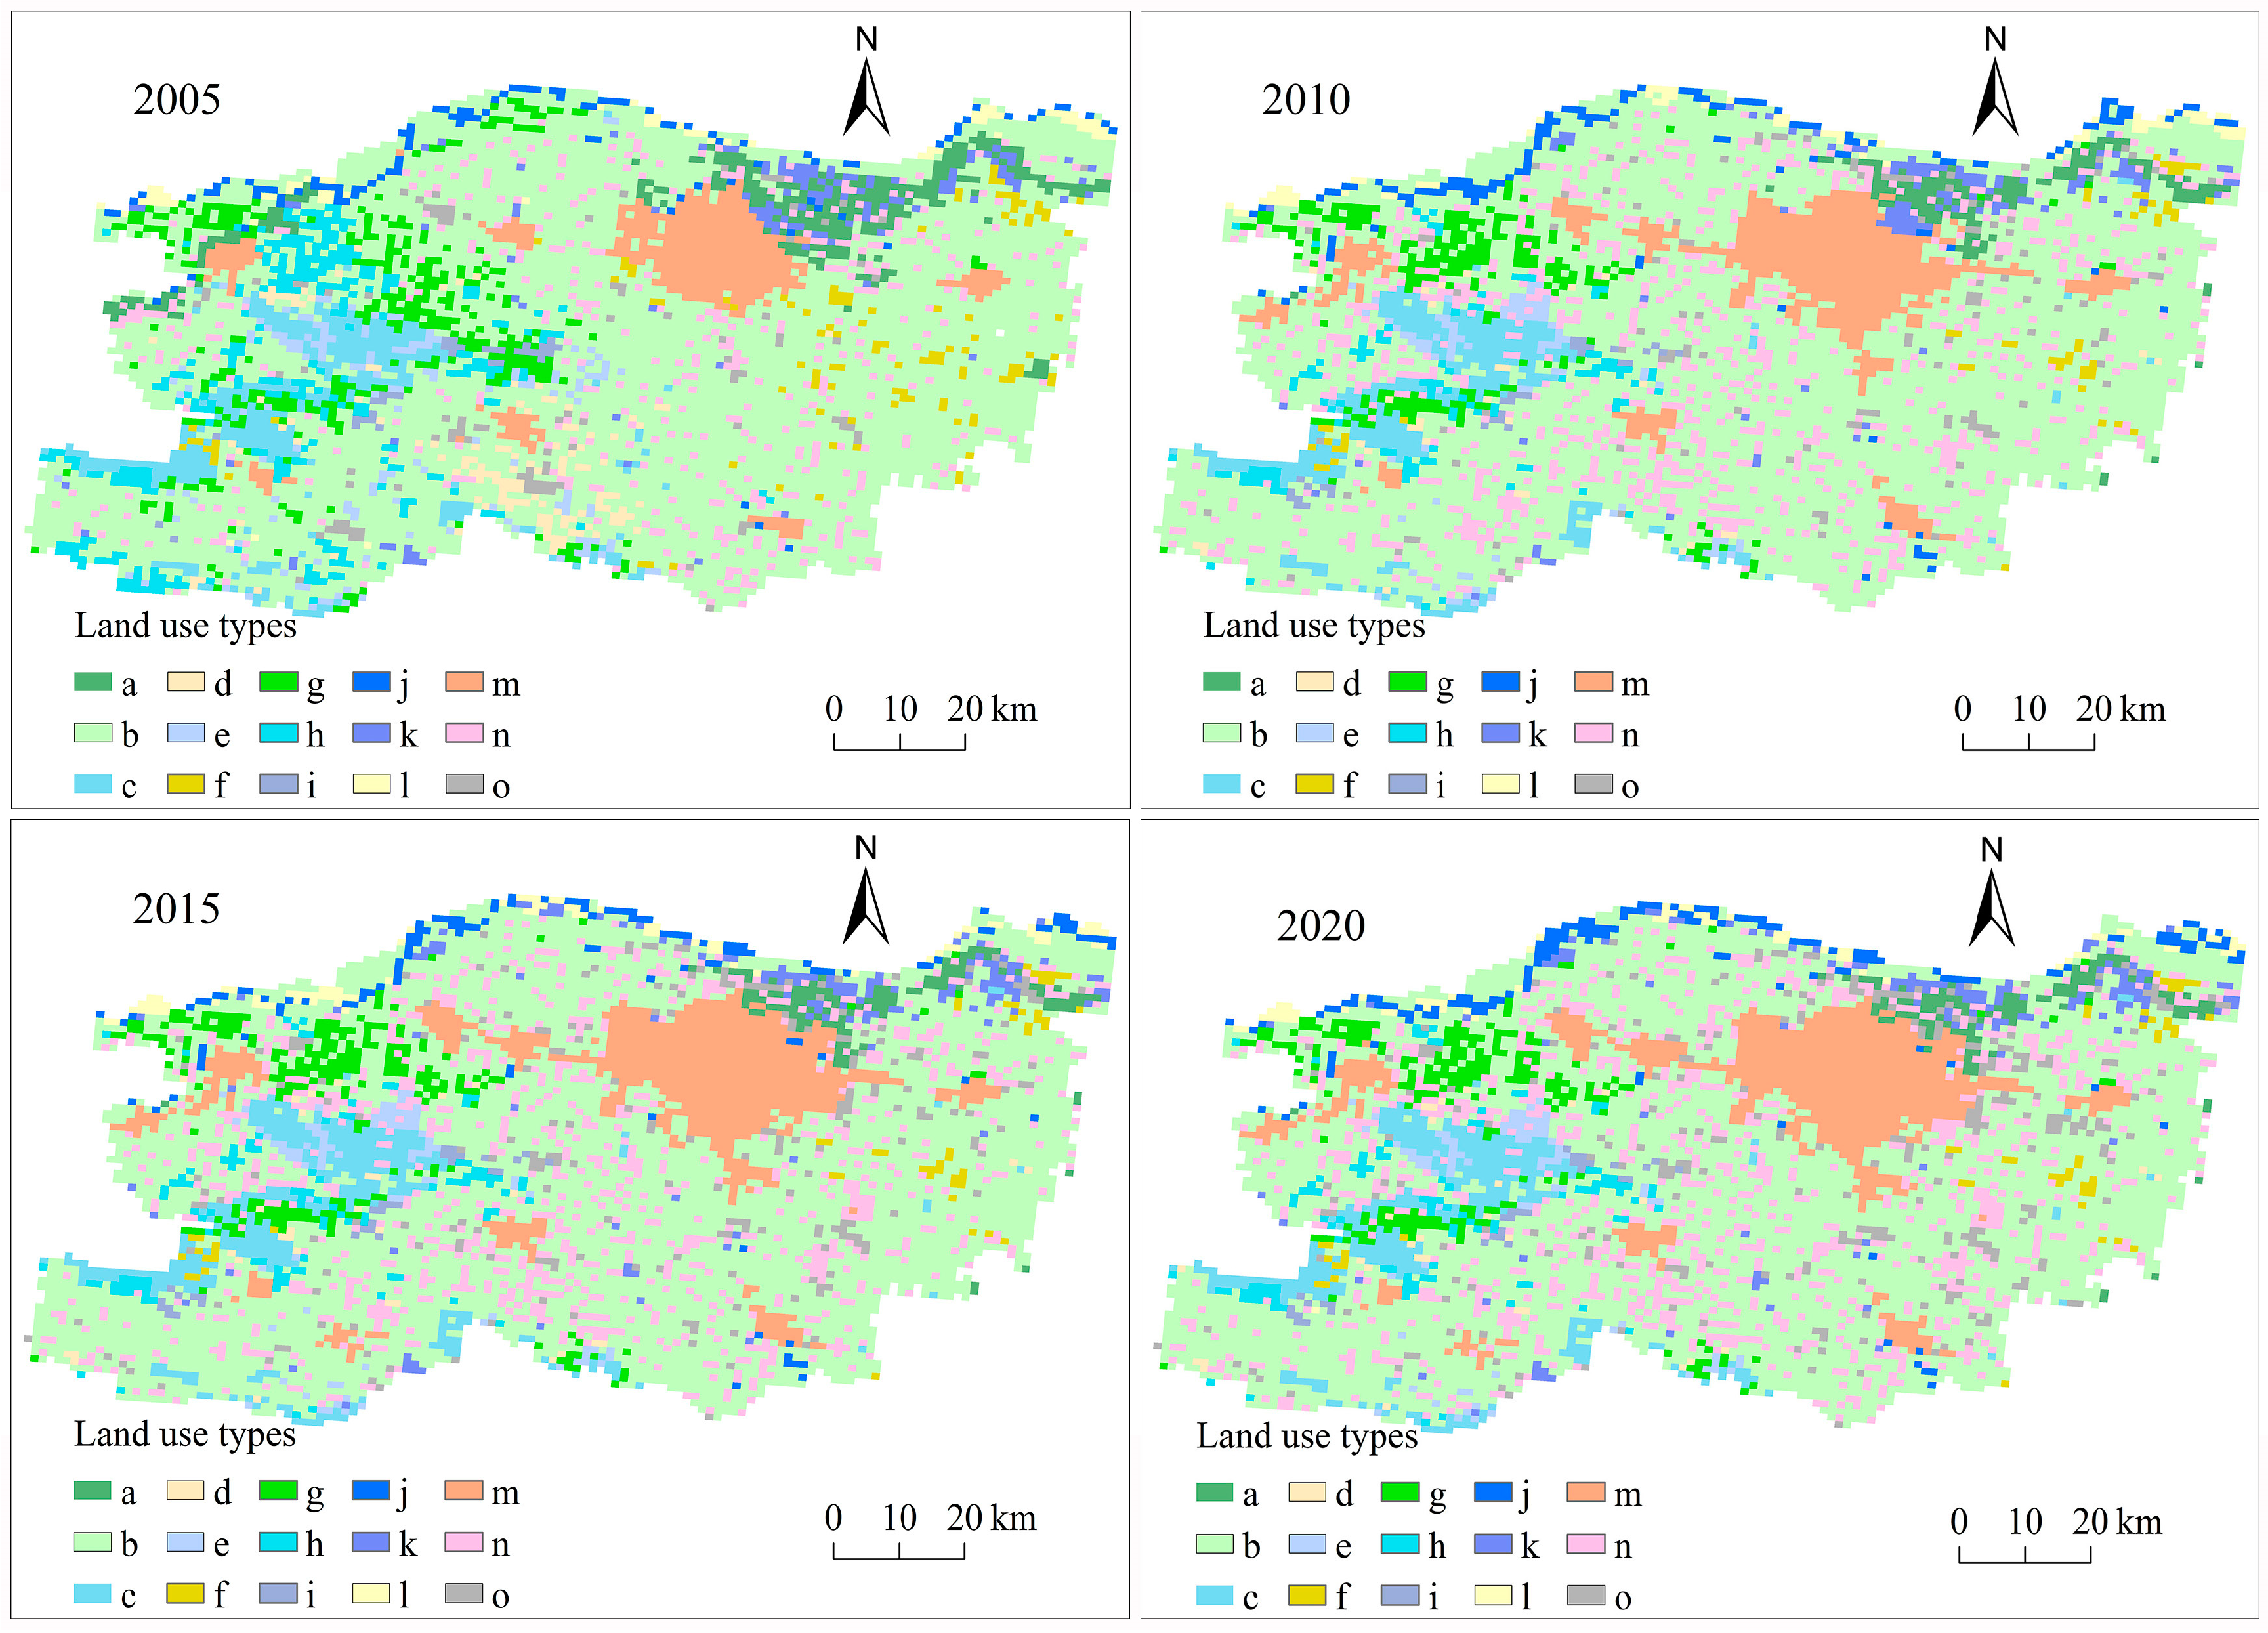
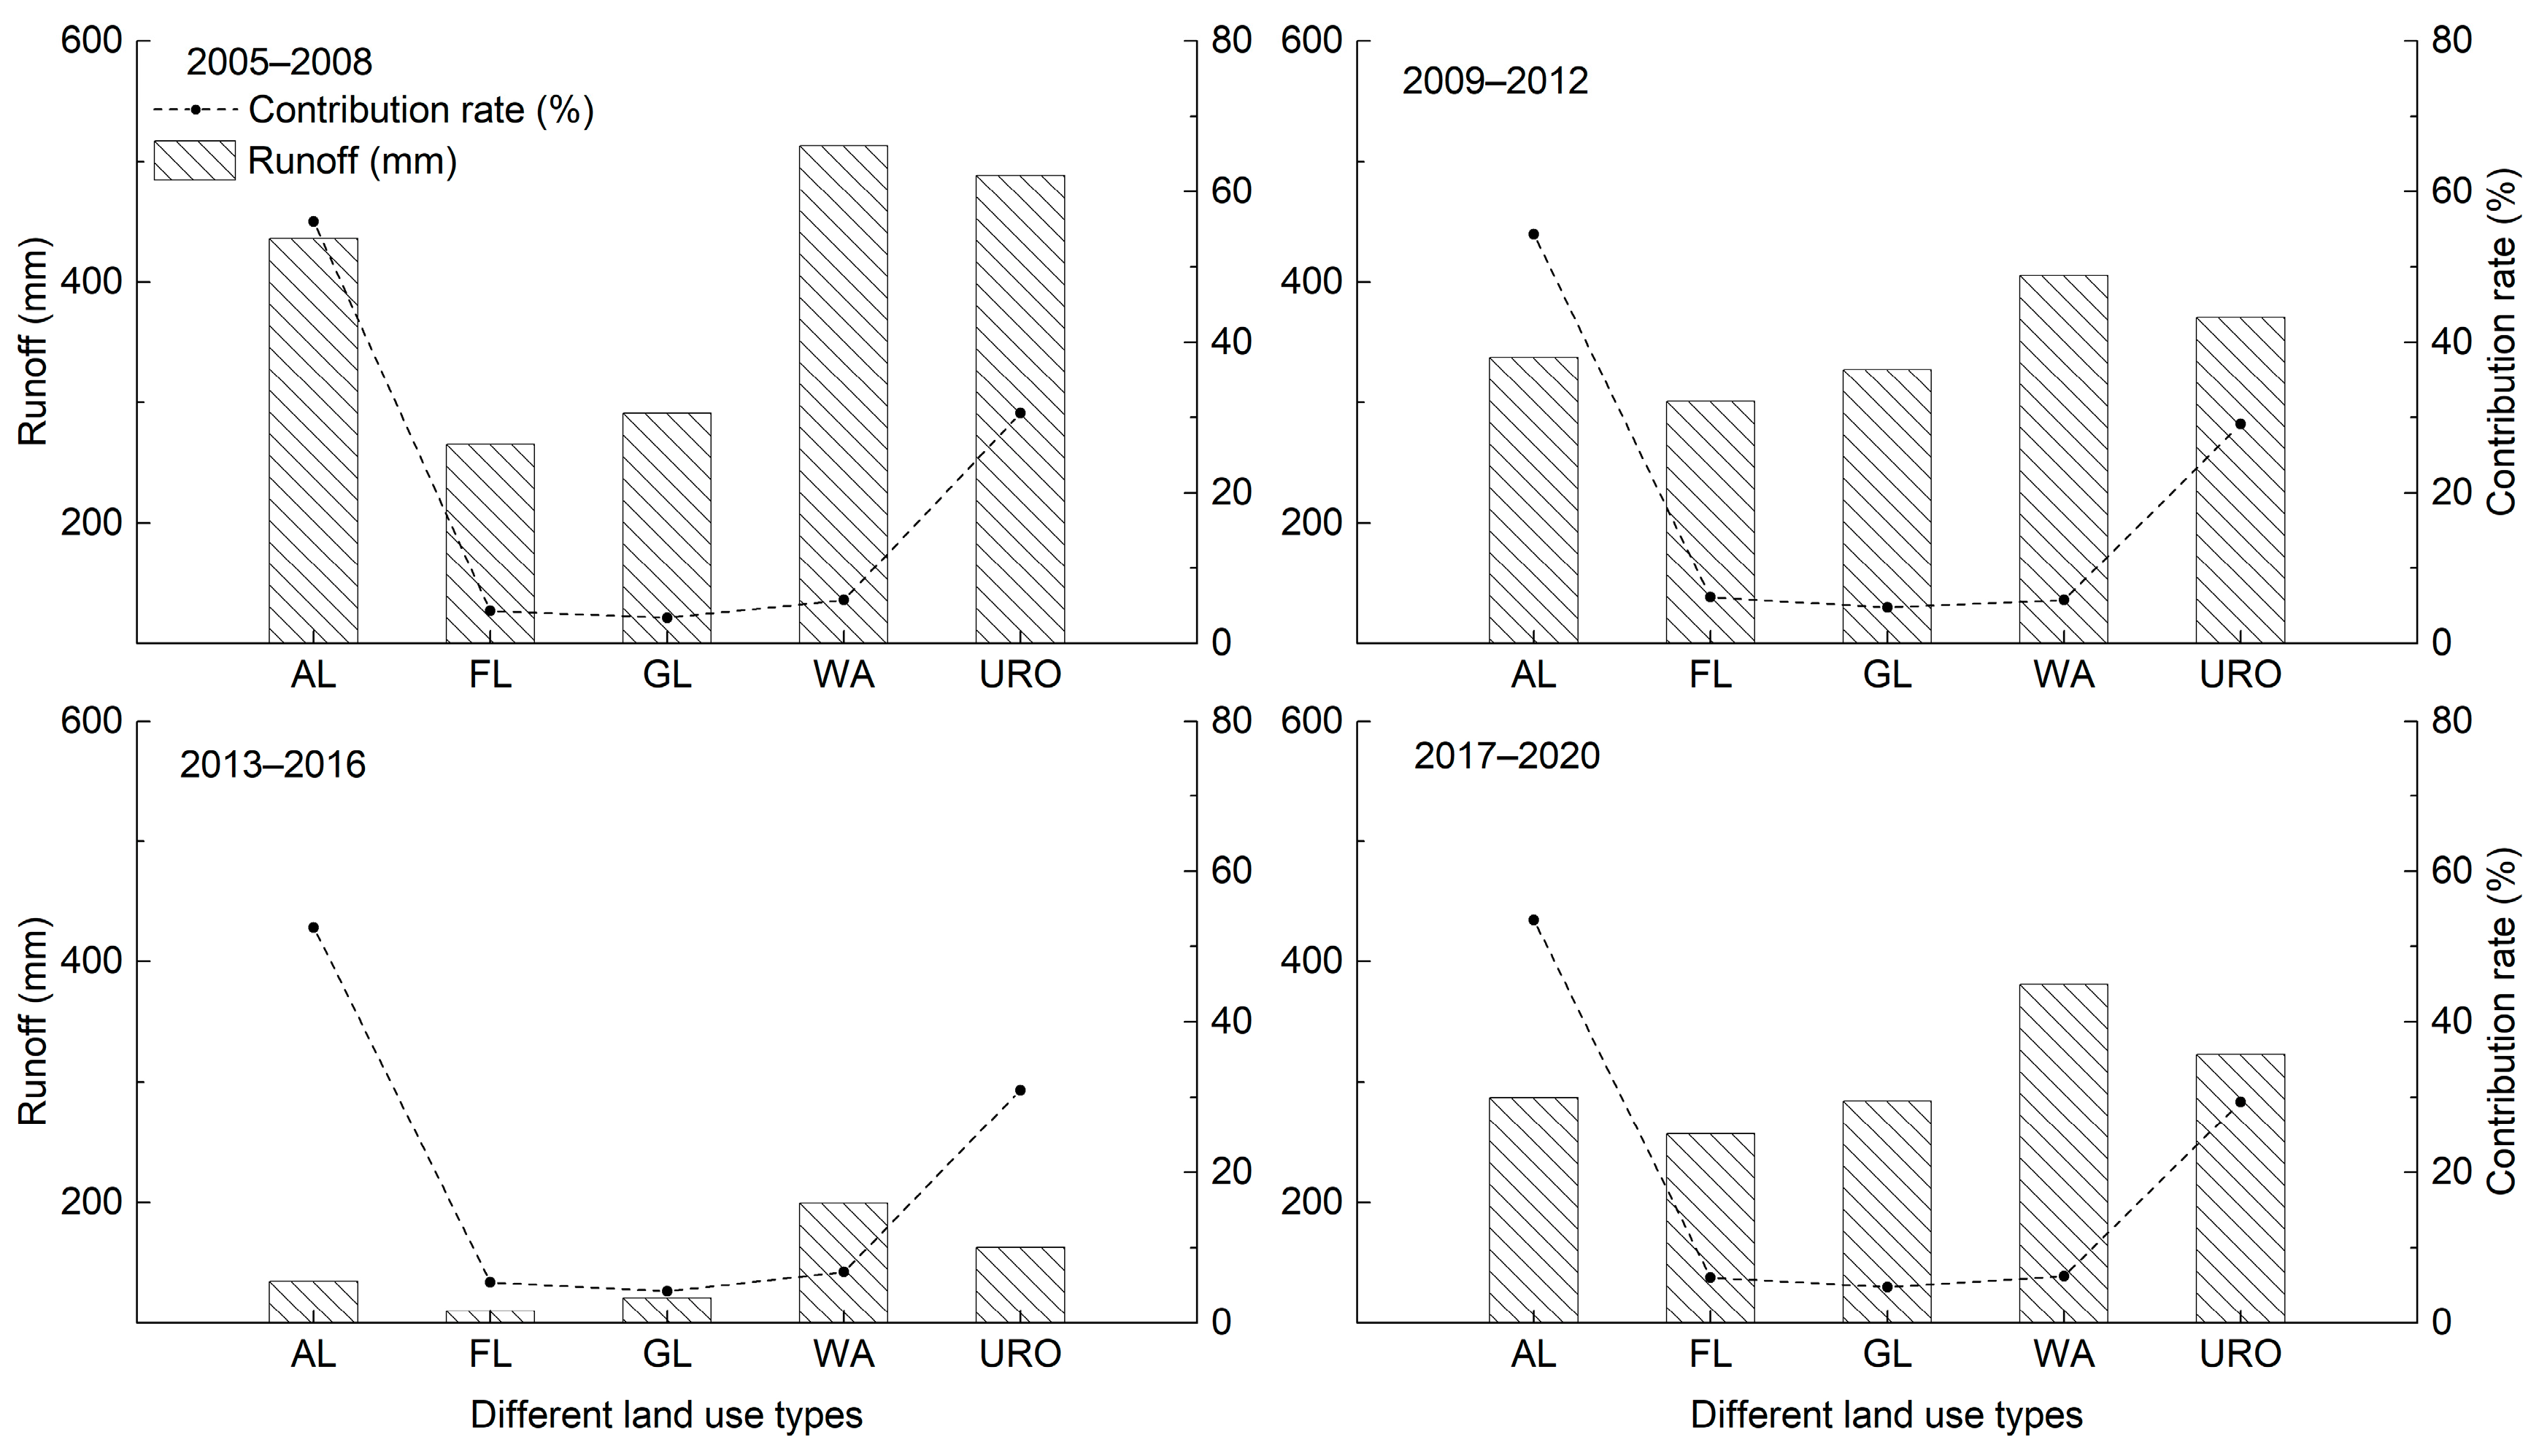
3.1.2. The Contribution of Different Land Use Types to Surface Runoff in the Study Area from 2005 to 2020

The surface runoff in the study area was highest for different land use types from 2005 to 2008 (Figure 5) and ranged from 237 to 552 mm, with an annual average surface runoff ranging from 59 to 138 mm. The surface runoff in the study area was lowest for different land use types from 2013 to 2016, and ranged from 96 to 213 mm, and the annual average surface runoff ranged from 24 to 53 mm. The magnitude of surface runoff from different land use types is mainly related to the amount of rainfall. During the different time periods in the study area, cultivated land contributed the most to the total amount of surface runoff, followed by construction land. In different time periods, the contribution rate of cultivated land to surface runoff was more than 50%, the contribution rate of construction land to surface runoff was approximately 30%, and the contribution rate of other land use types to surface runoff was less than 10%. The contribution rate of different land use types to surface runoff did not represent the level of runoff potential of each land use type; the contribution rate of surface runoff from different land use types was mainly related to the size of the land use types. Cultivated land and construction land account for more than 50% and 25% of the total area of the study area, respectively, which results in the relatively large contribution rates of surface runoff from cultivated land and construction land.

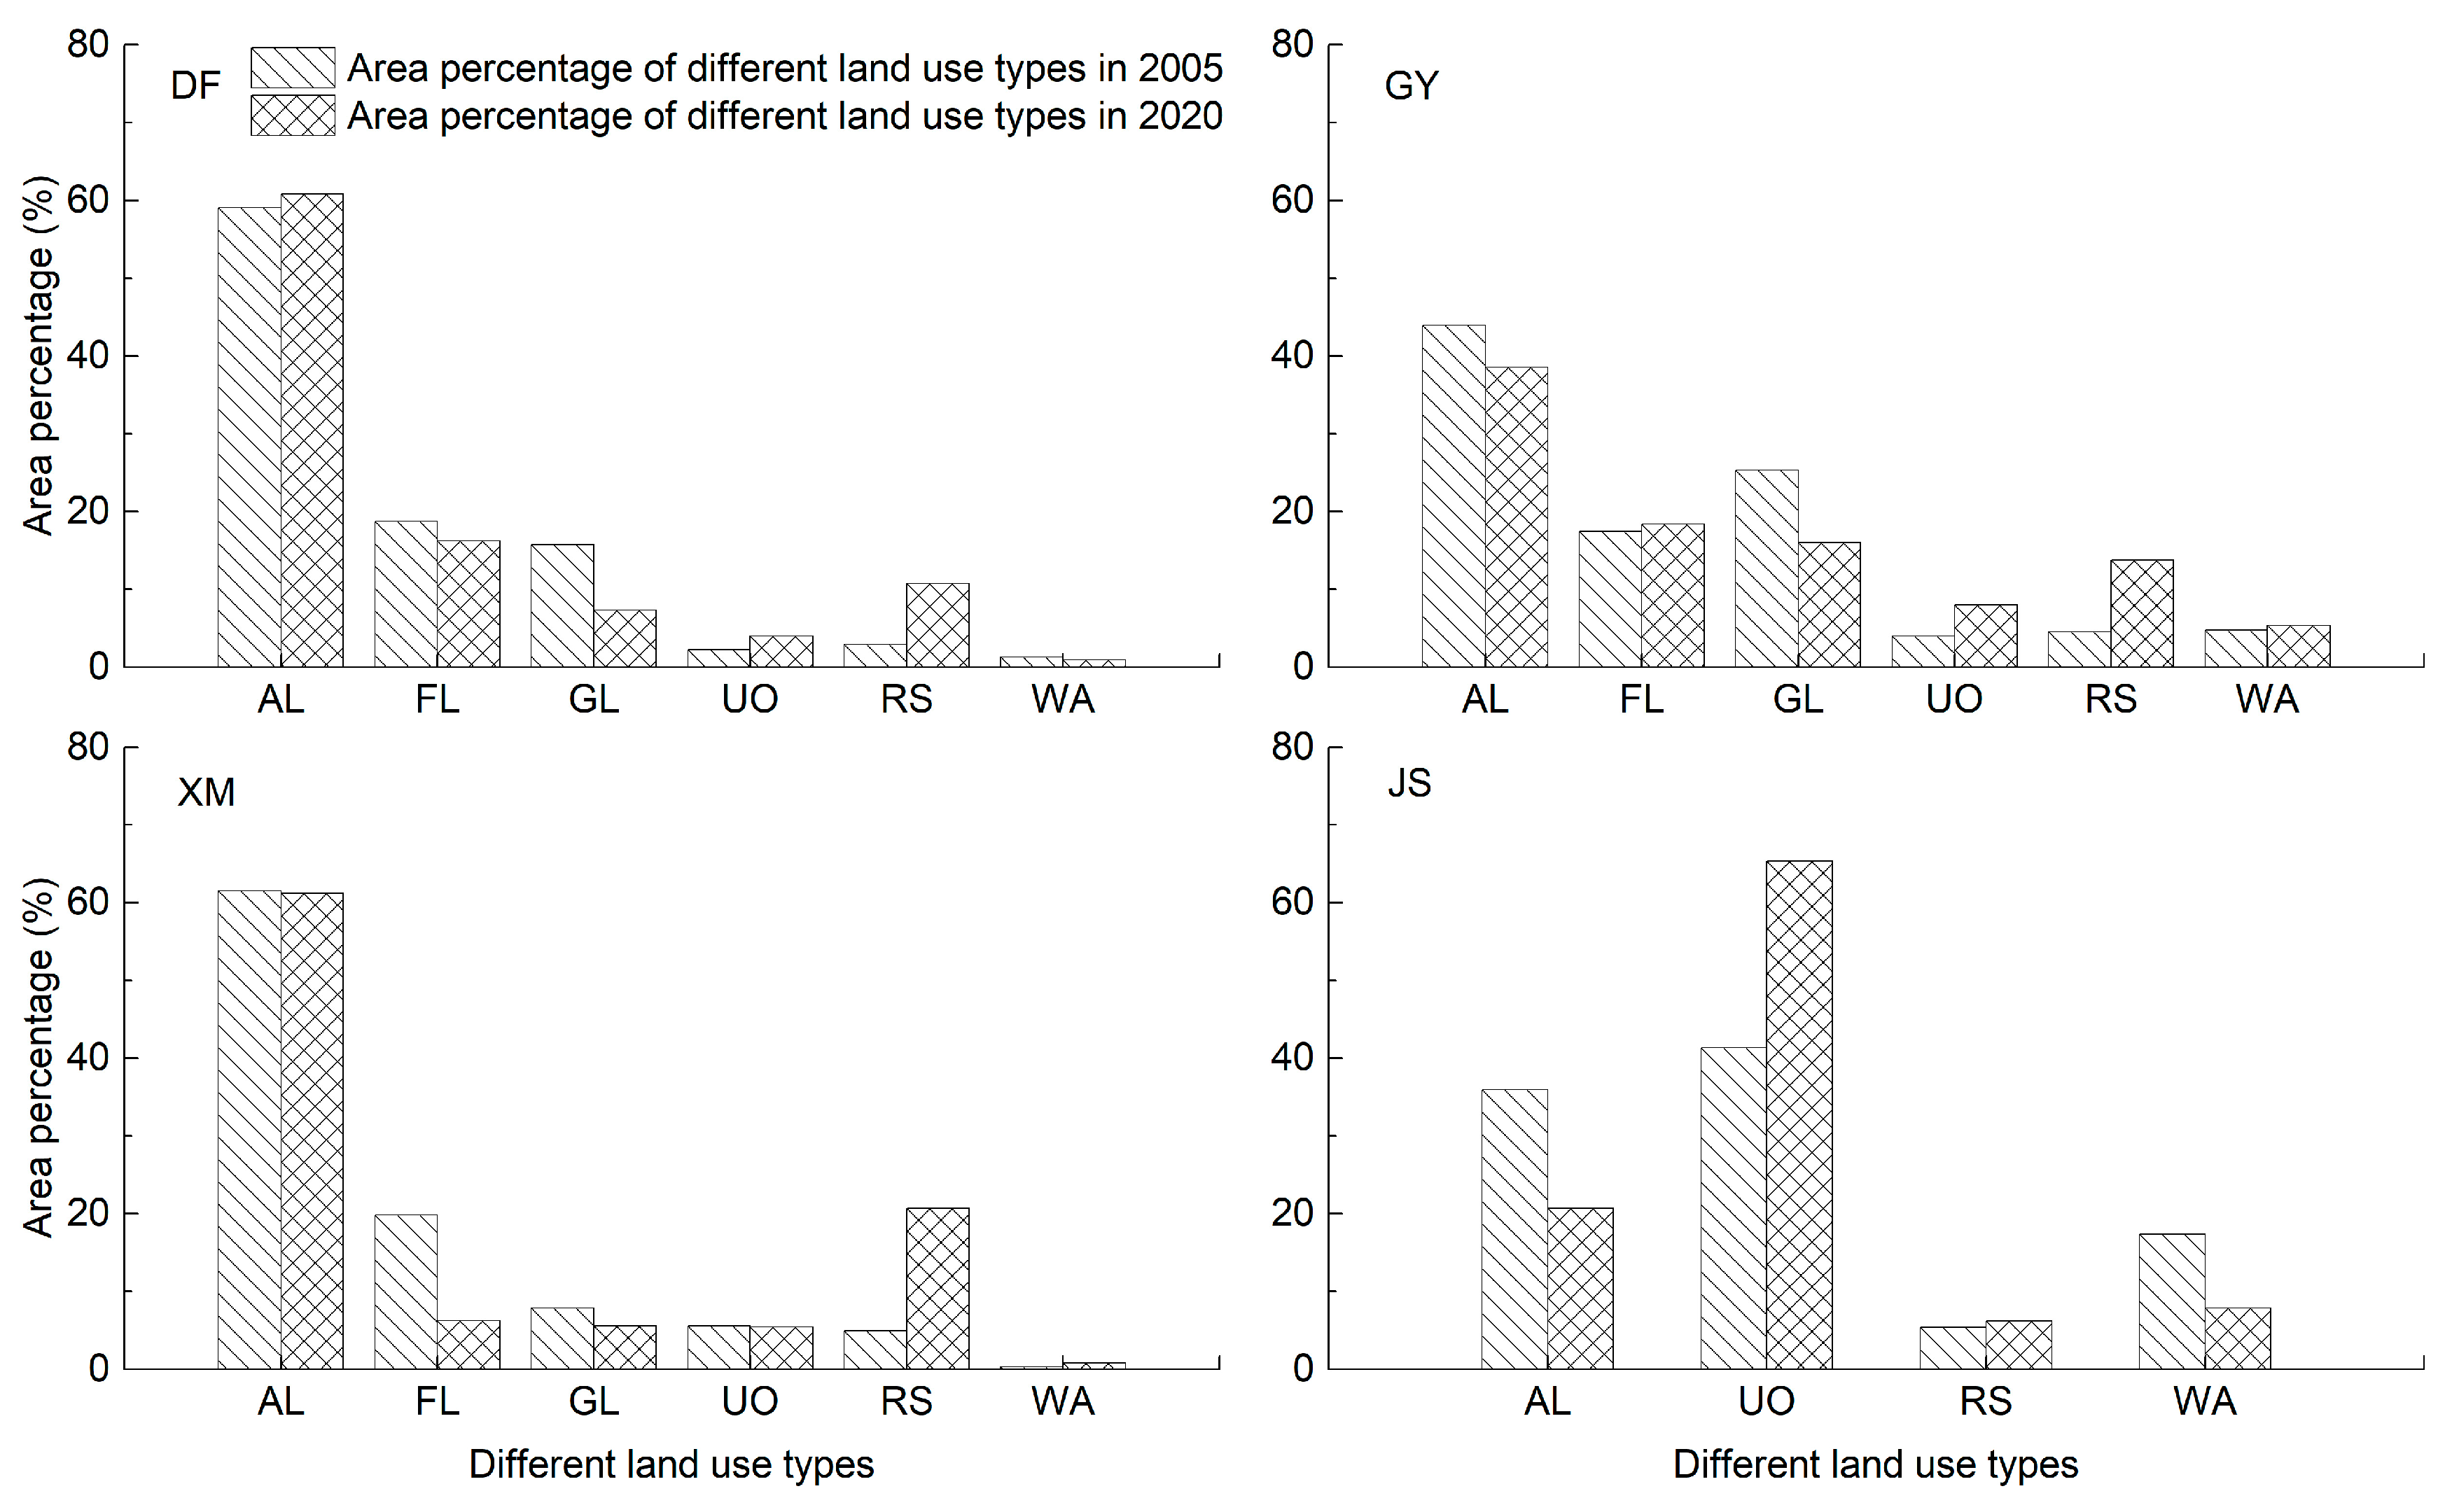
3.2. The Influence of Different Land Use Types on Surface Runoff

In addition to rainfall, the magnitude of surface runoff in different regions is also affected by different land use types. Therefore, the surface runoff of different land use types is simulated by the model to determine the potential of different land use types to generate surface runoff. According to the requirements of the “Sponge City Special Planning of Zhengzhou City (2017–2030)”, the design standard of waterlogging prevention and control in the urban area and the aerotropolis is a 50-year return period, which can resist 24 h 110 mm rainfall. Therefore, taking the 24 h 110 mm rainfall as the background, the surface runoff of different land use types in Zhengzhou City in 2020 under the same rainfall conditions was analyzed. According to the surface runoff volume of different land use types (Table 4), the surface runoff volume of urban land and other built-up land is the largest, except for rivers and canals, reservoirs and ponds, and beach land. Surface runoff from high-cover grassland and various types of woodland is relatively small. This suggests that woodland and grassland have the most significant inhibitory effect on surface runoff, while urban land and other built-up land have the most significant facilitating effect on surface runoff. The surface runoff of different land use types is obviously different, and the surface runoff of urban land and other built-up land is 1.4–2.5 times that of all kinds of forest land and grassland. This indicates that the differences in land use types in different regions have an important impact on surface runoff.

3.3. Surface Runoff under Extreme Rainfall Events

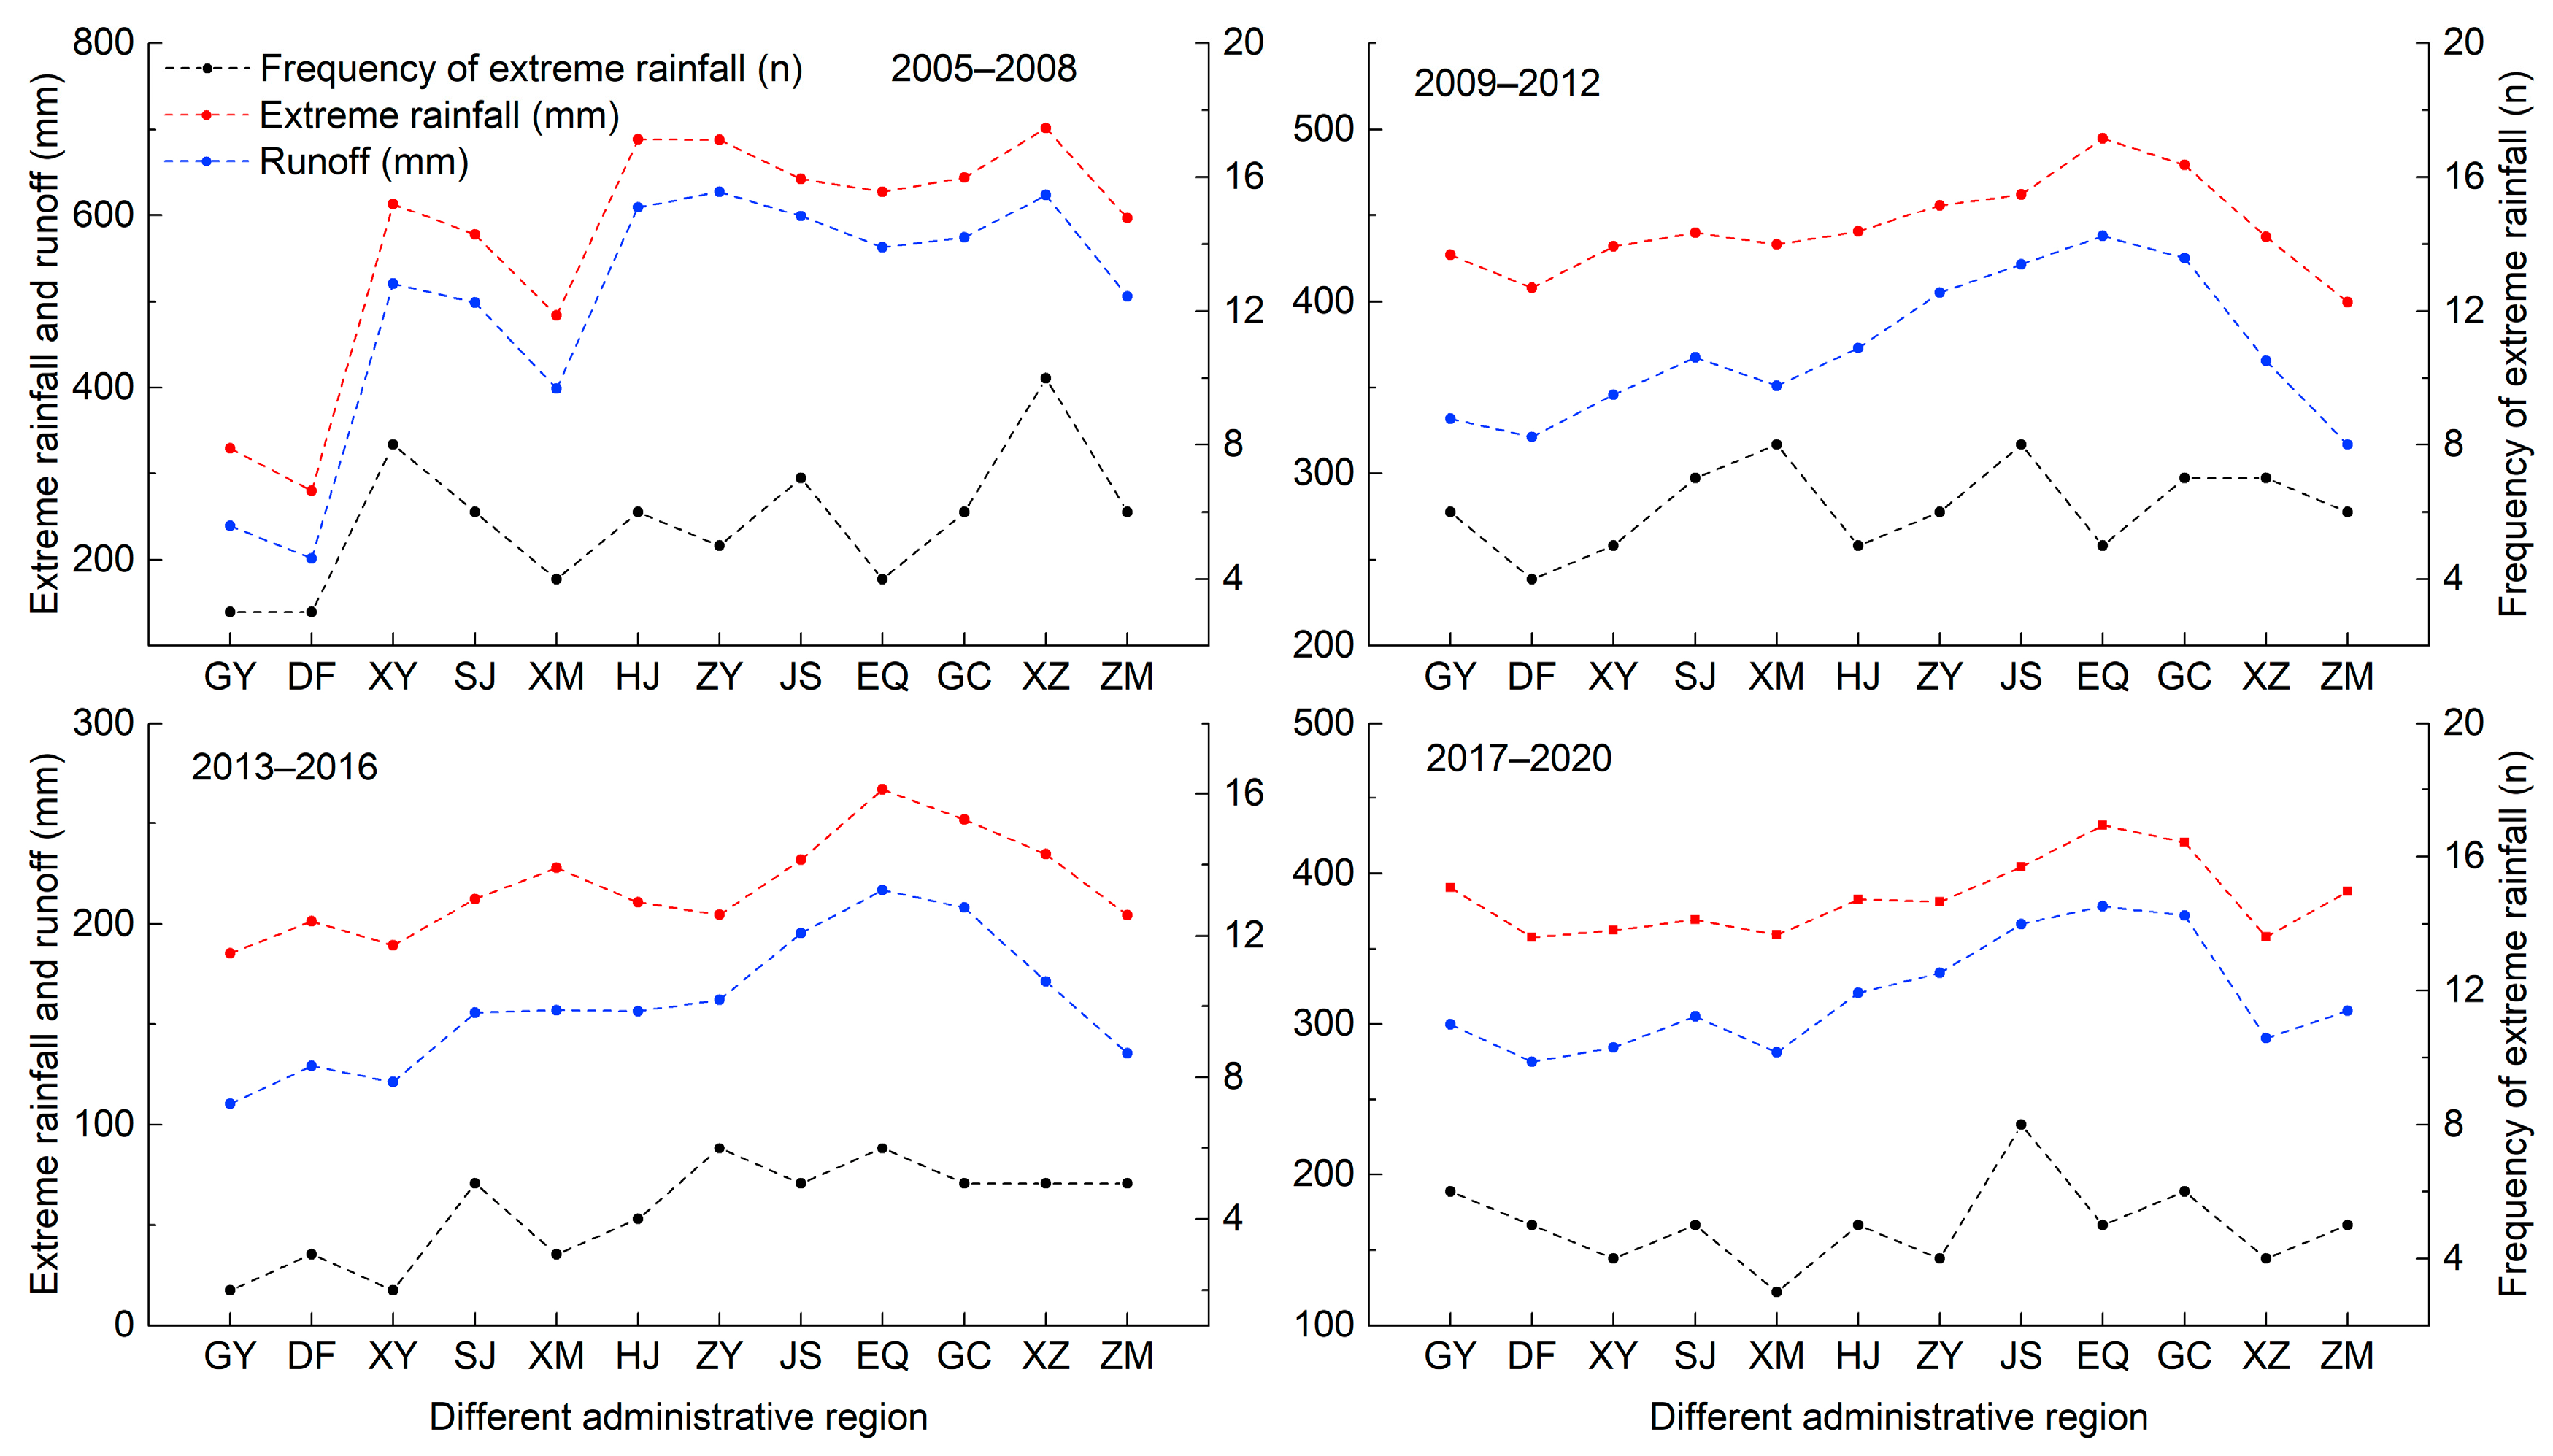
3.3.1. Surface Runoff from Different Administrative Areas under Extreme Rainfall Events

To further investigate the distribution characteristics and influencing factors of surface runoff under extreme rainfall conditions in the study area, surface runoff simulations were performed against the background of the extreme rainfall events of 20 July 2021, and 28–30 July 2023. Based on the rainfall and surface runoff during the extreme rainfall event on 20 July 2021, the average rainfall was 302 mm in the study area (Figure 6), with the Erqi District (rain/465 mm, runoff/439 mm), Zhongyuan District (rain/424 mm, runoff/406 mm), and Jinshui District (rain/401 mm, runoff/383 mm) receiving the heaviest rainfall and surface runoff. During the extreme rainfall event on 28–30 July 2023, the central and western regions received the most rainfall, with an average rainfall of 108 mm in study area. During this rainfall event, in the main urban areas including Zhongyuan District (rain/95 mm, runoff/73 mm), Jinshui District (rain/81 mm, runoff/64 mm), and Erqi District (rain/95 mm, runoff/63 mm), the rainfall was less than that in Gongyi City (rain/129 mm, runoff/54 mm), Xinmi City (rain/108 mm, runoff/59 mm), and Xinzheng City (rain/97 mm, runoff/64 mm). However, the surface runoff was relatively large. Similarly, the rainfall in Guancheng District (the main urban area) (rain/63 mm, runoff/42 mm) was less than that in Zhongmou County (rain/68 mm, runoff/37 mm), but the surface runoff was larger than that in Zhongmou County. These findings show that when rainfall in the main urban area is greater or less than that in the surrounding urban areas, the surface runoff volume will be relatively large, indicating that human activities have a profound impact on surface runoff by changing surface properties. As shown in Table 4, under the same rainfall (110 mm), the surface runoff of urban land and construction land was 1.4–2.5 times that of various types of woodland and grassland. However, the areas of dry land, forest, and grassland in the main urban area accounted for no more than 40% (Figure 6), while the areas of dry land, woodland, and grassland in the surrounding urban area accounted for more than 70%. Because the proportions of dry land, woodland, and grassland in the surrounding urban area are several times or even tens of times larger than those in the main urban area, the surface runoff in the main urban area is larger than that in the surrounding urban area.

3.3.2. Surface Runoff of Different Slopes under Extreme Rainfall Events

Slope has an important influence on surface runoff. According to the distribution of slopes in the study area (Figure 7), the slope of the study area is divided into six grades, which were micro-slopes (<5°), gentler slopes (5°–8°), gentle slopes (8°–15°), slopes (15°–25°), steep slopes (25°–35°), and sharp slopes (>35°). The study area is dominated by micro-slopes, and the micro-slope area accounts for 68% of the study area. According to the surface runoff of different slopes in the two extreme rainfall events (Table 5), the average surface runoff of micro-slopes is the largest, followed by gentler slopes, gentle slopes, and slopes. The average surface runoff of steep slopes and sharp slopes is the smallest. On the whole, the larger the slope, the smaller the average surface runoff. This is mainly due to the fact that areas with large slopes have a large proportion of dry land, forest land, and grassland (Table 5), and the soils of these land types have a high water-holding capacity, resulting in small surface runoff, while the opposite is true for areas with small slopes, which have a large surface runoff. In the western part of the study area, where the slope is large and the coverage of forest and grass is high (Figure 7), the surface runoff is small, while in the eastern part of the study area, on the contrary, the surface runoff is large.

4. Discussion

4.1. Influencing Factors of Surface Runoff

There are many factors affecting surface runoff, mainly including soil properties, land use, slope, soil wetness, land management practices, rainfall, and landscape pattern indices. In this study, surface runoff under the influence of rainfall, degree of soil wetness, land use type, soil properties, and other factors are mainly considered. In this study, the average surface runoff in the main urban area is greater than that in other areas. Although the average rainfall in the main urban area is less than that in the surrounding urban area, the average surface runoff in the main urban area is still greater than that in the surrounding area, which is mainly due to the larger area of impervious surface in the main urban area and the lower surface permeability [25,26,27]. But on the other hand, it also reflects that human activities affect rainwater infiltration by changing the surface properties, and then change the surface runoff [28,29,30]. From 2005 to 2020, the total area of urban land and other construction land in the study area increased from 509 km2 to 1039 km2, and the area of grassland and forest land decreased from 746 km2 and 683 km2 to 533 km2 and 383 km2, respectively (Figure 2); the runoff of urban land and other construction land is large and the area has increased, while the runoff of grassland and forest land is small and the area has decreased, which indicates that the land use change in recent years has promoted the surface runoff in the study area. The study shows that only about 10% of the rainfall in the green space coverage area forms runoff, and 60% of the rainfall in the area without green space forms surface runoff, which indicates that the green space can effectively reduce surface runoff [31,32,33]. Therefore, in order to prevent the occurrence of waterlogging, the main urban area should increase the proportion of forest and grass coverage area and promote sustainable urban development through rational land use planning. Since the different types of hydrological combinations in different regions result in some differences in parameter selection, the results in this study are limited to Zhengzhou and areas with similar climatic and geographic characteristics to Zhengzhou. In regions with large differences, the applicability of the results needs to be further verified.

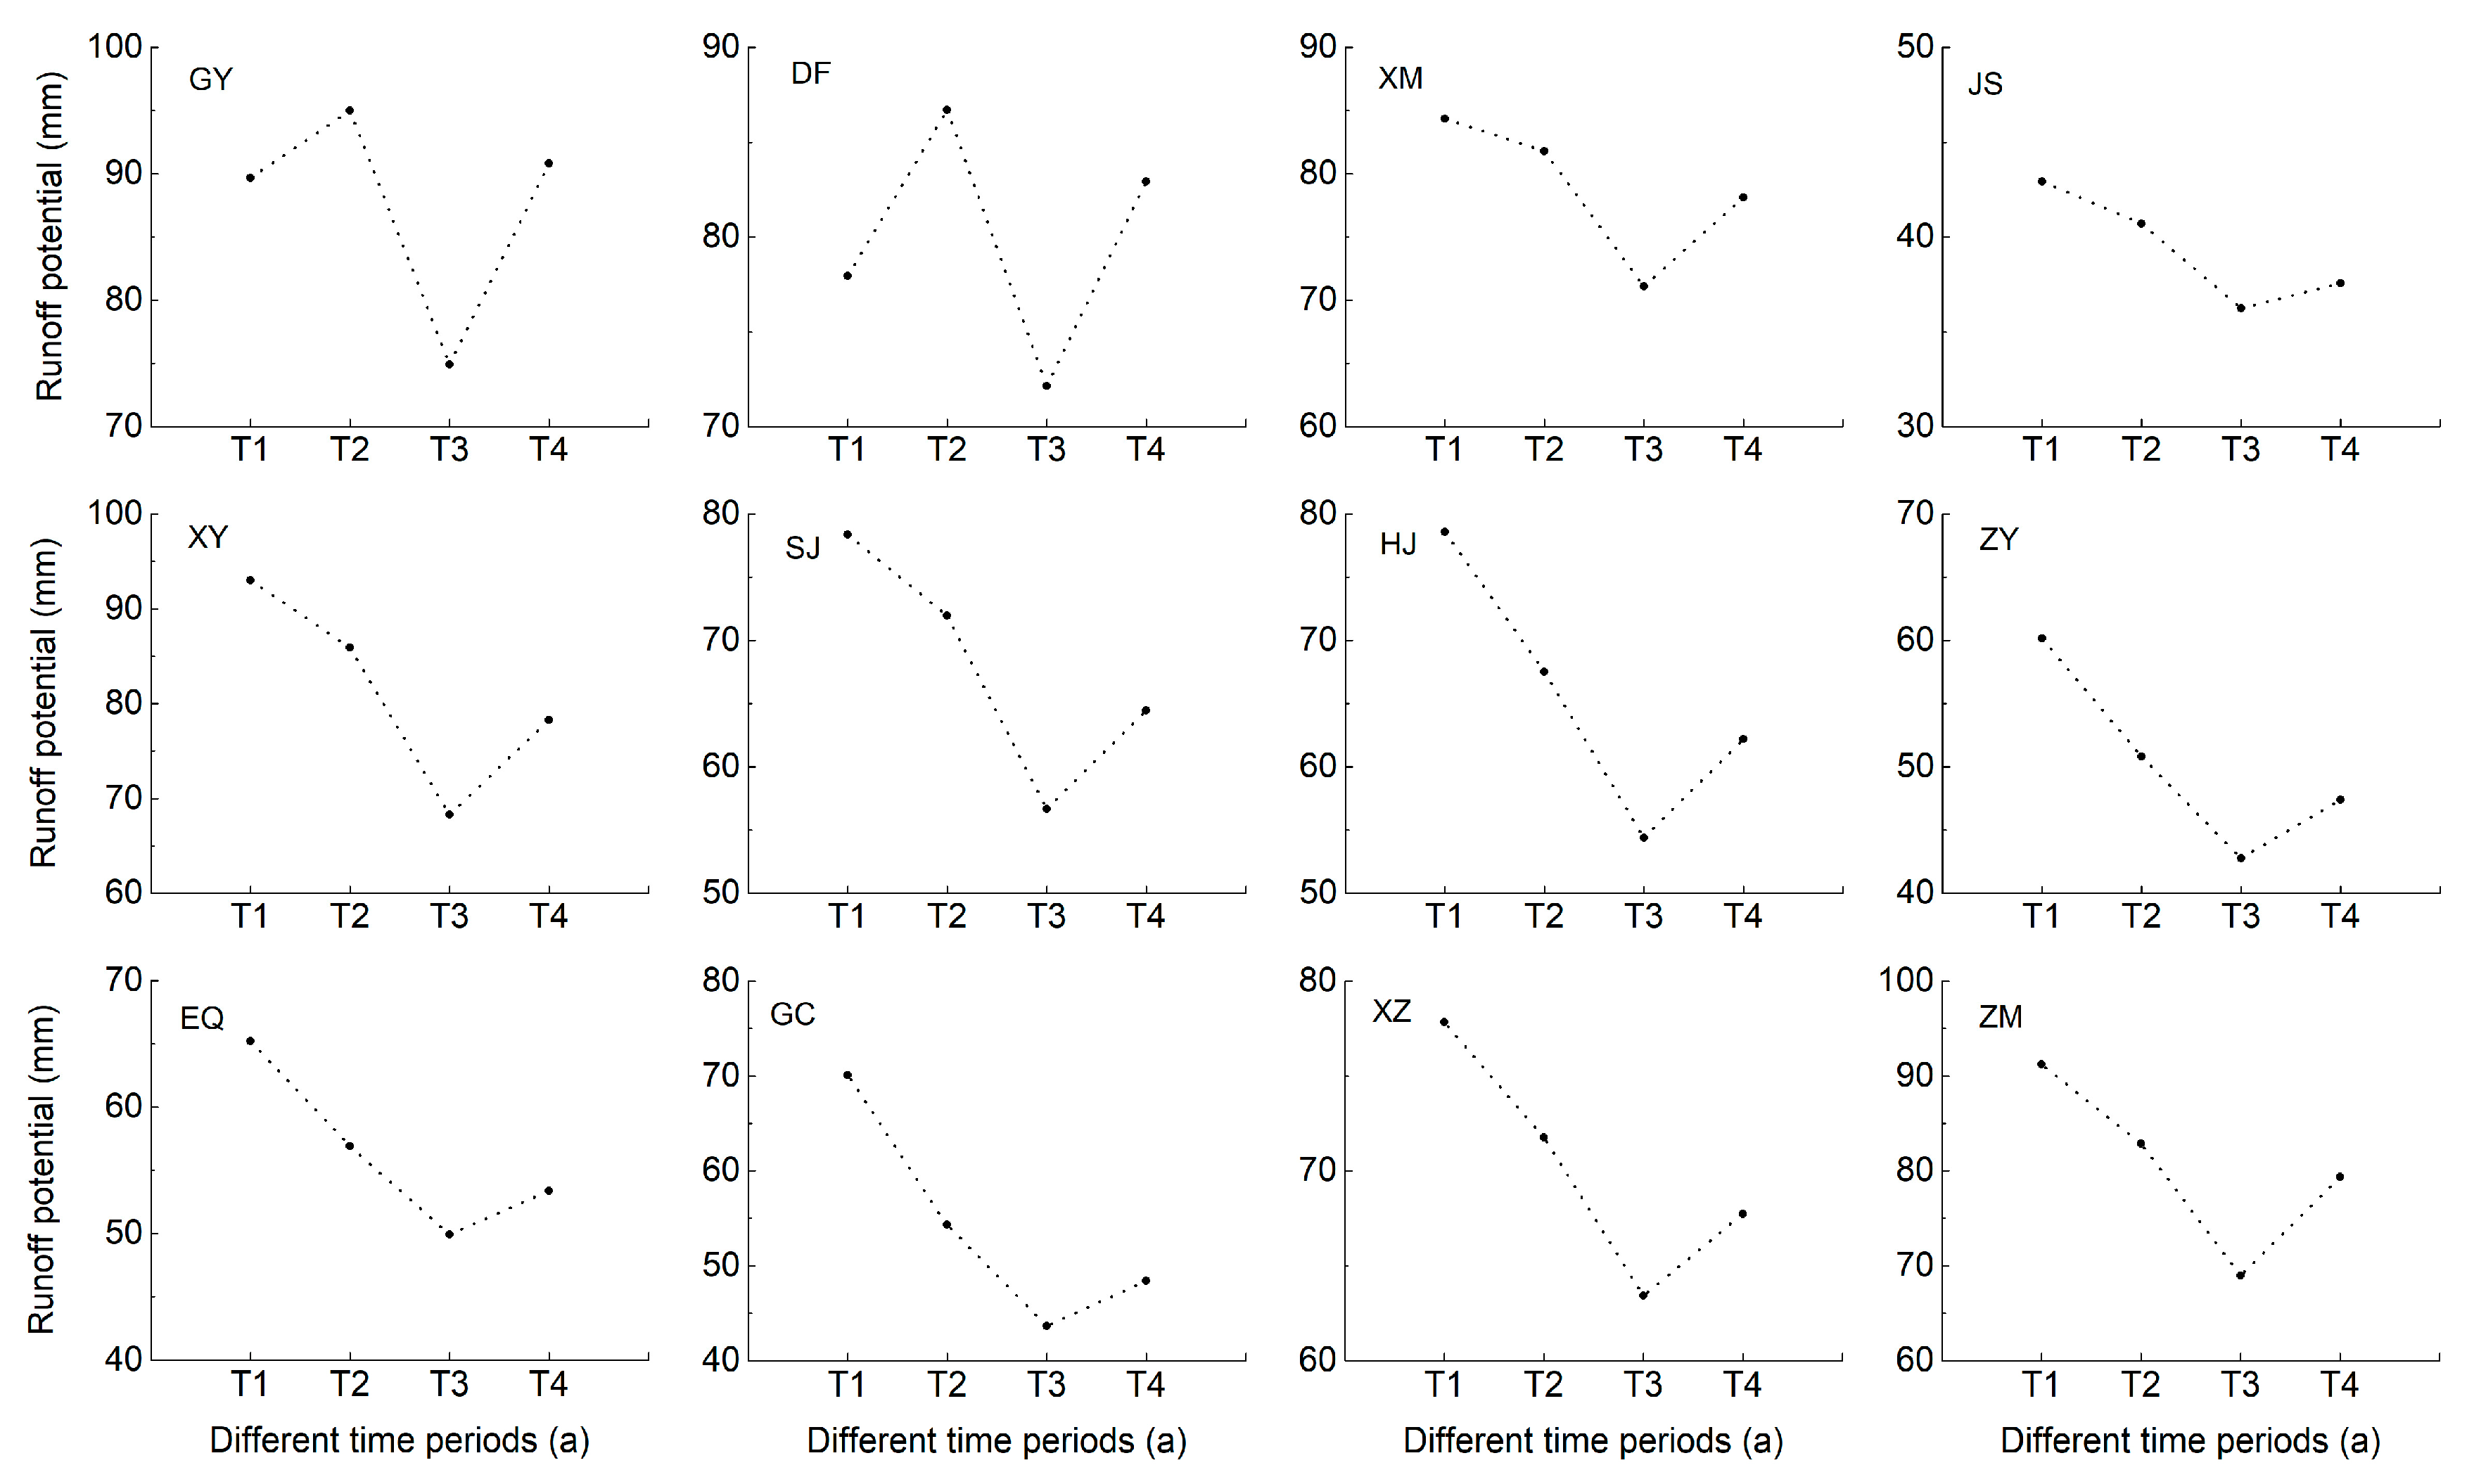
4.2. The Change in Surface Runoff Potential in Different Regions of the Study Area

The differences between rainfall and surface runoff (DRS) in different regions of the study area is able to reflect the ability of different regions to retain water under extreme rainfall, and at the same time, it is able to reflect the magnitude of surface runoff potential in different regions. Based on the relationship between extreme rainfall and surface runoff in different regions for the four time periods 2005–2020 (Figure 8), the variation in DRS values of most administrative regions in the study area over time showed three trends. In the first trend, the DRS value did not exhibit an obvious variation pattern as time increased (Dengfeng and Gongyi). In the second trend, the DRS value slowly decreased as time increased (Xinmi and Jinshui). Under these two change trends, the DRS values of these regions in 2005–2008 and 2017–2020 were relatively close, indicating that their surface runoff potential does not change significantly over time. The variation pattern of the DRS value was related mainly to the land use types in different time periods; the DRS values of Dengfeng, Gongyi, and Xinmi in the periods 2005–2008 and 2017–2020 were similar, most likely because the proportions of cultivated land and rural residential areas in these areas was maintained at a high level (approximately 50%, 60%) (Figure 9). Furthermore, the proportions of other land use types were relatively similar during these two time periods. The DRS values of Jinshui District between 2005 and 2008 and 2017–2020 were similar, mainly because the proportion of urban and other construction land in this area remained relatively high. In these two time periods, the area ratio of urban and other construction land increased slightly, and the DRS value decreased slowly. In the third change trend, the DRS value decreased significantly over time (Xingyang, Shangjie, Huiji, and other areas). This change trend was the most common in the administrative areas in the study area, indicating that the surface runoff potential in most regions of the study area increases significantly. It resulted from the increase in urban areas and the reduction in woodland and grassland areas during the urbanization process. This situation further indicates that in most areas of the study area, the construction of sponge cities needs to be strengthened, and the proportion of woodland and grassland coverage needs to be increased.

4.3. Enlightenment of Land Use Management

The main urban area of the study area has the highest potential for surface runoff and, based on the density of buildings and roads in the main urban area, surface runoff in the main urban area can be reduced through the following projects. (1) Construction of plant-based natural ecosystems on roofs (green roofs). Studies have shown that green roofs can reduce storm water runoff by 35.5% or even 100% [34]. (2) Construction of recessed green spaces with a depth of 0.1–0.3 m and an area ratio of 10–30%. When the area of recessed green space reaches 30%, it can store extreme rainstorms that occur once every three or five years [35]. (3) Adopt the measure of combining porous bricks and greening methods to increase the permeable area of the city. Studies have shown that when the proportion of permeable area is increased from 10% to 90%, the total storm surface runoff drops from 88.05% to 43.85% [36]. The combination of the above three measures, adapted to the local conditions, can better abate the storm water runoff and reduce the risk of urban flooding disaster in the main urban area. In addition, in order to cope with extreme rainfall, the regulation and storage of rivers and reservoirs in the main urban area and its surrounding areas should be conducted well, and early warning should be given to enhance the ability to cope with extreme rainfall. The implementation of the above engineering measures and early warning measures can effectively reduce the chances of flooding and promote the construction of a safer, more harmonious and livable urban environment as well as the realization of coordinated and sustainable development of the economy, society, and environment.

5. Conclusions

In this study, surface runoff under extreme rainfall conditions since 2005–2023 in Zhengzhou City was simulated based on the SCS-CN model, and the results showed that under extreme rainfall conditions, the average annual extreme rainfall in the study area was 95.6 mm, the average annual surface runoff was 76.5 mm, and the frequency of extreme rainfall mainly ranged from 0 to 3 times per year. During this period, cropland contributed the most to surface runoff in the study area, with a contribution rate of more than 50%, which indicates that cropland has an important influence on surface runoff. However, under the same rainfall conditions (110 mm), the surface runoff from urban and built-up land was 1.4–2.5 times higher than that of all kinds of forest land and grassland, which indicates that urban and other built-up land has a greater potential for generating surface runoff, which results in the surface runoff from the main urban area being larger than that from the surrounding urban areas, despite the fact that rainfall was less than that from the surrounding urban areas. Since 2005–2020, the area of urban and other built-up land increased by 104.13%, and the area of forest and grassland decreased by 35.90% in different administrative regions, indicating that the surface runoff potential of the study area increased during this period. Similarly, the DRS values in most of the districts showed a decreasing trend from 2005 to 2020, indicating a decrease in the surface’s ability to contain water. In order to reduce the risk of urban waterlogging, most areas of Zhengzhou City, especially the main urban area, should rationally adjust land use types and increase forest and grass cover to reduce surface runoff potential. This study is helpful in the rational planning of urban land use and in promoting the sustainable development of urban environment.

Author Contributions

Methodology, Y.W.; software, Y.W.; resources, S.L.; data curation, S.L.; writing—original draft, Y.W.; writing—review & editing, S.L., C.H., J.R., P.L., C.Z. and M.Z. All authors have read and agreed to the published version of the manuscript.

Funding

This study was supported by Basic Scientific Research of Henan Academy of Sciences (240601083) and Joint Fund of Henan Province Science and Technology R&D Program (225200810047) and Scientific and Technological Research Project of Henan Province (242102320227).

Data Availability Statement

The original contributions presented in the study are included in the article, further inquiries can be directed to the first author.

Conflicts of Interest

The authors declare no conflict of interest.

References

  1. Peters, G.P.; Andrew, R.M.; Boden, T.; Canadell, J.G.; Ciais, P.; Le Quéré, C.; Marland, G.; Raupach, M.R.; Wilson, C. The challenge to keep global warming below 2 °C. Nat. Clim. Change 2013, 3, 4–6. [Google Scholar] [CrossRef]
  2. Donat, M.G.; Lowry, A.L.; Alexander, L.V.; O’gorman, P.A.; Maher, N. More extreme precipitation in the world’s dry and wet regions. Nat. Clim. Change 2016, 6, 508–513. [Google Scholar] [CrossRef]
  3. Liao, H.; Xie, P. The roles of short-lived climate forcers in a changing climate. Clim. Change Res. 2021, 17, 685–690. [Google Scholar]
  4. Pal, I.; Al-Tabbaa, A. Trends in seasonal precipitation extremes—An indicator of ‘climate’ change in Kerala, India. J. Hydrol. 2009, 367, 62–69. [Google Scholar] [CrossRef]
  5. Held, I.M.; Soden, B.J. Robust responses of the hydrological cycle to global warming. J. Clim. 2006, 19, 5686–5699. [Google Scholar] [CrossRef]
  6. Lenderink, G.; Van Meijgaard, E. Increase in hourly precipitation extremes beyond expectations from temperature changes. Nature Geosci. 2008, 1, 511–514. [Google Scholar] [CrossRef]
  7. Camorani, G.; Castellarin, A.; Brath, A. Effects of land-use changes on the hydrologic response of reclamation systems. Phys. Chem. Earth Parts A/B/C 2005, 30, 561–574. [Google Scholar] [CrossRef]
  8. Brun, S.; Band, L.E. Simulating runoff behavior in an urbanizing watershed. Comput. Environ. Urban Syst. 2000, 24, 5–22. [Google Scholar] [CrossRef]
  9. Verbeiren, B.; Van De Voorde, T.; Canters, F.; Binard, M.; Cornet, Y.; Batelaan, O. Assessing urbanisation effects on rainfallrunoff using a remote sensing supported modelling strategy. Int. J. Appl. Earth Obs. Geoinf. 2013, 21, 92–102. [Google Scholar]
  10. Fahy, B.; Brenneman, E.; Chang, H.; Shandas, V. Spatial analysis of urban flooding and extreme heat hazard potential in Portland, OR. Int. J. Disaster Risk Reduct. 2019, 39, 101117. [Google Scholar] [CrossRef]
  11. Chen, P.; Zhao, H.; Zhang, J.; Zhang, S.; Bao, J.; Liu, X. Assessment Method and Empirical Study on the Population Affected by Urban Waterlogging Disaster: Daoli District of Harbin as an Example. Geogr. Sci. 2020, 40, 158–164. [Google Scholar]
  12. Cao, J.; Yang, Y.; Guo, J.; Chen, J. Spatiotemporal Differentiation of Short-Duration Rainstorm Pattern and Its Influence on Urban Waterlogging in Tianjin. J. Meteorol. Environ. 2021, 37, 114–121. [Google Scholar]
  13. Zhengtao, Z.; Chao, G.; Qing, L. Risk Assessment on Storm Flood Disasters of Different Return Periods in Huaihe River Basin. Geography Study 2014, 33, 16–19. [Google Scholar]
  14. Burns, M.J.; Schubert, J.E.; Fletcher, T.D.; Sanders, B.F. Testing the impact of at-source stormwater management on urban flooding through a coupling of network and overland flow models. Wiley Interdiscip. Rev. Water 2015, 2, 291–300. [Google Scholar] [CrossRef]
  15. Roesner, L.A.; Nichandros, H.M.; Shubinski, R.P.; Feldman, A.D.; Abbott, J.W. A model for evaluating runoff-quality in metropolitan master planning. Hydrol. Eng. Cent. Tech. Pap. 1974, 234–312. [Google Scholar]
  16. Lemke, D. Urban Interface Area model—Linking stormwater management and planning controls. Aust. Plan. 2009, 46, 14–15. [Google Scholar] [CrossRef]
  17. Tobio, J.A.S.; Maniquiz-Redillas, M.C.; Kim, L.H. Optimization of the design of an urban runoff treatment system using stormwater management model (SWMM). Desalin. Water Treat. 2014, 53, 1–8. [Google Scholar]
  18. Ponce V, M.; Hawkins R, H. Runoff curve number: Has it reached maturity? J. Hydrol. Eng. 1996, 1, 11–19. [Google Scholar] [CrossRef]
  19. Verma, S.; Singh, P.K.; Mishra, S.K.; Singh, V.P.; Singh, V.; Singh, A. Activation soil moisture accounting (ASMA) for runoff estimation using soil conservation service curve number (SCS-CN) method. J. Hydrol. 2020, 589, 125114. [Google Scholar] [CrossRef]
  20. Boughton, W.C. A review of the USDA SCS curve number method. Soil Res. 1989, 27, 511–523. [Google Scholar] [CrossRef]
  21. Huang, M.B.; Gallichand, J.; Wang, Z.L.; Goulet, M. A modification to the soil conservation service curve number method for steep slopes in the Loess Plateau of China. Hydrol. Process. 2006, 20, 579–589. [Google Scholar] [CrossRef]
  22. Fu, S.; Wang, X.; Wang, H.; Wei, X.; Yuan, A. Method of Determining CN Value in the SCS-CN Model. Arid Land Geogr. 2012, 35, 415–421. [Google Scholar]
  23. Du, S.; Guo, X.; Rong, Y. Study on the Water Conservation Function Based on Budyko Hypothesis and SCS-CN Method in the Headstream Area of the Qinhe Basin. Res. Soil Water Conversat. 2018, 25, 147–152. [Google Scholar]
  24. Li, X.; Zhang, G.; Gao, J.; Gao, Z.; Ma, H.; Feng, B.; Ma, L. Effects of Gully Land Consolidation Project on CN in Catchments with Different Vegetation Coverage. Bull. Soil Water Conserv. 2021, 41, 54–60. [Google Scholar]
  25. Bao, X.; Jiang, Y.; Hu, Y.C. Characteristics of pollutant dynamics under rainfall-runoff events in the Chaohe River Watershed. Environ. Sci. 2021, 42, 3316–3327. [Google Scholar]
  26. Rose, S.; Peters, N.E. Effects of Urbanization on Streamflow in the Atlanta area (Georgia, USA): Acomparative Hydrological Approach. Hydrol. Process. 2001, 15, 1441–1457. [Google Scholar] [CrossRef]
  27. Coutu, G.W.; Vega, C. Impacts of Land Use Changes on Runoff Generation in the East Branch of the Brandywine Creek Watershed Using a GIS-based Hydrologic Model. Middle States Geogr. 2007, 40, 142–149. [Google Scholar]
  28. Ju, X.; Gao, X.; Li, W.; Han, L.; Mao, J. Effects of land use change on surface runoff in Beijing-Tianjin-Heibei urban agglomeration. Acta Ecol. Sin. 2020, 40, 1413–1423. [Google Scholar]
  29. Schleuss, U.; Wu, Q.; Blume H, P. Variability of Soils in Urban and Periurban Areas in Northern Germany. Catena 1998, 33, 255–270. [Google Scholar] [CrossRef]
  30. Pielke, S.; Roger, A. Land use and climate change. Science 2005, 310, 1625–1626. [Google Scholar] [CrossRef]
  31. Bernatzk, Y.A. The effect of trees on the urban climate. In Trees in the 21st Century; Academic Publishes: Berkhamster, UK, 1983; pp. 59–76. [Google Scholar]
  32. Zhang, B.; Xie, G.; Xue, K.; Wang, G.; Xiao, Y.; Zhang, C. Evaluation of rainwater runoff storage by urban green spaces in Beijing. Acta Ecol. Sin. 2011, 31, 3839–3845. [Google Scholar]
  33. Kirsi, H.K. Simulation of green roof test bed runoff. Hydrol. Process. 2016, 30, 250–262. [Google Scholar]
  34. Zhang, Q.; Miao, L.; Wang, X.; Liu, D.; Zhu, L.; Zhou, B.; Sun, J.; Liu, J. The capacity of greening roof to reduce stormwater runoff and pollution. Landsc. Urban Plan. 2015, 144, 142–150. [Google Scholar] [CrossRef]
  35. Zhu, Y.J.; Bi, B.X.; Chang, Y.F.; Hai, X. Runoff reduction effect of sunken lawn under different designed rainstorm intensity in Beijing area. Bull. Soil Water Conserv. 2015, 35, 121–124. [Google Scholar]
  36. Liu, W.; Chen, W.; Peng, C. Assessing the effectiveness of green infrastructures on urban flooding reduction: A community scale study. Ecol. Model. 2014, 291, 6–14. [Google Scholar] [CrossRef]
Figure 1. Study area map.
Sustainability 16 06980 g001
Figure 2. Land use types in the study area from 2000 to 2020 (a—paddy field, b—dry land, c—forest land, d—shrub land, e—open forest land, f—other forest land, g—high-coverage grassland, h—medium-coverage grassland, i—low-coverage grassland, j—river-canal, k—reservoir and pond, l—beach land, m—urban land, n—rural residential area, o—other construction land).
Sustainability 16 06980 g002
Figure 3. Extreme rainfall and surface runoff in Zhengzhou city from 2005 to 2020.
Sustainability 16 06980 g003
Figure 4. Extreme rainfall and surface runoff at different time intervals in the study area (GY—Gong Yi, DF—Deng Feng, XY—Xing Yang, SJ—Shang Jie, XM—Xin Mi, HJ—Hui Ji, ZY—Zhong Yuan, JS—Jin Shui, EQ—Er Qi, GC—Guan Cheng, XZ—Xin Zheng, ZM—Zhong Mou).
Sustainability 16 06980 g004
Figure 5. Surface runoff and its contribution from different land use types at different time periods in the study area (AL—arable land, FL—forest land, GL—grassland, WA—water area, URO—urban, rural and other construction land).
Sustainability 16 06980 g005
Figure 6. Rainfall, runoff, and the proportion of different land use types in different administrative districts of Zhengzhou under different rainfall events (GY—Gong Yi, DF—Deng Feng, XY—Xing Yang, SJ—Shang Jie, XM—Xin Mi, HJ—Hui Ji, ZY—Zhong Yuan, JS—Jin Shui, EQ—Er Qi, GC—Guan Cheng, XZ—Xin Zheng, ZM—Zhong Mou).
Sustainability 16 06980 g006
Figure 7. Different slopes and land use types in study area (a—paddy field, b—dry land, c—forest land, d—shrub land, e—open forest land, f—other forest land, g—high-coverage grassland, h—medium-coverage grassland, i—low-coverage grassland, j—river-canal, k—reservoir and pond, l—beach land, m—urban land, n—rural residential area, o—other construction land).
Sustainability 16 06980 g007
Figure 8. The water conservation capacity of different regions in different time periods in the study area (GY—Gong Yi, DF—Deng Feng, XY—Xing Yang, SJ—Shang Jie, XM—Xin Mi, HJ—Hui Ji, ZY—Zhong Yuan, JS—Jin Shui, EQ—Er Qi, GC—Guan Cheng, XZ—Xin Zheng, ZM—Zhong Mou. T1—(2005–2008), T2—(2009–2012), T3—(2013–2016), T4—(2017–2020)).
Sustainability 16 06980 g008
Figure 9. The area percentage of land use types in different regions at different time periods in the study area (AL—arable land, FL—forest land, GL—grassland, UO—urban and other construction land, RS—rural settlements, WA—water area).
Sustainability 16 06980 g009
Table 1. Soil hydrological combination types.
Soil TypeHydrological Combination TypeSoil TypeHydrological Combination Type
Brown soilCMeadow aeolian soilA
Cinnamon soilCSkeletol soilC
Calcareous cinnamon soilCFluvo-aquic soilC
Leached cinnamon soilCDe-fluvo-aquic soilC
Developed cinnamon soilDAlkaline fluvo-aquic soilC
Cultivated loessial soilBIrrigated fluvo-aquic soilC
Alluvial soilAResidential areaD
Table 2. CN values under different land use types and soil hydrological combinations.
Land Use TypeABCD
CNICNIICNIIICNICNIICNIIICNICNIICNIIICNICNIICNIII
Paddy field436480567587668291708593
Dry land416279517185607889648191
Forest land153050345574497084587789
Shrub land193656396078537386617990
Open forest land264565456682587789678392
Other forest land244363446581577688668291
Grassland294969486984617990698492
River-canal100100100100100100100100100100100100
Reservoir and pond100100100100100100100100100100100100
Beach land100100100100100100100100100100100100
Urban land587789708593799095839296
Rural residential area305171476883617990698492
Other construction land648191758894819196859397
Table 3. Location and coordinates of meteorological stations in the study area and its surrounding areas.
LocationX/°Y/°LocationX/°Y/°
Gongyi112.9734.73Yuanyang113.9535.05
Xingyang113.4334.80Mengjin112.4334.83
Dengfeng113.0334.45Mengzhou112.7834.92
Zhengzhou113.6534.72Yichuan112.4234.42
Xinmi113.2234.33Ruzhou112.8334.18
Xinzheng113.7334.40Wenxian113.1034.95
Zhongmou114.0234.72Yuzhou113.5034.15
Fengqiu114.4235.03Weisi114.2034.40
Wuling113.4035.10
Table 4. Surface runoff of different land use types in Zhengzhou City under 110 mm rainfall conditions in 2020.
Land Use TypeRunoff (mm)Land Use TypeRunoff (mm)
Paddy field62Low coverage grassland58
Dry land50River-canal110
Forest land41Reservoir and pond110
Shrub land37Beach land110
Open forest land45Urban land81
Other forest land33Rural residential area50
High-coverage grassland46Other construction land81
Medium-coverage grassland54
Table 5. Surface runoff under different slopes.
Slope20 July 2021
Runoff (mm)
28–30 September 2023
Runoff (mm)
Area Percentage of Dryland, Forest Land, and Grassland (%)Area Percentage of Urban Land and
Other Construction Land (%)
<5°271.169.26216
5°–8°257.566.3844
8°–15°251.262.1873
15°–25°237.460.2931
25°–35°190.253.4980
>35°159.445.61000
Disclaimer/Publisher’s Note: The statements, opinions and data contained in all publications are solely those of the individual author(s) and contributor(s) and not of MDPI and/or the editor(s). MDPI and/or the editor(s) disclaim responsibility for any injury to people or property resulting from any ideas, methods, instructions or products referred to in the content.

