4.1. Prediction Performance
To ensure the accuracy of the experiment, this paper divides the data into a training set and test set according to the ratio of 8:2. Besides BRR, the performances of several other meta-models are compared, including linear regression (LR), neural network (ANN) and ridge regression. We conducted experiments on ESG, E score, S score, and G score. The results show that the performance of different meta-models is different in different scoring dimensions, but in general, SGM-BRR performs well in many indicators, especially in R
2. The results are shown in
Table 4.
Subsequently, a random sample is drawn from the specified hyperparametric space to identify the optimal parameter combination for SGM-BRR and the remaining seven models. In comparison to the conventional grid search approach, the random search method allows for the investigation of a greater number of parameter combinations within the same computational constraints, thereby enhancing the likelihood of identifying the optimal parameters. In the case of RF, XGBoost, GBDT, and LightGBM, the number of estimators and the maximum depth are subject to adjustment. In the process of parameter adjustment for SGM-BRR, the primary variables that are subject to modification are the number of iterations and the regularization parameters alpha_1, alpha_2, lambda_1, and lambda_2 of BRR. The search range is set to the interval (100, 500). Regarding the neural network, two parameters are primarily subject to alteration: the number of network layers and the number of neurons in each layer. To assess the efficacy of each parameter combination, we employ cross-validation, whereby the average score of the model on the validation set is calculated by randomly dividing the training set and validation set on numerous occasions [
43]. Ultimately, the parameter combination with the highest verification score is identified as the optimal parameter. The parameter settings are presented in
Table 5. Subsequently, the optimized model is validated on the test set, and the results are presented in
Table 6.
As illustrated in
Table 6, SGM-BRR has an RMSE value of 3.4706, an MAE value of 2.5081, and an R
2 value of 0.8193 in ESG score prediction. In comparison to other benchmark models, the RMSE and MAE values exhibit a reduction of 0.184 and 0.154, respectively. The R
2 value exhibits an average increase of 2%. With respect to the environment, the RMSE and MAE values of SGM-BRR exhibit a reduction of 0.173 and 0.184, respectively. The R
2 increases by an average of 1.4%. With respect to the social aspect, the RMSE and MAE values exhibit a decrease of approximately 0.137 and 0.158, respectively. The R
2 value increases by approximately two percent on average. Regarding the domain of governance, the RMSE and MAE values exhibit a decline, with reductions of 0.761 and 0.684, respectively. The R
2 value increases by approximately six percent. These findings demonstrate that the integration of multiple models and the comprehensive utilization of their respective advantages can effectively address non-linear relations and capture the interaction of features. The introduction of a penalty term into the optimization objective of Bayesian Ridge Regression serves to mitigate the potential for the prediction error of a single basic model to exert an excessive influence on the overall result. This method not only enhances the stability of the predictive model, but also improves its adaptability to different data distributions.
In practical application, enterprises may utilize SGM-BRR to enhance the efficacy of their investment decision-making processes and ESG reporting frameworks. SGM-BRR assists enterprises in more accurately evaluating the environmental awareness, social responsibility performance, and governance ability of potential investment targets. This is achieved by providing more precise score predictions. To comprehensively evaluate the sustainability of enterprises, reduce investment risks, and improve the rate of return, it is necessary to employ a methodology that can provide accurate and reliable data. In the context of ESG reporting, the use of more accurate ESG score prediction enables enterprises to more effectively disclose their environmental, social, and governance performance, enhance the accuracy and consistency of the report, and strengthen the confidence of investors. Consequently, incorporating SGM-BRR into the investment decision-making process and ESG reporting framework can not only enhance the scientific and rational basis of investment decisions, but also reinforce the credibility of ESG reporting, thereby enhancing the sustainable development capabilities of enterprises.
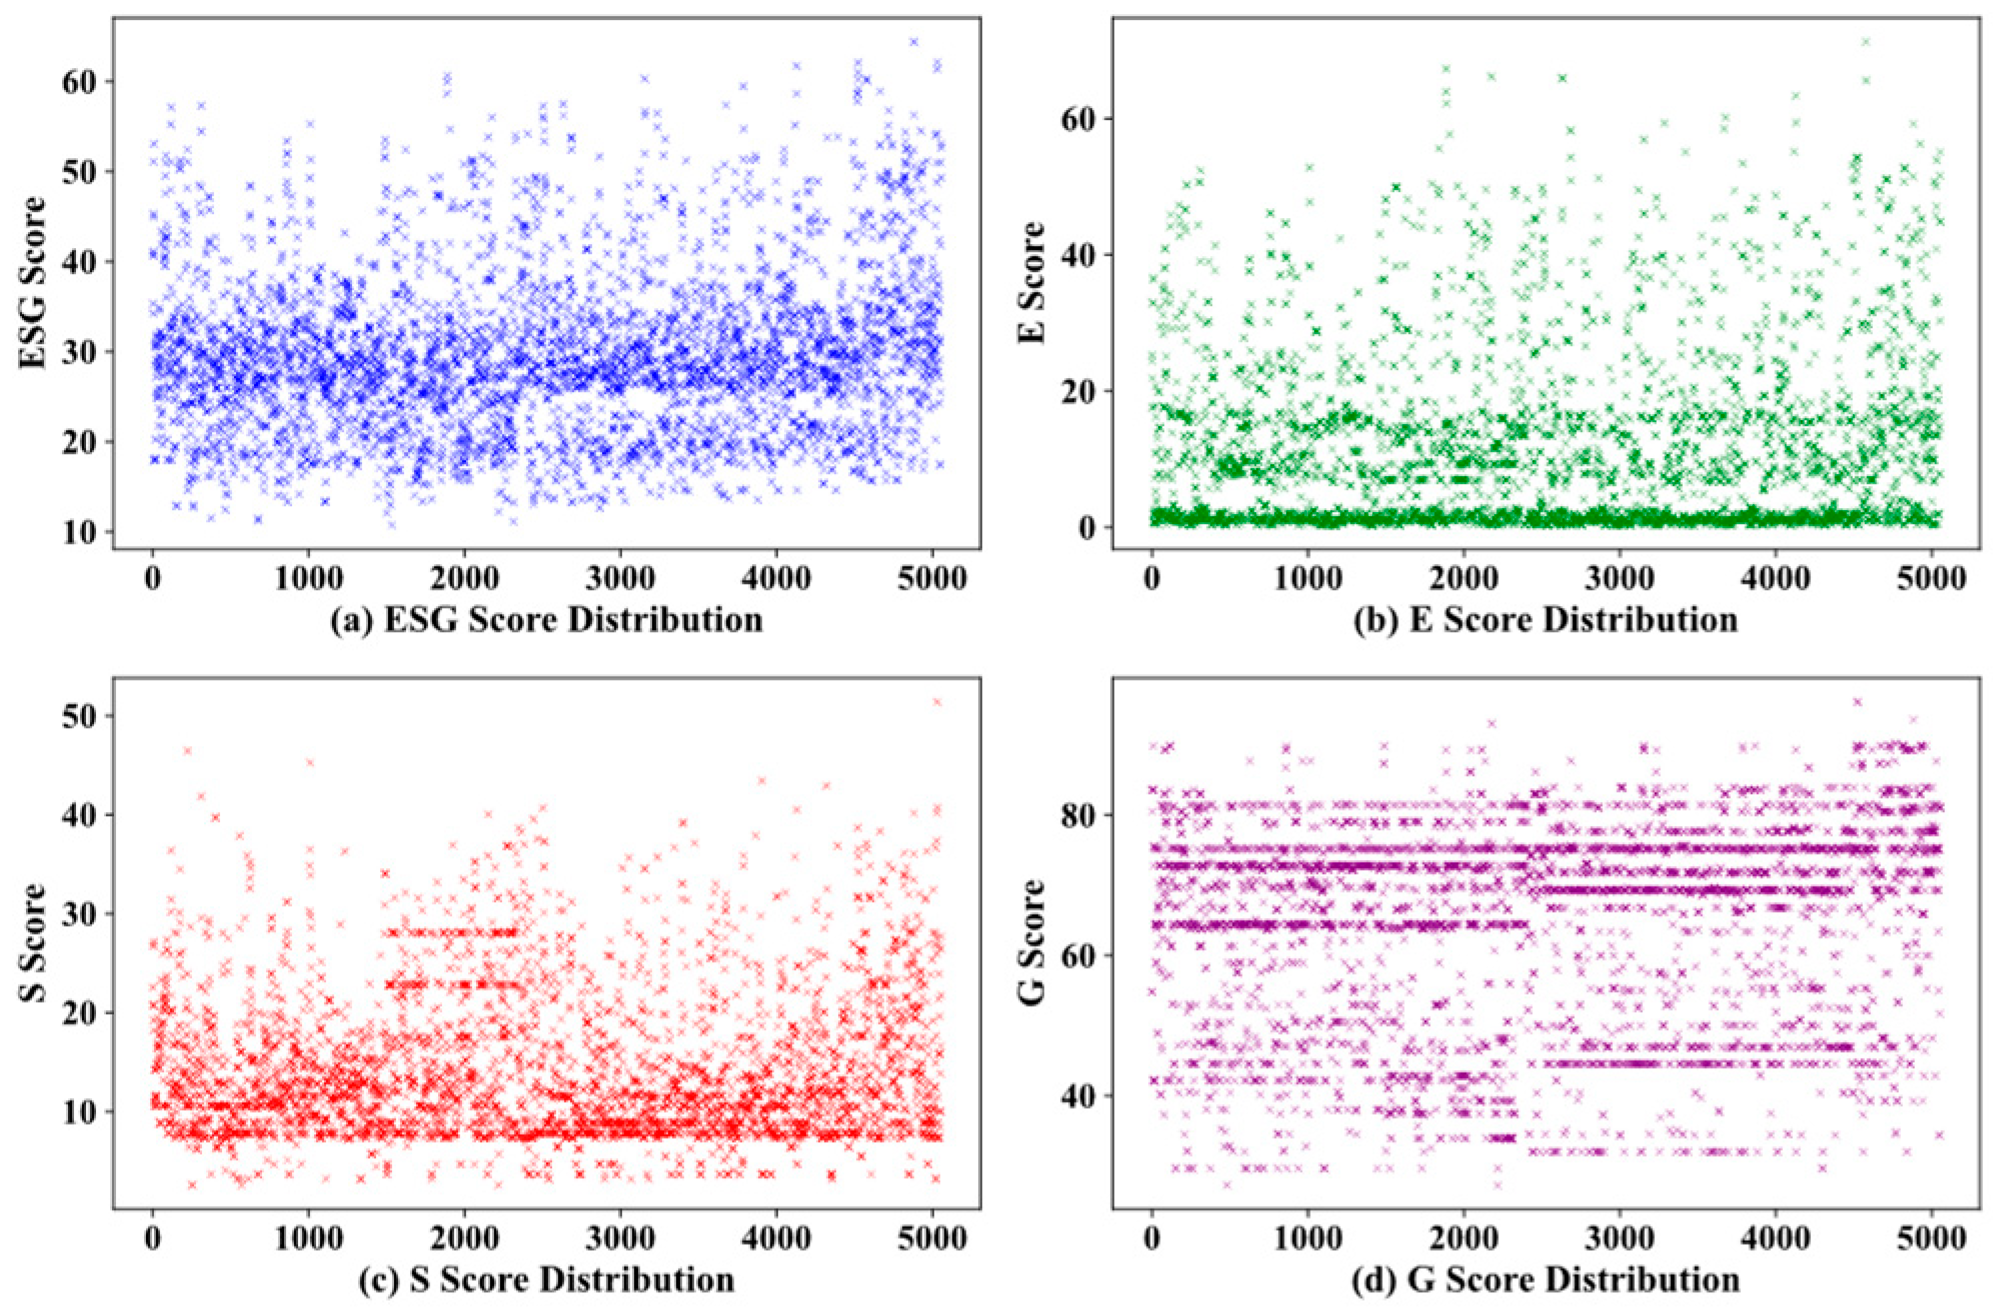
Scatter plots were generated for the ESG, E, S, and G prediction scores, as illustrated in
Figure 5. Each scatter point represents a sample point. The abscissa represents the true value, while the ordinate represents the predicted value. The solid red line represents the scenario in which the predicted result is identical to the true value. The greater the degree of concentration of the scattered points around the red line, the closer the predicted value is to the true value. This is to say that the value of r is closer to 1. As illustrated in
Figure 5, the RMSE of SGM-BRR for the ESG score is 3.4706, MAE is 2.5081, and R
2 is 0.8193. These values demonstrate that the model exhibits high accuracy, a minimal discrepancy between the predicted and actual values, and a concentration of scattered points around the red line, indicating an optimal fitting effect. In the environmental dimension, the RMSE of SGM-BRR is 5.4704, MAE is 3.4329, and R
2 is 0.7771. Although the error is slightly larger than that observed in the ESG score, SGM-BRR demonstrates excellent performance in capturing the variation of environmental data and produces more stable and accurate prediction results than other models. In the social dimension, the RMSE of SGM-BRR is 3.1883, MAE is 2.0388, and R
2 is 0.7697, indicating a high degree of accuracy in prediction. Fluctuations are evident in the sample data of the social dimension; however, the model demonstrates an ability to fit these data well. In the governance dimension, the RMSE of SGM-BRR is 7.1270, MAE is 4.6450, and R
2 is 0.7447. Due to the significant disparity in governance samples, the predictive efficacy is not as pronounced as in other domains. Nevertheless, SGM-BRR demonstrates a clear advantage over other models in addressing the intricacies and ambiguity inherent in governance data.
4.2. Further Analyses
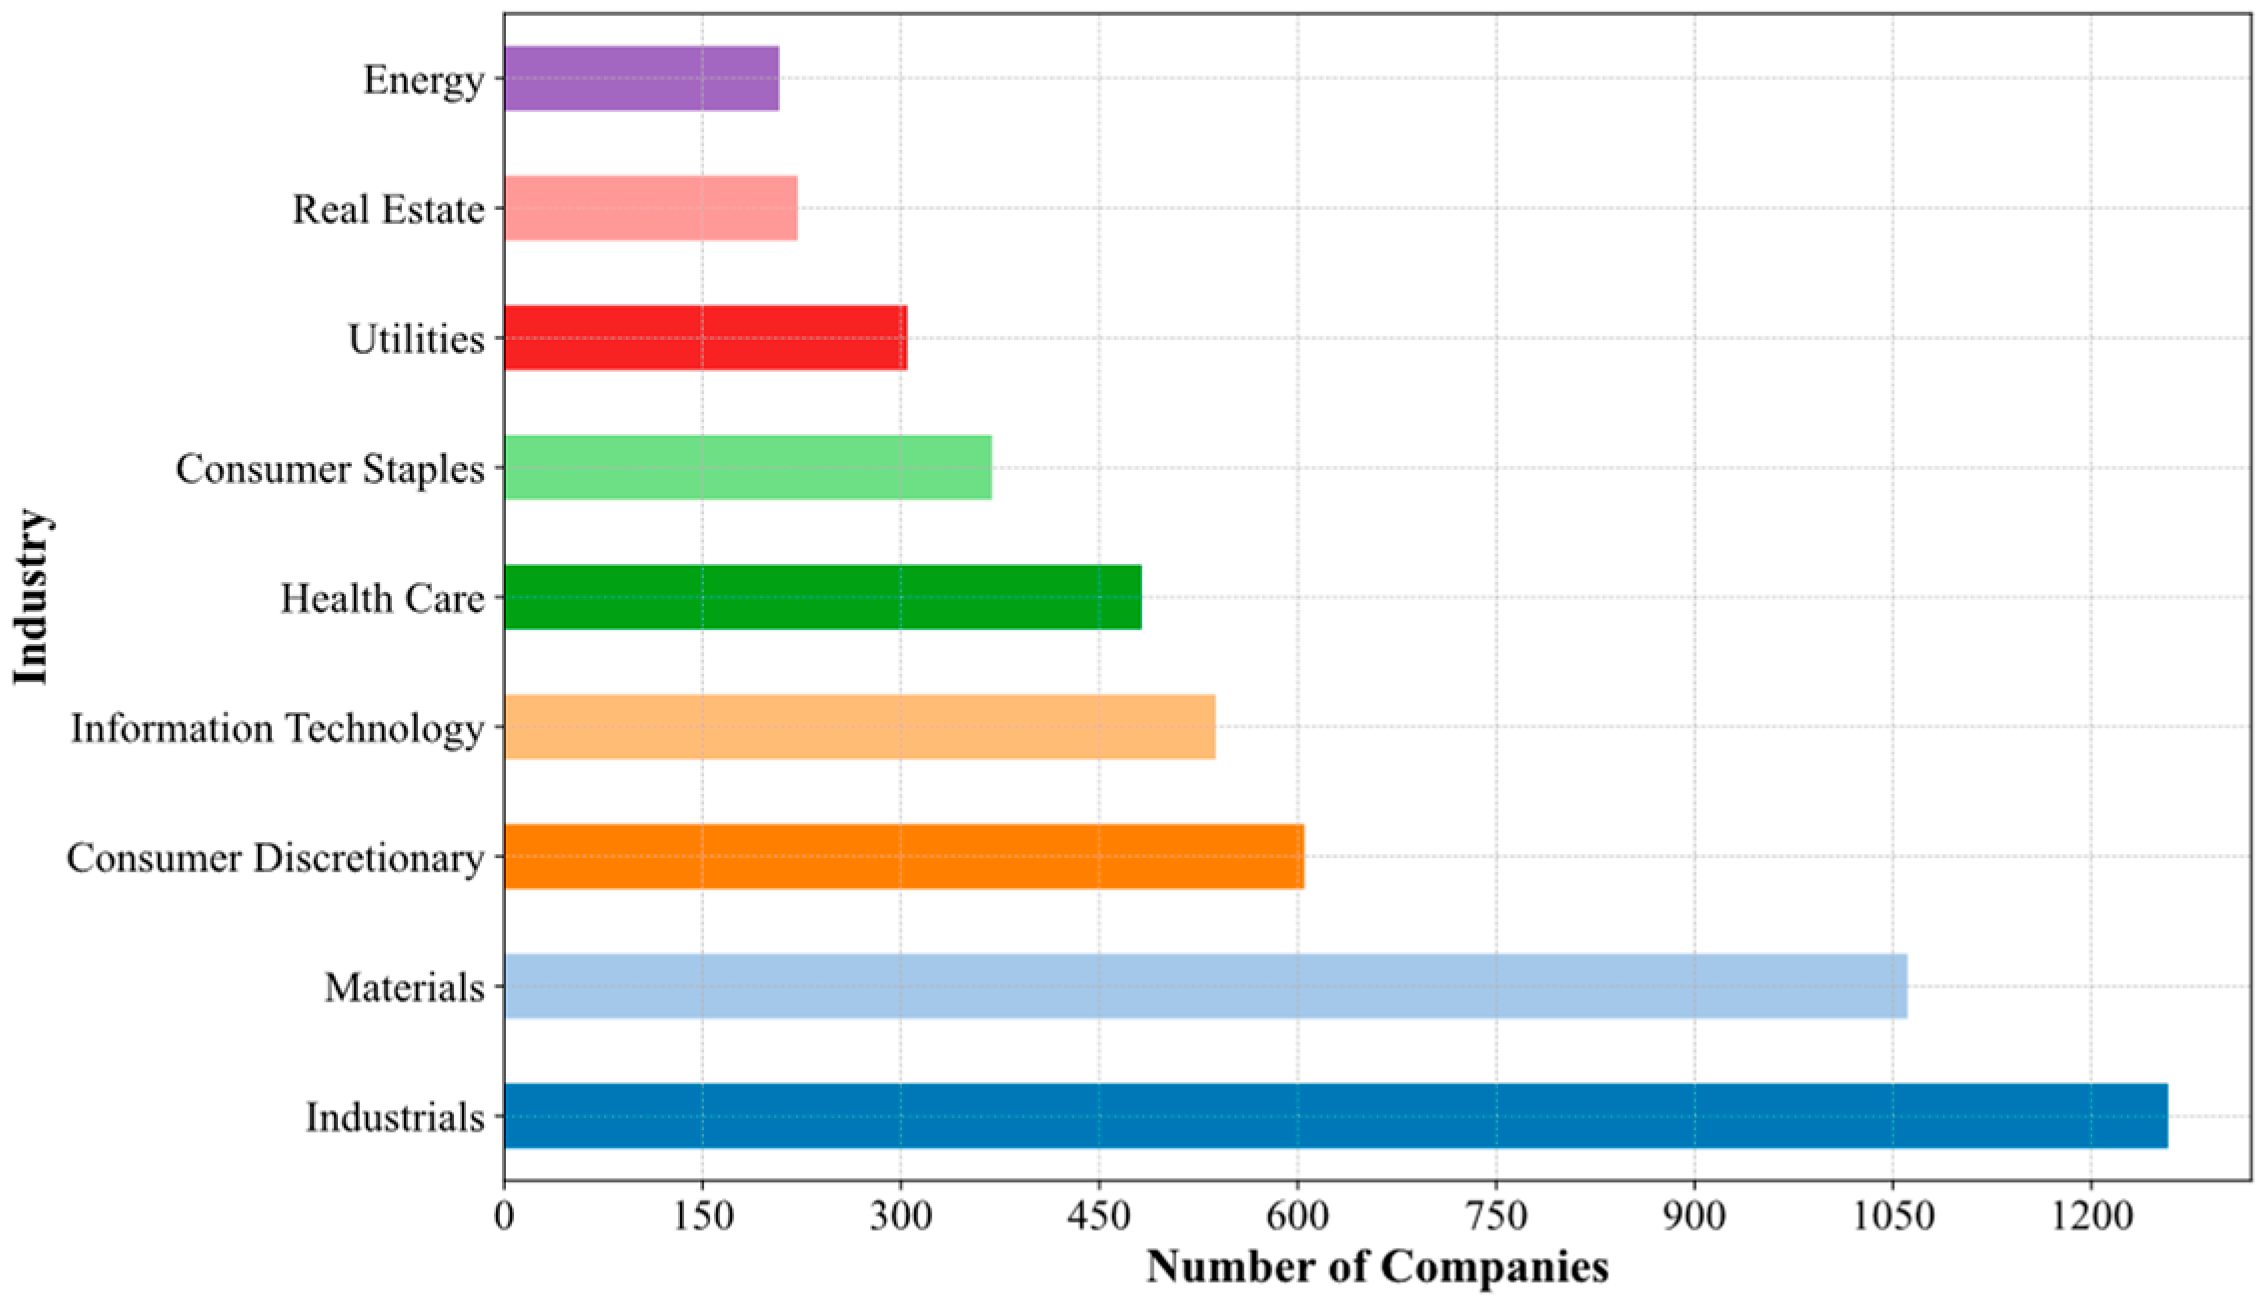
The objective of this study is to analyze the performance of different models in predicting the company’s overall ESG score and its E, S, and G dimension scores. The results demonstrate that SGM-BRR outperforms other ensemble models and deep learning models in multiple evaluation indicators, exhibiting excellent prediction performance. To further verify the effectiveness of our model and provide more in-depth analysis, given the disparate environmental, social, and governance concerns encountered by various industries, the variables influencing ESG scores will also vary. Consequently, the performance of distinct models in forecasting corporate ESG scores across diverse industries will be investigated. Enterprises were divided according to the CIGS classification standards, and enterprises with less than 100 samples were excluded. Ultimately, nine industry classifications were retained, and the data set was divided at a ratio of 8:2 for model fitting. Comparative analysis of the performance of various models in terms of ESG, E, S, and G scores across different industries is conducted, which illustrates the correlation between the predicted values of all models and the actual values observed in the test sets of various industries. As illustrated in
Figure 6,
Figure 7,
Figure 8 and
Figure 9, each subgraph depicts the index results of ESG, E, S, G score obtained by distinct enterprises.
As can be seen from
Table 7, there are significant differences in the predictive effectiveness of the different models in each industry under the four dimensions of ESG, E, S, and G.
In the ESG dimension, SGM-BRR performs best in all industries with an optimal RMSE, MAE, and R2. The integrated model does not perform well in most industries, while SGM-BRR is more stable across industries. Especially in the energy sector, SGM-BRR has an RMSE of 3.2937, MAE of 2.4409, and R2 of 0.8971, which reduces the RMSE and MAE by about 1.2366 and 1.062 on average and improves R2 by an average of 10.89% compared to the other models. Although the improvement in R2 is not as high as in the real estate and health care sectors, the energy sector has the highest R2 of any sector, indicating that the model adapts well to the data characteristics of the energy sector. In contrast, the consumer staples industry does not have a significant forecast boost, with an RMSE of 4.3355, MAE of 2.5240, and R2 of 0.6669, but it is still better than the other models. This may be due to the higher volatility and non-linear characteristics of data in the consumer staples industry, which poses a higher challenge to the model.
In the E dimension, SGM-BRR performs best on all metrics in the materials, industrial, energy, information technology, and health care industries. Especially in the energy industry, SGM-BRR has an RMSE of 5.9769 and R2 of 0.8246, which is the highest optimization among all industries compared to the other models, with an average reduction of 1.2366 in RMSE and an average improvement of 6.98% in R2. The MAE is 4.3561, which is an average reduction of 0.5326 compared to the other models and is second only to health care’s 0.5573. This indicates that SGM-BRR captures energy-consumption-related features better in ESG and E dimensions.
In the S dimension, SGM-BRR performs best in all indicators in the real estate, industrial, utilities, and consumer staples industries. SGM-BRR’s RMSE in the utilities industry is 3.8377, with the highest optimization margin of the indicator among all industries, at 0.5169; the energy industry’s MAE is 2.1004, with the highest optimization margin of the indicator among all industries at 0.3599; and the R2 in the real estate sector is 0.6258, with the highest optimization margin among all sectors at 11.15%. These results indicate that SGM-BRR excels in capturing the social characteristics of these industries.
In the G dimension, SGM-BRR performs best in the materials, real estate, utilities, energy, information technology, and consumer staples industries. In the real estate industry, SGM-BRR has an RMSE of 7.2681 and R2 of 0.7229, which is the highest optimization among all industries with an average reduction of about 3.343 in RMSE and an average improvement of 37.20% in R2 compared to other models. The MAE is 5.2091, which is an average reduction of 2.4640 compared to the other models and is second only to energy’s 2.6271. In contrast, other models such as LSTM and RNN show more fluctuating performance in the S and G dimensions, failing to show a consistent advantage and a negative R2.
Nevertheless, in the consumer goods industry, due to the high volatility and non-linear characteristics of data, the improvement in prediction accuracy of the model is not readily apparent. This indicates that caution should be exercised when dealing with high-volatility industry data. Overall, SGM-BRR has excellent prediction results under multiple industries and multiple dimensions. There are 36 experimental results in total, and SGM-BRR has 27 optimal results in RMSE and R2 indicators, and 25 optimal results in MAE indicators. Taken together, SGM-BRR is optimal in 24 results for RMSE, MAE, and R2. This further indicates that the model has stronger stability and generalization ability. Therefore, the results of this experiment further illustrate that the model proposed in this paper has stronger stability and generalization ability. Through these analyses, it can provide a powerful reference for enterprises in choosing the appropriate forecasting model and help them to achieve more accurate forecasts in different dimensions.
Figure 6 illustrates the fitting results of ESG scores for all models in various industry test sets. Compared to other benchmark models, SGM-BRR demonstrates the most favorable fitting effect across diverse industries, indicating that the model exhibits robust generalization and stability in ESG score prediction across all industries. Notably, in the domains of energy, materials, and industry, the fitting of sample data is closer to the diagonal, exhibiting a clear advantage over other industries. This indicates that SGM-BRR exhibits robust feature extraction capabilities in these domains. Notably, the R
2 value for the energy industry is 0.8971, which is a noteworthy achievement. Furthermore, the RMSE value for the SGM-BRR model is the lowest across all industries. Additionally, the MAE value for the real estate industry is also the lowest among all models.
Figure 7 shows the fitting results for the E score for each industry-based test set. In terms of E score prediction, although SGM-BRR maintains the best prediction performance in most industries, in the real estate, public utilities, and consumer goods industries, the GRU and RNN show better prediction results. This may be due to the unique advantages of these models in processing time series data and capturing long-term dependencies, making them more effective in industry-specific forecasts. Moreover, in the energy industry of the environmental dimension, SGM-BRR still performs best, with an RMSE of 5.9769, MAE of 4.3561, and R
2 of 0.8246. It is evident that there is a discrepancy between the model’s predicted values and the actual values of ESG scores and E scores. In comparison to other models, the prediction results of the deep learning model exhibit considerable fluctuations across different industries. This is because the depth model necessitates a substantial quantity of data. SGM-BRR has demonstrated the most favorable outcomes in most industries.
Figure 8 and
Figure 9 show the fitting results on S score and G score for each industry-based test set. The gap between the predicted and true values of different models is shown. In the prediction of S score, SGM-BRR shows the best prediction effect in the materials, real estate, industrial, public utilities, and consumer staples industries. In the optional consumer and health care industries, the GRU has the best overall performance, and the best model in the information technology industry is LSTM. The analysis results in the energy industry show that the XGBoost has the best performance. These differences reflect the adaptability of each model to specific data structures and industry characteristics. For the prediction of G score, SGM-BRR has demonstrated excellent prediction performance in all other industries except the industrial and health care industries, highlighting its advanced ability in analyzing multi-dimensional data.
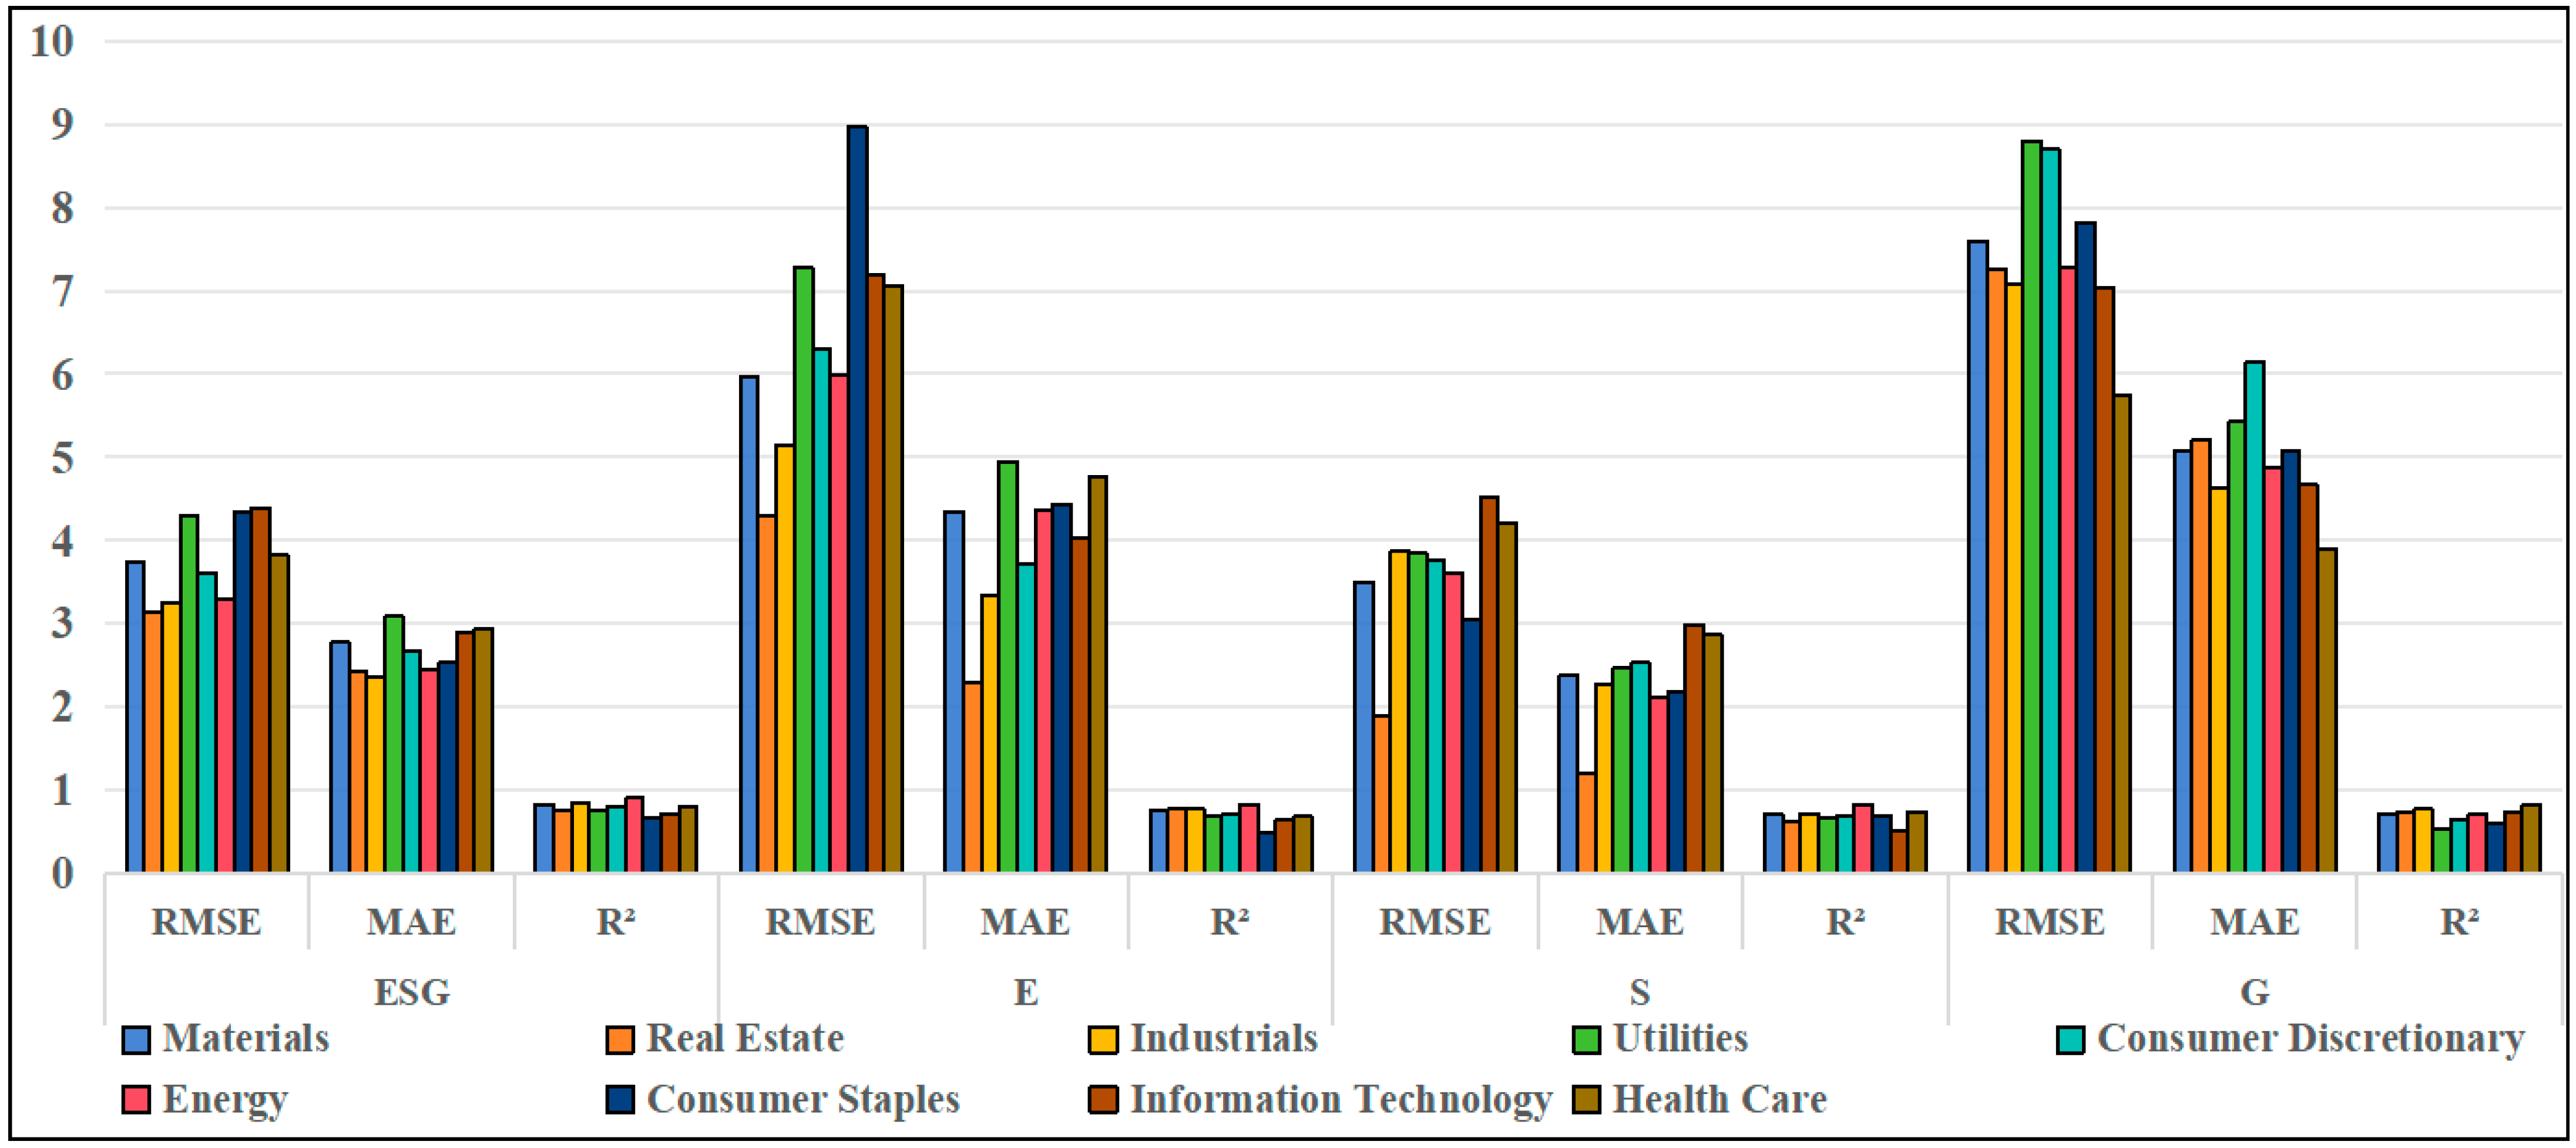
Figure 10 shows the experimental results of SGM-BRR. It shows the result histogram of MAE, RMSE, and R
2 in different industries with different scoring dimensions. From the figure, we find that the value of RMSE is the largest in the environmental score and has lower values in the ESG and governance dimensions. MAE has lower values in the ESG and social dimensions, and higher values in the governance dimension. RMSE has the lowest value among social scores, especially in the real estate industry. There is no obvious difference in R
2, indicating that the model has no obvious difference in scoring fitting in different dimensions in different industries and has strong generalization ability.
As show in
Figure 10, the RMSE, R
2, and MAE indicators of SGM-BRR in predicting ESG and E scores in nine industries are better than the other models, highlighting the superiority of its comprehensive performance. Especially in the energy field, the SGM-BRR RMSE value is 3.2937, MAE is 2.4409, and R
2 is 0.8971. Compared with the other models, the RMSE and MAE are reduced by about 1.2366 and 1.062 on average, respectively, and the R
2 is increased by 1.9%, indicating that SGM-BRR has a strong ability to capture and learn the characteristics of the industry. Secondly, its performance in the industrial field is also very outstanding, with an RMSE of 3.2426, MAE of 2.3452, and R
2 of 0.8467. Compared with the other models, the RMSE and MAE are reduced by about 0.3426 and 0.2964, respectively, on average, and the R
2 is increased by about 0.0321. It reflects the good adaptability of the model to the characteristics of data in the industrial field. In contrast, the forecast effect of the consumer staples industry is weaker, with an RMSE value of 4.3355, an MAE value of 2.5240, and an R
2 of 0.6669, but it is still better than the other models. This may be because the consumer staples industry data have strong volatility and non-linear characteristics, which poses higher challenges to the model.
In summary, the integration of multiple base models, including RF, XGBoost, LightGBM, and GBDT, together with the use of Bayesian Ridge Regression as the meta-model in SGM-BRR, effectively combines the advantages of each base model, thereby improving prediction accuracy and generalization ability. Upon the examination of the experimental results, it can be observed that the prediction performance of SGM-BRR is superior to that of the baseline model in most industries. Regarding the comprehensive prediction of ESG scores, the performance of SGM-BRR is demonstrably superior in all industries. This not only corroborates the efficacy and dependability of SGM-BRR, but also underscores its remarkable adaptability in dealing with intricate and fluctuating data attributes and industry-specific nuances.


