1. Introduction
The manufacturing industry is increasingly focused on improving environmental sustainability and achieving net-zero emissions in their supply chain (SC), drawing significant attention from academia and industry [
1,
2]. The steady increase in GHG emissions has intensified climate change, leading to extreme weather events across the globe. To keep the global average temperature rising to less than 2 °C, it is essential to cut global CO
2 emissions by up to 80% by mid-century [
3]. Consequently, various practical strategies have been proposed to combat global climate change.
In developing economies, industries have been subjected to a lot of pressure from customers and stakeholders to move towards the zero-carbon SC [
4]. Carbon capture techniques (CCT) have been adopted by industries worldwide to address the alarming increase in carbon emissions, promoting environment-friendly growth. In recent times, for MSC globally, environmental sustainability has become one of the prime strategic objectives [
4,
5]. Although rapid industrial development has brought about massive economic progress and urbanization, it has also caused a series of environmental problems, such as high carbon emissions resulting in climate change/greenhouse effects [
6]. These problems led to a sense of urgency for business leaders and, thus, an important move toward sustainability [
7,
8,
9].
Achieving net zero across the entire SC is essential, and CCT is key to this [
10]. Nonetheless, the successful adoption of CCT depends on several factors. These include the CO
2 generation process, technical readiness to adopt capture methods, separation efficiency of CO
2, implementation costs, and the possibility of on-site or nearby storage locations. Although CCT has demonstrated that it is feasible, its widespread adoption is burdened by various problems. One of them is uncertain environmental impacts. It is necessary to assess the environmental impact throughout the whole chain of processes involved in CCT. This includes producing and destroying solvents, energy requirements for solvent regeneration, and CO
2 transportation energy consumption [
11].
LCA is used to evaluate these impacts comprehensively. Various CO
2 capture technologies have distinctive energy consumption and potential environmental impacts. While the principal objective is to reduce atmospheric GHG emissions, it is important that CCT does not bring other ecological problems either [
12]. A holistic view provided by LCA enables decision-makers to quantify and assess changes in the system performance that companies use to make their products; the crucial thing is that while GHG emissions are decreasing, other environmental impacts are not decreasing. In the last decade, the use of LCA has become widespread, aided by the International Organization for Standardization [
13].
Despite these benefits, LCA practices still need to be improved in developing countries due to a lack of advanced “infrastructure”, “complexities” in SC, and financial constraints [
14]. In India, the adoption and implementation of LCA in CCT are in their early stages because of lower technological maturity and the need to understand the benefits of these technologies [
15]. There is a need for LCA business models in emerging economies like India to address resource wastage and environmental issues [
16]. Adopting LCA technologies in MSC is crucial for enabling better resource management, improving “market competitiveness”, promoting “life cycle management”, and tracking waste throughout the SC. The LCA method offers new opportunities for the MSC in waste reduction, measuring environmental emissions, and decision-making [
17].
In this context, adopting CCT to promote net-zero practices in SC and LCA business models will benefit manufacturing industries. Therefore, identifying and integrating LCA enablers that support CCT business models in manufacturing industries will help to improve market competitiveness and enhance the overall effectiveness of SC business models.
The present study analyzes the prominent enablers of adopting the LCA method to support net-zero business models in MSC. In this study, an integrated method approach, using BWM and “F-DEMATEL”, to rank and find the cause-and-effect relationship among identified enablers. We addressed the following research objectives (RO) in this study are as:
RO1: To identify the prominent enablers of LCA adoption in MSC to achieve the net zero goal.
RO2: To develop a comprehensive framework for prioritizing key enablers of LCA in the MSC.
RO3: To assess the relative importance using causal interrelationships among the identified enablers.
The findings of the study, which distinguish it from other studies, include devising a framework for identifying and evaluating key enablers of LCA adoption in MSC. This framework aids in understanding the benefits of a NZSC business model. Further, the rest of the section of this study is organized as follows:
Section 2 discusses the literature review. In
Section 3, the details of the research methodology are discussed.
Section 4 discusses the data analysis and results.
Section 5 explores the discussion and contributions. Finally,
Section 6 addresses the conclusion, limitations, and future research direction.
2. Literature Review
In the present study, an SLR is conducted to identify opportunities and research gaps related to the net zero supply chain by using CCT and LCA methods. This section discusses the concepts of the LCA method in manufacturing and their benefits for achieving the net zero goal. The primary search of keywords in the databases is as: “Net zero supply chain”, AND “Manufacturing”, AND “Carbon capture”, AND “Life cycle assessment” was performed in three primary databases: “Scopus”, “Science Direct”, and “IEEE Xplore”. This study followed the review protocol for article selection, such as inclusion and exclusion criteria, and finally, 72 articles were selected for full-text review. The detailed procedure is presented in the PRISMA diagram in
Figure 1.
Manufacturing industries seek to balance the economic interests of stakeholders and environmental sustainability while delivering opportunities for a feasible business operation [
2]. Such issues require sustainable development and a gradual movement from economy-centered manufacturing to low-carbon production toward a zero-carbon society [
11]. True integration of SC activities is essential to achieve manufacturing strategic, tactical, and operational environmental sustainability objectives. Carbon capture is an important method for reducing emissions and increasing efforts to minimize environmental impact [
12]. Therefore, it is very important for SC to operate with carbon-efficient techniques.
The use of this kind of technique should also be applied within carbon-neutral operations in such a way that a net-zero emissions approach used or many of the economies have pledged to achieve net-zero carbon emission that refers to balancing the quantification and removal of human-caused greenhouse gas emissions (the CCT, fossil fuel substitution; low-carbon products design), increased focus in light metals production is driven by economic prosperity created with significant growth of heavy industry [
18]. China, for example, has a net-zero target of 2060, the USA in 2050, and India by as early as 2070 [
15].
Examine the influence of various carbon policies on SC decision-making. By developing a multi-product SC framework, the authors compare the impacts of carbon tax, cap-and-trade, and carbon emission policies on operational strategies. Their findings highlight the complexities of balancing economic objectives with environmental targets. The study contributes to understanding how different policy instruments shape SC configurations and emissions reduction efforts [
19].
2.1. Carbon Capture (CC): Basic Concept and Its Technology
Human activities have significantly increased GHG emissions, with CO
2 being the most significant contributor to climate change. The IPCC Sixth Assessment Report (2021) warns of the risks of global warming without substantial GHG reduction measures [
17]. Fossil fuel-based power generation remains the primary CO
2 emitter, and despite the development of clean energy sources like solar, wind, and hydro, these still need to meet global energy needs.
CC is crucial for reducing GHG emissions, enabling CO
2 to be utilized in hydrogen production, food processing, and enhanced oil recovery [
17]. While alternative energy research progresses, mitigating and using emitted carbon is essential for achieving a Net Zero future by 2050. Despite economic and technological challenges, CC provides a transitional solution for mitigating climate change as industries move toward low-carbon alternatives. The necessity of balancing increased fossil fuel consumption with GHG reduction makes CC vital for bridging this gap [
20].
The concept of CC involves technologies such as “Post-combustion CC”, “Pre-combustion CC”, and “Oxyfuel combustion” that capture CO2 during various stages of the supply chain, such as combustion. These technologies can be integrated into the manufacturing supply chain to capture residual emissions from energy-efficient processes.
Sepehriar and Eslamipoor (2024) [
20] comprehensively analyze the interplay between SC operations and environmental regulations. Their model, focusing on a single-vendor, single-buyer scenario, incorporates carbon emissions into inventory management decisions. By examining the impact of carbon tax and emission trading policies, the authors demonstrate the economic implications of these regulations on SC actors. This research significantly contributes to understanding how environmental considerations can be integrated into operational decision-making, providing valuable insights for practitioners and policymakers.
2.2. CCT and LCA: From MSC and Net Zero Perspective
CCT and LCA support upstream industrial supply chains towards net zero goals. This technology captures released carbon dioxide from industrial operations, such as those of cement and steel manufacturers, which stops it from being expelled into the atmosphere [
21,
22]. The best part is that this integration can be added to conventional manufacturing setups, making it a crucial intermediary for industries seeking cleaner energy solutions in transition. On the other hand, LCA performs a life cycle-wide impact assessment on every environmental outcome quantifiable to that specific manufacturing process, from the extraction of raw materials to end-of-life disposal. In this way, LCA helps ensure sustainable activity and offers information-based outputs to optimize various processes to increase the efficiency of operations and reduce their environmental footprints at all stages of a supply chain [
23,
24]. Together, CC and LCA provide a more complete picture of sustainability. CC technologies reduce direct emissions, while LCA guides manufacturers in optimizing their processes to lower overall environmental impacts. This synergy helps systematically reduce the carbon footprint of manufacturing supply chains, supporting significant progress towards achieving net zero emissions [
25,
26]. By employing these tools, industries can make informed decisions that balance emission reductions with other environmental considerations, thus contributing effectively to global sustainability efforts [
27].
LCA is widely used to evaluate the environmental impacts of CC. The steps involved in integrating CC and LCA to achieve a net zero supply chain are represented in
Figure 2.
2.3. Literature Gaps
The existing studies on MSC, LCA, and net zero emission have explored the enablers and benefits of the MSC [
15,
28]. However, more emphasis should be placed on the benefits of environmental and market competitiveness. Studies from developing countries have discussed LCA findings, but there is still a need to address the statistical validation of LCA enablers. This is the first study discussing the enablers of LCA for MSC to achieve the net zero emission goal. However, studies need to explore the causal relationship among these enablers.
Present studies highlight the potential of CCT and LCA in reducing emissions within the MSC. However, a critical evaluation reveals that existing studies lack a comprehensive framework for prioritizing LCA enablers. Sepehriar and Eslamipoor (2024) [
20] integrate carbon emissions into inventory management through carbon tax and emission trading policies, providing valuable economic insights. However, their model does not address the broader implications for SC operations.
Based on the literature analysis, the gaps concerning the relationship between LCA and the net zero emission in MSC are identified as follows: (a) The existing studies provide a theoretical understanding of LCA and NZSC concepts but limited empirical studies in developing economies that validate the effectiveness of identified enablers. (b) The existing literature lacks a comprehensive framework for prioritizing LCA enablers in the MSC. (c) There is insufficient understanding of the relative importance of enablers in achieving NZSC.
The studies above suggest that hybrid approaches could yield more reliable results in future research. Therefore, addressing these gaps using hybrid decision-making approaches and extensive surveys is essential.
3. Research Methodology
This study aims to uncover the enablers of LCA within the manufacturing industry to achieve net-zero emissions across their SC. The study involves identifying these prominent enablers, ranking their significance, and discerning any “cause-and-effect relationships” between them. Given the importance of emerging economies, we conduct a case study in the Indian rubber industry.
Enablers were identified from SLR and categorized using exploratory factor analysis (EFA). The enablers of the adoption of LCA identified from previous studies are summarized in
Table 1. These enablers formed the foundation for the primary research, which will be explained in the coming section.
The research methodology used for this study is depicted in
Figure 3. An empirical investigation was conducted to establish a theoretical foundation, combining qualitative and quantitative approaches [
28]. This research seeks to identify and evaluate the enablers of adopting LCA in manufacturing to achieve net-zero emissions in their SC.
Data was collected from the small and medium Indian manufacturing industries through online and onsite visit methods to confirm the applicability of the enablers. This empirical validation included determining the relative weights and causal relationships of these enablers and sub-enablers. To ensure data reliability and validity, checks for bias were implemented, and “Cronbach’s alpha” was used [
1,
42].
BWM and F-DEMATEL were selected for their robustness in dealing with complex decision-making processes involving multiple criteria. The BWM method is particularly suited for prioritizing enablers in the MSC due to its ability to handle both qualitative and quantitative data. It helps determine the most and least important criteria, clearly ranking LCA enablers [
43]. However, BWM cannot map relationships among enablers, so the F-DEMATEL method effectively understands the causal relationships among enablers. Given the interdependent nature of LCA enablers, F-DEMATEL helps identify the most influential factors and their interactions [
2].
Data Collection and Questionnaire Development
In the first phase of this research, an empirical investigation was conducted to assess the statistical validity and establish a theoretical foundation for the enablers identified through the SLR. A five-point Likert scale questionnaire (ranging from 1—Strongly Disagree to 5—Strongly Agree) was then designed, drawing on previous research in the field [
44].
The questionnaire underwent pre-testing by six experts with more than ten years of experience in the relevant field. Out of six experts, two professors from the Department of Industrial and Production Engineering and four experts from a leading manufacturing industry (One manufacturing head, Two managers, and One section executive). Based on feedback from these experts, a few modifications were made to the questionnaire. The sampling process and criteria for selecting organizations for the research are detailed below.
Sampling and Eligibility Criteria: A systematic sampling approach was employed to select the manufacturing organizations for the study. The process included the following steps:
Sampling Frame: Initially, we compiled a comprehensive list of manufacturing industries using industry databases and government records. This list served as the foundation for selecting potential study participants.
Inclusion Criteria: Organizations were eligible for inclusion if they met certain criteria, including their size, operational website visibility, nature of operations, and adoption of LCA technologies. The study focused on small to medium-sized manufacturing firms that had either implemented or were in the process of implementing LCA practices. This ensured the relevance of the selected organizations to the research objectives.
Exclusion Criteria: Organizations were excluded if they did not meet the inclusion criteria, were unwilling to participate, or had incomplete or unreliable data. This approach helped maintain the quality and relevance of the data collected.
Per the guidelines, we aimed to collect at least 70 responses to ensure a respondent-to-factor ratio of 5:1 or higher [
28,
45]. After gathering the data, we cleaned the responses and conducted tests to verify their validity and reliability.
The questionnaire was sent to 430 participants from manufacturing industries, with assurances of confidentiality. Initial data collection used convenience sampling and referrals to reach more participants. After sending reminder emails, 126 responses were received, and 80 complete responses were used for analysis, which is deemed to be an acceptable sample size [
1,
2,
45].
4. Data Analysis and Results
The present study utilized various statistical tools to analyze the collected data. Detailed information about these tools and methods is provided below. The respondent information is summarized in
Table 2.
Regarding the expertise of the respondents, although more than half of the experts had less than five years of experience, they were selected based on their specific knowledge and active engagement in LCA practices and CCT within the manufacturing industries. Their practical insights and recent involvement in the field ensured that their contributions were both relevant and valuable. Moreover, the diversity in experience levels provided a balanced perspective, enriching the analysis with both seasoned and contemporary viewpoints.
Several measures were taken to mitigate biased responses during data collection. Firstly, we ensured the anonymity of expert responses. Secondly, we communicated the research aims and objectives to the respondents, encouraging them to provide their most relevant and consistent answers. This approach helped to reduce the likelihood of bias in their responses. The mean and standard deviation (SD) of the identified prominent enabler is shown in
Figure 4.
The high standard deviation (SD) value observed in the present data, which exceeds 40% of the mean value, can be attributed to the inherent variability in the MSC. Such variability is expected due to the diverse range of processes, materials, and operational practices across different manufacturing industries. Despite this high variability, our analysis methods, including the BWM and F-DEMATEL, are robust and capable of handling such data variations. This hybrid approach provides reliable insights into the key enablers for achieving net-zero emissions in the MSC.
4.1. Reliability and Validity Test
SPSS 23.0 software was utilized to conduct reliability and validity tests. Reliability tests were employed to measure the ‘goodness’ of the data to verify the accuracy of the respondents’ data [
46]. Convergent validity was confirmed through factor loading, with values exceeding 0.5 being acceptable. Reliability was assessed using “Cronbach’s alpha”, which had an overall value of 0.943, indicating an acceptability [
46]. Each item’s factor loading surpassed 0.5, demonstrating internal consistency and convergent validity. Following EFA, Cronbach alpha values for each leading enabler ranged from 0.832 to 0.895, supporting the instruments’ convergent validity.
4.2. EFA Technique
EFA was used to establish the factor structures of enablers who are adopting LCA. EFA helps identify factor structures without losing information. The data met the criteria for EFA: A “Kaiser-Meyer-Olkin (KMO)” value of 0.902 and a significant Bartlett’s Test of Sphericity (
p < 0.01), with sampling adequacy above 0.50 for each enabler [
28,
44].
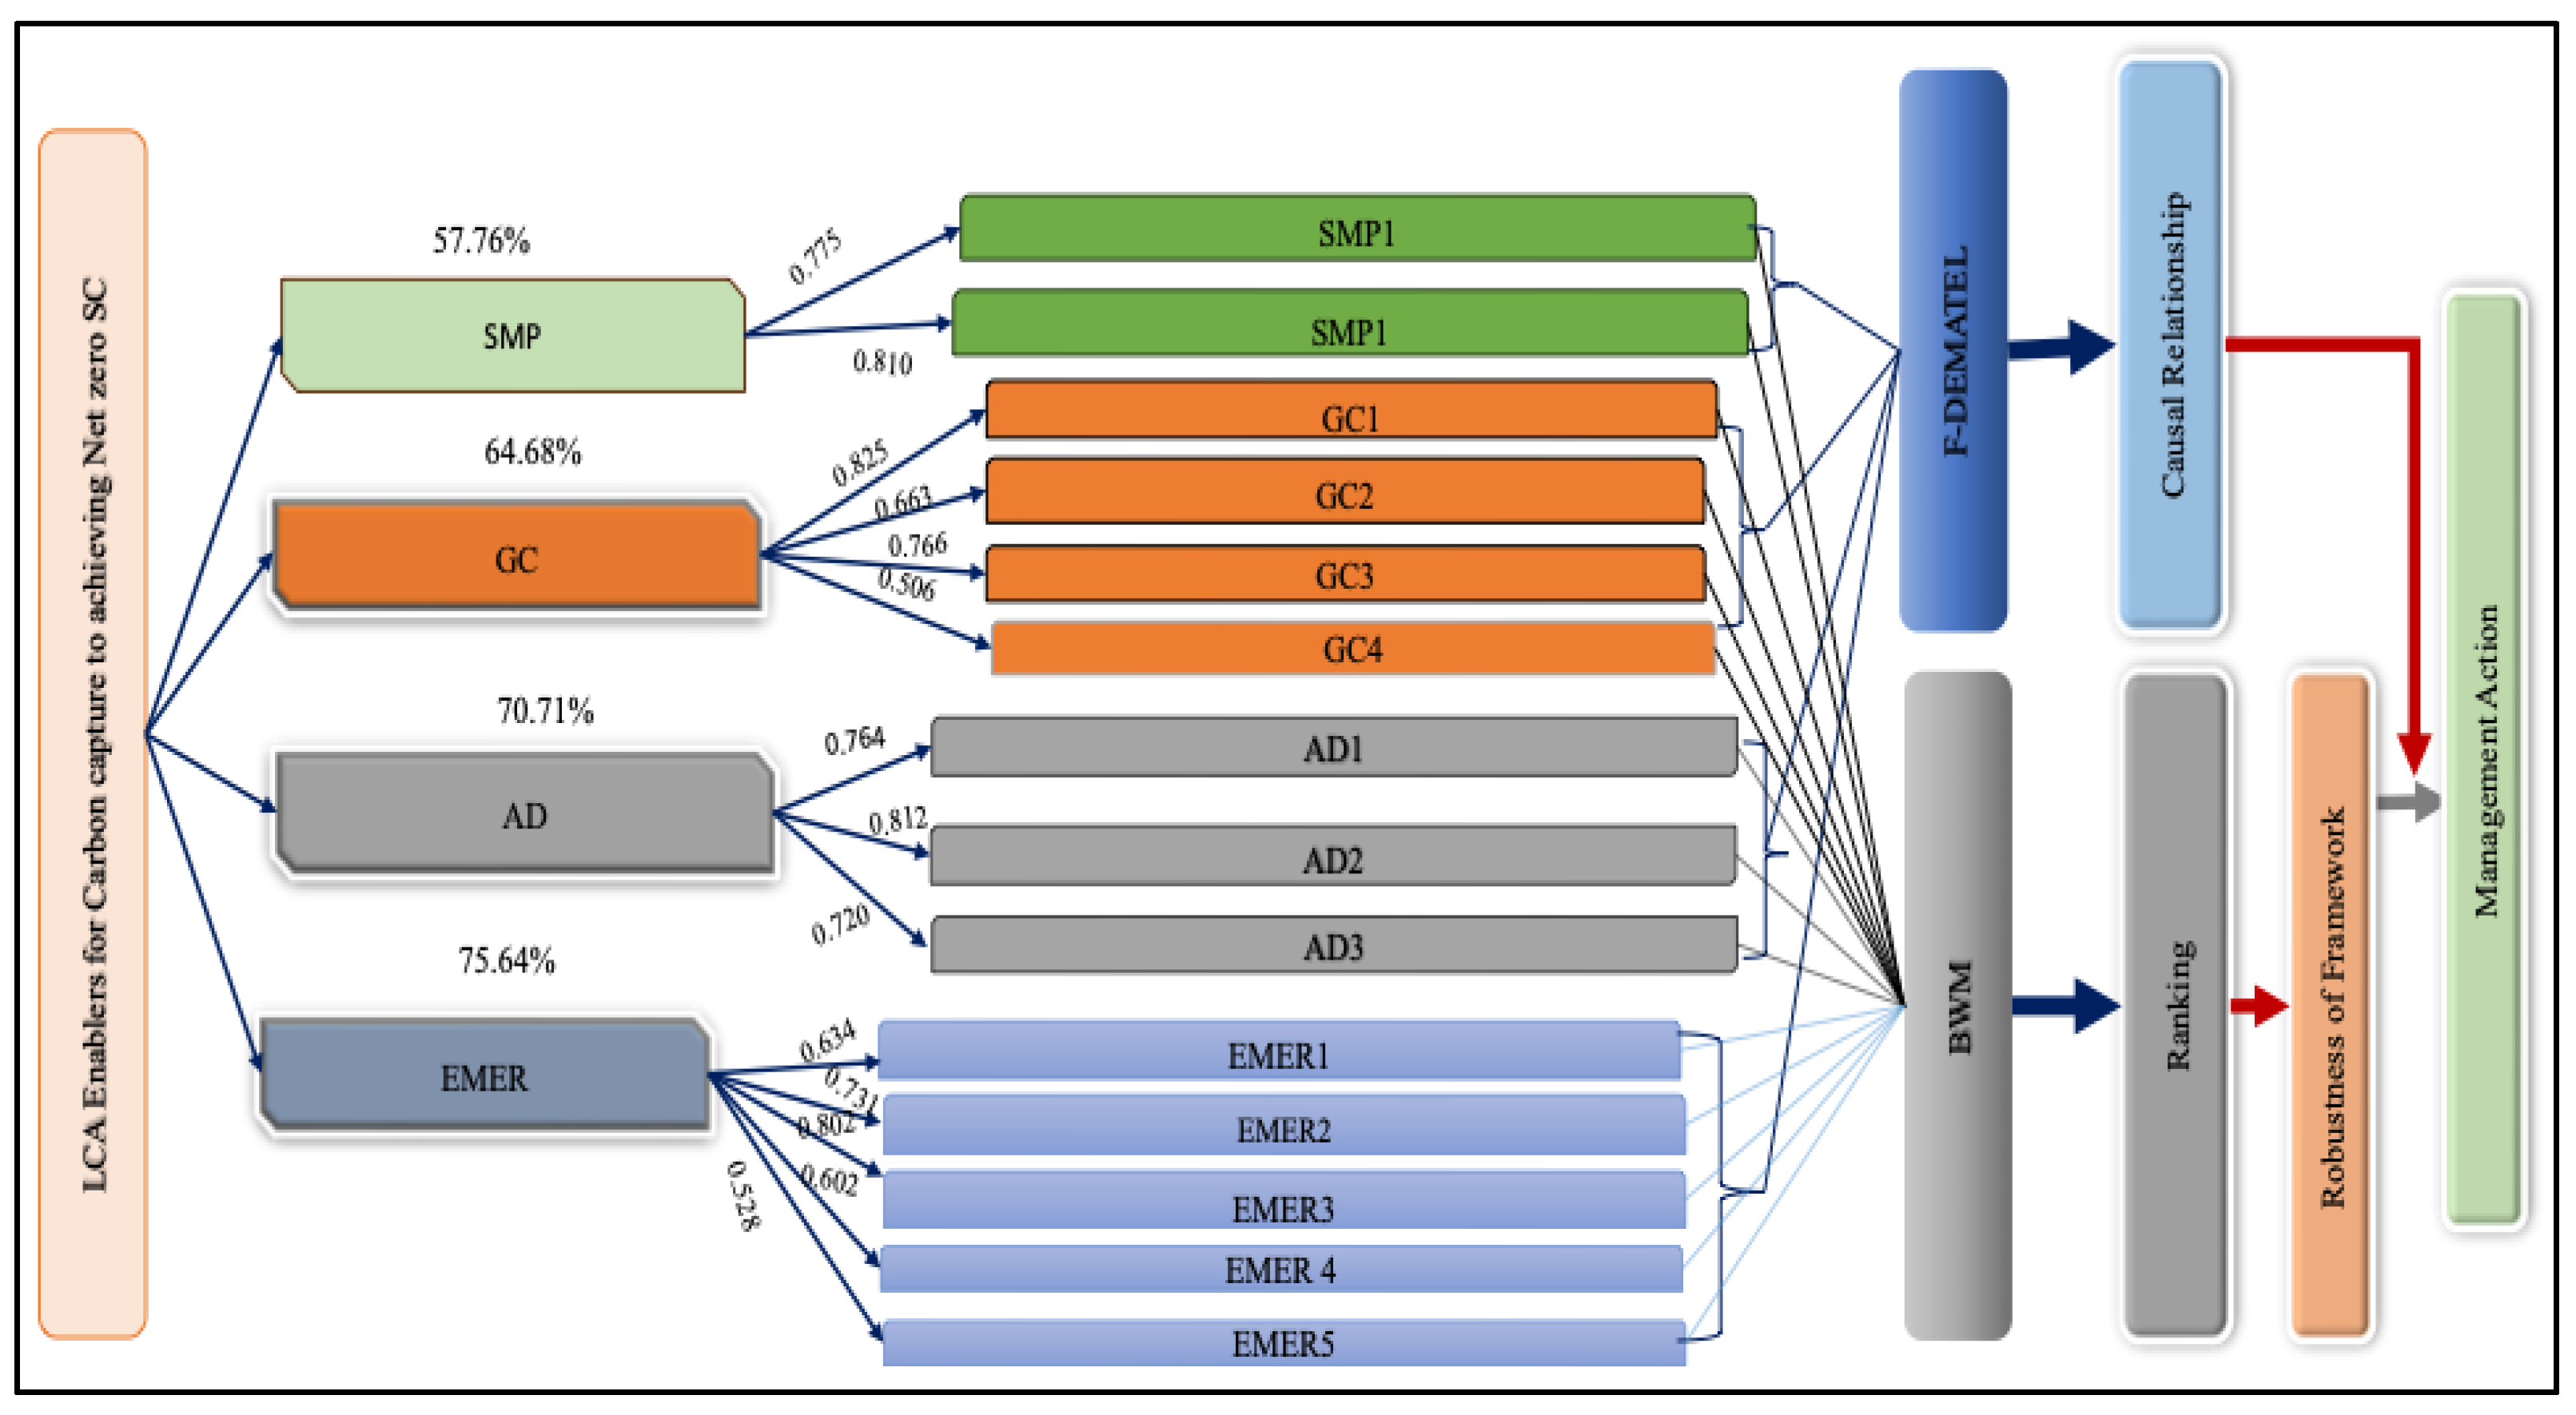
EFA classified the enablers into four categories outlined in
Table 3, explaining 75.64% of the total variance. Factor loadings ranged from 0.506 to 0.825 and commonalities from 0.623 to 0.866, both above acceptable limits [
46]. Based on the EFA, all enablers were classified into four major groups, and a framework for NZSC was proposed, as represented in
Figure 5.
4.3. BWM Method
“Prof. Rezaei developed the BWM in 2015 to address “decision-making problems [
43]”. “BWM involves pairwise comparisons of the best and worst enablers against other enablers”. Compared to other “MCDM “methods, “BWM” is noted for its consistency and reliability. The steps in BWM are outlined below:
Step 1: Identify the enablers through an SLR and expert inputs. Data is collected by six experts who have at least 10 years of experience in the related field. The authors organized personal interactions with the experts to explain the study’s objectives.
Step 2: Design a questionnaire based on a 1–9 scale. The results of the “best-to-others preference” are provided as follows:
where d
Bj denotes the significance of the best enablers ‘d’ (having a high impact) compared to barrier j.
Likewise, the preference of each of the other enablers over the worst enablers (having the most negligible impact) is determined using a scale from 1 to 9. On this scale, 1 indicates the least significant impact, and 9 indicates the most significant impact. The others-to-worst preference is expressed as follows:
where d
jw represents the significance of enabler j compared to the worst enabler, ‘w’.
Further, the experts were asked to evaluate each enabler relative to the most and least critical enabler. The results are presented in
Table 4 and
Table 5.
Step 3: The weight of enablers can be calculated by using the following problem statement.
To solve this problem, linear programming formulation is used as follows:
.
Solving the above equation, we can calculate the optimal weight of each enabler.
Here, CI is indicated as a consistency index.
Using Equation (6), the CR of each expert’s matrix was checked, with all values tending to zero. After completing all BWM method steps, each enabler’s weight was calculated. The final step calculated the mean weight across all experts’ matrices. A similar step is repeated to calculate the weight and rank of sub-enablers.
Table 6 represents the outcome of the BWM method, i.e., enablers and sub-enablers’ final weight and rank.
4.4. Causal Interrelationship among Enablers (F-DEMATEL)
The F-DEMATEL method was chosen for this study because it can effectively model the causal interrelationships between multiple factors in complex systems. Despite the noted complexity and computational demands, F-DEMATEL provides a nuanced understanding of the interdependencies between enablers, which is crucial for our analysis of the NZSC. While Fuzzy ANP also offers advanced functionality, the interpretive clarity, and directness of F-DEMATEL in handling causal interrelationships made it more suitable for our research objectives.
F-DEMATEL enables the construction of a cause-effect structure for enablers. It categorizes all enablers into two groups: “cause and effect”. This allows researchers to visualize enabler relationships and create causal models.
In the present study, we used the F-DEMATEL method. Fuzzy DEMATEL improves upon traditional DEMATEL using fuzzy logic to handle uncertainty and vagueness in expert judgments [
1,
2]. This allows for more precise modeling, greater flexibility with input data, and better decision-making in complex systems.
The steps for conducting F-DEMATEL and the corresponding analysis are detailed below.
Normalization: The normalization can be conducted as:
Calculation of left (
) and right (
) normalization value
Calculation of crisp value
Calculation of total normalized crisp value
Calculate the average value from the different opinions of
k decision-maker.
The initial average direct relationship matrix (M) generated from this crisp value aggregation using Equation (11) is represented in
Table 7.
Based on the initial average direct relation matrix, the normalized direct relation matrix is ‘N’, is calculated, which is represented in
Table 8, and can be obtained from the following Equations (12) and (13):
The total relation matrix ‘
t’ can be obtained, represented in
Table 9, using the formula explained in Equation (14).
The cause-and-effect relation is represented in
Table 10. This can be calculated using Equations (15) and (16) with the help of the total relation matrix ‘
t’.
To draw a digraph, we must calculate the threshold value
(alpha), the average of the total relation matrix ‘
t’ using Equation (17). Using the
value, i.e., threshold value, the impact result of LCA adoption for net zero SC is computed and presented in
Table 10.
Here, k = the total number of elements of matrix ‘t’.
In
Table 10, all values greater than the threshold value (3.436) were retained and italicized, while values below the threshold were removed. The network relationship map (NRM) was then created. For example, the value
t31 = 3.894 is greater than the threshold α = 3.436, indicating a strong relationship where the EMER enablers affect the GC enablers. This means EMER influences AD in adopting LCA practices in India’s manufacturing industry. Conversely, the AD enablers do not influence other enablers as their values are below the threshold. The cause-and-effect relationships are depicted in green and red respectively among the main group enablers in
Figure 6.
The F-DEMATEL analysis identifies the enablers AD, GC, and SMP as cause group enablers (as shown in
Table 10). EMER’s enablers are in the effect group, indicating they are influenced by other enablers.
Figure 6 illustrates the causal relationships among these enablers. The same methodology was applied to sub-barriers, with the results shown in
Table 11 and the network maps visualized in
Figure 7.
5. Discussion and Contributions
Through an SLR, we have identified 14 prominent enablers of LCA adoption for the net zero supply chain. Through EFA analysis, these enablers are categorized into four main groups. The BWM analysis ranks the enablers in the following order of priority: Energy Management and Emission Reduction (EMER), Governance and Collaboration (GC), Assessment and Digitalization (AD), and Sustainable Materials and Production (SMP). The F-DEMATEL analysis further classifies these enablers, Governance and Collaboration (GC), Assessment and Digitalization (AD), Sustainable Materials and Production” (SMP) in the cause group, while Energy Management and Emission Reduction (EMER) in the effect group.
The ‘Energy Management and Emission Reduction’ group enablers are identified as the primary enablers to adopting LCA in the Indian manufacturing industries and achieving NZE. They are the most influential enablers affecting others. In this study, we empirically identified and analyzed the enablers of adopting LCA. We also evaluated the relative weights of these enablers and sub-enablers and their causal interrelationships. The outcomes substantially contribute to theoretical and practical aspects of LCA adoption, providing valuable insights for managers and policymakers.
5.1. Theoretical Contributions
This study makes three significant contributions. First, it empirically identifies the prominent enablers and sub-enablers within the manufacturing sector. It focuses on adopting a zero-carbon emission paradigm and considering environmentally friendly initiatives to reduce carbon pollution. Second, its primary theoretical contribution clearly shows the “strongest and weakest” enablers and the causal interrelationships among LCA-oriented enablers and their categories. Understanding the “best and worst” enablers helps managers prioritize and adopt them effectively, enhancing operational carbon efficiency in their firms. Lastly, the “F-DEMATEL method” offers valuable insights for managers to comprehend the causal relationships among enablers. Managers should focus on causal group enablers to stabilize effect group enablers and successfully adopt LCA practices.
5.2. Managerial Contributions
External factors like “energy transition”, “stakeholder pressure”, and “economic pressure” drive the industry towards a zero-zero emission paradigm. In response to these pressures and their commitment to environmental and social responsibilities, industries are increasingly considering environmentally friendly initiatives to reduce GHG. The research findings clearly understand the enablers of adopting LCA and provide managerial contributions and recommendations for implementing LCA across the industry.
The outcomes of this research have crucial implications for “managers, policymakers, and practitioners”. The study identifies 14 prominent enablers for adopting LCA in the manufacturing supply chain to achieve net zero emissions. Industry practitioners can focus on these enablers to adopt LCA enablers and enhance the LCA method’s process integration, maturity, and technological integration, leading to emission-free production. This research also provides the causal interrelationships among main group enablers and sub-group enablers. It ranks them according to priority, helping practitioners adopt these enablers effectively across the industry. The study highlights the significance of the LCA method for Indian manufacturing industries, emphasizing their role in addressing GHG emissions, optimizing SC, and fostering innovative business models and employment.
5.3. Linking Theoretical Framework to Practical Applications
The developed theoretical framework offers a structured approach for integrating LCA enablers into SC management. SC managers can use the prioritized enablers to align their strategies with net-zero goals. The framework guides managers in implementing technological innovations and improving collaboration with stakeholders to enhance sustainability practices.
The framework assists policymakers in designing effective regulations that encourage adopting LCA practices. By understanding the causal relationships among enablers, policies can be tailored to address the most influential enablers.
The identified enablers highlight the importance of LCA in achieving net-zero goals. Managers can leverage these insights to adopt relevant technologies such as carbon capture and digital assessment tools.
By linking the theoretical framework to practical applications, this study provides a roadmap for both practitioners and policymakers to implement effective strategies for achieving a net-zero MSC. The insights gained from this research contribute to the broader discourse on sustainable SC management and offer actionable guidelines for future initiatives.
6. Conclusions, Limitations, and Future Research Recommendations
In the face of “urbanization and global market competition”, it is essential for the manufacturing industry to adopt the LCA technique to support a supply chain. However, in emerging economies, adopting the LCA method still needs to improve due to a limited understanding of their integrated benefits with CCT (i.e., To evaluate and minimize GHG emissions, respectively) across the manufacturing supply chain for achieving net zero emissions. To address this gap, we conducted an SLR and identified 14 potential enablers for net zero SC business models. These enablers were validated through a survey of the Indian manufacturing industries, with 80 responses analyzed. Through EFA analysis, these enablers are categorized into four main groups. The BWM analysis ranks the enablers in the following order of priority: Energy Management and Emission Reduction (0.215), Governance and Collaboration (0.202), Assessment and Digitalization (0.189) and Sustainable Materials and Production (0.187) The F-DEMATEL analysis further classifies these enablers, Governance and Collaboration, Assessment and Digitalization”, “Sustainable Materials and Production” in the cause group, while “Energy Management and Emission Reduction” in the effect group. The manufacturing industries can efficiently implement and integrate the LCA method and CCT for an NZSC by adopting strategies that enhance awareness and understanding of the benefits of net zero emissions.
These findings provide a base for developing a conceptual framework for future research, which can be validated using “structural equation modeling”. However, the study’s limitations include a limited number of responses and an industry-specific focus, which future research can address. Further research will explore alternative decision-making approaches and extend the scope to other industry sectors. Also, future research could focus on empirically quantifying the emissions reductions enabled by the identified enablers, using methodologies like LCA or simulation modeling to directly measure their impact in achieving net-zero emissions.


 ,
, 


