Article

Wind Speed Forecasting Based on Phase Space Reconstruction and a Novel Optimization Algorithm

1
School of Communication and Information Engineering, Xi’an University of Posts & Telecommunication, Xi’an 710121, China
2
School of Computer and Artificial Intelligence, Zhengzhou University, Zhengzhou 450000, China
*
Author to whom correspondence should be addressed.
Sustainability 2024, 16(16), 6945; https://doi.org/10.3390/su16166945
Submission received: 8 July 2024 / Revised: 6 August 2024 / Accepted: 7 August 2024 / Published: 13 August 2024

Abstract

:
The wind power generation capacity is increasing rapidly every year. There needs to be a corresponding development in the management of wind power. Accurate wind speed forecasting is essential for a wind power management system. However, it is not easy to forecast wind speed precisely since wind speed time series data are usually nonlinear and fluctuant. This paper proposes a novel combined wind speed forecasting model that based on PSR (phase space reconstruction), NNCT (no negative constraint theory) and a novel GPSOGA (a hybrid optimization algorithm that combines global elite opposition-based learning strategy, particle swarm optimization and the genetic algorithm) optimization algorithm. SSA (singular spectrum analysis) is firstly applied to decompose the original wind speed time series into IMFs (intrinsic mode functions). Then, PSR is employed to reconstruct the intrinsic mode functions into input and output vectors of the forecasting model. A combined forecasting model is proposed that contains a CBP (cascade back propagation network), RNN (recurrent neural network), GRU (gated recurrent unit), and CNNRNN (convolutional neural network combined with recurrent neural network). The NNCT strategy is used to combine the output of the four predictors, and a new optimization algorithm is proposed to find the optimal combination parameters. In order to validate the performance of the proposed algorithm, we compare the forecasting results of the proposed algorithm with different models on four datasets. The experimental results demonstrate that the forecasting performance of the proposed algorithm is better than other comparison models in terms of different indicators. The DM (Diebold–Mariano) test, Akaike’s information criterion and the Nash–Sutcliffe efficiency coefficient confirm that the proposed algorithm outperforms the comparison models.

1. Introduction

Wind energy is one of the most widely used sources of renewable energy [1]. According to the WWEA Half-Year Report 2023 [2], the wind power industry is slowly regaining momentum. In 2023, the new installed capacity of wind power reached 41.2 gigawatts, an increase of 38% compared to 2022. It is expected that the total new capacity for the entire year of 2023 will be at least 110 gigawatts, and the global wind power installed capacity will soon surpass the threshold of 1 million megawatts. With the decreasing installation costs, developing countries are expected to leapfrog directly to wind energy [3]. Climate change is emerging as the world’s most significant environmental challenge due to its adverse impacts on the earth’s ecosystem and human welfare, including wide-ranging economic, ecological and social effects. Successive international commitments relating to energy and climate change [4] illustrate that renewable energies are significant to the worldwide energy. Limiting global warming below 2 °C requires rapid decarbonization towards net-zero greenhouse gas emissions by 2050 [5]. Renewable energies are critical in achieving rapid decarbonization by replacing fossil energy.
Damousis and Dokopoulos [6] have pointed out that if the accuracy of short-term wind speed prediction is less than 10%, the generation capacity can increase by 30–100 MW and a profit of USD 100,000 can be obtained. The accurate forecasting of wind speed in wind farms is conducive to a timely adjustment of dispatching plans and the better planning of power grid dispatching departments. However, the instability and nonlinearity of wind speed limit the development of wind power and bring many obstacles to the wind power grid. Accurate wind speed prediction technology can reduce the impact of wind speed characteristics, which not only helps power grid operators and decision makers to timely plan and dispatch the power system but also reduces the failure risk of a wind power system and improves power quality [7]. Therefore, accurate wind speed prediction technology can effectively improve the stability of a wind power generation system.
To improve the accuracy of wind speed forecasting, decomposition algorithms and PSR are widely used in wind speed forecasting. Decomposition algorithms are usually used as the feature extraction method, including WD (wavelet decomposition) [8], EMD (empirical mode decomposition) [9], SSA [10] and others. Among the above strategies, it is tough for EMD to achieve satisfactory results in analyzing non-stationary and nonlinear series as its decomposition efficiency is susceptible to mode mixing problems [11]. SSA has been widely used in many fields, including climate, the environment, geography, social science, and finance. It consists of two complementary stages: decomposition and reconstruction [12]. The SSA technique can identify the original series as several independent components, including the trend, periodic components, oscillations, noise, and clean series. Thus, we use SSA to decompose the raw wind speed data into IMFs to decrease the non-stationarity. PSR can reconstruct the dynamics of a complex system by mapping its observed time series data into a multidimensional space. This technique is particularly useful for understanding the underlying structure of a time series [13]. PSR is employed to reconstruct the IMFs into input and output vectors of a forecasting model after the raw wind speed series is decomposed.
In order to predict the wind speed accurately, a wide range of models have been proposed during the last decade. These models can be classified into four categories [14,15]: (1) physical models, (2) standard statistical models, (3) machine learning-based models, and (4) hybrid AI-based approaches. The practical application of current physical models is limited by challenges in coding the detailed physical model and the large computational resources needed to run them [16].
Compared with physical models, a statistical model has the characteristics of a simple structure. In addition, a statistical model can sufficiently excavate the hidden information of historical data. ARMA (auto-regressive moving average) [17] and ARIMA (auto-regressive integrated moving average) [18] are the most widely used statistical models. Jiang et al. [19] proposed a method based on EMD and VAR (vector auto-regression) for wind speed forecasting. Singh et al. [20] proposed a new repeated wavelet transform-based ARIMA (RWT-ARIMA) model that can improve the accuracy of very short-term wind speed forecasting. The performance of these statistical models depends on the nonlinearity and non-stationarity of historical wind speed data. Most statistical models can hardly capture the nonlinear feature in the historical data. The intermittent and stochastic characteristics of a wind speed series need more complex functions to capture nonlinear relations. Therefore, the performance of statistical models is not stable.
Artificial intelligence technology is developing rapidly. Many intelligent forecasting methods have been applied for wind power prediction and wind speed prediction. These models are capable of high performance in terms of forecasting nonlinear and non-stationary wind speed time series data. Artificial intelligence models mainly include ANNs (artificial neural networks) [21], a SVM (support vector machine) [22], LSTM (long short-term memory network) [23], a GRU [24], a GNN [25], and so on. Zhang et al. [23] proposed a shared weight LSTM to decrease the number of variables that need to be optimized and the training time of LSTM without significantly reducing prediction accuracy. Wei et al. designed a wind speed forecasting system consisting of a GRU and SNN (spiking neural network) with error correction and fluctuating featured composition strategies to fill the gaps of hybrid structures based on the SNN [24].
However, a single model cannot always meet the prediction of time series and the change in wind speed because it is difficult for a single model to extract the features in a time series. In order to overcome the shortages of a single model, some researchers proposed the NNCT strategy of integrating multiple prediction models. For example, Xiao et al. [26] proposed a genetic algorithm based on NNCT (GA–CM–NNCT) to forecast the hourly average wind speed at three wind turbines in Chengde, China. Zhang et al. [27] proposed a combined model that combines CEEMDAN (complete ensemble empirical mode decomposition with adaptive noise) and a flower pollination algorithm with chaotic local search. In their model, five neural networks and NNCT are employed for short-term wind speed forecasting. Wang et al. [28] adopt the NNCT method to integrate a BP (back propagation) neural network, SVM, ELM (extreme learning machine) and ARIMA to build a hybrid forecasting system for wind speed point forecasting and fuzzy interval forecasting. Niu et al. [29] proposed a hybrid model, which consists of CEEMDAN, a NNCT-based multi-objective grasshopper optimization algorithm, and several single models. Their experiments shows that the NNCT strategy can improve the accuracy of the combined system.
In NNCT-based models, an algorithm is needed to optimize the weight coefficients of each single model. In recent years, the following algorithms have been commonly used to optimize parameters: PSO (particle swarm optimization) [30], a GA (genetic algorithm) [31], SA (simulated annealing) [32], the GWO (grey wolf optimizer) [33], the WOA (whale optimization algorithm) [34], and so on. Some researchers have combined various algorithms and made some improvement. Wang et al. [35] proposed an algorithm combining PSO and the GSA (gravitational search algorithm) to optimize the prediction model. He et al. [36] designed the PSOGA, a hybrid particle swarm optimization genetic algorithm to optimize the hyperparameters of the model. The PSOGA takes the advantages of both PSO and a GA with fast convergent speed and high accuracy. Wang et al. [37] designed a combined wind speed forecasting system that employs multiverse optimization algorithm to optimize the weights of each forecasting model. Zhou et al. [38] established a combined model that uses ELM, RNN, LSTM, MLP (multi-layer perceptron) and SVM to forecast short-term wind speed and designed a modified multi-objective optimization algorithm to optimize the weight of the combined model.
Through the above literature, we find that many decomposition algorithms are used for the preprocessing of wind speed data. Although the wind speed data are preprocessed and the non-stationary and nonlinear problems are solved, a single prediction model cannot fully capture the characteristics of the data, and the use of multiple models can better capture the characteristics in the data. Existing optimization algorithms (such as PSO, GA, GWO) still have space for improvement in accuracy, convergent speed and stability, and an improved optimization algorithm needs to be proposed.
In this paper, we propose a new hybrid SSA-GPSOGA-NNCT algorithm based on SSA, PSR and the NNCT strategy. There are four forecasting models in NNCT-based models including CBP, an RNN, a GRU and a CNNRNN. To optimize the hyperparameters in NNCT-based models, we propose an optimization algorithm named the GPSOGA. The GPSOGA optimization method is composed of PSO, a GA and the GEOLS (global elite opposition-based learning strategy). And the overall process of the proposed algorithm is as follows:
The original wind speed was decomposed into multiple components by SSA. Each component was reconstructed by PSR, which was divided into the input and output vectors of the proposed algorithm. Each component was predicted by CBP, the RNN, the GRU and the CNNRNN, respectively. The prediction results of the four methods were combined by the NNCT strategy. The weight coefficients of each prediction method are optimized by the GPSOGA algorithm, and finally, all components are accumulated to obtain the predicted results. The main innovation achievements and contributions of this paper are as follows:
1. SSA and PSR are used to construct the input and output of the proposed forecasting algorithms. SSA and PSR can effectively understand the underlying structure and extract the hidden features of a nonlinear time series.
2. A new combination strategy is proposed, which adopts the NNCT multi-model fusion strategy to combine CBP, RNN, GRU and CNNRNN prediction models. The proposed hybrid algorithm achieves the mean absolute error (MAE) for one-step-ahead predictions on four datasets as follows: 0.0156, 0.0453, 0.0182, and 0.1025. For three-step-ahead predictions, the MAE values are 0.0435, 0.1028, 0.444, and 0.3071. Five-step-ahead predictions yield MAE values of 0.0767, 0.1819, 0.0816, and 0.486. The combined algorithm can overcome the limitations of a single model in the prediction process and improve the accuracy of the prediction results.
3. A new GPSOGA optimization algorithm is proposed, which makes the particles in PSO carry gene sequences. The proposed optimization algorithm takes the advantages of PSO and GA with a fast convergent speed and high accuracy.
4. DM test, Akaike’s information criterion and the Nash–Sutcliffe efficiency coefficient are employed to compare the performance of the proposed algorithm with different models.
The rest of this paper is organized as follows. In Section 2, we provide a short overview of the approaches involved in this paper. The proposed GPSOGA optimization algorithm is introduced in Section 3. In Section 4, a detailed description of the proposed forecasting algorithm is presented. Section 5 describes the experiment results and analysis. The discussions are provided in Section 6. Finally, we conclude this paper in Section 7.

2. Methodology

This section introduces the methods used in this paper, including SSA, PSR, CBP, an RNN, a GRU and a CNNRNN.

2.1. Singular Spectrum Analysis

SSA is a nonparametric spectrum estimation algorithm [39]. It is widely used in time series analysis that decomposes a time series into several meaningful components based on the singular value decomposition of a time series. As a mature signal processing method, it has the advantages of being unconstrained by the sine wave assumption and not requiring prior information. It can extract more useful information from the original sequence, thereby improving the signal-to-noise ratio of the original sequence. SSA has been widely used to identify and extract low-frequency and high-frequency components from a time series. Considering the series  Y ˜ = [ y ˜ 1 , y ˜ 2 , , y ˜ N ]  available at  N  time points, the window length  w  is set in the range of  2 w N / 2 . If  n = N w + 1 , then the trajectory matrix  X  can be defined as follows:
X = ( y ˜ 1 y ˜ 2 y ˜ w y ˜ 2 y ˜ 3 y ˜ w + 1 y ˜ n y ˜ n + 1 y ˜ N )
SVD (singular values decomposition) is employed to decompose trajectory matrix  X λ 1 , λ 2 , , λ w  and  U 1 , U 2 , , U w  are the eigenvalues and eigenvectors of matrix  X . The right-singular vector  V i = X T U i λ i ( i = 1 , 2 , , w ) , and the  i th eigentriple  ( λ i , U i , V i )  is obtained by the SVD of matrix  X . Each sub-matrix can be derived by  X i = U i λ i V i T .
The matrix is transferred into a time series by diagonal averaging.  x j k ( 1 j n ,   1 k w )  is the element of diagonal matrix  X i . The construction of subseries  Z i ( i = 1 , 2 , , w )  via diagonal averaging can be defined by Equation (2) and the subseries are arranged in descending order according to their eigenvalues.
Z i = { 1 n i = 1 n + 1 x i , n i + 1 ,   1 n w * 1 w * i = 1 m * x i , n i + 1 , w * n n * 1 N w + 1 i = n n * + 1 N n * + 1 x i , n i + 1 , n * n N

2.2. Phase Space Reconstruction

To accurately forecast wind speed, it is necessary to fully grasp the inherent characteristics of wind speed time series. Due to the fact that wind speed is affected by many factors, it has non-stationary, nonlinear and non-deterministic characteristics. By using PSR to map the wind speed time series into a high-dimensional space, the relationship between the nonlinear characteristics and the interaction between the systems can be obtained, which helps to forecast the future trend in wind speed. The essence of PSR is to reconstruct one-dimensional time series into a  d -dimensional vector with delay time  τ , which can reconstruct the unidimensional series into dynamic chaotic space by setting delay time  τ  and embedded dimension  d  appropriately [40].
In this paper, PSR is employed to construct the corresponding phase space matrixes, which are imported into the forecasting models subsequently. The wind speed series are reconstructed by PSR into input matrix  X i n t p u t  and output matrix  X o u t p u t , which is illustrated as follows:
X i n p u t = [ X 1 ,   X 2 , , X L ] T = [ x 1 x 1 + τ x 1 + ( d 1 ) τ x 2 x 2 + τ x 2 + ( d 1 ) τ x L x L + τ x L + ( d 1 ) τ ]
X o u t p u t = [ x 1 + ( d 1 ) τ + t ,   x 2 + ( d 1 ) τ + t , , x N ] T
where  d  represents the reconstructed dimension, τ represents the delay time,  t  represents the number of directly predicted steps,  L  represents the length of the input data, and  N  indicates the total length of the time series data.

2.3. Cascade Backpropagation Network

The cascade backpropagation (CBP) network is based on the BP neural network. Cascade refers to different layers of a neural network, not just the adjacent layer connections. For example, the input layer has a direct connection with the output layer, and it also has a connection with the hidden layer. This also means that each layer not only receives the information provided by the previous layer but also obtains the weight connection provided by other layers in front. CBP also includes the characteristics of layer-by-layer training and progressive expansion, enabling neural networks to maintain predictive performance while dealing with more complex patterns and relationships.
Suppose the input vector is  X ( t ) = [ x t 1 , x t 2 , , x t h ] T , and the output vector is  Y ( t ) = [ y t 1 , y t 2 , , y t d ] T . The following equation defines CBP with  h  inputs,  m  hidden neurons and  d  outputs:
y t k = k = 1 h p ( M k i x t i ) + g ( j = 1 m W k j f ( i = 1 d V j i x t i ) )
where  p f  and  g  are active functions that connect the input layer to the output layer, the input layer to the hidden layer, and the hidden layer to the output layer, respectively.  M k i  is the weight for the connection between input neuron  i  and output neuron  k W k j  is the weight between hidden neuron  j  and output neuron  k V j i  is the weight between output neuron  i  to hidden neuron  j x t i  represents the input data to neuron  i [ 1 , h ] , and  y t k  represents output  k [ 1 , d ]  at time  t .

2.4. Recurrent Neural Network

An RNN is a very effective technique to process time series due to the internal memory that can remember the important features of the input sequential data [41]. Its characteristic of a hidden state can capture the time dependence in sequence data. By reusing the same network unit at each time-step of the sequence, an RNN enables information to propagate along the time dimension so that the sequence data can be modeled. In addition, the essential feature of an RNN is that it has an internal memory memorize previous data. In an RNN, the output from the previous time stamp along with the input from the current time stamp are fed to RNN cells so that the current state of the model is influenced by its previous states. The following equation explains the function of a single RNN cell:
h t = tanh ( W [ h t 1 , x t ] + b )
where hyperbolic tan function ( tan h ) is used to scale the actual values so that the values fall into the range of −1 to +1,  W  is the weight matrix,  b  is the bias matrix,  h t  and  h t 1  are hidden states at the current time-step and previous time-step, respectively.

2.5. Gated Recurrent Unit

A GRU is proposed by Cho et al. [42]. It is an effective variant structure of LSTM. LSTM has three gates, while a GRU only has two gates. A GRU stores and filters information through update gates and reset gates. Therefore, some information will not be deleted over time. On the contrary, it will retain part of the information with a certain probability and sends it to the next unit. Thus, the problem that an RNN cannot process too long a time series is solved [43].
A GRU is composed of a reset gate and update gate. The reset gate controls how much inconsequential information of the previous moment is filtered, and the update gate determines whether the most efficient message can enter the next GRU cell. The whole calculation processes of a GRU are expressed as below:
z t = σ ( W z [ h t 1 , x t ] )
r t = σ ( W r [ h t 1 , x t ] )
h ˜ t = tanh ( W h [ r t h t 1 , x t ] )
h t = ( 1 z t ) h t 1 + z t h ˜ t
where  r t  is the output of the reset gate,  z t  is the output of the update gate,  h t 1  and  h t  represent the previous hidden state and current hidden state, respectively,  t a n h  is the activation function,  h ˜ t  is the hidden state,  x t  is the current input, and  W r W z  and  W h  are weight vectors.

2.6. Convolutional Neural Network Combined with Recurrent Neural Network

A convolutional neural network (CNN) is composed of three layers: a convolutional layer, a pooling layer and a fully connected layer. Through convolution and pooling operations, CNN can automatically perform feature extraction and dimensionality reduction, effectively helping the model to capture local patterns and features in a time series. The convolutional layer is applied to excavate representative information of input datasets. A CNN is usually used to extract features from the original data. The convolution method commonly used by the CNN model in processing a time series is one-dimensional convolution. The formula of the convolution layer is as follows:
R [ c , t ] = f ( R t K + b ) = f ( i = 1 h R t K t j + b j )
where  R [ c , t ]  is the output of the convolution layer,  R t  is the data at time t, and K is a one-dimensional convolution kernel.
The pooling layer is used to reduce the complexity of mathematical computation by decreasing the dimension of a target variable. The fully connected layer is employed to forecast the object variable. Here, we use max pooling, and the formula for the pooling layer is as follows:
R P = m a x ( R [ c , t ] [ m , n ] )
where  R P  is the output result of the pooling layer, and  [ m , n ] is the pool window size. The pool window size is set in the pooling layer.
Finally, the output of the CNN is obtained through the fully connected layer. The formula is as follows:
Z = W R P + a
where W is the weight matrix and, Z is the output of the fully connected layer, and it serves as the input to the RNN.
In the framework of the CNNRNN, the CNN is utilized to extract the characteristics of a wind speed series. After extracting the features of the data through the CNN, the RNN is applied to obtain the final forecasting results. In this paper, wind speed series disposed by two convolutional layers and a pooling layer is flattened to a vector and further transmitted to the RNN layer. Finally, the output results interpreted by the RNN, and the fully connected layer is employed for wind speed prediction. Figure 1 gives the specific procedure of the CNNRNN.

3. The Proposed GPSOGA Optimization Algorithm

3.1. Particle Swarm Optimization

The PSO algorithm is a population-based stochastic optimization technique that is inspired by the collective behavior of natural organisms. It initializes a group of random particles (random solutions). Then, it finds the optimal solution through iteration. At each iteration, the particle updates itself by tracking two extreme values ( p b e s t  and  g b e s t ). After finding these two optimal values, the particle updates its velocity and position by using the formula below.
v i ( t + 1 ) = v i ( t ) + c 1 r a n d ( p b e s t i x i ) + c 2 r a n d ( g b e s t i x i )
x i ( t + 1 ) = x i ( t ) + v i ( t + 1 )
where  c 1  and  c 2  are two positive constant parameters for controlling the step size,  v i  is the velocity of particle  i x i  represents the position of particle  i g b e s t i  represents the global optimal position in searching process so far,  p b e s t i  is the individual optimal position of  x i r a n d  is an independently uniformly distributed random variables with range [0, 1],  t  represents the result of the previous iteration and  t + 1  represents the current iteration.

3.2. Genetic Algorithm

The genetic algorithm is a kind of heuristic algorithm. It is a search optimal solution algorithm based on the notion of natural evolution; it can generally obtain optimal results faster than standard optimization algorithms [44]. The core steps of the genetic algorithm mainly include three steps: operator selection, crossover, and mutation. The optimal individual that conforms to the objective function is selected through loop iteration [45]. The operation process of the algorithm is generally as follows: (1) randomly initialize the population, and set the relevant parameters of the model (including population size, mutation rate, crossover rate, and the maximum number of iterations); (2) calculate the fitness of the population, and then select, cross, and mutate all individuals of the population through the genetic operator; (3) iteratively update the fitness, and judge the optimization objectives, constraints, and iterations; and (4) finally, generate an output when the maximum number of iterations is reached or the fitness has no change.

3.3. Global Elite Opposition-Based Learning Strategy

EOL (elite opposition-based learning) is a strategy in the field of intelligence computation. The main ideology is that for a feasible solution, one must calculate and evaluate the opposite solution at the same time, and choose the better one as the individual of the next generation [46]. The GEOLS is introduced in this paper, and it can promote the searching performance.  X i = ( x i , 1 , x i , 2 , , x i , D )  is a point in the current population, and  D  is the problem dimensional space. Then, the opposition point  X ˘ i = ( x ˘ i , 1 , x ˘ i , 2 , , x ˘ i , D )  is defined as the following equation:
x ˘ i , j = S × ( d a j + d b j ) x i , j
where  x [ a i , b i ] S U [ 0 , 1 ] , and  S  is a generalized factor.  d a j  and  d b j  are the dynamic boundaries, which can be defined as
d a j = min ( x i , j ) ,           d b i = max ( x i , j )
However, the corresponding opposite can exceed the search boundary  [ a i , b i ] . To solve this, the transformed individual is assigned a random value within  [ a i , b i ]  as follows:
x ˘ i , j = r a n d ( d a j , d b j ) ,         i f   x ˘ i , j a j x ˘ i , j b j

3.4. The Proposed Optimization Algorithm

By combining the GEOLS algorithm with PSO and the GA, we propose a novel GPSOGA optimization algorithm to expand the global search capability for the proposed SSA-GPSOGA-NNCT algorithm. The details of the GPSOGA algorithm are as follows (Algorithm 1).
Algorithm 1: The pseudo code of the proposed GPSOGA algorithm.
Objective function:  m i n = { f i t n e s s = S S E = i = 1 M ( y i y ^ i ) 2 }
   /*  y i  and  y ^ i  denote actual value and forecasting value respectively. */
   Input: Training set and validation set
   Output: Optimal weight coefficients of corresponding forecasting models
   Parameters:
    M a x _ i t e r   —maximum iterations
    t —current iteration
    d i m —dimensions of particles
    s i z e —number of particles
    r a n d 1 r a n d 2 —a random value in [0, 1]
    v i —particle velocity
    x i —particle position
    x _ m a x —the maximum value of particle position
    x _ m i n —the minimum value of particle position
    max _ v e l —maximum of particle velocity
    x b e s t —The best position of the searching particle in the population
    C r o s s o v e r _ R a t e —the crossover probability
    M u t a t i o n _ R a t e —the mutation probability
    P —agent position generated by GEOLS
Initialize the position ( x i ) of each particle according to  s i z e d i m x _ m a x  and  x _ m i n
Initialize fitness and speed ( v i ) of each particle according to  x i
t = 0
WHILE  t t < M a x _ i t e r  DO
 The position of each particle is encoded in binary
FOR EACH  i 1 i s i z e  DO
  IF  r a n d 1 < C r o s s o v e r _ R a t e  DO
     A particle is randomly selected from the population as the mother, and a value is randomly selected in the DNA length, and the DNA sequence after the value of the mother is assigned to  x i .
  END IF
  IF  r a n d 2 < M u t a t i o n _ R a t e  DO
    A random location of DNA is chosen to reverse it
  END IF
END FOR
 The position of each particle is decoded in decimal
 Calculate elite agent position  P  by Equations (13)–(15).
IF  f i t n e s s ( P ) < f i t n e s s ( x i )  DO
   x i = P
END IF
FOR EACH  i 1 i s i z e  DO
  Each particle updates its  x i  and  v i  by Equations (11) and (12)
  IF  v i > max _ v e l  DO
     v i = max _ v e l
  ELIF  v i < max _ v e l  DO
     v i = max _ v e l
  END IF
  IF  f i t n e s s ( x i ) < f i t n e s s ( x b e s t )  DO
     x b e s t = x i
  END IF
END FOR
t = t + 1
END WHILE
RETURN  x b e s t  

4. The Proposed SSA-GPSOGA-NNCT Algorithm

In this section, we introduce the overall process of the proposed SSA-GPSOGA-NNCT algorithm. The specific procedures are displayed in Figure 2. As shown in Figure 2, SSA-GPSOGA-NNCT mainly includes the following five steps:
Step 1: the original wind speed series are decomposed into several IMFs components by the SSA decomposition method.
Step 2: we apply PSR on IMFs, and the IMFs are reconstructed into input and output vectors.
Step 3: Four models (CBP, the RNN, the GRU and the CNNRNN) are applied as forecasting models, respectively, to predict the wind speed data that were reconstructed by PSR. The intermediate forecasting results of the four models are combined by the NNCT strategy.
Step 4: the weight coefficients of the corresponding single models in the NNCT strategy are optimized by the proposed GPSOGA optimization algorithm.
Step 5: the final forecasting results are obtained by integrating the weight coefficients and the intermediate forecasting results of the four models.

5. Experiment Results and Analysis

5.1. Dataset Information

The wind speed data utilized in this paper were obtained from the National Wind Technology Center (NWTC) of the National Renewable Energy Laboratory (NREL). These data were collected at a frequency of every two seconds, and an average value was recorded every minute. The wind speeds were measured and recorded at six different heights: 2 m, 5 m, 10 m, 20 m, 50 m, and 80 m. For our experiment, we selected the wind speed data from heights of 5 m, 20 m, 50 m, and 80 m. Specifically, we designated the wind speed data at heights of 80 m, 50 m, 20 m, and 5 m as dataset 1, dataset 2, dataset 3, and dataset 4, respectively. The time periods for these datasets are as follows: dataset 1—from 17 May 2020 12:00 to 18 May 2020 4:39, dataset 2—from 25 July 2020 22:40 to 26 July 2020 15:19, dataset 3—from 10 September 2020 8:00 to 11 September 2020 0:39, and dataset 4—from 26 June 2020 18:40 to 27 June 2020 11:19.
Selecting data from days across four different months as the dataset provides a higher resolution of shorter time periods, enabling a more precise understanding of short-term wind speed variations. Daily data also better capture the variability in wind speed characteristics between day and night, which is advantageous compared to seasonal or monthly data.
To provide a visual representation, we have included relevant curves and histograms for the four datasets in Figure 3. Furthermore, Table 1 displays the statistical information for each of the four wind speed datasets.

5.2. Evaluation Criteria

We employed various performance indicators to evaluate the accuracy of the proposed algorithm. These indicators include the MAE, the mean square error (MSE), the mean absolute percentage error (MAPE), and the coefficient of determination ( R 2 ). The formulas for these indicators are as follows:
M A E = 1 n i = 1 n | y ^ i y i |
M A P E = 100 % n i = 1 n | y ^ i y i y i |
M S E = 1 n i = 1 n ( y i y ^ i ) 2
R 2 = ( 1 i ( y ^ i y i ) 2 i ( y ¯ i y i ) 2 )
In these formulas,  n  represents the number of samples,  y i  is the original wind speed value,  y ^ i  is the predicted wind speed value, and  y ¯ i  represents the average of the observed values. In these evaluation criteria, smaller values indicate better performance for the MAE, MSE, and MAPE. Conversely, a higher value of  R 2  signifies a better model.

5.3. Comparison Models and Their Parameters
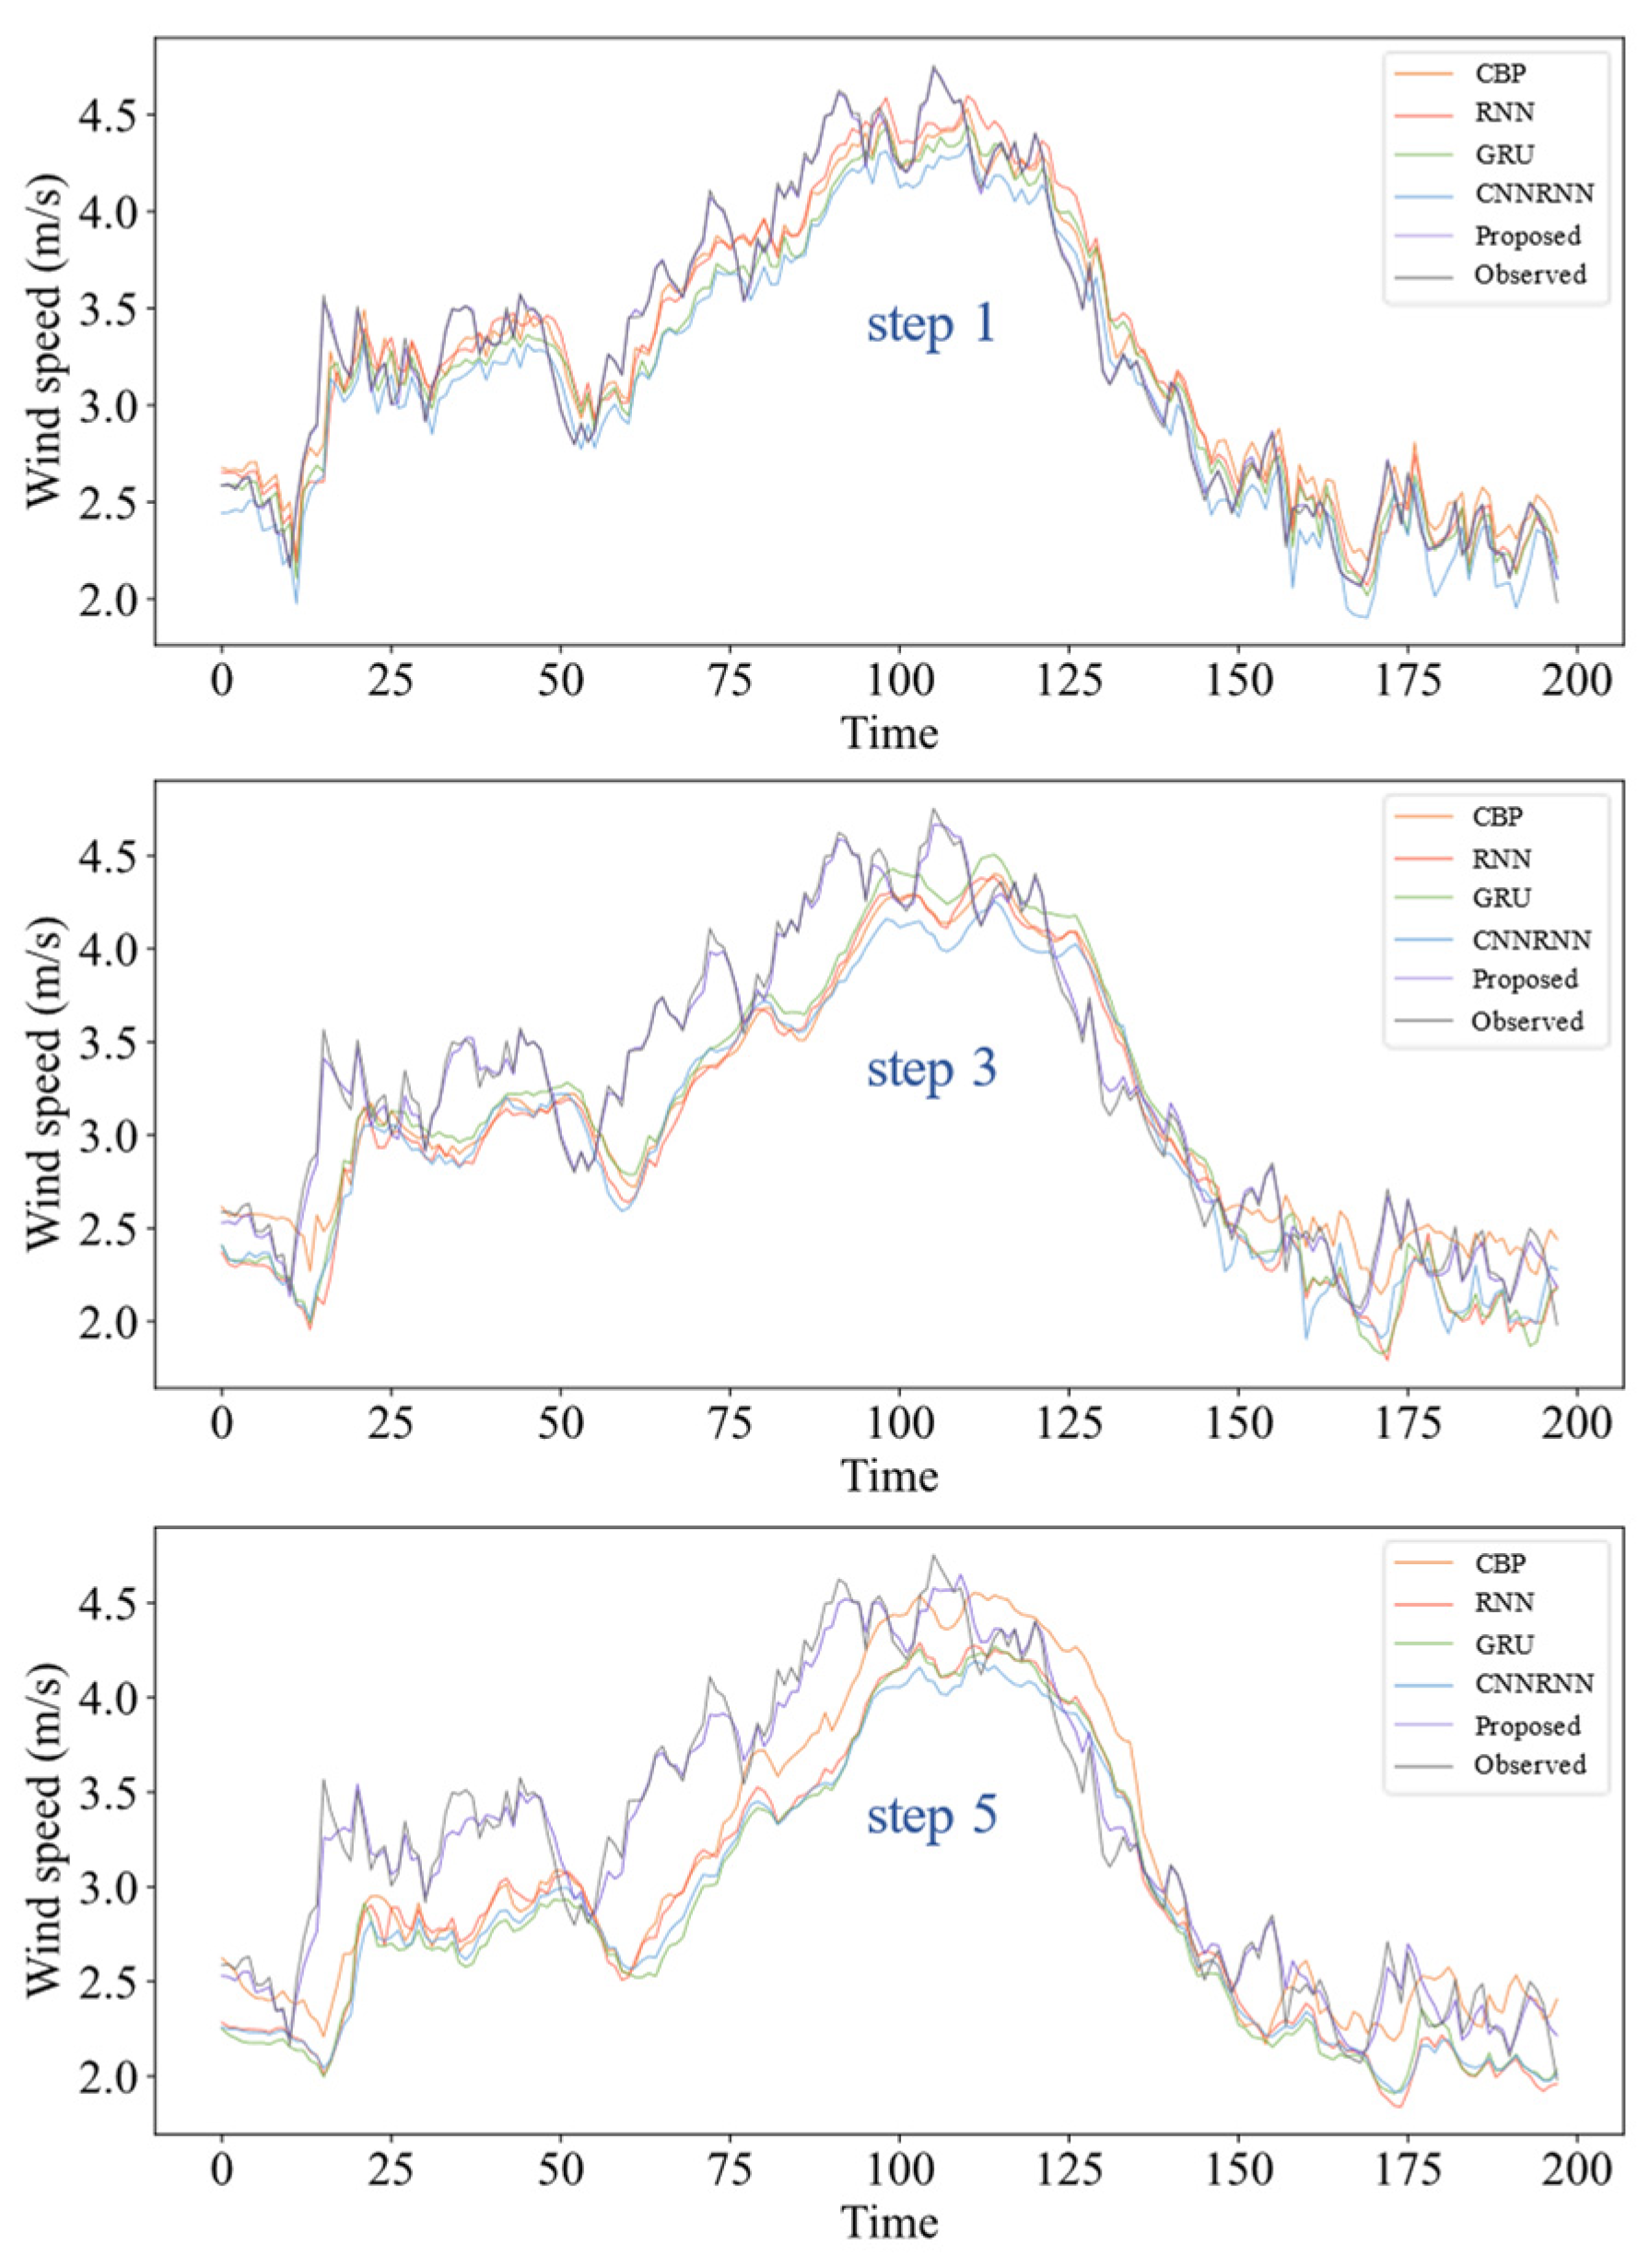
To comprehensively evaluate the forecasting performance of the proposed SSA-GPSOGA-NNCT algorithm, we conducted four experiments, each with specific objectives and comparisons. The details of these experiments are summarized in Table 2.
Experiment I: We compare the proposed algorithm with individual single models. They are CBP, an RNN, a GRU and the CNNRNN, respectively.
Experiment II: We apply the SSA decomposition technique to the individual single models used in Experiment I. We compare the performance of SSA-CBP, the SSA-RNN, the SSA-GRU, and the SSA-CNNRNN with the proposed SSA-GPSOGA-NNCT algorithm.
Experiment III: The objective of this experiment is to verify the effectiveness of the proposed GPSOGA optimization algorithm. We compare SSA-SA-NNCT, SSA-ACO-NNCT, SSA-GA-NNCT, and SSA-PSO-NNCT with the proposed SSA-GPSOGA-NNCT algorithm.
Experiment IV: This experiment aimed to validate the suitability of the SSA decomposition technology for the proposed algorithm. We compare the performance of EMD-GPSOGA-NNCT and CEEMDAN-GPSOGA-NNCT with the proposed SSA-GPSOGA-NNCT algorithm.
The parameters used in the four experiments are provided in Table 3. For CBP, the RNN, the GRU, and the CNNRNN, the activation function in the hidden layers is Rule, and the Adam optimizer is utilized. EMD does not require any specific parameter settings; hence, it is not included in the table. In terms of data preprocessing, the min–max normalization method is applied to enhance the convergence speed of the models.

5.4. Experiment I

In this subsection, we conducted experiments using individual prediction models without decomposition technology. Figure 4 illustrates the forecasting results of the proposed algorithm and the four comparison models for one-step, three-step, and five-step forecasting on dataset 1. The figure visually demonstrates the forecasting results of the proposed algorithm compared to the individual single models, and it is apparent that the proposed algorithm achieves the best fitting results.
The results of the evaluation criteria of CBP, the RNN, the GRU, and the CNNRNN are presented in Table 4. Upon analyzing the evaluation criteria, it is evident that the proposed algorithm achieves higher accuracy compared to the individual single models. The proposed SSA-GPSOGA-NNCT algorithm consistently outperforms all traditional single models in terms of all evaluation metrics for one-step-ahead forecasting on all datasets. The MAPE values of the individual single models are relatively higher than the proposed algorithm. For instance, for one-step-ahead forecasting on dataset 1, the MAPE of the proposed algorithm achieves 0.5067%, while CBP, RNN, GRU, and CNNRNN achieve 5.1632%, 5.3300%, 5.2373%, and 5.0308%, respectively.
The comparison results clearly reveal that the performance of the individual single models falls significantly short in comparison to the proposed algorithm, regardless of whether it is one-step, three-step or five-step forecasting. Moreover, the superiority of the proposed algorithm becomes more apparent as the number of prediction steps increases. This highlights the effectiveness and superiority of the proposed algorithm in accurately predicting wind speed compared to the individual single models.

5.5. Experiment II

To verify the effectiveness of the NNCT strategy, which combines multiple single models with SSA decomposition technology, we conducted experiments using four single models along with SSA (SSA-CBP, SSA-RNN, SSA-GRU, SSA-CCNRNN). Figure 5 displays the forecasting errors of all the models for three-step forecasting and the results of performance indicators for one-step, three-step and five-step forecasting on dataset 1. In Figure 5, the SSA in the models’ names is omitted to ensure a tight layout. From the figures, comparing to the four comparison models, the proposed algorithm consistently exhibits the fewest predicting errors. And it is evident that as the number of prediction steps increases, the fitting effect of all models deteriorates.
Table 5 provides the results of the evaluation indices of the models employed in this experiment. Among all the comparative data, it is apparent that the proposed algorithm outperforms the others across multiple indicators. For example, for one-step forecasting on dataset 4, the proposed algorithm achieves an MAPE index of 1.8978%, while the SSA-CBP, SSA-RNN, SSA-GRU, and SSA-CNNRNN achieve MAPE indices of 2.3410%, 2.7375%, 2.3346%, and 3.7835%, respectively. The best performing one among them reaches only 2.3346%. Similarly, for five-step forecasting on dataset 3, the proposed algorithm achieves an MAPE index of 7.1916%, while the lowest among the four models is the SSA-GRU model, with an MAPE index of 8.6586%. The difference in accuracy is approximately 1.5% when compared to the proposed algorithm.
The comparison results show that the proposed algorithm based on the NNCT strategy, along with SSA decomposition technology, can obtain the best forecasting result. This experiment demonstrates the NNCT strategy can improve the forecasting accuracy in wind speed forecasting.

5.6. Experiment III

To verify the effect of the proposed GPSOGA algorithm, we compare the proposed SSA-GPSOGA-NNCT algorithm with the models using different optimization algorithms (SSA-SA-NNCT, SSA-ACO-NNCT, SSA-GA-NNCT, and SSA-PSO-NNCT). Among the models, SSA decomposition technology is used to preprocess the data, and the NNCT strategy is utilized to combine the prediction results of single models.
Figure 6 illustrates the forecasting results of all the models for one-step forecasting and the performance indicators of the proposed algorithm and the comparison models for one-step, three-step and five-step forecasting on dataset 2. From the comparison of these optimization algorithms, it is evident that the model based on the GPSOGA algorithm outperforms the other models.
Table 6 presents the evaluation metrics for the models in this experiment. A comprehensive analysis can clearly demonstrate that the proposed algorithm outperforms the comparison models across multiple indicators. For example, for one-step forecasting on dataset 2, the MAPE value of the proposed algorithm is 1.2235%, while the MAPE values of the SA, ACO, GA, and PSO models are 4.7473%, 2.9277%, 2.1252%, and 1.3954%, respectively. It is noteworthy that the MAPE values of the PSO algorithm are close to those of the GPSOGA algorithm, while the results of the other three algorithms are inferior to the GPSOGA algorithm.
These results clearly indicate that the proposed GPSOGA algorithm achieves better prediction accuracy compared to the other algorithms considered, highlighting its effectiveness in wind speed forecasting.

5.7. Experiment IV

To evaluate the effectiveness of the SSA decomposition method, we conducted a comparative analysis with two classical decomposition techniques, namely EMD and CEEMDAN. These decomposition methods were applied to the combined model, which integrated the NNCT fusion strategy and the GPSOGA algorithm. Figure 7 shows the forecasting results of the proposed algorithm and the comparison models for one-step, three-step, and five-step forecasting on dataset 1, while Table 7 presents the corresponding performance indicators.
The results clearly demonstrate that the combination method based on SSA decomposition technology consistently outperforms the other decomposition techniques from Figure 7 and Table 7. Particularly, in cases where the combined models based on EMD or CEEMDAN do not perform satisfactorily, the combined model based on SSA exhibits superior predictive performance. For example, for three-step forecasting on dataset 3, the MAPE values of the EMD-based and CEEMDAN-based models are 11.7078% and 12.9240%, respectively. In contrast, the MAPE value of the SSA-based model achieves an impressive 3.9608%.
These results demonstrate the efficiency of SSA decomposition technology, especially when the performance of the EMD and CEEMDAN-based models falls short. The results illustrate that SSA decomposition is suitable for the proposed algorithm.

6. Discussion

In this section, we conduct further validation to demonstrate the advantages of the proposed algorithm. We employ the DM test, Akaike’s information criterion, and the Nash–Sutcliffe efficiency coefficient for this purpose. These statistical measures are utilized to rigorously assess the performance of our proposed model compared to other comparison models.

6.1. Diebold–Mariano Test

The DM test is a statistical hypothesis test widely used to assess the relative accuracy of two comparison forecasting models [47]. The test aims to determine whether one forecasting model is significantly different from the other in terms of forecasting accuracy. Its robustness and ease of implementation have made it a popular choice in the comparison of forecasting methods.
Considering significant level  α , the null hypothesis  H 0  suggests that there is no significant difference between the proposed algorithm and the comparative model. On the other hand, the alternative hypothesis  H 1  represents a different conjecture, asserting that there exists a notable distinction between the proposed algorithm and the comparative model. The hypothesis formula is represented as follows:
H 0   : E [ L ( ε i 1 ) ] = E [ L ( ε i 2 ) ]
H 1   : E [ L ( ε i 1 ) ] E [ L ( ε i 2 ) ]
where  L  denotes the loss function, and  ε i p  ( p = 1 ,   2 ) are the forecasting errors of two comparison models. We use the squared-error loss as the loss function in this paper. Furthermore, the DM test statistics can be defined as
D M = i = 1 n ( L ( ε i 1 ) L ( ε i 2 ) ) / n s 2 / n
where  s 2  is an estimation for the variance in  d i = L ( ε i 1 ) L ( ε i 2 ) .
In this test, under significance level  α , we compare the computed value of DM with  Z α / 2  and  Z α / 2 . The hypothesis  H 0  is accepted if the value falls inside  [ Z α / 2 , Z α / 2 ] . Otherwise,  H 0  is rejected.
The DM test results of the four experiments are presented in Table 8. Upon reviewing the table, it becomes evident that the DM values between the proposed algorithm and the comparison models in experiment I, II, and IV are all greater than the threshold of  Z 0.05 2  = 1.96. For example, in experiment II, the DM values for three-step forecasting on dataset 1 are 12.117, 11.511, 8.776, and 9.033, respectively. Therefore, the null hypothesis can be accepted at the 5% significance level.
In experiment III, the DM values of SSA-SA-NNCT and SSA-GA-NNCT are all greater than 1.96. The DM values of SSA-ACO-NNCT on dataset 4 are lower than 1.96. Comparing the proposed algorithm with SSA-SA-NNCT and SSA-GA-NNCT on dataset 1, dataset 2, and dataset 3, the null hypothesis can be accepted at the 5% significance level. There are five DM values of SSA-PSO-NNCT lower than 1.96, but the DM values of SSA-PSO-NNCT for five-step forecasting are greater than 1.96. For SSA-PSO-NNCT, the null hypothesis can be accepted at the 5% significance level for five-step forecasting on all the datasets. All the DM values of the proposed algorithm and the comparison models in experiment III are greater than the threshold of  Z 0.1 2  = 1.65.
According to the results of the DM test, the proposed algorithm exhibits a significant difference in performance compared with all the comparison models in experiment I, II, and IV, with a probability more than 95%. For experiment III, there is a significant difference between the proposed algorithm and the comparison models, with a probability more than 95% in most cases and the rest with a probability more than 90%.

6.2. Akaike’s Information Criterion

AIC (Akaike’s information criterion) is a statistical measure used for model comparison in the field of time series forecasting [48]. AIC is derived from the likelihood function of the model, considering the number of model parameters and the quality of the fit to the data. It is particularly valuable when comparing multiple comparison models based on the same dataset. AIC is defined as
AIC   = 2 k 2 ln ( L )
where  k  is the number of parameters in the model, and  L  is the maximum likelihood of the model. AIC is used to compare the forecasting performance of different models. The model with a lower AIC value is considered to have better performance, and the absolute value of the AlC cannot determine whether a model is good or bad in terms of its forecasting performance.
The detailed results of AIC are listed in Table 9. From Table 9, the following conclusions can be drawn.
The proposed algorithm consistently has the lowest AIC values across all datasets and steps, suggesting it provides the best trade-off between goodness of fit and simplicity.
The models in experiment I show relatively higher AIC values compared to other models in experiment II and experiment III. This means that the decomposition algorithms and optimization algorithms are necessary in wind speed forecasting. Moreover, 31 out of 44 AIC values are lower when we compare the models in experiment II with the models in experiment III. This observation implies that the decomposition algorithms are more effective at improving forecasting accuracy. The AIC values of models in experiment IV are relatively higher than the models in experiment II and experiment III. This observation suggests that EMD and CEEMDAN are not very suitable for the datasets used in this paper.
According to the results of AIC, we can conclude that the proposed algorithm consistently outperforms the other models across all datasets and steps, indicating its robustness and suitability for the given data.

6.3. Nash–Sutcliffe Efficiency Coefficient

The NSE (Nash–Sutcliffe efficiency coefficient) is a widely used statistical metric for evaluating the performance of forecasting models [49]. The NSE coefficient is based on the comparison of the model’s simulated values with the mean of the observed data, considering both the variability and bias of the model. In this paper, we apply NSE to evaluate the quality of the proposed algorithm. The formula is described as follows:
NSE = 1 t = 1 T ( y o t y m t ) 2 t = 1 T ( y o t y o ¯ ) 2
where  y o  refers to the actual value,  y m  refers to the predicted value,  y t  denotes a certain value at time  t , and  y o ¯  is the average of the observed value. Higher NSE values indicate better performance. The coefficient ranges from negative infinity to 1, where 1 represents a perfect fit, 0 indicates that the model performs as well as the mean values as a predictor, and values less than zero imply that the model’s performance is worse than using the mean value as a predictor.
Table 10 shows the detailed results of NSE. From Table 10, the following conclusion can be drawn.
If we compare the average values of NSE, the top five models in terms of performance are the proposed algorithm, SSA-ACO-NNCT, SSA-PSO-NNCT, SSA-CNNRNN, and SSA-RNN on dataset 1. The proposed algorithm performs the best followed by SSA-PSO-NNCT, SSA-ACO-NNCT, the SSA-RNN, and the SSA-GRU on dataset 2. On dataset 3, The proposed algorithm, SSA-PSO-NNCT, SSA-ACO-NNCT, SSA-GA-NNCT, and SSA-SA-NNCT are the top five models according to their average NSE values. On dataset 4, the proposed algorithm, SSA-PSO-NNCT, SSA-SA-NNCT, SSA-GA-NNCT, and SSA-ACO-NNCT are the best models in terms of performance.
As indicated by the NSE analysis, the proposed algorithm, SSA-ACO-NNCT, and SSA-PSO-NNCT are the most accurate models, and the proposed algorithm consistently outperforms the other models across all datasets and steps.

7. Conclusions and Future Research

The management of wind power relies on precise wind speed forecasting. This paper proposes an innovative wind speed forecasting model to make accurate wind speed predictions. The proposed algorithm uses SSA to decompose the original wind speed time series and PSR to construct samples. Four predictors are employed to forecast the wind speed and the NNCT strategy is utilized to combine their results as the final forecasting results. We develop an optimization algorithm to find the optimal weights of NNCT. We compare the proposed algorithm with different models on four datasets. And the following conclusions can be drawn.
The prediction results of a single model have great limitation and a big gap compared with the combined models. The MAPE of the combined models always achieves better performance than single models. The decomposition technology is necessary to improve the forecasting accuracy. Among the three decomposition methods, SSA outperforms EMD and CEEMDAN. Compared with EMD and CEEMDAN, the MAPE of SSA is improved by 31.32% and 42.69% for three-step forecasting on dataset 1. The proposed GPSOGA can increase the forecasting performance. Compared with SA, ACO, GA, and PSO, the MAPE of GPSOGA is improved by 11.32%, 17.31%, 15.48%, and 7.14% for five-step forecasting on dataset 3.
The DM test shows that the null hypothesis can be accepted at the 5% significance level in most cases. There are significant differences between the proposed algorithm and the 14 models involved in the four experiments. The AIC of the proposed algorithm has the smallest value. This demonstrates that the proposed algorithm outperforms the other models and provides a good balance between fitting accuracy and complexity. The NSE is also employed to compare the proposed algorithm with different models on the four datasets. The results also show that the proposed algorithm outperforms the other models.
The GPSOGA algorithm is used in this paper for optimizing the weights of multiple models. In addition, optimization algorithms are now applied in various fields such as online learning, scheduling, multi-objective optimization, and transportation among others [50]. The GPSOGA algorithm employs multiple search strategies, dynamically adjusts algorithm parameters based on current search states, ensures global search capability, and effectively optimizes local regions. In future research, we will explore more advanced optimization algorithms for other applications, specifically, (1) considering using the proposed optimization algorithm to optimize model hyperparameters, thereby achieving faster optimal hyperparameter acquisition, and (2) considering integrating other self-adaptive algorithms [51,52] and hyper-heuristics algorithms [53] to enhance the proposed optimization algorithm.
This study utilized multiple datasets for extensive experiments, proving that the proposed algorithm offers excellent prediction performance and generalization. However, our proposed model ignores other weather factors related to wind speed, such as temperature, humidity, and pressure. We may build a time series forecasting model that considers these features to obtain more accurate results in the future. In future, we will continue to optimize the hyperparameters, conduct in-depth error analysis, and consider applying the model to other prediction fields.

Author Contributions

Conceptualization, Z.H.; methodology, Y.C.; software, Z.H.; validation, Y.Z., Z.H.; formal analysis, Y.Z.; investigation, Z.H.; resources, Z.H.; data curation, Y.Z.; writing—original draft preparation, Y.Z.; writing—review and editing, Z.H; visualization, Y.Z.; supervision, Y.C.; project administration, Y.C.; funding acquisition, Y.C. All authors have read and agreed to the published version of the manuscript.

Funding

This research was funded by the Natural Science Foundation of Henan Province of China, grant number 232300421385, 222300420296.

Institutional Review Board Statement

Not applicable.

Informed Consent Statement

Not applicable.

Data Availability Statement

No new data was created or analyzed in this study.

Conflicts of Interest

The authors declare no conflict of interest.

References

  1. Perry, S. Wind energy for sustainable development: Driving factors and future outlook. J. Clean. Prod. 2021, 289, 125779. [Google Scholar]
  2. WWEA. WWEA Half-Year Report 2023: Additional Momentum for Windpower in 2023; WWEA: Bonn, Germany, 2023. [Google Scholar]
  3. IEA. World Energy Outlook 2022; IEA: Paris, France, 2022. [Google Scholar]
  4. Arndt, C.; Arent, D.; Hartley, F.; Merven, B.; Mondal, A.H. Faster than you think: Renewable energy and developing countries. Annu. Rev. Resour. Econ. 2019, 11, 149–168. [Google Scholar] [CrossRef]
  5. Rockström, J.; Gaffney, O.; Rogelj, J.; Meinshausen, M.; Nakicenovic, N.; Schellnhuber, H.J. A roadmap for rapid decarbonization. Science 2017, 355, 1269–1271. [Google Scholar] [CrossRef] [PubMed]
  6. Damousis, I.G.; Dokopoulos, P. A fuzzy expert system for the forecasting of wind speed and power generation in wind farms. In Proceedings of the PICA 2001. Innovative Computing for Power-Electric Energy Meets the Market. 22nd IEEE Power Engineering Society. International Conference on Power Industry Computer Applications (Cat. No. 01CH37195), Sydney, NSW, Australia, 20–24 May 2001; IEEE: Piscataway, NJ, USA, 2001. [Google Scholar]
  7. Attig-Bahar, F.; Ritschel, U.; Akari, P.; Abdeljelil, I.; Amairi, M. Wind energy deployment in Tunisia: Status, drivers, barriers and research gaps—A comprehensive review. Energy Rep. 2021, 7, 7374–7389. [Google Scholar] [CrossRef]
  8. Yang, Q.; Huang, G.; Li, T.; Xu, Y.; Pan, J. A novel short-term wind speed prediction method based on hybrid statistical-artificial intelligence model with empirical wavelet transform and hyperparameter optimization. J. Wind Eng. Ind. Aerodyn. 2023, 240, 105499. [Google Scholar] [CrossRef]
  9. Karan, S.; Panigrahi, B.K.; Shikhola, T.; Sharma, R. An imputation and decomposition algorithms based integrated approach with bidirectional LSTM neural network for wind speed prediction. Energy 2023, 278, 127799. [Google Scholar]
  10. Yang, Z.; Dong, S. A novel decomposition-based approach for non-stationary hub-height wind speed modelling. Energy 2023, 283, 129081. [Google Scholar] [CrossRef]
  11. Jiang, Y.; Liu, S.; Zhao, N.; Xin, J.; Wu, B. Short-term wind speed prediction using time varying filter-based empirical mode decomposition and group method of data handling-based hybrid model. Energy Convers. Manag. 2020, 220, 113076. [Google Scholar] [CrossRef]
  12. Hu, J.; Wang, J.; Xiao, L. A hybrid approach based on the Gaussian process with t-observation model for short-term wind speed forecasts. Renew. Energy 2017, 114, 670–685. [Google Scholar] [CrossRef]
  13. Fu, W.; Wang, K.; Tan, J.; Zhang, K. A composite framework coupling multiple feature selection, compound prediction models and novel hybrid swarm optimizer-based synchronization optimization strategy for multi-step ahead short-term wind speed forecasting. Energy Convers. Manag. 2020, 205, 112461. [Google Scholar] [CrossRef]
  14. Neshat, M.; Nezhad, M.M.; Abbasnejad, E.; Mirjalili, S.; Tjernberg, L.B.; Garcia, D.A.; Alexander, B.; Wagner, M. A deep learning-based evolutionary model for short-term wind speed forecasting: A case study of the Lillgrund offshore wind farm. Energy Convers. Manag. 2021, 236, 114002. [Google Scholar] [CrossRef]
  15. Xiong, D.; Fu, W.; Wang, K.; Fang, P.; Chen, T.; Zou, F. A blended approach incorporating TVFEMD, PSR, NNCT-based multi-model fusion and hierarchy-based merged optimization algorithm for multi-step wind speed prediction. Energy Convers. Manag. 2021, 230, 113680. [Google Scholar] [CrossRef]
  16. Wang, K.; Qi, X.; Liu, H.; Song, J. Deep belief network based k-means cluster approach for short-term wind power forecasting. Energy 2018, 165, 840–852. [Google Scholar] [CrossRef]
  17. Zhang, Y.; Zhao, Y.; Kong, C.; Chen, B. A new prediction method based on VMD-PRBF-ARMA-E model considering wind speed characteristic. Energy Convers. Manag. 2020, 203, 112254. [Google Scholar] [CrossRef]
  18. Liu, D.; Ding, L.; Bai, Y.-L. Application of hybrid model based on empirical mode decomposition, novel recurrent neural networks and the ARIMA to wind speed prediction. Energy Convers. Manag. 2021, 233, 113917. [Google Scholar] [CrossRef]
  19. Jiang, Z.; Che, J.; Wang, L. Ultra-short-term wind speed forecasting based on EMD-VAR model and spatial correlation. Energy Convers. Manag. 2021, 250, 114919. [Google Scholar] [CrossRef]
  20. Singh, S.; Mohapatra, A. Repeated wavelet transform based ARIMA model for very short-term wind speed forecasting. Renew. Energy 2019, 136, 758–768. [Google Scholar]
  21. Pazikadin, A.R.; Rifai, D.; Ali, K.; Malik, M.Z.; Abdalla, A.N.; Faraj, M.A. Solar irradiance measurement instrumentation and power solar generation forecasting based on Artificial Neural Networks (ANN): A review of five years research trend. Sci. Total. Environ. 2020, 715, 136848. [Google Scholar] [CrossRef] [PubMed]
  22. Salcedo-Sanz, S.; Ortiz-García, E.G.; Pérez-Bellido, Á.M.; Portilla-Figueras, A.; Prieto, L. Short term wind speed prediction based on evolutionary support vector regression algorithms. Expert Syst. Appl. 2011, 38, 4052–4057. [Google Scholar] [CrossRef]
  23. Zhang, Z.; Ye, L.; Qin, H.; Liu, Y.; Wang, C.; Yu, X.; Yin, X.; Li, J. Wind speed prediction method using shared weight long short-term memory network and Gaussian process regression. Appl. Energy 2019, 247, 270–284. [Google Scholar] [CrossRef]
  24. Wei, D.; Wang, J.; Niu, X.; Li, Z. Wind speed forecasting system based on gated recurrent units and convolutional spiking neural networks. Appl. Energy 2021, 292, 116842. [Google Scholar] [CrossRef]
  25. Gao, Z.; Li, Z.; Xu, L.; Yu, J. Dynamic adaptive spatio-temporal graph neural network for multi-node offshore wind speed forecasting. Appl. Soft Comput. 2023, 141, 110294. [Google Scholar] [CrossRef]
  26. Xiao, L.; Wang, J.; Dong, Y.; Wu, J. Combined forecasting models for wind energy forecasting: A case study in China. Renew. Sustain. Energy Rev. 2015, 44, 271–288. [Google Scholar] [CrossRef]
  27. Zhang, W.; Qu, Z.; Zhang, K.; Mao, W.; Ma, Y.; Fan, X. A combined model based on CEEMDAN and modified flower pollination algorithm for wind speed forecasting. Energy Convers. Manag. 2017, 136, 439–451. [Google Scholar] [CrossRef]
  28. Wang, J.; Zhang, H.; Li, Q.; Ji, A. Design and research of hybrid forecasting system for wind speed point forecasting and fuzzy interval forecasting. Expert Syst. Appl. 2022, 209, 118384. [Google Scholar] [CrossRef]
  29. Niu, X.; Wang, J. A combined model based on data preprocessing strategy and multi-objective optimization algorithm for short-term wind speed forecasting. Appl. Energy 2019, 241, 519–539. [Google Scholar] [CrossRef]
  30. Jian, H.; Lin, Q.; Wu, J.; Fan, X.; Wang, X. Design of the color classification system for sunglass lenses using PCA-PSO-ELM. Measurement 2022, 189, 110498. [Google Scholar] [CrossRef]
  31. Leon, A.S.; Bian, L.; Tang, Y. Comparison of the genetic algorithm and pattern search methods for forecasting optimal flow releases in a multi-storage system for flood control. Environ. Model. Softw. 2021, 145, 105198. [Google Scholar] [CrossRef]
  32. Lv, H.; Chen, X.; Zeng, X. Optimization of micromixer with Cantor fractal baffle based on simulated annealing algorithm. Chaos Solitons Fractals 2021, 148, 111048. [Google Scholar] [CrossRef]
  33. Ghalambaz, M.; Yengejeh, R.J.; Davami, A.H. Building energy optimization using grey wolf optimizer (GWO). Case Stud. Therm. Eng. 2021, 27, 101250. [Google Scholar] [CrossRef]
  34. Chakraborty, S.; Saha, A.K.; Chakraborty, R.; Saha, M. An enhanced whale optimization algorithm for large scale optimization problems. Knowl.-Based Syst. 2021, 233, 107543. [Google Scholar] [CrossRef]
  35. Wang, Y.; Wang, J.; Wei, X. A hybrid wind speed forecasting model based on phase space reconstruction theory and Markov model: A case study of wind farms in northwest China. Energy 2015, 91, 556–572. [Google Scholar] [CrossRef]
  36. He, P.; Fang, Q.; Jin, H.; Ji, Y.; Gong, Z.; Dong, J. Coordinated design of PSS and STATCOM-POD based on the GA-PSO algorithm to improve the stability of wind-PV-thermal-bundled power system. Int. J. Electr. Power Energy Syst. 2022, 141, 108208. [Google Scholar] [CrossRef]
  37. Wang, Y.; Wang, J.; Li, Z.; Yang, H.; Li, H. Design of a combined system based on two-stage data preprocessing and multi-objective optimization for wind speed prediction. Energy 2021, 231, 121125. [Google Scholar] [CrossRef]
  38. Zhou, Q.; Wang, C.; Zhang, G. A combined forecasting system based on modified multi-objective optimization and sub-model selection strategy for short-term wind speed. Appl. Soft Comput. 2020, 94, 106463. [Google Scholar] [CrossRef]
  39. Arteche, J.; García-Enríquez, J. Singular spectrum analysis for signal extraction in stochastic volatility models. Econ. Stat. 2017, 1, 85–98. [Google Scholar] [CrossRef]
  40. Fu, W.; Wang, K.; Li, C.; Tan, J. Multi-step short-term wind speed forecasting approach based on multi-scale dominant ingredient chaotic analysis, improved hybrid GWO-SCA optimization and ELM. Energy Convers. Manag. 2019, 187, 356–377. [Google Scholar] [CrossRef]
  41. Lin, L.; Li, M.; Ma, L.; Baziar, A.; Ali, Z.M. Hybrid RNN-LSTM deep learning model applied to a fuzzy based wind turbine data uncertainty quantization method. Ad Hoc Netw. 2021, 123, 102658. [Google Scholar] [CrossRef]
  42. Li, C.; Tang, G.; Xue, X.; Saeed, A.; Hu, X. Short-term wind speed interval prediction based on ensemble GRU model. IEEE Trans. Sustain. Energy 2019, 11, 1370–1380. [Google Scholar] [CrossRef]
  43. Nachaoui, M.; Afraites, L.; Laghrib, A. A regularization by denoising super-resolution method based on genetic algorithms. Signal Process. Image Commun. 2021, 99, 116505. [Google Scholar] [CrossRef]
  44. Feng, Y.; Lan, C.; Briseghella, B.; Fenu, L.; Zordan, T. Cable optimization of a cable-stayed bridge based on genetic algorithms and the influence matrix method. Eng. Optim. 2022, 54, 20–39. [Google Scholar] [CrossRef]
  45. Katoch, S.; Chauhan, S.S.; Kumar, V. A review on genetic algorithm: Past, present, and future. Multimed. Tools Appl. 2021, 80, 8091–8126. [Google Scholar] [CrossRef] [PubMed]
  46. Zhou, Y.; Wang, R.; Luo, Q. Elite opposition-based flower pollination algorithm. Neurocomputing 2016, 188, 294–310. [Google Scholar] [CrossRef]
  47. Yang, H.; Zhu, Z.; Li, C.; Li, R. A novel combined forecasting system for air pollutants concentration based on fuzzy theory and optimization of aggregation weight. Appl. Soft Comput. 2020, 87, 105972. [Google Scholar] [CrossRef]
  48. Tsvetkova, O.; Ouarda, T.B. Use of the Halphen distribution family for mean wind speed estimation with application to Eastern Canada. Energy Convers. Manag. 2023, 276, 116502. [Google Scholar] [CrossRef]
  49. Lu, Y.; Li, T.; Hu, H.; Zeng, X. Short-term prediction of reference crop evapotranspiration based on machine learning with different decomposition methods in arid areas of China. Agric. Water Manag. 2023, 279, 108175. [Google Scholar] [CrossRef]
  50. Mojgan, S.; Khayamim, R.; Ozguven, E.E.; Dulebenets, M.A. Sustainable decisions in a ridesharing system with a tri-objective optimization approach. Transp. Res. Part D 2023, 125, 103958. [Google Scholar]
  51. Chen, M.; Tan, Y. SF-FWA: A Self-Adaptive Fast Fireworks Algorithm for effective large-scale optimization. Swarm Evol. Comput. 2023, 80, 101314. [Google Scholar] [CrossRef]
  52. Dulebenets, M.A. An Adaptive Polyploid Memetic Algorithm for scheduling trucks at a cross-docking terminal. Inf. Sci. 2021, 565, 390–421. [Google Scholar] [CrossRef]
  53. Singh, E.; Pillay, N. A study of ant-based pheromone spaces for generation constructive hyper-heuristics. Swarm Evol. Comput. 2022, 72, 101095. [Google Scholar] [CrossRef]
Figure 1. The flowchart of CNNRNN.
Sustainability 16 06945 g001
Figure 2. The flow chart of the proposed SSA-GPSOGA-NNCT algorithm.
Sustainability 16 06945 g002
Figure 3. The statistical information of the four datasets used in this paper.
Sustainability 16 06945 g003
Figure 4. The forecasting results of the proposed algorithm and four single forecasting models on dataset 1.
Sustainability 16 06945 g004
Figure 5. The forecasting errors of all the models for three-step forecasting and the performance indicators for one-step, three-step and five-step forecasting on dataset 1.
Sustainability 16 06945 g005
Figure 6. The forecasting results of all the models for one-step forecasting and the performance indicators for one-step, three-step, and five-step forecasting on dataset 2.
Sustainability 16 06945 g006
Figure 7. The results of different forecasting models with different decomposition methods on dataset 1.
Sustainability 16 06945 g007
Table 1. The statistical information of the four wind speed datasets.
DatasetMin.MedianMax.MeanStd.
Dataset 10.35302.66255.58102.77031.1196
Dataset 20.35404.04609.71003.93891.7143
Dataset 30.36401.77605.13601.83420.8890
Dataset 40.36204.054011.81004.40912.2651
Table 2. The comparison models in the four experiments.
ExperimentsComparison Models
Experiment ICBP
RNN
GRU
CNNRNN
Experiment IISSA-CBP
SSA-RNN
SSA-GRU
SSA-CNNRNN
Experiment IIISSA-SA-NNCT
SSA-ACO-NNCT
SSA-GA-NNCT
SSA-PSO-NNCT
Experiment IVEMD-GPSOGA-NNCT
CEEMDAN-GPSOGA-NNCT
Table 3. The specific parameter values of the models used in this paper.
ModelParametersValues
CBP, RNN, GRUNumber of neurons in hidden layers100
Size of batch32
Epochs of training200
CNNRNNNumber of kernels in the CNN layer10
Number of parallel filters in the CNN layer100
Number of neurons in the RNN layer100
Size of batch32
Epochs of training200
CEEMDANNoise standard deviation0.05
Number of realizations50
Maximum sifting iterations300
PSRReconstruction dimension d10
Time delay τ1
SA, ACO, GA, PSO, GPSOGAMaximum iterations100
Number of searching individuals60
Table 4. Results of four evaluation metrics of the proposed model and four single forecasting models.
Step 1Step 3Step 5
MAEMSEMAPE   R 2 MAEMSEMAPER2MAEMSEMAPE   R 2
Dataset 1CBP0.15890.03785.16320.93230.28510.12928.61590.86870.33720.181810.16620.8746
RNN0.16920.04395.33000.92130.32450.164310.00290.90590.38600.233511.67390.8822
GRU0.17150.04755.23730.91490.30160.13649.39700.85580.42500.282712.78510.8940
CNNRNN0.16440.04245.03080.92400.33150.164510.10960.90550.41530.265412.40340.8250
Proposed0.01560.00040.50670.99910.04350.00311.42940.99430.07670.00932.44930.9833
Dataset 2CBP0.49090.477912.08810.92510.57550.622815.47120.90230.64820.793916.86490.8754
RNN0.34650.21199.69220.96670.53000.499714.11490.92160.59600.656915.86750.8969
GRU0.38120.220811.32450.96530.49020.415814.86320.93470.80431.217319.57520.8090
CNNRNN0.37530.218410.74890.96570.52140.445216.50910.93010.65900.765717.7760.8799
Proposed0.04530.00381.22350.99940.10280.01912.95430.99690.18190.05515.62330.9913
Dataset 3CBP0.17100.505714.93850.86390.34700.187630.92410.84330.42780.286838.61480.9005
RNN0.16550.050015.50060.86820.40890.252432.74340.87250.35690.218836.43080.8501
GRU0.16830.051615.15040.85790.30470.152931.32650.91310.33480.191234.33680.8674
CNNRNN0.18980.062218.25510.88720.30110.159628.20730.85760.33610.188731.65480.8503
Proposed0.01820.00061.59090.99600.04440.00343.96080.97690.08160.01137.19160.9247
Dataset 4CBP0.98811.524918.44620.94081.23732.548523.89290.89981.38063.111527.07390.8672
RNN0.99361.60919.26080.9211.22262.556123.42730.8981.36253.136325.78290.8614
GRU0.9811.50418.20360.84571.23352.64124.15340.8781.36053.015725.70060.8898
CNNRNN1.03291.688518.71010.90231.21942.489323.25020.81371.33692.948325.13210.9056
Proposed0.10250.02041.89780.99510.30710.16695.65540.96060.4860.39868.80720.9061
Table 5. Results of four evaluation metrics of the proposed model and four single forecasting models along with SSA.
Step 1Step 3Step 5
MAEMSEMAPE   R 2 MAEMSEMAPER2MAEMSEMAPE   R 2
Dataset 1SSA-CBP0.06420.00632.07430.98850.15020.03175.20320.94310.15560.03395.17810.9392
SSA-RNN0.01690.00050.54400.99900.09960.01273.05500.97720.10590.01743.44440.9688
SSA-GRU0.02220.00080.72470.99850.08230.00982.72540.98220.15140.03254.56510.9417
SSA-CCNRNN0.02550.00100.81920.99810.09250.01243.04970.97780.10940.01793.43570.9679
Proposed0.01560.00040.50670.99910.04350.00311.42940.99430.07670.00932.44930.9833
Dataset 2SSA-CBP0.34610.27006.94720.95760.60161.02979.98640.83850.49610.52669.86780.9174
SSA-RNN0.06540.00761.80380.99870.18820.0515.44750.99200.21310.07466.48700.9882
SSA-GRU0.07360.01161.92550.99810.17620.04855.37440.99230.25620.13866.15790.9782
SSA-CCNRNN0.19750.10674.14920.98320.19150.09634.06090.98480.26860.14137.68610.9778
Proposed0.04530.00381.22350.99940.10280.01912.95430.99690.18190.05515.62330.9913
Dataset 3SSA-CBP0.03130.00152.91070.98990.08990.01238.95010.91810.18300.043814.28630.8796
SSA-RNN0.01780.00081.64450.99460.06890.00736.66730.95140.11890.02179.55690.8558
SSA-GRU0.03380.00173.20080.98810.05540.00534.94100.96440.10150.01818.65860.8797
SSA-CCNRNN0.03280.00183.34720.98770.07870.00956.60680.93700.10330.01728.79490.8857
Proposed0.01820.00061.59090.99600.04440.00343.96080.97690.08160.01137.19160.9247
Dataset 4SSA-CBP0.12730.02992.34100.99290.40830.29867.87890.92960.65380.698512.47930.8354
SSA-RNN0.15250.04032.73750.99040.38930.30037.27880.92920.56870.537510.66280.8734
SSA-GRU0.13140.03242.33460.99230.35510.23186.69040.94530.56410.548510.28980.8708
SSA-CCNRNN0.19820.68303.78350.98390.34350.20216.25340.95240.65050.693211.29170.8367
Proposed0.10250.02041.89780.99510.30710.16695.65540.96060.48600.39868.80720.9061
Table 6. Results of four evaluation metrics of the proposed model and four combined models based on different optimization algorithm.
Step 1Step 3Step 5
MAEMSEMAPE   R 2 MAEMSEMAPER2MAEMSEMAPE   R 2
Dataset 1SSA-SA-NNCT0.13060.02394.23010.95710.05510.00491.77080.99110.12400.02623.98660.9529
SSA-ACO-NNCT0.01740.00060.56820.99890.14800.03484.34570.93760.08030.01012.60240.9818
SSA-GA-NNCT0.03080.00162.77310.98890.06210.00562.04090.98990.13290.02614.25450.9532
SSA-PSO-NNCT0.01580.00050.51350.99910.04400.00331.44680.99410.08010.00982.58160.9824
Proposed0.01560.00040.50670.99910.04350.00311.42940.99430.07670.00932.44930.9833
Dataset 2SSA-SA-NNCT0.19510.07094.74730.98880.37920.24589.31270.96140.30390.16467.96330.9741
SSA-ACO-NNCT0.11470.02142.92770.99660.16010.05183.82520.99180.20140.07135.71300.9888
SSA-GA-NNCT0.09720.02272.12520.99640.35730.21347.83700.96650.34760.25977.61080.9592
SSA-PSO-NNCT0.05180.00511.39540.99910.10600.02142.99770.99660.18630.05605.79980.9912
Proposed0.04530.00381.22350.99940.10280.01912.95430.99690.18190.05515.62330.9913
Dataset 3SSA-SA-NNCT0.04060.00283.57750.98080.05090.00474.46640.96870.09640.01498.30170.9009
SSA-ACO-NNCT0.01990.00071.77730.99520.05130.00454.79020.96990.08610.01237.43890.9179
SSA-GA-NNCT0.14910.04222.76250.99000.05390.00514.68640.96570.09240.01337.78940.9116
SSA-PSO-NNCT0.01970.00071.68730.99530.04890.00414.26580.97270.08420.01167.16220.9228
Proposed0.01820.00061.59090.99600.04440.00343.96080.97690.08160.01137.19160.9247
Dataset 4SSA-SA-NNCT0.14960.03952.86360.99060.34940.20396.81230.95190.51850.44609.43890.8949
SSA-ACO-NNCT0.10620.02141.99280.99490.31870.17486.10910.95880.49360.40698.98110.9041
SSA-GA-NNCT0.14910.04222.76250.99000.34030.20116.17070.95260.53080.48469.69300.8858
SSA-PSO-NNCT0.10660.02151.98080.99490.31200.16695.79630.96060.50690.43339.07670.8979
Proposed0.10250.02041.89780.99510.30710.16695.65540.96060.48600.39868.80720.9061
Table 7. Results of four evaluation metrics of the proposed model and four combined models employing different decomposition algorithms.
Step 1Step 3Step 5
MAEMSEMAPE   R 2 MAEMSEMAPER2MAEMSEMAPE   R 2
Dataset 1EMD-GPSOGA-NNCT0.06780.00732.24510.98690.09550.01413.08100.97460.10800.01863.56660.9665
CEEMDAN-GPSOGA-NNCT0.54030.452510.24780.89340.10020.01573.28230.97180.12870.02604.27430.9533
Proposed0.01560.00040.50670.99910.04350.00311.42940.99430.07670.00932.44930.9833
Dataset 2EMD-GPSOGA-NNCT0.30350.139910.02010.97800.39140.229913.27030.96390.49550.370116.45260.9410
CEEMDAN-GPSOGA-NNCT0.22120.08356.22850.98680.35870.199211.91130.96870.43920.287815.26960.9548
Proposed0.04530.00381.22350.99940.10280.01912.95430.99690.18190.05515.62330.9913
Dataset 3EMD-GPSOGA-NNCT0.09330.01938.76570.87150.13070.036511.70780.85780.15120.047813.81530.8831
CEEMDAN-GPSOGA-NNCT0.08340.01407.56050.90690.14550.040112.92400.83390.15240.040213.59000.8334
Proposed0.01820.00061.59090.9960.04440.00343.96080.97690.08160.01137.19160.9247
Dataset 4EMD-GPSOGA-NNCT0.55340.492810.34450.88390.79391.077314.91120.84620.85451.258716.27170.8435
CEEMDAN-GPSOGA-NNCT0.55430.495110.24250.88330.77601.035614.18220.85610.92651.463816.70900.8552
Proposed0.10250.02041.89780.99510.30710.16695.65540.96060.48600.39868.80720.9061
Table 8. DM test results of different models for four datasets.
Dataset 1Dataset 2Dataset 3Dataset 4
Step 1Step 3Step 5Step 1Step 3Step 5Step 1Step 3Step 5Step 1Step 3Step 5
Experiment ICBP9.27510.20510.0046.8536.5216.4937.9210.1899.1309.0569.2668.843
RNN7.7649.30810.1717.4696.7226.3576.32610.7888.6999.5028.8718.179
GRU8.4559.82210.7389.9376.7757.6716.4748.6228.6338.8888.4898.601
CNNRNN9.49510.59510.7229.5537.7946.6967.357.8558.6649.0539.0888.702
Experiment IISSA-CBP9.29512.1179.8667.1876.7216.8585.0256.96611.8575.0415.0785.399
SSA-RNN2.80311.5116.4525.0198.0513.6912.0246.4957.8755.9854.7603.296
SSA-GRU4.8298.7769.5774.8497.7095.1234.6104.8825.6343.6023.7284.467
SSA-CNNRNN6.1869.0338.0465.685.2565.4114.9598.4086.5918.0863.8096.779
Experiment IIISSA-SA-NNCT13.1218.3786.5057.0277.1114.7897.0223.8864.0815.6692.0832.747
SSA-ACO-NNCT3.6946.0142.3138.1694.7873.1452.4104.0192.4121.7021.9011.803
SSA-GA-NNCT11.2316.1746.8954.6437.9655.1885.6963.9422.7004.4552.6322.906
SSA-PSO-NNCT1.6531.6891.9754.1081.8802.0971.9713.4432.8211.7231.8343.241
Experiment IVEMD-GPSOGA9.3938.2385.06111.389.6188.9774.5315.2734.8289.3996.8586.047
CEEMDAN-GPSOGA9.4218.1726.6968.3169.8939.1686.1196.9135.5429.7486.3146.631
Table 9. AIC results of different models for four datasets.
Dataset1Dataset2Dataset3Dataset4
Step 1Step 3Step 5Step 1Step 3Step 5Step 1Step 3Step 5Step 1Step 3Step 5
Experiment ICBP−442.5−199.1−131.559.8112.3160.3−384.3−125.3−41.3285.9391.2430.8
RNN−412.6−151.5−82.0−101.268.6122.8−386.9−66.6−94.8297.6391.8432.3
GRU−397.1−188.3−44.1−93.032.3244.9−380.8−165.8−121.5279.4398.3424.6
CNNRNN−351.4−151.3−56.6−95.245.8153.2−343.6−157.3−124.2284.3386.6420.1
Experiment IISSA-CBP−794.2−476.9−463.6−53.2211.879.0−1078.6−663.9−413.3−488.8−33.3135.0
SSA-RNN−1294.7−658.5−595.8−757.7−383.2−307.9−1202.8−767.4−551.9−429.4−32.283.1
SSA-GRU−1204.5−707.8−472.0−675.0−393.0−185.2−1047.4−829.3−587.8−472.9−83.487.1
SSA-CNNRNN−1151.0−663.2−590.5−236.9−257.3−181.4−1039.5−716.0−598.0−325.4−110.6133.5
Experiment IIISSA-SA-NNCT−532.7−458.6−514.5−317.9−71.8−151.1−951.4−854.9−626.1−433.4−108.846.2
SSA-ACO-NNCT−1265.7−845.8−702.5−554.6−379.9−316.6−1229.2−862.1−663.4−555.2−139.328.0
SSA-GA-NNCT−508.2−819.9−515.5−543.3−99.8−60.9−1034.9−836.5−648.9−420.7−111.562.6
SSA-PSO-NNCT−1309.3−924.9−709.8−835.6−554.7−364.4−1230.6−882.0−675.8−554.0−148.540.4
Experiment IVEMD-GPSOGA−767.6−636.5−582.0−183.3−85.09.2−574.8−449.2−396.065.9220.8251.6
CEEMDAN-GPSOGA−768.0−615.9−516.3−285.5−113.4−40.6−638.7−430.6−430.266.8212.9281.5
Proposed−1318.9−933.0−719.7−896.9−576.9−367.8−1262.3−915.2−680.6−564.0−148.423.9
Table 10. NSE results of different models for four datasets.
Dataset 1Dataset 2Dataset 3Dataset 1
Step 1Step 3Step 5Step 1Step 3Step 5Step 1Step 3Step 5Step 1Step 3Step 5
Experiment ICBP0.9320.7690.6750.9250.9020.8750.6640.2430.9010.6470.4000.267
RNN0.9210.7060.5820.9670.9220.8970.6680.6730.4500.6260.3980.261
GRU0.9150.7560.4940.9650.9350.8090.6580.1310.2670.6590.3780.290
CNNRNN0.8930.7060.5250.9660.9300.8800.5870.5770.2500.6500.4140.306
Experiment IISSA-CBP0.9890.9430.9390.9580.8390.9170.9900.9180.7100.9930.9300.835
SSA-RNN0.9930.9770.9690.9950.9920.9880.9950.9510.8560.9900.9290.873
SSA-GRU0.9960.9820.9420.9980.9920.9780.9880.9640.8800.9920.9450.871
SSA-CNNRNN0.9980.9780.9680.9830.9850.9780.9880.9370.8860.9840.9520.837
Experiment IIISSA-SA-NNCT0.9570.9380.9530.9890.9610.9740.9810.9690.9010.9910.9520.895
SSA-ACO-NNCT0.9980.9910.9820.9970.9920.9890.9950.9700.9180.9930.9590.864
SSA-GA-NNCT0.9510.9900.9530.9960.9670.9590.9870.9660.9120.9900.9530.886
SSA-PSO-NNCT0.9960.9910.9820.9970.9940.9890.9950.9730.9230.9940.9510.899
Experiment IVEMD-GPSOGA0.9870.9750.9670.9780.9640.9420.8720.7580.6830.8840.7460.704
CEEMDAN-GPSOGA0.9870.9720.9530.9870.9690.9550.9070.7340.7330.8830.7560.655
Proposed0.9990.9940.9830.9990.9970.9910.9960.9770.9250.9950.9610.906
Disclaimer/Publisher’s Note: The statements, opinions and data contained in all publications are solely those of the individual author(s) and contributor(s) and not of MDPI and/or the editor(s). MDPI and/or the editor(s) disclaim responsibility for any injury to people or property resulting from any ideas, methods, instructions or products referred to in the content.

