Article

The Influence of Industrial Structure Adjustment on Carbon Emissions: An Analysis Based on the Threshold Effect of Green Innovation

1
Institute of Ecology and Sustainable Development, Shanghai Academy of Social Sciences, Shanghai 200020, China
2
College of Economic and Social Development, Nankai University, Tianjin 300072, China
3
School of Economics, Sichuan University, Chengdu 610065, China
*
Author to whom correspondence should be addressed.
Sustainability 2024, 16(16), 6935; https://doi.org/10.3390/su16166935
Submission received: 7 June 2024 / Revised: 9 August 2024 / Accepted: 11 August 2024 / Published: 13 August 2024

Abstract

:
As climate change has become a common challenge to global sustainable development, China has also proposed carbon peaking and carbon neutrality goals to cope with it. To achieve the dual-carbon goal, it has released a series of specific measures, like controlling both the amount and intensity of carbon emissions. It has also put in place a “1+N” policy framework for carbon peak and carbon neutrality, among which the industrial structure adjustment and technological progress are the most direct and effective ways to achieve climate-friendly sustainable development. So, it is of great benefit to examine the industrial structure adjustment and corresponding carbon emissions effect for the formulation of reasonable industrial adjustment policies. Based on the provincial panel data of China from 2005 to 2019, this paper adopts the panel threshold model to investigate the influence of industrial structure adjustment on carbon emissions at different levels of green innovation. Its findings show that there exists a nonlinear relationship between the industrial structure adjustment and carbon emissions and the influence of the former on the latter has the threshold effect of green innovation. Specifically, when green innovation capacity falls below a certain threshold value, the industry structure adjustment has no significant correlation with carbon emissions; when the threshold value is exceeded, changing industrial structure can dramatically reduce carbon emissions. According to the findings, it is suggested that in the process of attaining the dual-carbon goal, the government should highly promote industrial restructuring and technological advancement, especially supporting low-carbon and green technological innovation and ensuring the continuity and consistency of green innovation policy to enhance the carbon emission reduction effect of industrial optimization.

1. Introduction

Exceeding the environmental carrying capacity of carbon emissions can lead to a rapid global temperature rise, resulting in a series of problems such as increased severe climate events, reduced availability of food and freshwater, and a higher probability of disease. These issues can have serious negative impacts on the economy and society [1]. In 2020, China’s total carbon dioxide emissions reached 9899.3 million tons, ranking first in the world, and the data are sourced from the Statistical Yearbook of World Energy (2021 edition) [2]. Against the backdrop of this grim carbon emission situation, the Chinese government explicitly stated at the 75th United Nations General Assembly that it would enhance the nation’s voluntary contributions, striving to achieve its carbon peak before 2030 and carbon neutrality before 2060. In order to achieve the dual-carbon goal, the Chinese government has implemented a range of policies at all levels to facilitate the transition to a low-carbon energy and industrial structure, as well as to enhance support for green and low-carbon innovation, among which the double control policy for managing the total amount and intensity of energy consumption and the policy for restricting high energy-consuming industries are most commonly adopted.
Structural adjustment and technological advancement are widely acknowledged as crucial means to accomplish the dual-carbon goal [3,4,5]. According to the dynamic input–output model, Wang Wenju et al. [6] demonstrated that industrial structure upgrading might contribute up to 70% towards China’s goal of reducing carbon intensity emissions. Additionally, green technological innovation, an essential fusion of the concepts of green development and innovation-driven development, plays a crucial role in enhancing carbon emission efficiency and facilitating industrial green transformation [7,8].
This paper aims to investigate the differential impact of industrial structural transition on carbon emissions under varying levels of green innovation. Through empirical research utilizing provincial panel data from China between 2005 and 2019, this study unveils a significant threshold effect of green innovation on the relationship between industrial structural transition and carbon emissions. Compared to the existing literature, this paper distinguishes itself and contributes to several key aspects. In terms of research content, while previous studies have separately explored the impact of industrial structure and innovation levels on carbon emissions, they overlook the potential variation in the carbon reduction effects of industrial structural transition at different innovation levels. This paper bridges this gap by integrating these three factors into a unified analytical framework. From a research perspective, this paper specifically focuses on the threshold effect of green innovation, a departure from general innovation considerations. This targeted approach enhances this study’s efficacy in addressing carbon reduction issues. In terms of research methodology, this paper employs a panel threshold model, moving away from the use of interaction terms or manual grouping methods. Overcoming the incapability to detect the sample heterogeneity of interaction terms and the subjectivity of manual grouping, this approach facilitates the analysis of sample heterogeneity, and mitigates estimation issues arising from subjectively set intervals with the endogenous determination of the threshold quantity and value by the sample.
The subsequent sections of this paper are organized as follows: Section 2 reviews the existing literature and proposes theoretical hypotheses; Section 3 establishes the empirical model, providing explanations for variables and data; Section 4 empirically tests the threshold effect of green innovation on the impact of industrial structural transition on carbon emissions using provincial panel data from 2005 to 2019 in China, conducting robustness tests and heterogeneity analysis; Section 5 draws conclusions and puts forward policy recommendations.

2. Literature Review and Theoretical Hypotheses

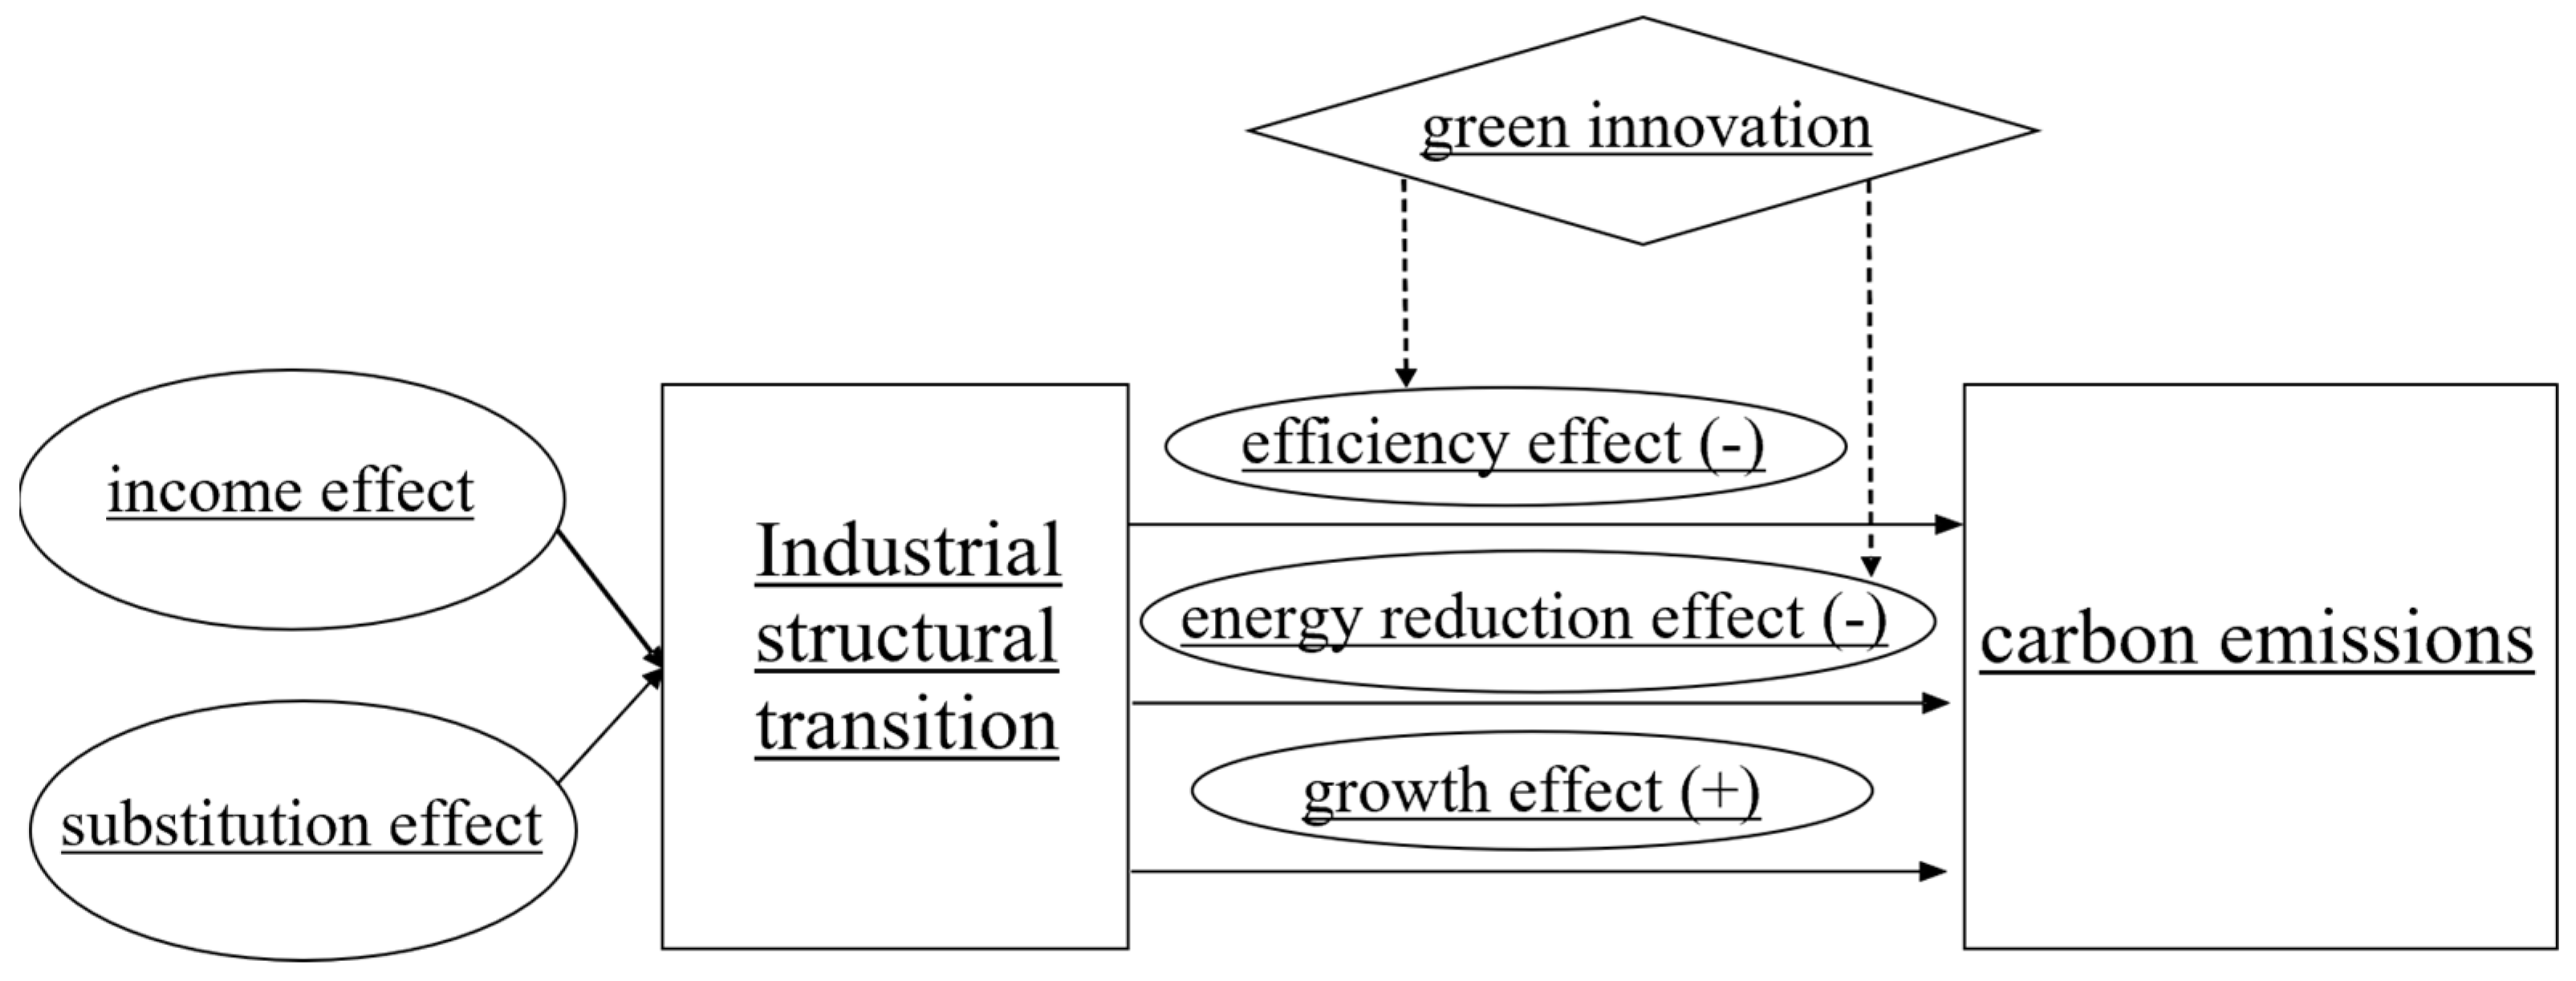
2.1. Industrial Structural Transition and Carbon Emissions

In the course of economic and social development, industrial structural transition exhibits inherent dynamics. The income effect suggests that with rising income levels, individuals tend to increase their consumption of products with high income elasticity [9,10]. Additionally, based on the substitution effect, when there is high substitution elasticity between products, factors tend to shift towards sectors with high technological progress rates [11,12,13]. This is evident in the gradual shift in industrial structural focus from the agriculture sector, with low income elasticity and low technological progress rates; to the industry sector, with moderate income elasticity and moderate technological progress rates; and ultimately to the service sector, with high income elasticity and high technological progress rates. China’s industrial structural transition since the reform and opening-up follows this pattern.
The assertion that industrial structural transition can impact carbon emissions has garnered support from numerous scholars [14]. Confirmation methods fall into two categories: The first involves the decomposition of factors influencing carbon emissions. Scholars like Lin Boqiang and Jiang Zhujun [15] and Guo Chaoxian [16] utilize the logarithmic mean deviation index (LMDI) to explicitly identify industrial structural transition as a significant influencing factor on carbon emissions. The second category incorporates carbon emissions and industrial structural transition directly as dependent and core independent variables, respectively, in econometric models. For example, Talukdar and Meisner [17] employ a random effects model, Tao Changqi et al. [18] use a panel vector autoregressive model (PVAR model), and Sun Pan et al. [19] apply a spatial Durbin model, all empirically confirming the correlation between the two.
Regarding the direction of its impact, some scholars posit that industrial structural transition will negatively affect carbon emissions [19,20,21]. This negative impact is attributed to the “efficiency effect” and the “energy reduction effect” of industrial structural transition. The “efficiency effect” arises from the increased coupling of production factors and enhanced productivity often accompanying industrial structural transition [22]. This results in improved efficiency in utilizing existing energy resources and a reduction in energy consumption per unit output. The “energy reduction effect” is evident in the gradual elimination of outdated production capacities and the substitution of some fossil energy with clean energy during the process of industrial structural transition. Moreover, the shift in industrial structure towards a “service-oriented” model [23] leads to a reduction in overall fossil energy consumption, thereby achieving carbon reduction. Similarly, other scholars believe that industrial structure adjustment can tackle the energy and environmental constraints in economic growth through a “structural dividend” and “technological dividend” [24]. Based on the “structural dividend” hypothesis, it is suggested that the growth in secondary industry is the primary driver behind energy consumption and carbon emissions [25,26]. Therefore, a reduction in the proportion of secondary industry in the industrial structure can significantly reduce energy consumption and carbon emissions. Also, the rationalization of industrial structure can promote the efficient allocation and utilization of resources, particularly through the advancement of producer services. This, in turn, can enhance the production efficiency of manufacturing enterprises, leading to a reduction in energy consumption and carbon emissions across the entire industrial chain [27,28,29]. From the perspective of a “technology dividend”, it is generally accepted that technological innovation is the direct driving force in upgrading an industrial structure, and green innovation presents a crucial breakthrough in facilitating the low-carbon transformation in China’s industries [28,30].
However, there is a counterargument from some scholars, who contend that industrial structural transition may lead to an increase in carbon emissions [31]. This perspective is rooted in the “growth effect” of industrial structural transition. Liu Zaiqi and Chen Chun [32], utilizing seemingly unrelated regression analyses on seven representative countries globally, confirmed that the development of primary, secondary, and tertiary industries all result in a rise in carbon dioxide emissions. As the industrial structure undergoes transition, industries with high production efficiency experience rapid development, increasing the producible amount within the same timeframe. This, in turn, consumes more energy and contributes to an increase in carbon emissions.
The disparity in conclusions regarding the impact direction of industrial structural transition on carbon emissions may not only stem from differences in sample selection and measurement methods but also because the relationship between the two is not simply linear. Guo Chaoxian [16], employing the LMDI method to analyze China’s carbon emissions from 1996 to 2009, found that the current industrial structural transition increases carbon emissions, while in the future, it may promote carbon reduction. Zhao Liping and Li Yuan [33] empirically discovered that the increasing level of urbanization weakens the positive impact of the share of secondary industry on carbon emission intensity. Zhou Di and Luo Dongquan [23] also suggested that the effectiveness of carbon reduction through industrial structural transition varies with the level of green taxation. Based on these findings, this study introduces the first theoretical hypothesis:
Hypothesis H1. 
The impact of industrial structural transition on carbon emissions is nonlinear.

2.2. Green Innovation and Carbon Emissions

Green innovation refers to innovative activities contributing to environmental protection and resource conservation [34,35]. At present, there is no consensus on the action mechanism of green technology innovation for carbon emission reduction. Xia Haili et al. [36] concluded that the technological dividends brought by green technology innovation can enhance carbon emission efficiency by facilitating the upgrading of industrial structure, resulting in a spatial spillover effect. Miao Chenglin et al. [8] adopted a two-way fixed effect model to examine the influence of green innovation on the carbon emission efficiency of high-energy-consuming manufacturing enterprises. This study showed that green innovation can significantly improve the carbon emission efficiency in enterprises, which can be observed throughout all stages of enterprise development. In another study, Liao Tailai et al. [7] suggested that green technology innovation (GTI) exhibits a nonlinear relationship with carbon emission efficiency, and when the GTI level falls within the range of two thresholds of human capital, its impact on carbon emission efficiency gradually intensifies.
Green innovation significantly advances carbon emission reduction via two principal mechanisms: Firstly, GTI can contribute to carbon emission reduction through the “technology dividend”, where energy-saving and clean production technologies decrease carbon intensity in energy consumption, and carbon capture, utilization, and storage (CCUS) technologies can help mitigate carbon emissions at the final stage. Secondly, GTI can carbon emission reduction through the “structural dividend”. On one hand, clean energy technology has the potential to facilitate the reduction in carbon emissions in the energy structure sector. Additionally, it promotes cooperation and resource allocation optimization within the industrial division of labor, leading to synergistic effects and the progress of the industrial structure [8,37]. However, most of the existing literature in the field primarily focuses on the influence of green innovation on the efficiency of carbon emission reduction and puts specific emphasis on the “technological dividend”, which can pose challenges to the identification of a “structural dividend” of green technology innovation. Based on the above points, this study proposes theoretical hypothesis 2:
Hypothesis H2. 
The level of green innovation will affect the carbon emission effects of industrial structural transition.

2.3. Industrial Structure, Green Innovation, and Carbon Emissions

In research investigating the nonlinear impact of industrial structural transition on carbon emissions, some scholars have acknowledged the influence of innovation levels. Sun Zhenqing et al. [38], by integrating the interaction term between industrial structural transition and technological innovation into the model, observed that an increase in the level of innovation enhances the carbon reduction effect of industrial structural transition. Liu Zhihua et al. [27], utilizing the PVAR model, confirmed at the national level that technological innovation, industrial structural transition, and carbon emission efficiency are coordinated and mutually positively reinforcing. Sun Liwen et al. [30] suggested that technological innovation plays a partial mediating role in the impact of industrial structural transition on carbon emissions. Pang Qinghua et al. [39] examined the effects of industrial structure and regional innovation on carbon emissions in Jiangsu Province and discovered that the improvement and upgrade of industrial structure and the enhancement in regional innovation capability can effectively contribute to energy conservation and emission reduction. Zhang F et al. [40] developed a comprehensive framework to analyze the influence of industrial structure and technological progress on carbon intensity. The findings revealed that upgrading the industrial structure indirectly enhances carbon intensity by stimulating technological advancements. Zhao Yuhuan et al. [41] explored the correlation between changes in industrial structure and carbon emissions at the provincial level in China by utilizing a spatial econometric model. It was concluded that upgrading the industrial structure can minimize local and neighborhood carbon emissions, and that technological innovation is an important mediating variable for carbon emission reduction, whose mediating effect has regional heterogeneity.
However, there are still shortcomings in the previous research on the relationship between the carbon emission effect of industrial structural transition and the level of innovation.
In terms of research perspective, most of the aforementioned models focused on regional or spatial perspectives and examined the impact of industrial structure on carbon emissions with technological innovation as the mediating variable, but provided inadequate analysis for the correlation between industrial structure and carbon emission and lacked an examination of the threshold effect of technological innovation.
In terms of methodology, some previous studies employed the method of adding interaction terms, making it challenging to analyze sample heterogeneity, while the method of manual grouping is subjective and may lead to less persuasive results. For example, Su Taoyong et al. [42] added interaction terms to analyze the carbon emission reduction effects of industrial structure adjustment in different pilot cities. Liu Zhihua et al. [27] divided Chinese provinces and cities into three groups, eastern, central, and western, and examined the dynamic relationship between technological innovation, industrial structure upgrade, and carbon emission efficiency. In both cases, the grouping was determined by external factors, which could not reflect the change in structural characteristics within the sample.
In terms of indicator selection, many studies have used general innovation indicators, but traditional innovation metrics often prioritize economic benefits over pollution reduction, and they may not necessarily have a green attribute [43]. Liu Lei et al. [29] employed the panel threshold model to investigate the influence of industrial structure upgrade on carbon emission intensity. Factoring in scientific and technological innovation, they maintained that industrial structure can both promote and inhibit carbon emission intensity, namely, that the inhibitory impact will only arise when the capability of scientific and technological innovation surpasses the threshold value. Although their study took into account the threshold effect of technological innovation, it failed to distinguish between technological innovation and green technological innovation. Since the former has a “rebound effect”, that is, technological progress may raise carbon efficiency while increasing the overall emission scale, it is necessary to further address the issue from the standpoint of green technology innovation. Therefore, measuring the level of innovation in carbon reduction issues using general innovation indicators such as research and development investment and the total number of patent applications is not sufficiently focused. Using green innovation indicators as a replacement is more reasonable.
Based on the above three perspectives, it is believed that this paper can bridge the research gap by integrating three contributing factors into a unified analytical framework: industrial structure adjustment, green innovation, and carbon emission, which can be seen in Figure 1. Specifically, on the one hand, green innovation, with a dual focus on environmental and economic benefits, enables green innovation talents to improve production equipment, optimize the combination of production factors, and enhance industrial resource utilization, thereby achieving relative greening of industries [44]. This allows for the “efficiency effect” of carbon emissions in industrial structural transition to be fully realized. On the other hand, green innovation involves the further development and use of clean energy, making it possible to replace traditional fossil energy with clean energy, thereby promoting the “energy reduction effect” of carbon emissions in industrial structural transition. Based on this, this study proposes theoretical hypothesis 3:
Hypothesis H3. 
When the capacity of green innovation is low, the direction of the impact of industrial structural transition on carbon emissions is uncertain. When the capacity of green innovation is high, industrial structural transition has a significant negative impact on carbon emissions.

3. Empirical Research Design

3.1. Model Specification

In this paper, the panel threshold model [45], which serves to examine the nonlinear relationship between industrial structure adjustment and carbon emissions, offers unique advantages over traditional methods. Firstly, it helps avoid subjective choices by determining thresholds endogenously. For the panel threshold model, the endogenous data determine the threshold value, and the bootstrap approach may quantify its statistical significance [45]. Unlike manual grouping, which is unable to provide an objective standard and significance test for the differences in regression results [46], it can capture the potential structural changes revealed by the data themselves, avoid the subjectivity of the manual threshold, and demonstrate the nonlinear relationship between variables [47]. Secondly, it provides greater objectivity and comprehensiveness for analyzing sample heterogeneity than conventional models. Traditionally, by adding interaction terms, researchers can estimate the specific threshold value, but have difficulty determining cross-term forms or lack the capacity to conduct the significance test for the threshold effect [46]. In contrast to interaction terms, the panel threshold model can establish the threshold value based on the data themselves, allowing for a more objective identification of sample heterogeneity [48]; discerning the distinct associations between samples above and below the threshold value; and addressing the causal variations in independent variables within various ranges [49]. Therefore, this study employs the panel threshold model for analysis.
Based on the preceding theoretical analysis, with the green innovation level as the threshold variable, a single threshold model is established following the method proposed by Hansen [45]:
C e i t = β 0 + β 1 I s c i t I G i i t γ + β 2 I s c i t I G i i t > γ + θ X i t + μ i + ε i t
where the dependent variable is the carbon emission indicator Ce, the core explanatory variable is the industrial structural transition indicator Isc, the threshold variable is the green innovation level indicator Gi, i denotes the province, and t denotes the year. γ is the estimated threshold value, and I(•) is the indicator function, taking the value of 1 when the condition in parentheses is true and 0 otherwise. β0 is the intercept term, and β1 and β2 are the estimated coefficients of the impact of industrial structural transition on carbon emissions when the green innovation level Gi is below or above the threshold value γ. Xit represents a set of control variables; θ represents the corresponding coefficient vector; μi represents the individual effect of the province, such as unobservable factors like natural resource endowment and local policy preferences; and εit represents the random disturbance term.
Similarly, a double threshold model is specified as follows:
C e i t = β 0 + β 1 I s c i t I G i i t γ 21 + β 2 I s c i t I γ 21 < G i i t γ 22 + β 3 I s c i t I G i i t > γ 22 + θ X i t + μ i + ε i t
And a triple threshold model is set up as follows:
C e i t = β 0 + β 1 I s c i t I G i i t γ 31 + β 2 I s c i t I γ 31 < G i i t γ 32 + β 3 I s c i t I γ 32 < G i i t γ 33 + β 4 I s c i t I G i i t > γ 33 + θ X i t + μ i + ε i t

3.2. Variable Explanation

Considering the existing literature and empirical experiences, the measurement methods for the variables used in this study are presented in Table 1.

3.2.1. Carbon Emission Indicator

Official provincial-level carbon dioxide emission data are currently not publicly available in China. This study adopts the method proposed by Shan et al. [50] to calculate provincial carbon emissions using the following formula:
C e = A d i E f i
where Ce is the provincial carbon emissions, Adi is the combustion amount of fossil fuel i in the province, and Ei is the emission factor for the renewal of fossil fuel i in the province [51]. Data sources include the Carbon Emission Accounts and Datasets (CEADs) and the China Energy Statistical Yearbook [52].

3.2.2. Industrial Structural Transition Indicator

From 2005 to 2019, the share of value added in China’s primary industry exhibited a gradual decline, the portion of value added in the secondary industry displayed a fluctuating downward trend, and the contribution of value added in the tertiary industry consistently increased. Given that the share of value added in the primary industry remained below 12% and experienced negligible changes during this period, the pivotal shift in the industrial structure was predominantly observed in the transition from the secondary industry to the tertiary industry. Therefore, in line with the research conducted by Gan Chunhui et al. [53], this study adopts the ratio of value added in the tertiary industry to that in the secondary industry as the measure of industrial structural transition.

3.2.3. Green Innovation Level Indicator

Green patents symbolize the accomplishments of green innovation, and measuring the level of regional green innovation through the quantity of green patents is more direct and persuasive than other indirect methods [54]. Patents are classified into invention patents, utility model patents, and design patents, with their innovation quality generally perceived to decrease in that order [55]. Additionally, since patent authorization involves time for examination and payment of annual fees, it introduces lag and uncertainty [56]. Consequently, this study opts for the number of green patent applications as the metric for the province’s level of green innovation. Green patent applications are categorized under the “Green Technology Patent Classification System” issued by the State Intellectual Property Office (SIPO). The data of green patent applications are from the China Research Data Services Platform (CNRDS).

3.2.4. Control Variables

Considering that other factors may potentially influence provincial carbon emissions, this study incorporates control variables based on existing research.
(1) Economic growth level: In line with the environmental Kuznets curve, which suggests an inverted U-shaped relationship between environmental quality and economic growth, this study gauges the province’s economic growth level using the real regional GDP, with the year 2000 as the base year.
(2) Population size: Existing research offers diverse perspectives on the impact of population size on the environment. This study utilizes the annual resident population of each province to measure this variable.
(3) Energy consumption structure: Scholars typically integrate the energy structure into models examining factors affecting carbon emissions [38]. This study assesses this variable using the ratio of coal consumption to total energy consumption, where coal consumption represents the sum of the consumption of seven related energy terminals.
(4) Urbanization: Numerous scholars, including Sun Yefei and Zhou Min [57], have demonstrated the influence of the degree of urbanization on carbon emissions, although the direction of the impact remains uncertain. This study quantifies this variable using the ratio of the provincial urban population to the total population at the end of the year.
(5) Foreign trade: The degree of foreign trade may also affect carbon emissions [58]. This study measures this variable using the total import and export volume of each province from the China Statistical Abstract and standardizes the unit based on the annual average exchange rate from the China Trade and External Economic Statistical Yearbook.

3.3. Sample Selection

This study utilizes panel data from 30 provinces (including autonomous regions and direct-administered municipalities) in China from 2005 to 2019. (Note: Tibet, Hong Kong, Macao, and Taiwan are excluded due to severe data limitations.) Data related to carbon dioxide emissions are from the CEADs and China Energy Statistical Yearbook. Data on the level of green innovation were sourced from the China Research Data Services Platform (CNRDS). The original data on energy structure are from the China Energy Statistical Yearbook, and the original data for the total import and export volume, measuring the degree of foreign trade, are from the China Statistical Abstract. The unit was standardized based on the annual average exchange rate from the China Trade and External Economic Statistics Yearbook. All other indicators’ original data were sourced from the National Bureau of Statistics.

3.4. Descriptive Statistical Analysis

Descriptive statistics for the sample data are presented in Table 2.

3.4.1. Variation in China’s Carbon Emission Levels:

This study gauges carbon emission levels using two indicators: carbon dioxide emissions and carbon dioxide emission intensity. Carbon dioxide emission intensity is the ratio of carbon dioxide emissions to real gross domestic product (GDP). China’s carbon emission levels from 2005 to 2019 show an overall downward trend in carbon emission intensity during this period. However, carbon emissions have steadily increased, with a noticeable decline only between 2013 and 2016. In recent years, carbon emissions have reached around one hundred billion tons, underscoring the persistent challenges in China’s carbon reduction efforts.

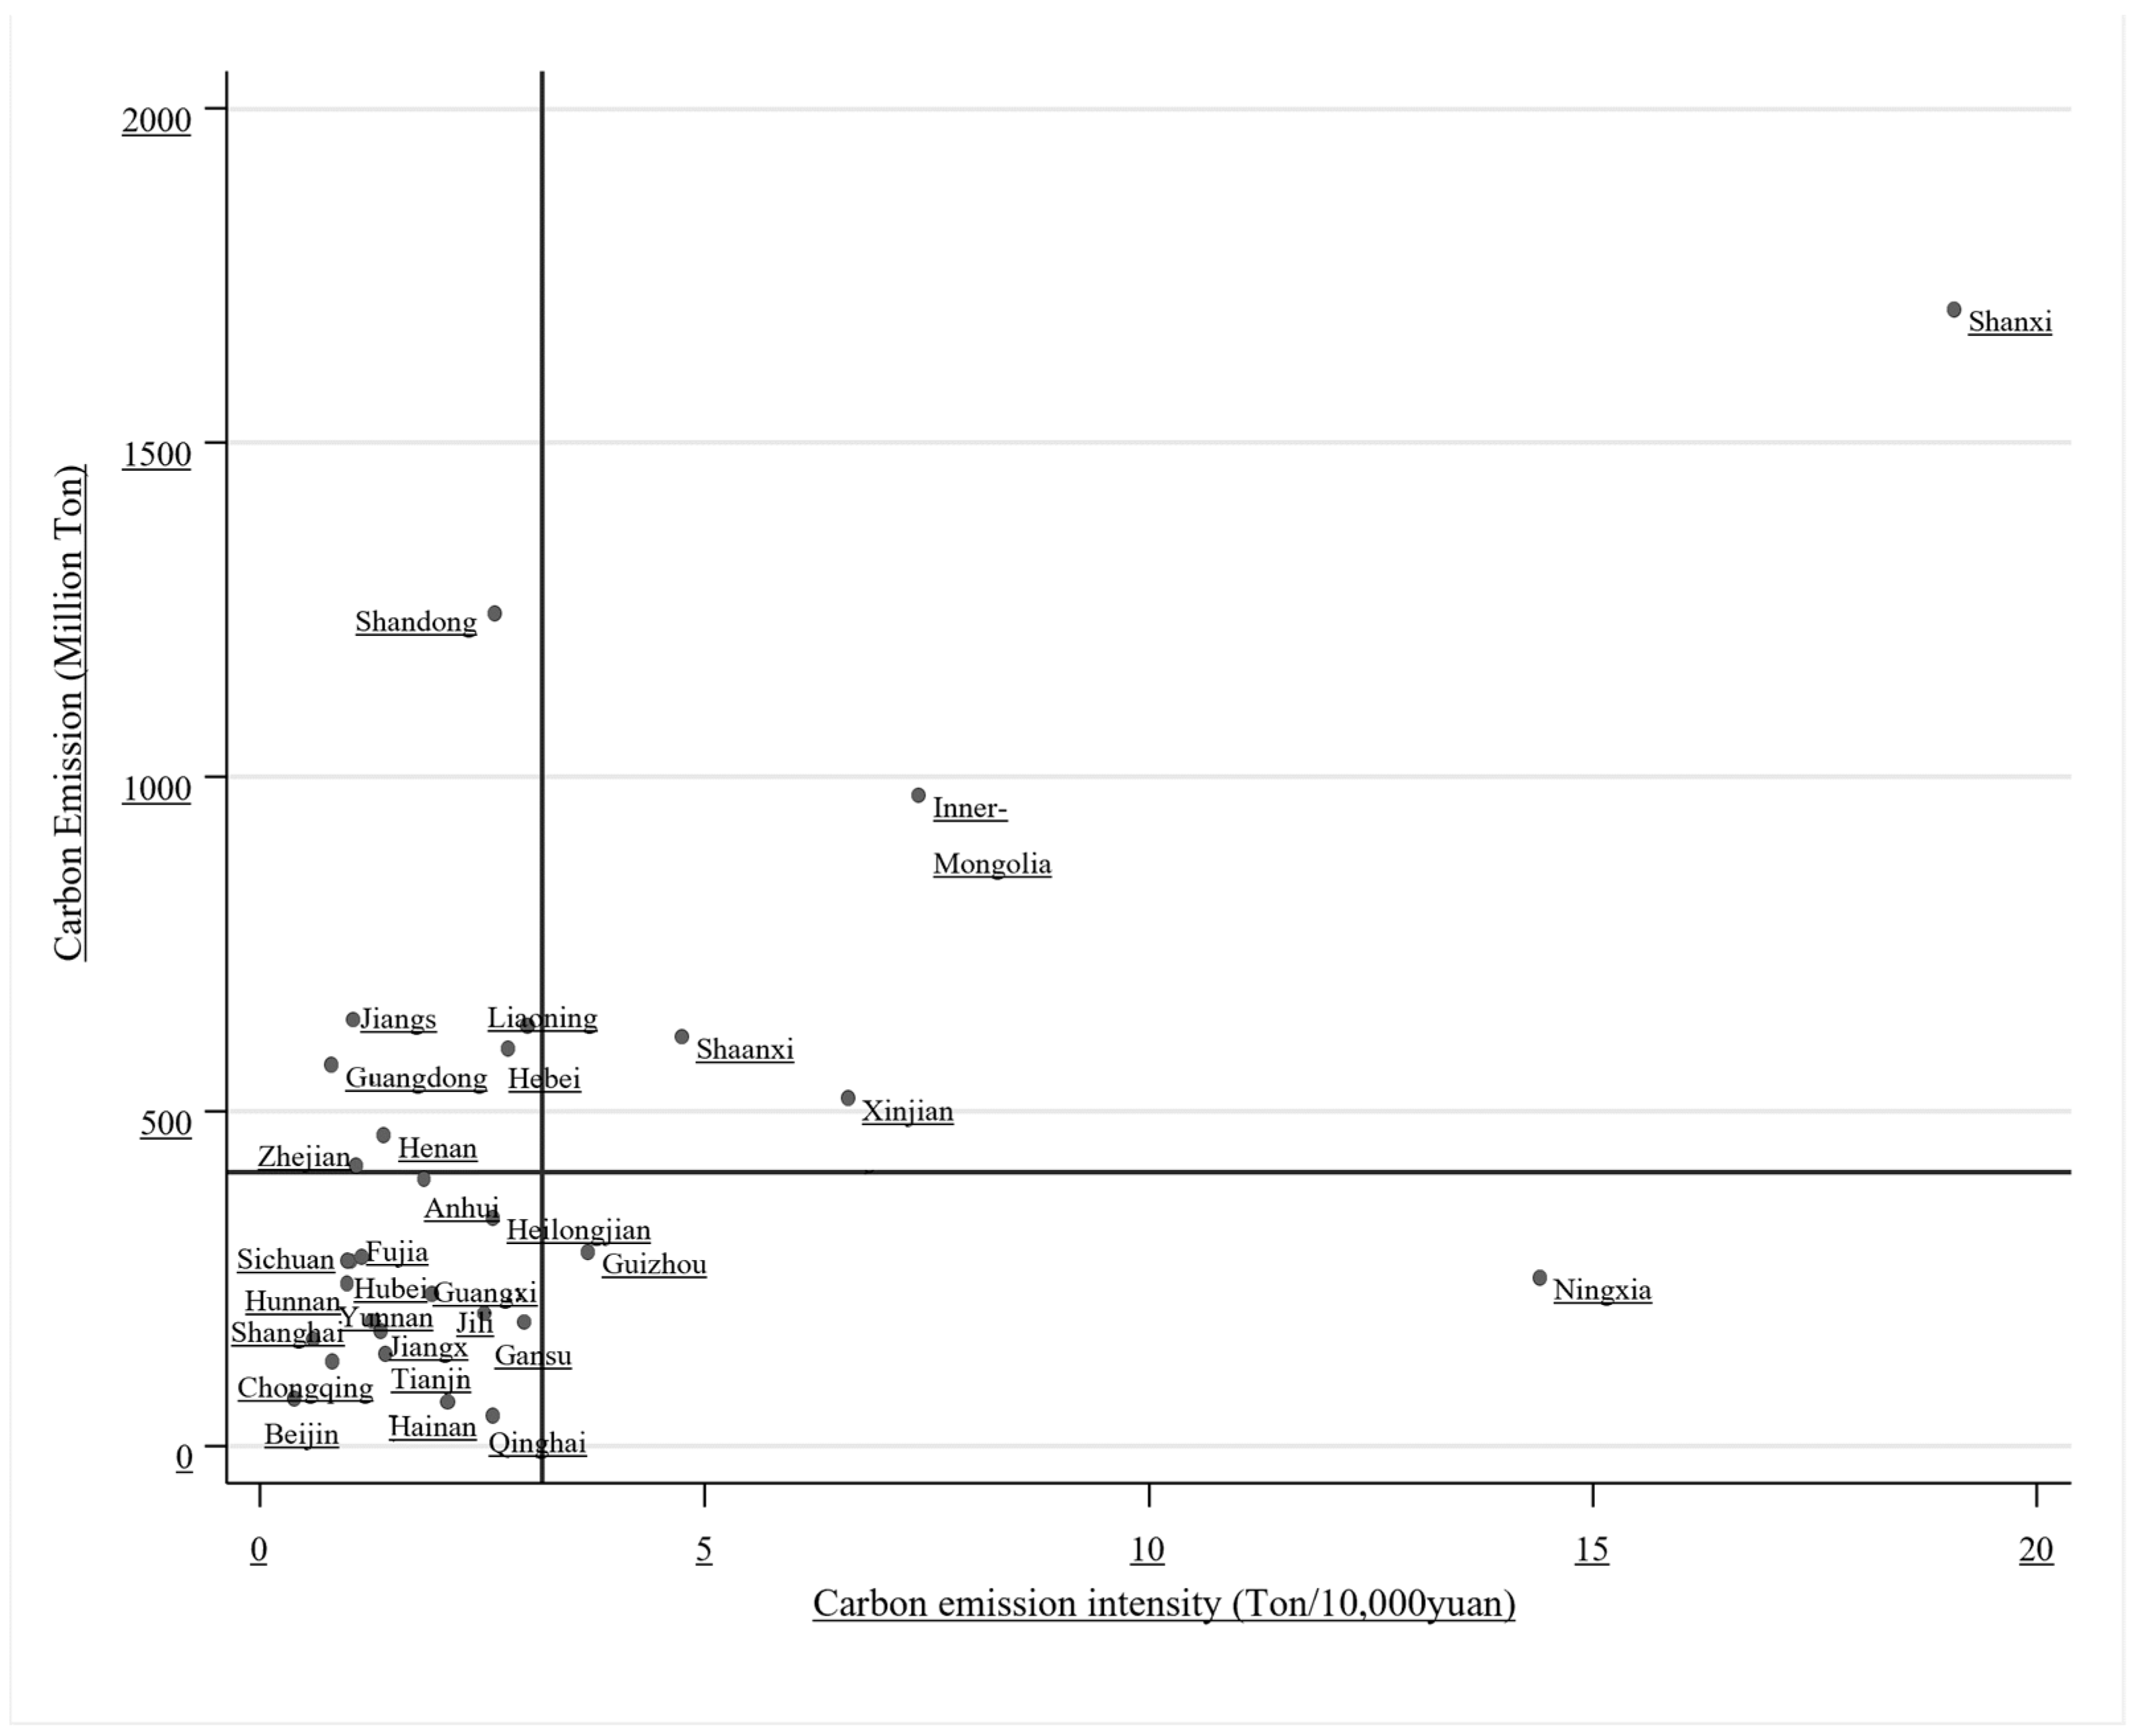
3.4.2. Carbon Emission Levels across Provinces in 2019

Figure 2 displays the carbon emission levels across provinces (including autonomous regions and direct-administered municipalities) in China in 2019. Notably, Ningxia and Guizhou have relatively low carbon emissions but higher emission intensity. In contrast, Shandong, Liaoning, Jiangsu, Hebei, Guangdong, Henan, and Zhejiang exhibit lower emission intensity but higher carbon emissions. Shanxi, Inner Mongolia, Shaanxi, and Xinjiang face both high carbon emissions and intensity, indicating significant challenges in reducing carbon emissions for these regions.

4. Empirical Results Analysis

4.1. Stationarity Test

To address spurious regression issues, this study conducts stationarity tests using both the LLC method, assuming a common unit root, and the ADF–Fisher method, assuming different unit roots, as recommended by Wang Zhao and Wang Lianghu [59] and other scholars. The null hypothesis in both tests is the presence of a unit root. The results in Table 3 indicate that all variables reject the null hypothesis at an at least 5% significance level, confirming the stationarity of the variable sequences and enabling valid regression analysis.

4.2. Hausman Test

As the panel threshold model is built upon the fixed effects model, a Hausman test was employed to determine whether establishing a fixed effects model is appropriate. The p-value of the test was 0.0222, which is less than 0.05. Therefore, the null hypothesis suggesting that a random effects model is more appropriate is rejected. Consequently, establishing a fixed-effects model is deemed suitable.

4.3. Panel Threshold Model Test

4.3.1. Threshold Effect Test

Before conducting the panel threshold regression, it is essential to examine whether a green innovation threshold exists concerning the impact of industrial structural changes on carbon emissions. If a threshold is identified, the number of thresholds must be determined to specify the form of the panel threshold model. Following the methodology of Wang et al. [44], the bootstrap self-sampling method was employed to simulate the LR statistic 300 times, enabling the estimation of threshold values and related statistics. The results presented in Table 4 indicate that in the case of a single threshold, the self-sampling p-value is 0.0067, significantly below the 1% significance level. Conversely, cases with double and triple thresholds are not statistically significant. Consequently, a single-threshold model is constructed based on Equation (1).

4.3.2. Threshold Value Test

To examine the appropriateness of the estimated threshold values, a likelihood ratio function graph was plotted following Hansen’s [45] approach, with a dashed line representing the LR critical value of 7.35 at a 95% confidence level. As shown in Figure 3, the LR statistic is close to 0 at the threshold value of 6.1985. This suggests that the estimation for the single threshold value is correct. It can be concluded that there is a green innovation threshold for the impact of industrial structural changes on carbon emissions, confirming the validity of theoretical hypothesis H2.

4.4. Analysis of Panel Threshold Model Results

The results of the single-threshold model are presented in column (1) of Table 5. When the level of green innovation is below the threshold, there is a positive but insignificant correlation between industrial structural changes and carbon emissions. However, once the green innovation level surpasses the threshold, industrial structural changes exhibit a significant carbon reduction effect at the 1% significance level. Holding other conditions constant, an increase of 1% in the industrial structural changes index results in an average reduction of 0.44% in carbon dioxide emissions. The increase in the green innovation level enhances the carbon emission reduction effect of industrial structural changes, aligning with theoretical hypotheses H1 and H3.
Having established the threshold effect of green innovation on the relationship between industrial structural changes and carbon emissions, the sample was stratified into low and high green innovation groups based on the threshold value for further analysis.
As presented in Table 6, the number of provinces reaching the green innovation threshold has demonstrated a consistent increase nearly every year, with a notable surge observed from 2008 to 2009. This surge may be attributed to the global financial crisis in 2008, which prompted many countries to pursue economic transformation and sustainable development through the implementation of “green new policies”. In 2009, the World Intellectual Property Day theme was “Promoting Green Innovation”, and China approved the establishment of the project “Research on Mechanisms and Policy Innovation for China’s Green Economic Development”. The attention from both central and local governments towards green development escalated. With the concurrent development of the economy and society, awareness of environmental protection and green innovation among enterprises and individuals continued to grow.
From Table 7, it can be observed that in 2005, only five provinces (including direct-administered municipalities), Beijing, Shanghai, Jiangsu, Zhejiang, and Guangdong, had green innovation levels reaching the threshold, accounting for less than 20% of the total. However, the sum of the number of green invention patent applications from these five provinces (including direct-administered municipalities) accounted for nearly 60% of the total nationwide green invention patent applications that year. This indicates that provinces had different starting times for green innovation, and there was a significant difference in the level of green innovation development at that time. By 2019, only three provinces—Hainan, Qinghai, and Ningxia—had not reached the green innovation threshold, accounting for 10% of the total. This suggests a noticeable overall improvement in China’s green innovation level over the 15-year period.

4.5. Robustness Test

4.5.1. Changing the Measurement of the Threshold Variable

While green utility model patents represent secondary inventions that may not align precisely with the innovation quality of green invention patents, they still serve as indicators of the outcomes of green innovation. To some extent, they can reflect a region’s willingness and ability to embrace green innovation. Therefore, this study replaces the number of green invention patents with the number of green utility model patents to measure the threshold variable, green innovation level. Subsequently, a panel threshold model estimation is conducted, and the bootstrap test results for the threshold effect are presented in Table 8.
Observing the results, there is a slight alteration in the threshold value to 5.9814 due to the replacement of the threshold variable measurement indicator. Nevertheless, a single green innovation threshold persists at a significance level of 1%. In this case, the regression results of the panel threshold model are depicted in the second column of Table 5. It is evident that when the green innovation level is below the threshold, industrial structural change has a positive but insignificant impact on carbon emissions. However, after surpassing the green innovation threshold, industrial structural change still exhibits a significant carbon reduction effect. The coefficients’ direction and significance level of the other variables remain consistent with the original regression.

4.5.2. Changing the Measurement of the Dependent Variable

In this study, a new indicator, carbon emission intensity, defined as the ratio of total carbon emissions to the actual regional GDP, is introduced to gauge the level of regional carbon emissions in the panel threshold model estimation. The threshold bootstrap results are detailed in Table 9, revealing the existence of a single green innovation threshold for the impact of industrial structural change on carbon emissions, with a threshold value of 6.1985. The threshold regression results are depicted in the third column of Table 5. While there is a notably positive impact of economic growth on total carbon emissions and a significantly negative impact on carbon emission intensity, the estimation of the other variables remains in line with the original regression.

4.5.3. Changing the Measurement Method of the Core Independent Variable

In addition to the output ratio, the dynamics of industrial structural changes can also be gauged by the employment ratio [60]. In this study, the ratio of employment in the tertiary industry to employment in the secondary industry is employed as an alternative measure for the original indicator of industrial structural changes. The threshold effect, as per the bootstrap test results presented in Table 10, reveals a single green innovation threshold value of 7.2978 at a 5% significance level. The threshold regression results in Table 5, column (4) indicate that when the level of green innovation does not surpass the threshold, there exists a positive relationship between industrial structural changes and carbon emissions. However, once the level of green innovation surpasses the threshold, a negative relationship emerges between industrial structural changes and carbon emissions, with a p-value of 0.126. These results align with the overall findings of the original regression.

4.5.4. Changing the Empirical Model

In this study, a fixed effects model with added interaction terms is employed to delve deeper into the relationship between industrial structural changes, the level of green innovation, and carbon emissions. The specific model is formulated as follows:
l n C e i t = β 0 + β 1 l n I s c i t + β 2 l n G i i t + β 3 l n I s c i t l n G i i t + θ X i t + μ i + λ t + ε i t
where λt represents the year fixed effects, and the meanings of the other variables are consistent with the previous text. The results obtained from regressing this model are presented in Table 11, revealing that the coefficient of the interaction term between industrial structural changes and the level of green innovation is −0.1690 at a 5% significance level. This indicates that as the level of green innovation increases, the negative impact of industrial structural changes on carbon emissions strengthens, consistent with the original conclusion.

4.5.5. Endogeneity Discussion

This paper utilizes a panel threshold model, specifically a fixed effects model, which can mitigate some of the omitted variable problems that do not vary over time and cannot be observed. Additionally, this paper addresses the impact of observable factors by introducing control variables. However, given the multitude of factors influencing carbon emissions, there might still be variables unaccounted for affecting the regression results. Furthermore, regions with high carbon emission levels are more likely to reduce emissions by vigorously promoting industrial structural changes, leading to a potential issue of bidirectional causality. To tackle this concern, this paper relaxes the strict exogeneity conditions of the dynamic panel threshold model, following the approach proposed by Seo, Myung Hwan et al. [61,62] and Ramirez-Rondan, N. R. [63]. The results, as presented in Table 12, indicate that there is still a threshold value of 5.5368 at a 1% significance level in the dynamic panel threshold model. Crossing this threshold significantly enhances the carbon reduction effect of industrial structural changes, confirming the robustness of the findings.

5. Conclusions and Implications

Drawing on panel data from 30 provinces (including autonomous regions/municipalities) in China from 2005 to 2019, this study empirically investigates the threshold effects of green innovation on the association between industrial structural changes and carbon emissions, utilizing a panel threshold model. The key findings are summarized below:
(1)
This study suggests continuous challenges facing China in reducing carbon emissions. Throughout 2005–2019, China observed a general decline in carbon emission intensity, but total carbon emissions, directly tied to environmental capacity, briefly decreased from 2013 to 2016, followed by a subsequent annual rise.
(2)
This study identifies a significant nonlinear threshold effect of green innovation in shaping the correlation between industrial structural changes and carbon emissions, which diverges from previous research in terms of its perspective and conclusion. Xia Haili et al. [36], Pang Qinghua et al. [39], and Zhao Yuhuan et al. [40] concluded that there exists regional heterogeneity in the mediating impact of technological innovation on the basis of the linear relationship between industrial structure adjustment and carbon emissions. In contrast, this study discovers a nonlinear correlation between industrial restructuring and carbon emissions, with the threshold effect of green innovation being one of the factors contributing to the heterogeneity.
(3)
This paper’s finding demonstrates that the impact of industrial adjustment on carbon emissions reduction is not predictable until the threshold of green technology innovation is achieved. Significant reduction in carbon emissions can only be achieved when the capacity of green technology innovation reaches a certain threshold. To some extent, our finding differs from those of several previous studies because the threshold effect can be manifested in various forms. One form is that in different intervals divided by the threshold value, the explanatory factors consistently influence the explained variables in the same way but the magnitudes of these impacts or coefficients vary significantly. For example, Liao’s [7] study indicates that the impact of green technology innovation on emission reduction will be notably greater after the intellectual capital barrier is surpassed. Another form is that in different intervals divided by the threshold value, the influence of explanatory variables on the explained variables may exhibit contrasting effects. For instance, in Liu’s [29] research, once the level of technological innovation surpasses the threshold value, adjusting the industrial structure can lead to carbon emissions reduction. However, if the threshold is not reached, such adjustments may instead result in an increase in carbon emissions. The disparity in the finding mostly stems from the varying choice of study subjects and threshold variables. Liao’s study focused on the correlation between green technology innovation and carbon emissions. Green technology innovation is characterized by conserving resources and energy, as well as protecting environment, which may effectively reduce carbon emissions, independent of the level of human capital. Liu’s study selected technological innovation as the threshold variable. The “rebound effect” of technology may lead to different impacts on carbon emissions during industrial structural adjustments, prior to reaching the threshold of technological innovation. The conclusion of this study is in alignment with the reality. Actually, if we did not promote green technology innovation, the existing sector would remain stagnant at its current level of energy efficiency and carbon emission intensity. In this scenario, merely implementing the strategy of decreasing production capacity or imposing limitations on development may result in enterprises that have high energy consumption and carbon emissions being unable to efficiently organize production at an optimal scale. Moreover, this approach would lead to a decrease in energy utilization efficiency and an overall increase in carbon emissions. It means that before reaching the threshold of green technology innovation, it is challenging to achieve a substantial decrease in carbon emissions via industrial restructuring.
(4)
This study presents that over the years, the number of provinces reaching the green innovation threshold has steadily increased. A notable surge was observed between 2008 and 2009, possibly linked to global efforts, including China’s response to the economic transformation pursuit through green innovation following the 2008 global financial crisis. In 2005, only five provinces met the green innovation threshold, while by 2009, only Hainan, Qinghai, and Ningxia had not reached the threshold.
These findings offer crucial insights for devising effective and pragmatic industrial structural adjustment policies across various provinces within the context of China’s dual-carbon goals, aimed at advancing carbon reduction efforts. Accordingly, the policy implications of this study are as follows:
Firstly, industrial structure adjustment and green technology innovation should be jointly promoted. This study demonstrates that the relationship between industrial structure adjustment and carbon emission reduction is not linear and that the carbon emission reduction effect of industrial structure adjustment is not significant until green innovation surpasses a certain threshold value. This implies that efforts to solely decrease the proportion of secondary industry to reduce carbon emissions may prove challenging in achieving the desired outcome. Instead, it is necessary for all regions to optimize their industrial structure, enhance the research and development capabilities of enterprises in green technology, and foster new momentum for green innovation, which can lead to a mutually beneficial outcome of carbon reduction and economic growth.
Secondly, the support and investment policies for green innovation should be sustainable. Given that the carbon emission reduction effect of industrial restructuring can only be fully realized when the level of green innovation reaches the threshold, green innovation requires consistent, long-term support and investment in order to achieve certain outcomes. For provinces with lower green innovation capacity that has not reached the threshold, such as Hainan, Qinghai, and Ningxia, it is recommended to first create an atmosphere for green innovation through measures such as cultivating talent in green innovation and offering preferential policies for green innovation in enterprises. Moreover, the above policies should be long-term and consistent—so as to ensure that the green innovation capacity reaches the threshold value—and maximize the impact of industrial restructuring on carbon emission reduction.
Thirdly, the development of green services should be enhanced. After achieving higher green innovation capacity, industrial structural adjustments can be made to promote carbon reduction. Given the fundamental and supportive role of manufacturing sectors in the industrial system, the government should not adjust the industrial structure only through the “one-size-fits-all” policy of shutting down and relocating manufacturing industries when promoting the dual-carbon goal. Instead, the focus should be on advancing the service industry, particularly the producer service sector, and boosting its output value. This will enhance the service industry’s contribution to economic growth and facilitate the optimization of the industrial structure. In this study recommends provinces with green innovation capacity that has already reached the threshold concentrate on stabilizing the secondary industry and actively promoting the development of high-quality green services to gradually reduce carbon emissions.
There may be several possible limitations in this study. For instance, the current study is limited by the fact that it is restricted to the perspective of industrial structure supererogation. A future study might offer a multi-dimensional examination, like the perspective of industrial structure rationalization. Another weakness is that the existing analytical framework is limited to examining the relationship between industrial structure adjustment and carbon emissions above and below an estimated threshold value. Other nonlinear modeling methods, such as the panel quantile model, have distinct advantages, but due to constraints in terms of the initial research design and manuscript length, they might be incorporated into a following study to uncover additional nuances or heterogeneities in the underlying dynamics. Considering the above, future study should be undertaken to offer more perspectives and approaches to investigate the influence of industrial structure adjustment on carbon emissions.

Author Contributions

Conceptualization, W.-B.Z.; Methodology, Z.-H.X.; Software, Z.-H.X.; Formal analysis, C.-J.Y.; Resources, C.-J.Y.; Data curation, Z.-H.X.; Writing—original draft, W.-B.Z.; Writing—review & editing, W.-B.Z.; Visualization, C.-J.Y.; Supervision, W.-B.Z. and C.-J.Y.; Project administration, W.-B.Z. All authors have read and agreed to the published version of the manuscript.

Funding

This research received no external funding.

Institutional Review Board Statement

Not applicable.

Informed Consent Statement

Not applicable.

Data Availability Statement

The data presented in this study are available on request from the corresponding author.

Conflicts of Interest

The authors declare no conflict of interest.

References

  1. Fu, Y.; Ma, Y.; Liu, Y. Development Patterns of Low Carbon Economy. China Popul. Resour. Environ. 2008, 18, 14–19. [Google Scholar]
  2. Bp. Statistical Yearbook of World Energy (2021 Edition). Available online: https://www.bp.com.cn/content/dam/bp/country-sites/zh_cn/china/home/reports/statistical-review-of-world-energy/2021/BP_Stats_2021.pdf (accessed on 7 June 2024).
  3. Xu, Y.; Zhang, R.; Sun, W. Green Technology Innovation, Factor Market Distortion and Industrial Structure Upgrading. RD Manag. 2021, 33, 75–86. [Google Scholar]
  4. Bell, D. The Coming of Post-Industrial Society: A Venture in Social Forecasting; Basic Books: New York, NY, USA, 1973. [Google Scholar]
  5. Herrendorf, B.; Rogerson, R.; Valentinyi, A. Growth and structural transformation. Handb. Econ. Growth 2014, 2, 855–941. [Google Scholar]
  6. Wang, W.J.; Xiang, Q.F. Adjustment of Industrial Structure and the Potential Assessment of Energy Saving and Carbon Reduction. China Ind. Econ. 2014, 1, 44–56. [Google Scholar]
  7. Liao, T.; Yan, J.; Zhang, Q. The impact of green technology innovation on carbon emission efficiency: The intermediary role of intellectual capital. Int. Rev. Econ. Financ. 2024, 92, 520–532. [Google Scholar] [CrossRef]
  8. Miao, C.; Chen, Z.; Zhang, A. Green technology innovation and carbon emission efficiency: The moderating role of environmental uncertainty. Sci. Total Environ. 2024, 938, 173551. [Google Scholar] [CrossRef] [PubMed]
  9. Kongsamut, P.; Rebelo, S.; Xie, D. Beyond Balanced Growth. Rev. Econ. Stud. 2001, 68, 869–882. [Google Scholar] [CrossRef]
  10. Boppart, T. Structural change and the Kaldor facts in a growth model with relative price effects and non-Gorman preferences. Econometrica 2014, 82, 2167–2196. [Google Scholar] [CrossRef]
  11. Baumol, W.J. Macroeconomics of Unbalanced Growth: The Anatomy of Urban Crisis. Am. Econ. Rev. 1967, 57, 415–426. [Google Scholar]
  12. Ngai, L.R.; Pissarides, C.A. Structural change in a multisector model of growth. Am. Econ. Rev. 2007, 97, 429–443. [Google Scholar] [CrossRef]
  13. Xu, Z. Industrialization and Post-industrialization: “Inverted U-shaped” Industrial Structural Transformation. J. World Econ. 2010, 33, 67–88. [Google Scholar]
  14. Zhao, Z.Y.; Yang, C.F. The Decomposition Analysis on the Driving Factors of China’s Carbon Emission. China Soft Sci. 2012, 6, 175–183. [Google Scholar]
  15. Lin, B.; Jiang, Z. Prediction of Environmental Kuznets Curve of CO2 in China and Analysis of Influencing Factors. J. Manag. World 2009, 4, 27–36. [Google Scholar]
  16. Guo, C. Effect of Industrial Structure Change on Carbon Emission in China. China Population. Resour. Environ. 2012, 22, 15–20. [Google Scholar]
  17. Talukdar, D.; Meisner, C.M. Does the private sector help or hurt the environment? Evidence from carbon dioxide pollution in developing countries. World Dev. 2001, 29, 827–840. [Google Scholar] [CrossRef]
  18. Tao, C.; Peng, Y.; Ju, Z. An Empirical Study on Economic Growth, Industrial Structure and the Carbon Emissions —Based on PVAR Model. Econ. Surv. 2015, 32, 126–131. [Google Scholar]
  19. Sun, P.; Wu, Y.; Bao, S. Study on the Effects of Industrial Structure Change on Carbon Reduction— An Empirical Study Based on Spatial Econometrics Model. Econ. Surv. 2018, 35, 93–98. [Google Scholar]
  20. Chang, N. Changing industrial structure to reduce carbon dioxide emissions: A Chinese application. J. Clean. Prod. 2015, 103, 40–48. [Google Scholar] [CrossRef]
  21. Li, B.; Zhang, X. Research on the Impact of Industrial Structure Upgrading on Carbon Emission Reduction in China. Ind. Econ. Rev. 2017, 8, 79–92. [Google Scholar]
  22. Gan, C.; Zheng, R. An Empirical Study on Change of Industrial Structure and Productivity Growth since the Reform and Opening-up—A Test for the Structure-bonus Hypotheses from 1978 to 2007 in China. China Ind. Econ. 2009, 2, 55–65. [Google Scholar]
  23. Zhou, D.; Luo, D. Green taxation, industrial structure transformation and carbon emissions reduction. Resour. Sci. 2021, 43, 693–709. [Google Scholar]
  24. Shao, S.; Fan, M.T.; Yang, L.L. Economic Restructuring, Green Technical Progress, and Low-Carbon Transition Development in China-An Empirical Investigation Based on the Overall Technology Frontier and Spatial Spillover Effect. J. Manag. World 2022, 38, 46–69+4–10. [Google Scholar]
  25. Fisher-Vanden, K.; Jefferson, G.H.; Jingkui, M. Technology development and energy productivity in China. Energy Econ. 2006, 28, 690–705. [Google Scholar] [CrossRef]
  26. Elliott RJ, R.; Shanshan, W.U. Industrial activity and the environment in China: An industry- level analysis. China Econ. Rev. 2008, 19, 393–408. [Google Scholar]
  27. Liu, Z.; Xu, J.; Zhang, C. Technological innovation, industrial structure upgrading and carbon emissions efficiency: An analysis based on PVAR model of panel data at provincial level. J. Nat. Resour. 2022, 37, 508–520. [Google Scholar] [CrossRef]
  28. Zhang, W.; Zhu, Q.G.; Gao, H. Upgrading of Industrial Structure, Optimizing of Energy Structure, and Low Carbon Development of Industrial System. Econ. Res. J. 2016, 51, 62–75. [Google Scholar]
  29. Lei, L.; Yang, L. Research on upgrading of industrial structure and carbon emission intensity based on analysis of threshold effect of scientific and technological innovation. J. Shenyang Univ. Technol. (Soc. Sci.) 2024, 17, 31–39. [Google Scholar]
  30. Sun, L.; Li, Y.; Ren, X. Upgrading Industrial Structure, Technological Innovation and Carbon Emission: A Moderated Mediation Model. J. Technol. Econ. 2020, 39, 1–9. [Google Scholar]
  31. Wang, Q.; Qu, J.; Wang, B.; Wang, P.; Yang, T. Green technology innovation development in China in 1990–2015. Sci. Total Environ. 2019, 696, 134008. [Google Scholar] [CrossRef]
  32. Liu, Z.; Chen, C. Research on Low-carbon Economy and Industrial Structure Adjustment. Soc. Sci. Int. 2010, 3, 21–27. [Google Scholar]
  33. Zhao, L.; Li, Y. The Impact of Industrial Structure on Carbon Emission Intensity. Urban Probl. 2018, 6, 61–66. [Google Scholar]
  34. Yu, S. Research on the conception and classification of green technology. J. Wuhan Inst. Technol. 2007, 5, 40–42. [Google Scholar]
  35. Wang, M.; Li, Y.; Wang, Z. Heterogeneity Analysis of the Impact of Environmental Regulation on Green Technology Innovation of Enterprises—Based on Large Sample Data of Industrial Enterprises in China. Inq. Econ. Issues 2022, 2, 67–81. [Google Scholar]
  36. Xia, H.L.; Tang, Y. Green Technology Innovation, Industrial Structure Upgrading and Carbon Emission Efficiency. J. Suzhou Univ. Sci. Technol. (Soc. Sci. Ed.) 2024, 41, 36–45. [Google Scholar]
  37. Sharif, A.; Raza, S.A.; Ozturk, I.; Afshan, S. The dynamic relationship of renewable and nonrenewable energy consumption with carbon emission: A global study with the application of heterogeneous panel estimations. Renew. Energy 2019, 133, 685–691. [Google Scholar] [CrossRef]
  38. Sun, Z.; Liu, B.; Li, H. Industrial Restructuring, Technological Innovation and Regional Carbon Emission Reduction—Empirical Research Based on Regional Panel Data. Reform Econ. Syst. 2020, 3, 101–108. [Google Scholar]
  39. Pang, Q.H.; Yang, T.T.; Li, H. The Spatial Relationship between Urban Carbon Emissions, Industrial Structure and Regional Innovation-An Analysis Based on the Data from 13 Prefecture. East China Econ. Manag. 2018, 32, 20–26. [Google Scholar]
  40. Zhang, F.; Deng, X.; Phillips, F.; Fang, C.; Wang, C. Impacts of industrial structure and technical progress on carbon emission intensity: Evidence from 281 cities in China. Technol. Forecast. Soc. Chang. 2020, 154, 119949. [Google Scholar] [CrossRef]
  41. Zhao, Y.H.; Qian, Z.L.; Xu, X. Study on the Impact of Industrial Structure Upgrading on Carbon Emissions in China in the Context of Carbon Peaking and Carbon Neutrality. Inq. Econ. Issues 2022, 3, 87–105. [Google Scholar]
  42. Su, T.Y.; Yu, Y.Z.; Pan, J.X. Carbon Emission Reduction Effect of Low-carbon Cities and Innovative Cities-Based on the Synergic Perspective of Green Innovation and Industrial Upgrading. Sci. Sci. Manag. S. T. 2022, 43, 21–37. [Google Scholar]
  43. Xu, Z.; Wang, W. Heterogeneous Sectoral Elasticity of Substitution and Structural Transformation. Econ. Res. J. 2021, 56, 77–92. [Google Scholar]
  44. Wang, W.; Ma, S.; Jiang, B. Research on Factors of High-Tech Industry Innovation Driving Low-Medium-Tech Industry Economic Growth. China Ind. Econ. 2015, 3, 70–82. [Google Scholar]
  45. Hansen, B.E. Threshold effects in non-dynamic panels: Estimation, testing, and inference. J. Econ. 1999, 93, 345–368. [Google Scholar] [CrossRef]
  46. Shen, N.; Liu, F.C. Can Intensive Environmental Regulation Promote Technological Innovation?—Porter Hypothesis Reexamined. China Soft Sci. 2012, 4, 49–59. [Google Scholar]
  47. Bai, J. Estimation of a Change Point in Multiple Regression Models. Rev. Econ. Stat. 1997, 97, 551–563. [Google Scholar] [CrossRef]
  48. Yuan, Y.J.; Xie, R.H. Research on the Effect of Environmental Regulation to Industrial Restructuring-Empirical Test Based on Provincial Panel Data of China. China Ind. Econ. 2014, 8, 57–69. [Google Scholar]
  49. Li, M.; Liu, S.C. The regional differences and threshold effects of the reverse technology spillover of FDI—A threshold regression analysis based on Chinese provincial panel data. J. Manag. World 2012, 1, 21–32+66. [Google Scholar]
  50. Shan, Y.; Liu, J.; Liu, Z.; Xu, X.; Shao, S.; Wang, P.; Guan, D. New provincial CO2 emission inventories in China based on apparent energy consumption data and updated emission factors. Appl. Energy 2016, 184, 742–750. [Google Scholar] [CrossRef]
  51. Liu, Z.; Guan, D.; Wei, W.; Davis, S.J.; Ciais, P.; Bai, J.; Peng, S.; Zhang, Q.; Hubacek, K.; Marland, G.; et al. Reduced carbon emission estimates from fossil fuel combustion and cement production in China. Nature 2015, 524, 335–338. [Google Scholar] [CrossRef]
  52. National Bureau of Statistics. China Energy Statistical Yearbook (2020); China Statistics Press: Beijing, China, 2020. [Google Scholar]
  53. Gan, C.; Zheng, R.; Yu, D. An Empirical Study on the Effects of Industrial Structure on Economic Growth and Fluctuations in China. Econ. Res. J. 2011, 46, 4–16+31. [Google Scholar]
  54. Bettencourt, L.M.; Lobo, J.; Strumsky, D. Invention in the city: Increasing returns to patenting as a scaling function of metropolitan size. Res. Policy 2007, 36, 107–120. [Google Scholar] [CrossRef]
  55. Chen, C.; Wang, Z.; Guan, C. Green Innovation Effects of the National Innovative City Pilot Policy: Quasi-experimental Evidence from 281 Prefecture-level Cities. J. Beijing Norm. Univ. (Soc. Sci.) 2022, 1, 139–152. [Google Scholar]
  56. Ma, Y.; Zhao, L.; Yang, H.; Tang, G. Air pollution and corporate green innovation: Based on the empirical evidence of A-share listed companies in heavy polluting industries. Ind. Econ. Res. 2021, 6, 116–128. [Google Scholar]
  57. Sun, Y.; Zhou, M. Impact of urbanization and higher performance industrial structure on CO2 emissions in China: Independent and coupling effects. Resour. Sci. 2016, 38, 1846–1860. [Google Scholar]
  58. Yang, K.; Liu, S. Empirical Investigation of the Relationship between Trade Openness, Economic Growth and Carbon Emissions: Evidence form Eleven Emerging Economies. World Econ. Stud. 2017, 11, 112–120+137. [Google Scholar]
  59. Wang, Z.; Wang, L. A Study on the Relationship Among R&D Input, Upgrading Industrial Structure and Carbon Emission. J. Ind. Technol. Econ. 2019, 38, 62–70. [Google Scholar]
  60. Jia, J.; Yin, L. Research on the Structural Dynamics and Evolution of China’s Economic Growth System: An Empirical Study Based on the Nicholas-Kaldor Approach. Stat. Inf. Forum 2018, 33, 64–72. [Google Scholar]
  61. Seo, M.H.; Shin, Y. Dynamic panels with threshold effect and endogeneity. J. Econ. 2016, 195, 169–186. [Google Scholar] [CrossRef]
  62. Seo, M.H.; Kim, S.; Kim, Y.J. Estimation of Dynamic Panel Threshold Model Using Stata. Stata J. 2019, 19, 685–697. [Google Scholar] [CrossRef]
  63. Ramirez-Rondan, N.R. Maximum likelihood estimation of dynamic panel threshold models. Econ. Rev. 2020, 39, 260–276. [Google Scholar] [CrossRef]
Figure 1. Mechanism diagram.
Sustainability 16 06935 g001
Figure 2. Carbon emission levels across provinces in 2019.
Sustainability 16 06935 g002
Figure 3. Likelihood ratio function graph.
Sustainability 16 06935 g003
Table 1. Variable names and measurement methods.
VariableDescription
Carbon emission (Ce)The method proposed by Shan et al. [50]
Industrial structural transition (Isc)The ratio of value added in the tertiary industry to that in the secondary industry
Green innovation level [9]The number of green patent applications
Economic growth level (Gdp)The real regional GDP, with the year 2000 as the base year.
Population size (Pop)The annual resident population of each province
Energy consumption structure [12]The ratio of coal consumption to total energy consumption
Urbanization (Urb)The ratio of the provincial urban population to the total population at the end of the year
Foreign trade (Tra)The total import and export volume of each province
Table 2. Descriptive statistics for variables.
VariableObs.MeanStd. DevMinMax
Carbon emission (Ce)450322.259267.9577.5551700.044
Industrial structural transition (Isc)4501.1740.6500.5275.234
Green innovation level [9]4502581.0604707.9026.00032,269.000
Economic growth level (Gdp)45012,496.23011,600.770453.21171,079.130
Population size (Pop)4504496.2842747.031543.00012,489.000
Energy consumption structure [12]45042.88715.5301.21476.006
Urbanization (Urb)45054.10813.93526.86394.152
Foreign trade (Tra)4507421.80212,786.78033.586071,602.100
Note: Due to the varying magnitudes in different indicators, a logarithmic transformation was applied to the variables in the empirical analysis.
Table 3. Stationarity test results.
VariableLLC
(Assuming a Common Unit Root)
ADF–Fisher
(Assuming Different Unit Roots)
lnCe−4.2915 ***152.6707 ***
(0.00)(0.00)
lnIsc−4.5381 ***139.9460 ***
(0.00)(0.00)
lnGip−4.2113 ***155.4067 ***
(0.00)(0.00)
lnGdp−2.4105 ***175.3580 ***
(0.00)(0.00)
lnPop−3.4547 ***137.8377 ***
(0.00)(0.00)
lnEs−17.5998 ***126.9721 ***
(0.00)(0.00)
lnUrb−4.6802 ***128.9023 ***
(0.00)(0.00)
lnTra−1.9356 **123.6784 ***
(0.03)(0.00)
Note: values in parentheses represent p-values. Note: ***, ** respectively, indicate significance at the 1%, 5% levels.
Table 4. Bootstrap self-sampling test results for threshold effect.
Explained VariablesExplanatory VariablesThreshold VariablesThreshold InspectionThreshold Valuesf-Valuep-ValueBS Times95% Confidence Interval
lnCelnIsclnGiSingle threshold ***6.198583.910.0067300[6.1924,
6.2005]
Double threshold6.198515.790.3367300[6.1924,
6.2005]
5.1648[4.9704,
5.1761]
Triple threshold6.198523.340.4033300[6.1924,
6.2005]
5.1648[4.9704,
5.1761]
3.9890[3.9512,
4.0431]
Note: *** indicate significance at the 1% levels.
Table 5. Regression analysis results.
Variables(1)(2)(3)(4)
lnIsc(lnGi ≤ γ)0.27740.29510.27740.0708
(1.11)(1.10)(1.11)(0.43)
lnIsc(lnGi > γ)−0.4477 ***−0.3608 ***−0.4477 ***−0.2417
(−5.74)(−4.62)(−5.74)(−1.57)
lnGdp0.6177 ***0.6188 ***−0.3823 **0.5701 ***
(3.36)(3.43)(−2.08)(2.80)
lnPop0.49490.48180.49490.3073
(1.10)(1.09)(1.10)(0.71)
lnEs0.2121 ***0.2343 ***0.2121 ***0.2447 ***
(2.78)(4.22)(2.78)(3.16)
lnUrb0.24160.24660.24160.2193
(0.44)(0.45)(0.44)(0.31)
lnTra−0.0327−0.0232−0.03270.0549
(−0.44)(−0.32)(−0.44)(0.75)
Constant−3.5041−3.4632−3.5041−2.2195
(−1.46)(−1.43)(−1.46)(−0.94)
R-squared0.72270.68950.63640.6631
f-Value57.1633.4560.9942.95
N450450450450
Note: 1. Values in parentheses are t-values or z-values, and the same goes for the following tables. 2. Column (1) indicates the result of the benchmark model; column (2) indicates the result of changing the measurement of the threshold variable; column (3) indicates the result of changing the measurement of the dependent variable; column (4) indicates the result of changing the measurement method of the core independent variable. Note: ***, ** respectively, indicate significance at the 1%, 5% levels.
Table 6. Changes in the number of provinces reaching the green innovation threshold over the years.
YearNumber of Provinces Reaching the Green Innovation ThresholdRatio of Provinces Reaching the Green Innovation Threshold
2005516.67%
2006723.33%
2007723.33%
2008826.67%
20091446.67%
20101550.00%
20111860.00%
20121963.33%
20132170.00%
20142480.00%
20152583.33%
20162686.67%
20172686.67%
20182893.33%
20192790.00%
Table 7. Provinces with green innovation levels below the threshold.
YearProvinces with Green Innovation Levels below the ThresholdNumberRatio (%)
2005Tianjin, Hebei, Fujian, Shandong, Hainan, Liaoning, Jilin, Heilongjiang, Shanxi, Anhui, Jiangxi, Henan, Hubei, Hunan, Inner Mongolia, Guangxi, Chongqing, Sichuan, Guizhou, Yunnan, Shaanxi, Gansu, Qinghai, Ningxia, Xinjiang2583.3
2010Hebei, Hainan, Jilin, Heilongjiang, Shanxi, Jiangxi, Inner Mongolia, Guangxi, Chongqing, Guizhou, Yunnan, Gansu, Qinghai, Ningxia, Xinjiang1550.0
2015Hainan, Inner Mongolia, Qinghai, Ningxia, Xinjiang516.7
2019Hainan, Qinghai, Ningxia310.0
Table 8. Bootstrap test results for threshold effect after changing threshold variable measurement.
Dependent VariableCore Independent VariableThreshold
Variable
Threshold InspectionThreshold Valuef-Valuep-Value BS Times95% Confidence Interval
lnCelnIsclnGi′Single threshold ***5.981470.340.0033300[5.9478,
6.0014]
Double threshold6.115926.750.1100300[6.0078,
6.1463]
7.6834[7.4864,
7.6907]
Triple threshold6.115913.590.5400300[6.0078,
6.1463]
7.6834[7.4864,
7.6907]
5.3706[5.2221,
5.3845]
Note: *** indicate significance at the 1% levels.
Table 9. Bootstrap test results for threshold effect after changing the dependent variable measurement.
Dependent VariableCore Independent VariableThreshold VariablesThreshold InspectionThreshold Valuef-Valuep-Value BS Times95% Confidence Interval
lnCe′lnIsclnGiSingle threshold ***6.198583.910.0067300[6.1924,
6.2005]
Double threshold6.198515.790.3367300[6.1924,
6.2005]
5.1648[4.9704,
5.1761]
Triple threshold6.198523.340.4033300[6.1924,
6.2005]
5.1648[4.9704,
5.1761]
3.9890[3.9512,
4.0431]
Note: *** indicate significance at the 1% levels.
Table 10. Bootstrap test results for threshold effect after replacing the core independent variable measurement.
Dependent VariableCore Independent VariableThreshold VariablesThreshold InspectionThreshold Valuef-Valuep-Value BS Times95% Confidence Interval
lnCelnIsc′lnGiSingle threshold ***7.297846.260.0367300[7.2820,
7.3011]
Double threshold3.135535.310.1400300[2.1972,
3.2189]
7.2978[7.2750,
7.3011]
triple threshold3.135520.900.5700300[2.1972,
3.2189]
7.2978[7.2750,
7.3011]
4.2341[4.1400,
4.2767]
Note: *** indicate significance at the 1% levels.
Table 11. Regression results of the fixed effects model with added interaction terms.
VariablesFixed Effects Model Results
lnIsc1.0437 *
(1.98)
lnGi0.0807
(1.11)
lnIsc × lnGi−0.1690 **
(−2.35)
lnGdp−0.2812
(−0.37)
lnPop0.5852
(1.02)
lnEs0.0555
(0.59)
lnUrb0.2179
(0.35)
lnTra−0.0160
(−0.21)
Constant2.5114
(0.53)
R-squared0.7241
f-value51.48
N450
ProvinceFix
Year
Note: **, and *, respectively, indicate significance at the 5%, and 10% levels.
Table 12. Regression results of the dynamic panel threshold model.
VariablesDynamic Panel Threshold Model Results
L.lnCe0.3099 ***
(6.47)
lnIsc(lnGi ≤ γ)−0.4083 ***
(−4.18)
lnIsc(lnGi > γ)−0.5503 ***
(−5.50)
lnGdp0.5061 ***
(5.58)
lnPop3.6248 ***
(4.01)
lnEs−0.2613 ***
(−5.16)
lnUrb−0.1746
(−0.40)
lnTra−0.0485 **
(−2.26)
γ5.5368
(0.53)
N450
Note: ***, ** respectively, indicate significance at the 1%, 5% levels.
Disclaimer/Publisher’s Note: The statements, opinions and data contained in all publications are solely those of the individual author(s) and contributor(s) and not of MDPI and/or the editor(s). MDPI and/or the editor(s) disclaim responsibility for any injury to people or property resulting from any ideas, methods, instructions or products referred to in the content.

