Article

Multi-Objective Optimization of Synergic Perchlorate Pollution Reduction and Energy Conservation in China’s Perchlorate Manufacturing Industry

1
School of Energy and Environment, Southeast University, Nanjing 210096, China
2
State Key Laboratory of Environmental Criteria and Risk Assessment, Chinese Research Academy of Environmental Sciences, Beijing 100012, China
*
Authors to whom correspondence should be addressed.
Sustainability 2024, 16(16), 6924; https://doi.org/10.3390/su16166924
Submission received: 3 July 2024 / Revised: 9 August 2024 / Accepted: 11 August 2024 / Published: 13 August 2024

Abstract

:
Perchlorate is a highly mobile and persistent toxic contaminant, with the potassium perchlorate manufacturing industry being a significant anthropogenic source. This study addresses the Energy Conservation and Perchlorate Discharge Reduction (ECPDR) challenges in China’s potassium perchlorate manufacturing industry through a multi-objective optimization model under uncertainty. The objectives encompass energy conservation, perchlorate discharge reduction, and economic cost control, with uncertainty parameters simulated via Latin Hypercube Sampling (LHS). The optimization was performed using both the Non-Dominated Sorting Genetic Algorithm II (NSGA-II) and the Generalized Differential Evolution 3 (GDE3) algorithm, enabling a comparative analysis. Three types of decision-maker preferences were then evaluated using the Technique for Order of Preference by Similarity to Ideal Solution (TOPSIS) to generate optimal decision strategies. Results revealed: (1) The comprehensive perchlorate discharge intensity in China’s potassium perchlorate industry is approximately 23.86 kg/t KClO4. (2) Compared to NSGA-II, GDE3 offers a more robust and efficient approach to finding optimal solutions within a limited number of iterations. (3) Implementing the optimal solution under PERP can reduce perchlorate discharge intensity to 0.0032 kg/t. (4) Processes lacking primary electrolysis should be phased out, while those with MVR technology should be promoted. This study provides critical policy recommendations for controlling perchlorate pollution and guiding the industry toward cleaner and more sustainable production practices.

1. Introduction

Perchlorate, an inorganic pollutant, exhibits high diffusivity and persistence [1] with exceptionally stable physicochemical properties [2]. It easily migrates into the environment, entering the human body through exposure routes such as food and drinking water. It affects thyroid function [3], inhibiting iodine absorption [4] and posing a threat to human health [5]. Currently, perchlorates have been detected in surface water [6], groundwater [7], soil, food [8], and drinking water [9] in various locations. Perchlorate originates from natural [10] and anthropogenic sources [11]. The amount of naturally formed perchlorates is relatively low. Industrial processes contribute significantly to anthropogenic emissions, including perchlorate manufacturing and its applications in industries such as rocket propulsion [12], fireworks [13], military, and aerospace.
It is urgent to reduce perchlorate discharging from the source due to there being nearly no removal effects by commonly used water treatment. However, China is still in its early stages in systematic perchlorate pollution control [14]. Currently, apart from setting a perchlorate concentration limit of 0.07 μg/L in the current standards for drinking water in China [15], no further control requirements are specified. One important reason for this is lacking enough information on perchlorate pollution characteristics in industrial wastewater and pollution reduction measures, etc. The only information that could be found was that the United States required zero discharge of perchlorate from perchlorate manufacturing enterprises, and these enterprises mainly belonged to the military. It showed realistic meaning to supplement the lack of information and support proposing the perchlorate discharging control management. The manufacturing of potassium perchlorate is a major anthropogenic source of perchlorate pollution, accounting for approximately 78.8% of the total perchlorate manufacturing in China, according to internal data of industry associations. Therefore, this study selected the potassium perchlorate manufacturing industry as the typical industry.
Currently, potassium perchlorate is mainly produced through electrolysis followed by double decomposition method [16]. Industrial salt is used as the primary raw material and undergoes three key stages: Process 1. Sodium chlorate production by primary electrolysis; Process 2. Sodium perchlorate production by secondary electrolysis; and Process 3. Potassium perchlorate production by double decomposition reaction. For details, see Appendix A. The production system is illustrated in Figure 1. Potassium perchlorate manufacturing requires substantial electricity in its production processes [16], about 7820 kW·h/t KClO4. Intensive energy consumption indirectly leads to large amounts of CO2 emission and global climate change issues. Thus, the potassium perchlorate manufacturing industry should actuate minimal pollution, minimal energy consumption, and economic feasibility. The intricate interplay and trade-offs between environmental, energy, and economic objectives contribute to the complexity of industrial management, posing challenges to achieving multi-objective optimization [17].
Multi-Objective Evolutionary Algorithms (MOEAs) are the main methods for solving multi-objective optimization problems [18]. The Non-Dominated Sorting Genetic Algorithm II (NSGA-II) [19], proposed by Deb et al. in 2000, stands out as a widely applied representative MOEA [20]. NSGA-II incorporates concepts like elitist strategy, fast, non-dominated sorting, and crowding distance, effectively addressing issues such as low algorithm performance and high complexity. It has found extensive application in solving multi-objective optimization problems [17], demonstrating remarkable performance in practical scenarios. As multi-objective optimization yields a set of solutions known as Pareto-optimal solutions rather than a single solution, decision-makers need to choose among these alternative solutions based on their objective preferences. TOPSIS decision-making is a classical multicriteria decision method [21] first introduced by Hwang and Yoon in 1981 [22]. This method efficiently utilizes information from the original data, accurately reflecting the differences between evaluation schemes. It does not impose strict limitations on data distribution or sample size, and it is computationally straightforward [23].
In summary, the main contribution of this study is to realize a multi-objective optimization in Energy Conservation and Perchlorate Discharge Reduction (ECPDR) management in the potassium perchlorate manufacturing industry. Firstly, the paper analyzes the processing system and discharge characteristics of the industry. Subsequently, it proposes a multi-objective optimization model and employs the NSGA-II algorithm to optimize the model and obtain a set of Pareto frontier solutions. Finally, the TOPSIS method is employed to select the optimal solutions under different objective preferences from the Pareto frontier solutions, and corresponding policy recommendations are proposed based on the research results. This study provides theoretical support for optimizing pollution reduction and carbon reduction management in the potassium perchlorate manufacturing industry while also offering a general analysis framework for energy conservation and discharge reduction management decisions in other manufacturing industries.

2. Methodology

2.1. Analysis of Potassium Perchlorate Production System

Before constructing the multi-objective optimization model, it is essential to gain in-depth insights into the production processes of the potassium perchlorate manufacturing industry. The author conducted a comprehensive investigation of the major pollution nodes, pollution intensities, and reduction measures of pollution and carbon through a systematic literature review, on-site research, sampling and testing, and expert interviews. According to the enterprise survey, it was found that some companies directly purchased sodium chlorate from external sources as production raw materials and omitted Process 1, which was mentioned in the introduction part. To distinguish clearly, we named the process using industrial salt as the raw material as “Method A” and the process using sodium chlorate as the raw material as “Method B.” Each of these production methods accounts for approximately 50% of the total industrial perchlorate production.
Three categories of pollution reduction and carbon reduction measures applicable to potassium perchlorate production processes were proposed: (i) Advanced Technologies and Management Measures (Tm), (ii) By-Product and Waste Recycling Methods (Rm), and (iii) Terminal Treatment Technologies (Tt), all of which are elaborated upon in Table 1. Both Tm8 and Tm9 involve adding the primary electrolysis step, Tm8 requires simultaneous using MVR technology for treating the mother liquor from double decomposition. In the case of adopting Tm9, the sodium chlorate production is higher than the requirement for potassium perchlorate production in Process 3 according to water balance. Thus, parts of sodium chlorate produced should be sold. The penetration rates for each measure in the base year and the optimization year, energy savings, pollution reduction effects, and economic costs are provided in Table A1.

2.2. The Multi-Objective Optimization Model

Considering data availability, 2020 was chosen as the baseline year for implementation. According to the guideline from the NDRC [24], 2030 is selected as the optimization year, aligning with the goal of further refining the dual control system for energy consumption and achieving reasonable control of total energy consumption. This study has collected five types of information: industrial structure, energy consumption, production and discharging amount of perchlorate, economic cost, and the promotion situation parameter. These data have been verified by industry experts.

2.2.1. Objectives

This study assumes that the performances of equipment or technology will remain unchanged within the period of the base and optimization year. Therefore, the effects on the objectives come from the adjustment and promotion of these measures. The multi-objective optimization model constructed in this paper comprises three objective functions:
(1)
Energy intensity minimization
This objective value is calculated by deducting the energy conservation impacts of each measure from the energy intensity in the base year, as expressed in Equations (1)–(3):
min E I t + t = E I t E C T m + E C R m + E T t
E C T m = i T m E C i , T m × P i , T m , t + t P i , T m , t × P P i
E C R m = i b G b × R m E C i , b , R m × P i , R m , t + t P i , R m , t × P P i
E T t = i T t E i , T t × P i , T t , t + t P i , T t , t × P P i
where t is the base year; t + Δt is the optimization year, b represents by-product and waste; i is the process in potassium perchlorate manufacturing industry; E I t and E I t + t represent the energy intensity of the base year and the optimization year, respectively; E C T m is the energy conservation effects of the measure Tm; E C R m is the energy conservation amount of the measure Rm; E T t is the energy consumption required by the terminal technology Tt; P i , T m , P i , R m , and P i , T t , t + t represent the penetration rates of Tm, Rm, and Tt in process i, respectively; P P i represents the ratio of the mass of process i’s product to potassium perchlorate; and G b is the generation coefficient of by-product and waste b, indicating the weight of b generated per unit weight of the products.
(2)
Perchlorate discharge intensity minimization
Similarly, the discharge intensity of perchlorate is calculated as shown in Equations (5)–(8):
m i n P E I t + t = P E I t E R T m + E R R m × 1 μ
E R T m = i T m E R i , T m × P i , T m , t + t P i , T m , t × P P i
E R R m = i R m E R i , R m × P i , R m , t + t P i , R m , t × P P i
μ = T t μ T t × P T t , t + t P T t , t
where PET is the discharge intensity of perchlorate in the potassium perchlorate manufacturing industry; ER is the discharging reduction amount; E R i , T m and E R i , R m reflect the perchlorate discharge reduction effect from Tm and Rm in process I, respectively; μ is the perchlorate removal efficiency; and μ T t reflects the perchlorate removal efficiency of Tt.
(3)
Economic cost minimization
Economic Cost includes the investment and operational costs of technology and equipment, the raw material and energy costs, and considerations of economic benefits resulting from discharging reduction measures (energy savings and raw material savings). This study assumes that the cost of equipment and technical removal and clearance is 0. The calculation method is shown in Equations (9)–(12):
m i n C = C f + C o B
C f = i T m I i , T m × P i , T m , t + t P i , T m , t × r 1 1 + r L T m + i R m I i , R m × P i , R m , t + t P i , R m , t × r 1 1 + r L R m + i T t I i , T t × P i , T t , t + t P i , T t , t × r 1 1 + r L T t
C o = i T m O i , T m × P i , T m , t + t P i , T m , t + i R m O i , R m × P i , R m , t + t P i , R m , t + i T t O i , T t × P i , T t , t + t P i , T t , t
B = E C T m + E C b × E U P + b G b × B C b × R m R b , R m × P i , R m , t + t P i , R m , t
where C f is the fixed investment; C O is the operational costs, and B stands for the economic benefits resulting from energy savings and recovery of by-products and waste; r is the discount rate; L is technical lifetime; EUP is the energy unit price; R b , R m is the recovery rate of reutilization approach Rm for b; B C b is the equivalent price of b; and I and O represent the fixed investment and operational costs of implementing measures, respectively.

2.2.2. Constraints

In this study, three types of constraints are set to ensure the practical feasibility of the solution results.
(1)
Logical constraints of decision variables
The decision variables in the model are the penetration rates of different measures. The logical range of the decision variable is between 0% and 100%, as shown in Equations (13)–(15):
0 P i , T m 100 %
0 P i , R m 100 %
0 P i , T t 100 %
(2)
Constraints of technology promotion
Tm1 reduces device footprint by increasing current density but results in higher energy consumption. Thus, it should be phased out gradually based on practical evidence. Therefore, the penetration rate of Tm1 in the optimization year should be lower than the baseline year level. The penetration rates of other measures should be maintained at or above the baseline year level, as shown in Equations (16)–(19):
P i , T m , t P i , T m , t + t ,   T m = 1
P i , T m , t P i , T m , t + t ,   T m = 2 ,   3 ,   ,   7
P i , R m , t P i , R m , t + t
P i , T t , t P i , T t , t + t
(3)
Mass balance of the by-products and waste constraint
In theory, the utilization of by-products and waste should not surpass their generation amount, meaning that the recycling rate should not exceed 100%, as illustrated in Equation (20):
R m R b , R m 100 %

2.3. Optimization Method

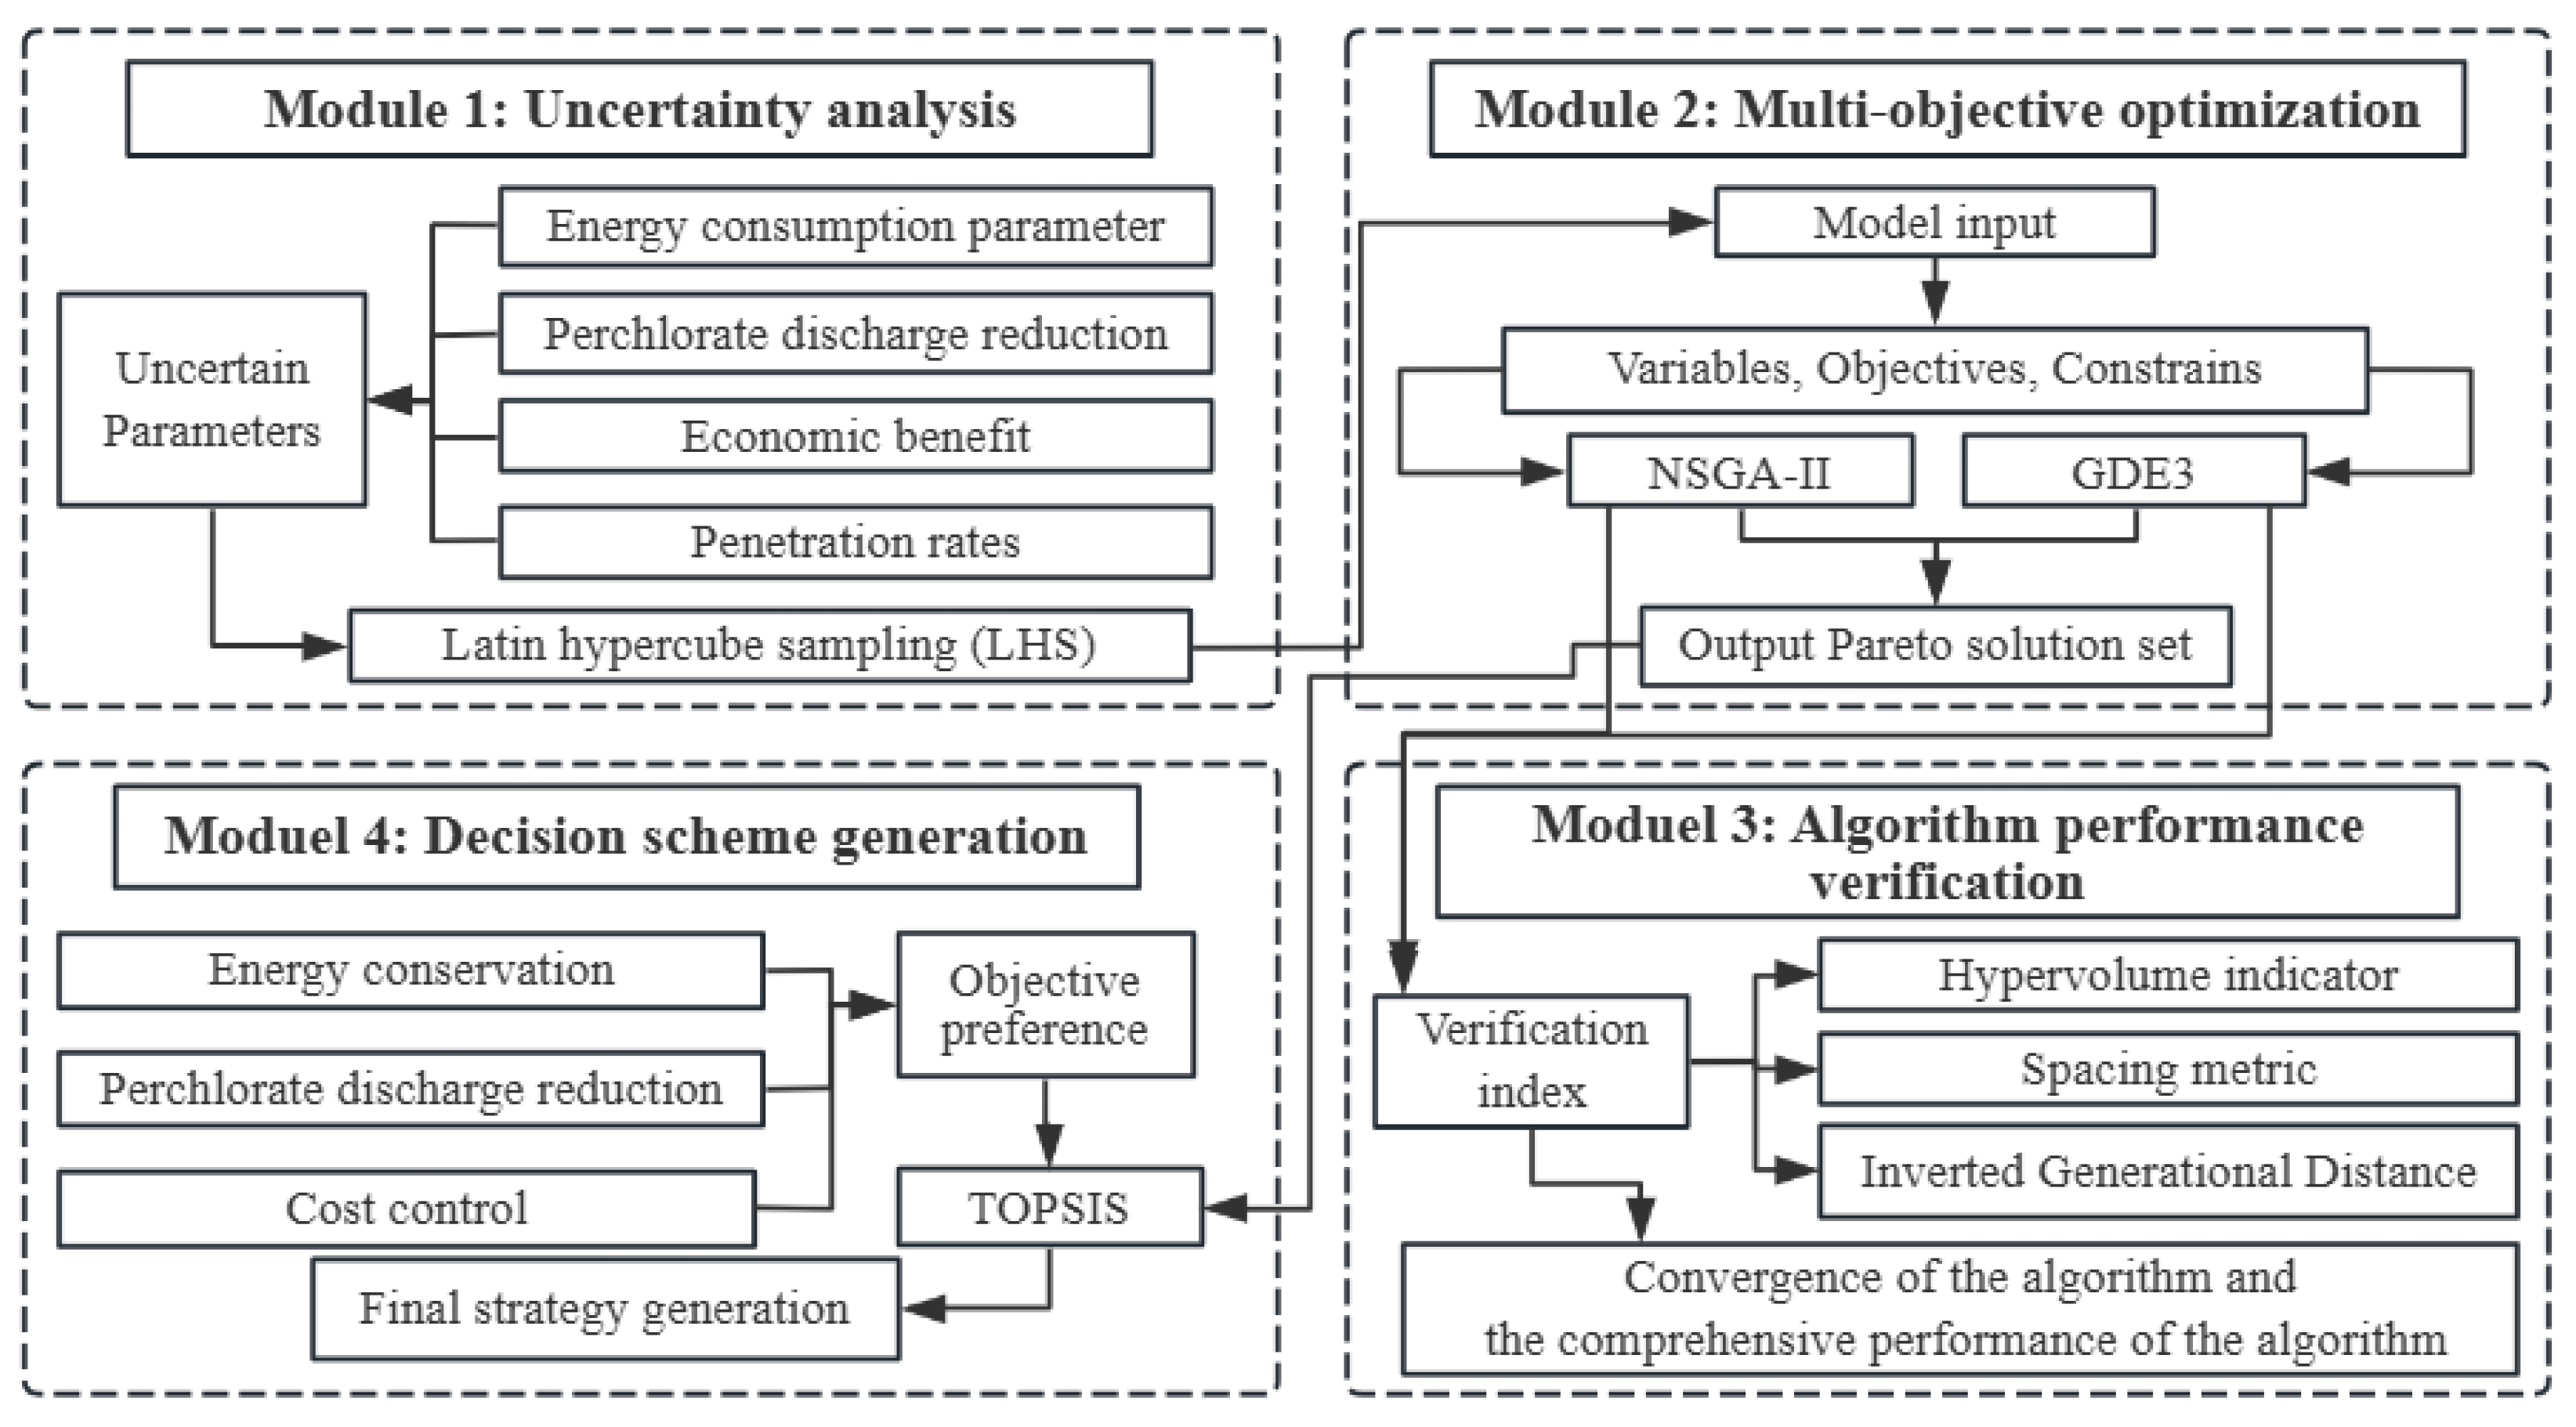
The methodology of the optimization model can be divided into four main parts: (1) Random sampling to simulate fluctuations of uncertain parameters within their specified ranges; (2) Optimization, which uses the NSGA-II and GDE3 Algorithms to optimize the constructed model and introduces a mean effective objective function value mechanism in NSGA-II to calculate the objective values of the samples; (3) Algorithm performance verification, which assesses the reliability and quality of the algorithm and the solution sets; and (4) Decision strategy generation, which uses the TOPSIS approach to generate final decision strategies under different objective preferences from the optimal solutions. The methodological framework is depicted in Figure 2.
This study considers four categories of uncertainty factors, as shown in Table A2, involving a total of 121 parameters. Monte Carlo Sampling (MCS) and Latin Hypercube Sampling (LHS) are two widely adopted uncertainty sampling methods in current research [25]. In comparison to MCS, LHS significantly enhances the uniformity and coverage of sampling, reducing computational workload by 50% and achieving higher efficiency [26]. Therefore, this study employs LHS to simulate uncertainties, assuming that uncertain parameters fluctuate uniformly within the sampling boundaries, conducting a 1000-time sampling.
This study adopts two commonly used multi-objective optimization algorithms, NSGA-II and GDE3, to search for optimal solutions [17,27]. NSGA-II primarily comprises five steps: solution set initialization, objective function computation, non-dominated sorting, competitive solutions, and genetic operators. These five steps are iterated a certain number of times to seek the optimal solution. In optimization problems under uncertainty, an individual solution will yield a set of objective values. Therefore, this study employs the mean effective objective function value mechanism to calculate the objective value.
GDE3, another widely recognized multi-objective optimization algorithm, extends the Differential Evolution (DE) algorithm. It introduces a more flexible handling of constraints and incorporates a non-dominated sorting mechanism similar to NSGA-II, allowing it to effectively explore and exploit the solution space.
As the existing literature [17,28] provides detailed descriptions of both NSGA-II and GDE3 implementations, readers can refer to these works for further details. This study sets the maximum iteration count at 150 for both algorithms.
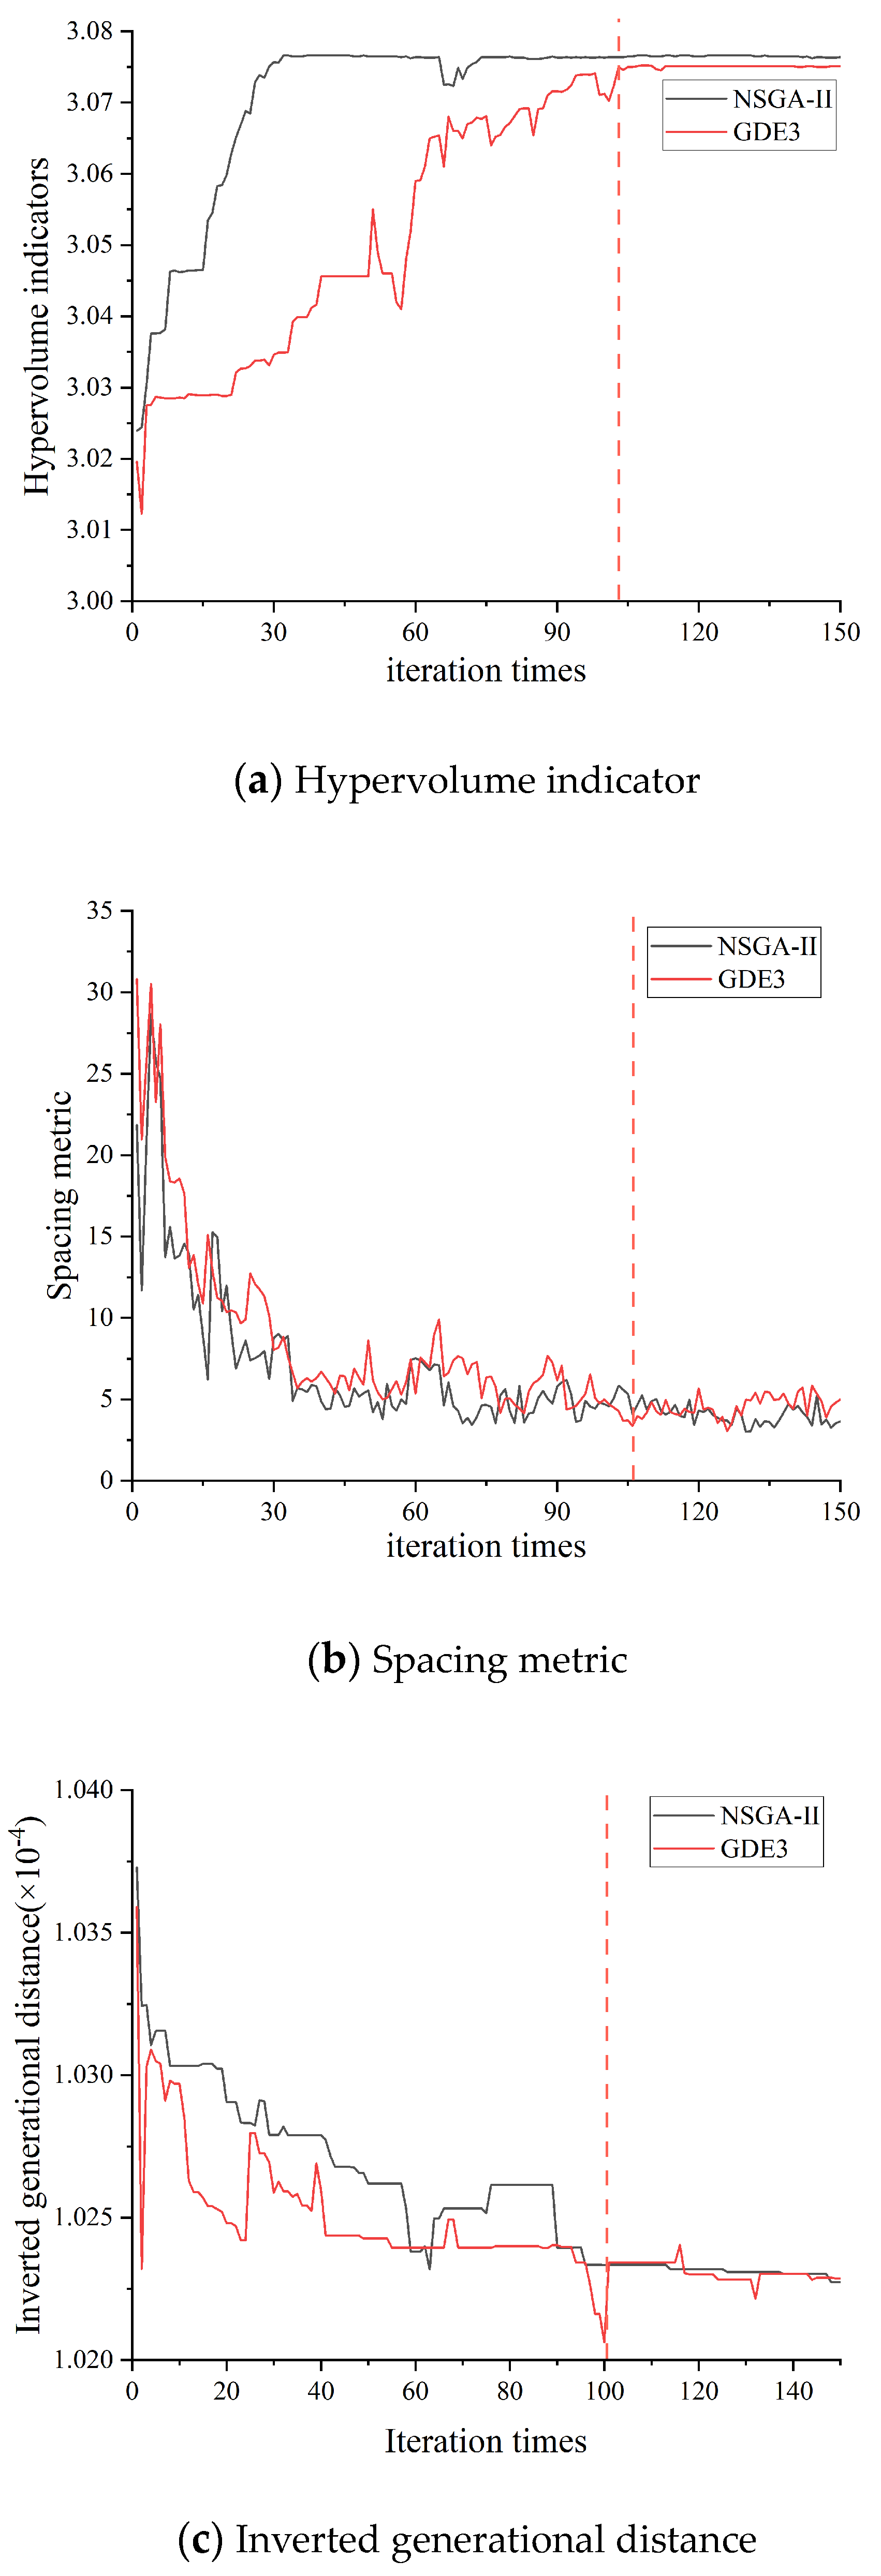
This study utilizes the Spacing metric, Hypervolume indicator, and inverted generational distance (IGD) to verify the algorithm’s performance, ensuring the effectiveness of the optimal solutions. The Spacing metric indicator is the standard deviation of the distance between the neighboring solution points [29], which reflects the uniformity of the solutions. A smaller Spacing value indicates a more uniformly distributed solution set [30].
The Hypervolume indicator, one of the most widely used algorithm performance evaluation metrics [31,32], calculates the volume of a hyperspace enclosed by a reference point and the non-dominated solution points [33]. It reflects the overall performance of the algorithm, with higher values indicating better algorithm performance [34].
Additionally, the inverted generational distance (IGD) is employed to measure both the convergence and diversity of the solutions [35]. IGD calculates the average distance from a set of true Pareto-optimal solutions to the obtained solutions. A lower IGD value indicates that the solution set is closer to the true Pareto front, reflecting better convergence and diversity. By incorporating IGD, this study further enhances the robustness of the performance evaluation.
This study set the scale of the solution as 100, which means 100 Pareto solutions will be generated after optimization. However, decision-makers may have diverse objective preferences, facing the challenge of generating a specific decision strategy from these optimal solutions. This study employs the TOPSIS method [21] to solve this problem, conducting similarity ranking for the 100 ideal solutions generated through multi-objective optimization. The fundamental principle is to minimize the Euclidean distance between the chosen solution and the ideal point while maximizing the Euclidean distance between the chosen solution and the anti-ideal point [23,36]. Given the three objectives of ECPDR management in the potassium perchlorate manufacturing industry, three types of objective preferences are defined: (1) energy conservation preference (ECP), (2) perchlorate reduction preference (PERP), and (3) cost control preference (CCP). In each preference, the weight of the preferred objective is set to 0.6, while the weights of the other objectives are set to 0.2 [17,30].

3. Results

3.1. Analysis of Perchlorate Production and Discharging Characteristics

Pollutants generated during the production process include electrolytic exhaust gases, dust from the drying workshop, sludge, and industrial wastewater. Table 2 presents the key discharging nodes with intensities in the potassium perchlorate production process:
1.
The mother liquor from double decomposition
During the double decomposition reaction stage, the sodium perchlorate solution generated from secondary electrolysis is combined with the potassium chloride solution in the double decomposition reactor. The wet potassium perchlorate coarse crystals are separated from the reaction mixture through centrifugal, cooling, and crystalline. The residual reaction mixture is called the mother liquor from double decomposition, which contains approximately 15 g/L of perchlorate. The discharging intensity is equivalent to about 36.15 kg/t KClO4 of perchlorate.
2.
The dust from the drying shop
The wet potassium perchlorate coarse crystals obtained require airflow drying and grinding to achieve a qualified product with moisture content less than or equal to 0.02%. The final drying process is fully enclosed, but there will be a minor escape of product dust during the grinding and packaging processes, resulting in an approximate yield of 1.9 kg/t KClO4 of perchlorate.
3.
The salt sludge from pressure filters
In the salt refining process, insoluble substances such as CaCO3, Mg(OH)2, and BaSO4 are formed by the precipitation of impurity ions in industrial salt raw materials like calcium, magnesium, and barium. These insoluble substances need to be separated through the plate and frame filter. It results in the formation of salt sludge. Since the mother liquor from double decomposition containing potassium perchlorate is recycled for the salt-dissolving process, the salt sludge generated contains a portion of perchlorates, with a perchlorate discharging intensity of around 13.09 kg/t KClO4.
4.
The potassium perchlorate powder scattered to the floor of the packaging workshop
During the packaging process, a small amount of potassium perchlorate may be scattered on the workshop floor. This portion of perchlorate is approximately 0.051 kg/t KClO4.
5.
The potassium perchlorate residual on the factory road surface.
The contamination of the factory road surface primarily originates from the dispersion of potassium perchlorate caused by product transportation and workshop floor cleaning. According to the probability of being contaminated, the factory ground is divided into three zones: the vicinity of the packaging workshop and storage warehouse, transportation surfaces, and other areas. Through sampling and analysis, the potassium perchlorate concentrations on the ground in these three zones are determined as 469.78 mg/m2, 212.56 mg/m2, and 2.45 mg/m2, respectively. Finally, combining the total road area and product amount, the potassium perchlorate residual amount on the factory ground is estimated as about 0.001 kg/t KClO4.
6.
The potassium perchlorate carried on workers’ hands and clothing.
The perchlorate amount carried on workers’ hands and clothing was estimated as 0.0056 kg/t through measurement methods at the actual perchlorate manufacturing plant.
Due to the absence of the primary electrolysis process in Method A, the recycling of the mother liquor from double decomposition is not feasible, and there is no pressure-filtered salt sludge. Therefore, the main discharging nodes are ①, ②, ④, ⑤, and ⑥ for Method A. For the production enterprises with a single electrolytic process (Method B), part of the double decomposition mother liquor (about 82.16%) is used back in the salt process, and the rest is discharged, so 6.45 kg/t of perchlorate enters the environment with this part. Thus, the primary discharging nodes are ① to ⑥. The perchlorate discharge intensity for Method A and B was about 9.61 kg/t KClO4 and 38.11 kg/t KClO4, respectively. Since each method contributes roughly 50% to the total amount of potassium perchlorate produced in China currently, the integrated perchlorate discharge intensity for the potassium perchlorate manufacturing industry is around 23.86 kg/t KClO4.

3.2. The Model Optimization Results

3.2.1. The Algorithm Performance Verification Results

The trend of the Hypervolume indicators, Spacing metric and inverted generational distance, along with the iteration, are shown in Figure 3. The Spacing metric and inverted generational distance gradually decreased while the Hypervolume indicator increased steadily. This signifies a more even distribution of Pareto front solutions throughout the optimization process, emphasizing the algorithm’s robust performance in addressing the multi-objective optimization model used in this study. All three indicators remained steady before the number of iteration times reached 150, showing that the solutions converged before termination and the optimal solutions were reliable.

3.2.2. The Optimal Solutions

To quantify whether uncertainty factors are considered in the optimal results, this study compares the trend of optimal objective values of the solutions under certainty (the contrast) and uncertainty in each iteration generation. Furthermore, due to the differences in applicable technologies and input parameters, this study undertook optimizations for two scenarios (Method A and Method B), with the results presented in Figure 4. For Method A, uncertainty factors exhibited negative effects during the optimization for both perchlorate discharge reduction and cost control objectives. However, during the optimization of the energy conservation objective, the effect of uncertainties is positive. For Method B, the influence of uncertainties shifts from negative to positive during the optimization of the energy-saving objective. However, whether uncertainties are considered or not, the minimum energy intensity remains almost unaffected. In addition, uncertainties have a negative impact on the optimization process for the perchlorate discharge reduction objective but do not significantly affect the economic cost.
In the optimization process, both NSGA-II and GDE3 algorithms are employed to optimize the model. The comparison between these two algorithms shows that GDE3 has a faster convergence rate than NSGA-II, as evidenced by the quicker attainment of a stable solution in fewer generations. This accelerated convergence of GDE3 can be attributed to its enhanced ability to maintain diversity within the population while simultaneously pushing toward the Pareto front. Despite the difference in convergence speed, the final optimized solutions obtained by both NSGA-II and GDE3 are almost identical in terms of the objective function values. This demonstrates that both algorithms are highly effective in identifying the optimal trade-offs between conflicting objectives in the model, highlighting the robustness of both methods in solving this multi-objective optimization problem. However, the use of GDE3 may provide an advantage in scenarios where computational efficiency is critical, as it reaches the optimal solution in a shorter time without compromising the quality of the results.
Since the optimal results of the two algorithms show no significant differences after 150 iterations, we select the optimization results from GDE3 to discuss the effects on the three objective values under both deterministic and uncertain conditions. The objective values of the final optimal results are shown in Table 3. For Method A, the energy intensity in the base year was 7820 kW·h/t. Under uncertain conditions, the energy-saving effect was 199.89 kW·h/t, 1.1% higher than under deterministic conditions (197.65 kW·h/t). For the perchlorate discharge reduction objective, the optimal solutions under both deterministic and uncertain conditions achieved nearly a 100% reduction in perchlorate discharge. Additionally, the expected economic benefit from the optimal solutions under uncertainty is 0.2% lower than that under deterministic conditions.
For Method B, considering the energy intensity in the base year (3790 kW·h/t) as the reference, the optimal solutions under uncertainty can achieve energy conservation of 96.48 kW·h/t, which is 0.8% lower than that under deterministic conditions (97.23 kW·h/t). Similarly, the optimal solutions under both deterministic and uncertain conditions achieve nearly a 100% reduction in perchlorate discharge. As for the economic cost objective, the economic benefits under uncertainty are 3.2% higher than under deterministic conditions.
These findings suggest the necessity of incorporating uncertainty factors when establishing suitable industrial ECPDR management goals, as targets optimized under deterministic conditions may not be realistic.

3.3. Decision Strategy

According to the above analysis, we choose to use the optimization results of the GDE3 algorithm in the uncertain scenario to make the next decision. This study adopts the TOPSIS ranking technique to select the optimal solutions that match each objective preference and generate the final decision strategies. The objective values for the final decision strategies under each objective preference are presented in Table 4. Typically, each preference has the best performance in the corresponding objective.
The optimal solution for the ECP corresponds to the production scenario without primary electrolysis (Method B). Implementing this solution can achieve a reduction in perchlorate discharge intensity to 0.0097 kg/t (a 99.97% decrease) at an energy intensity of 3910.10 kW·h/t, resulting in an economic benefit of 310.95 CNY/t. For PERP and CCP, the optimal solution corresponds to the production scenario with primary electrolysis (Method A). Implementing the optimal solutions for both objective preferences results in a reduction of perchlorate intensity by approximately 99.97%. However, the CCP solution offers greater economic benefits compared to the PERP solution, while the PERP solution achieves better reduction effects at a lower energy intensity. These strategies provide optional schemes for decision-makers to make differentiated ECPDR management policies in the potassium perchlorate manufacturing industry.
The optimization results indicate that for production enterprises without a primary electrolysis process, technical upgrades should be implemented to add a primary electrolysis process from the perspectives of perchlorate reduction and economic benefits. The technology list includes two methods for adding a primary electrolysis process to Method A (i.e., Tm8 and Tm9). However, Tm9 would result in a portion of perchlorate (0.835 kg/t) being sold with surplus sodium chlorate to the market, and it has higher energy intensity and economic costs compared to Tm8. Therefore, during the optimization process, the primary electrolysis process with MVR technology (Tm8) is prioritized as the key technology for adding a primary electrolysis process.
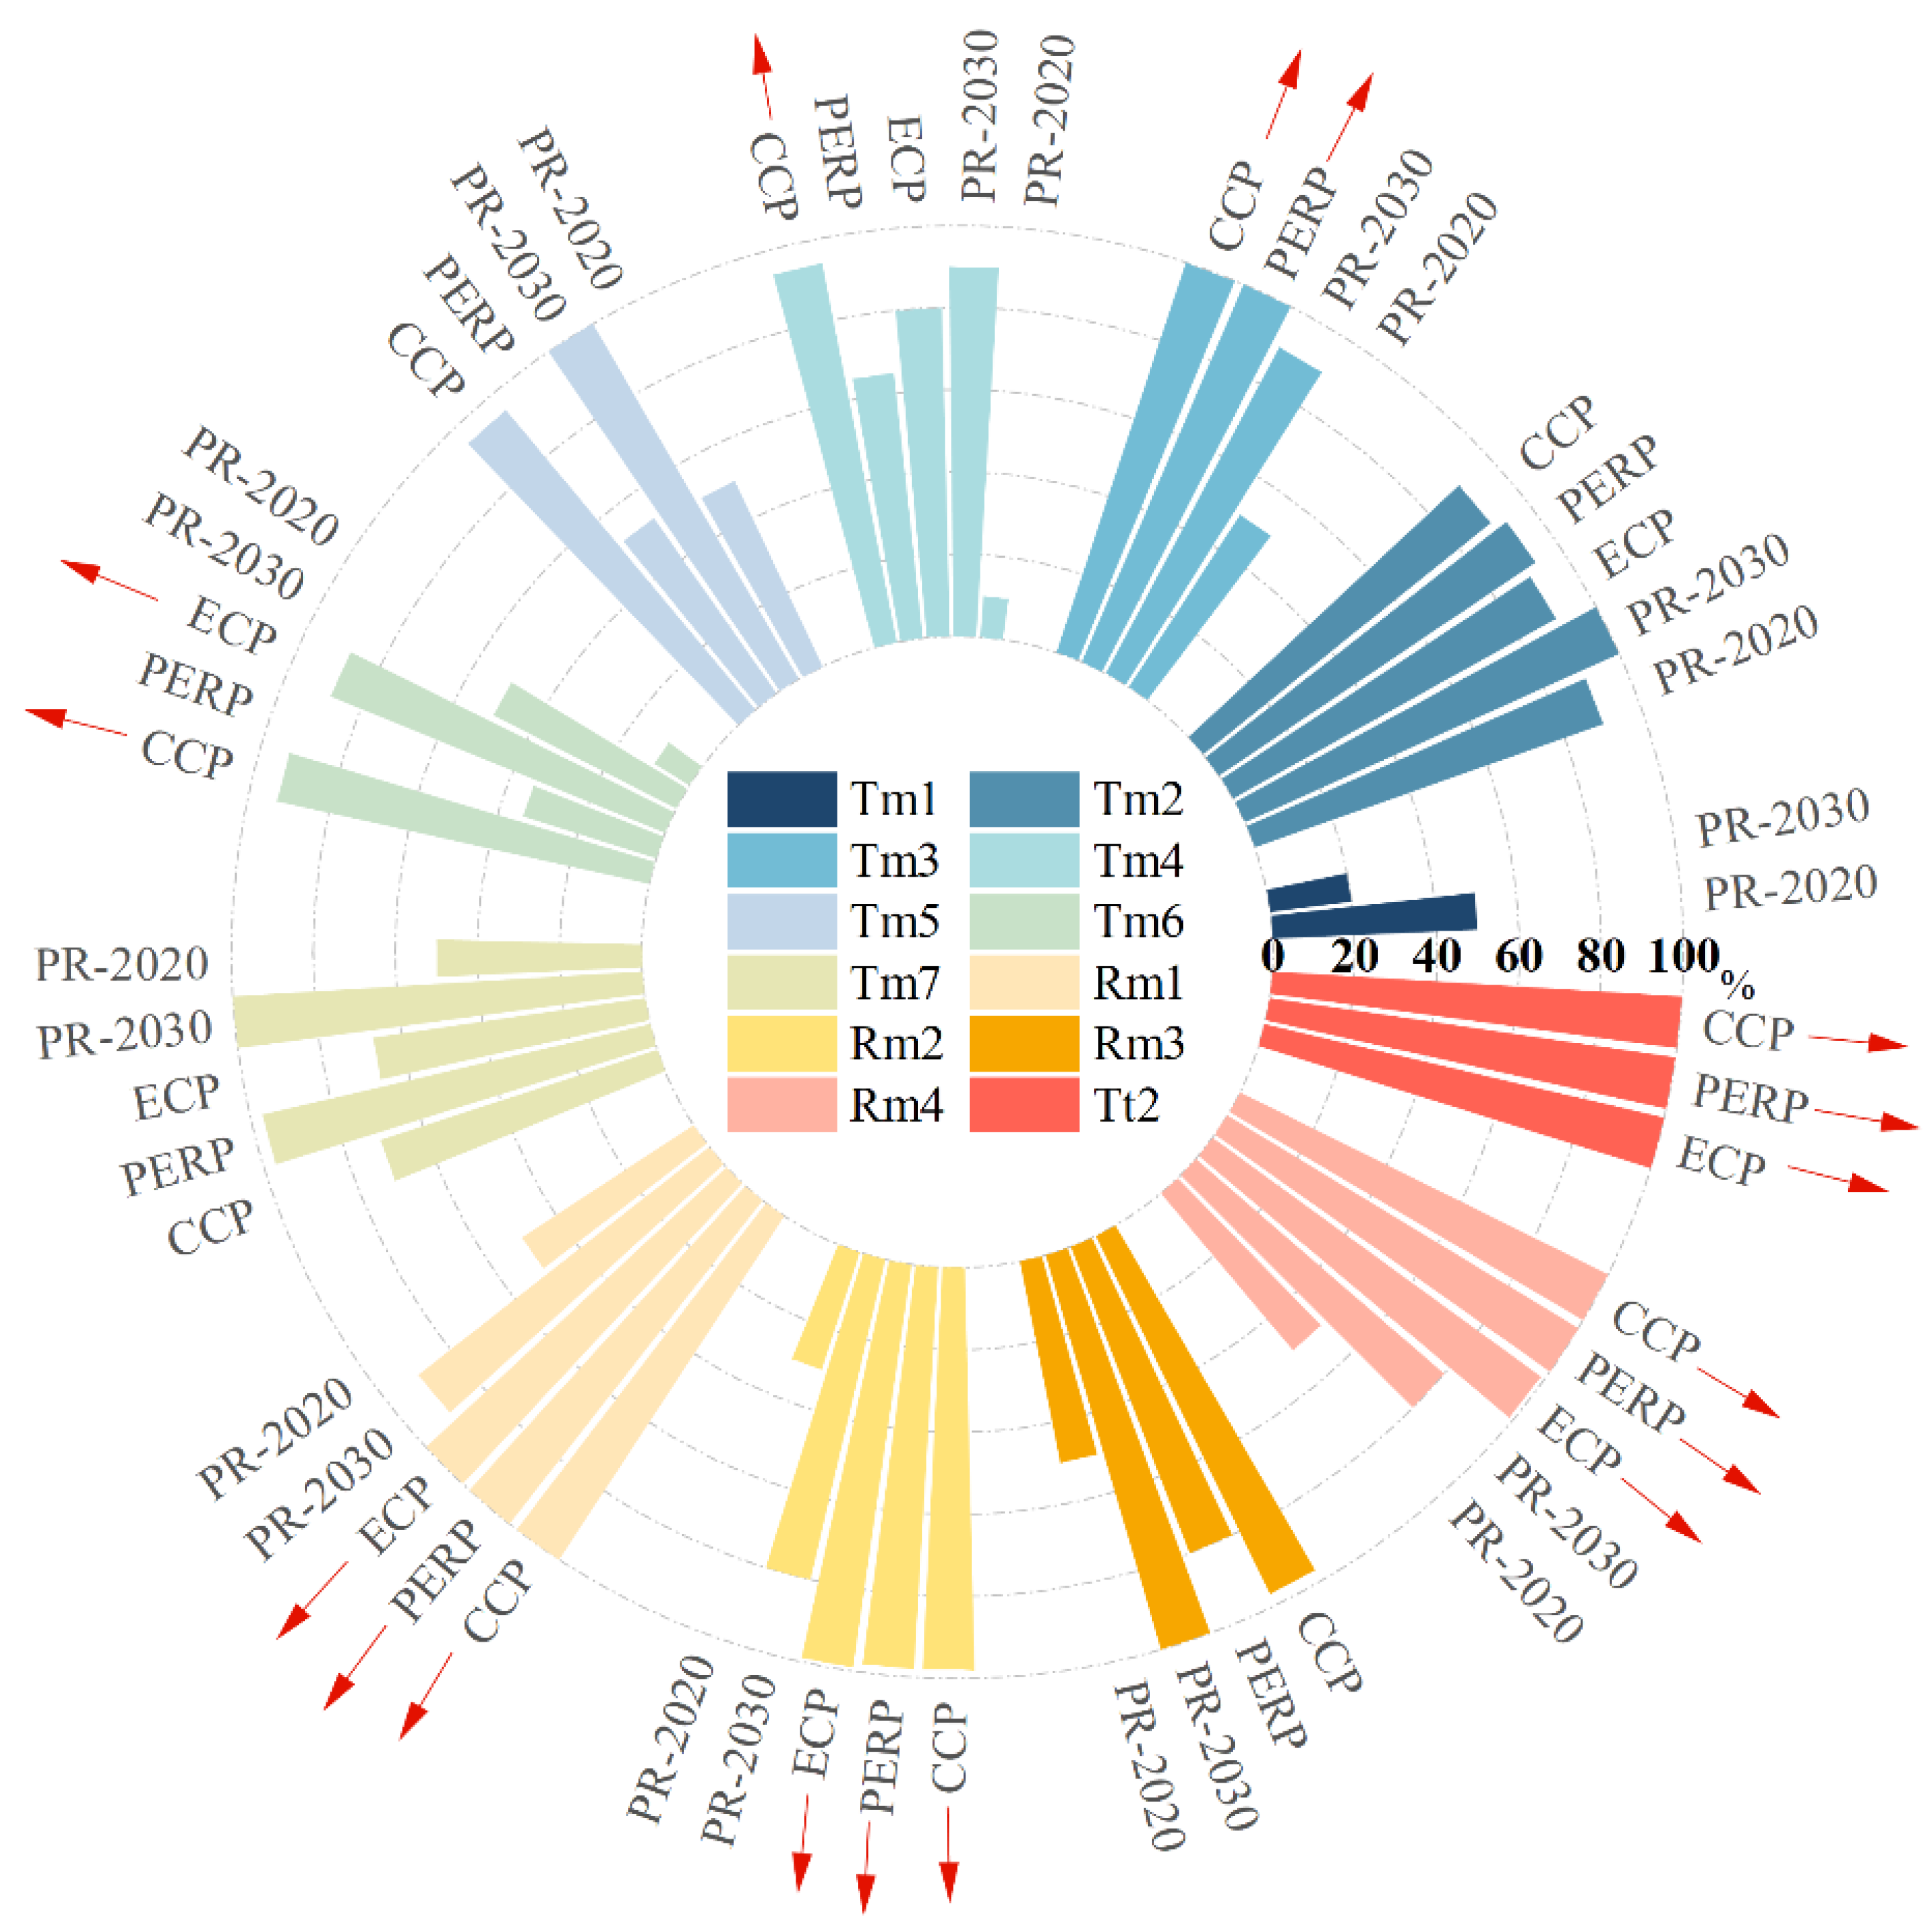
Figure 5 visually presents the penetration rates of Tm, Rm, and Tt under various scenarios, with detailed data in Table A3. PR-2020 represents the penetration rate of each measure adopted in 2020. PR-2030 represents the penetration rate of each measure predicted by experts for 2030. ECP, PERP, and CCP reflect the penetration rates of measures in the optimization year under objective preference obtained through model optimization. The penetration rate of Tm1 is 0 under all three objective preferences, far below expert predictions. Tm1 implementation enhances current density and reduces equipment footprint; it leads to a substantial increase in energy consumption and minimal reduction of perchlorate discharging. Hence, the accelerated phase-out of Tm1 is recommended.
The outward red arrows indicate that under this objective preference, the optimized penetration rates of certain measures exceed the expert-predicted penetration rates in the optimization year or reach 100%. Hence, they should be promoted as key measures in the next stage, as shown in Table 5. The hydrogen purification and recovery system (Rm1), MVR technology (Rm2), bag filter recovery in the potassium perchlorate drying workshop (Rm4), and efficient biodegradation technology (Tt2) are identified as key promotion measures for the next phase under all three objective preferences.
Additionally, huge investment is needed in equipment for some energy saving and pollution reduction measures, such as primary electrolysis and MVR technology. The equipment investment cost of adding a primary electrolytic process is about 15 million yuan, and the corresponding annual output of potassium perchlorate is 10,000 t. A set of MVR equipment with a designed processing capacity of 5 t/h costs about 6 million yuan. The substantial upfront capital investment for upgrading technology will bring great pressure on the economic situation of the enterprise. Hence, the implementation of advanced measures should be gradually progressed based on the specific cash flow situation of the enterprise.

4. Discussion

Currently, China lacks a comprehensive and robust environmental risk management system for toxic pollutants, failing to promptly address the health risks associated with perchlorates. Industries involved in perchlorate discharges primarily include manufacturers of perchlorates, fireworks, firecrackers, explosives, and pyrotechnic products. However, only a few discharge sources are subject to pollution control measures based on industry water discharge standards specific to perchlorates. For instance, the benchmark discharge volume control requirement for the explosive materials manufacturing industry is set at 9 m3/d, while those for initiating explosive devices and ammunition loading industries are set at 60 m3/d each. Other relevant water pollutant discharge standards, such as the “Integrated wastewater discharge standard” (GB8978-1996 [37]) and “Emission standards of pollutants for the inorganic chemical industry” (GB 31573−2015 [38]), do not provide explicit emission control requirements for perchlorates.
Comprehensive perchlorate discharge intensity for the potassium perchlorate manufacturing industry is estimated to be around 23.86 kg/t of product in China. The annual output of potassium perchlorate in China is about 157,600 tons, and due to the lack of corresponding control measures, about 3760.34 tons of perchlorate are discharged into the environmental system every year. Therefore, it is necessary to formulate and implement strict control policies.
These measures significantly promote the control of potassium perchlorate pollution. In comparison with the target optimization results achievable under the optimal solutions for ECP and CCP, it is evident that PERP achieves a substantial decrease in perchlorate discharge intensity at the cost of reducing energy savings and economic benefits. This validates the complex conflicts and synergies among objectives, emphasizing the need for a comprehensive approach by governments in formulating management policies to balance the mutual influences of various objectives for sustainable development.
The current pollution control measures for the potassium perchlorate manufacturing industry are notably weak, lacking systematic studies and traceability analyses. This study quantitatively analyzes the pollution situation in the potassium perchlorate manufacturing industry to address this gap and proposes the following policy recommendations based on the results of multi-objective optimization: (1) Promote key technologies such as negative pressure dust collection and MVR, gradually phasing out production processes without a primary electrolysis step, and encourage the adoption of combined production processes incorporating MVR technology. Strictly enforce a zero-production wastewater discharge policy. (2) Incentivize technological upgrades, provide financial and tax support to alleviate cost pressures, and enhance willingness for technological improvement. (3) Formulate environmental standards and control policies tailored to the characteristics of domestic industries and strengthen regulatory oversight. (4) Increase research investment to stimulate the development and application of energy-saving and discharge-reduction technologies, elevating the overall technological and environmental standards of the industry.
By implementing the aforementioned policy recommendations, not only can potassium perchlorate manufacturing effectively reduce perchlorate pollution and promote green production, but it can also provide strong support for the sustainable development of this sector. Additionally, valuable experiences and models for environmental protection and energy conservation can be offered to other industries.
This study has potential limitations. Due to data availability, much of the industrial-related data in the model was obtained through field investigations by the authors and validation with experts in the relevant fields. However, the actual operational data from different factories exhibit varying degrees of fluctuation, which may affect the final optimization results of the model. Nevertheless, the study employed the Latin Hypercube Sampling method to randomly sample uncertain parameters, which mitigates the impact to some extent.

5. Conclusions

This study is conducted to provide scientific and technological support for the control of perchlorate pollution in China, taking the potassium perchlorate manufacturing industry as the typical industry. After comprehensively analyzing the perchlorate discharge characteristics, a comprehensive control strategy was proposed based on a multi-objective optimization method. This study focused on the synergistic optimization of energy saving, perchlorate reduction, and economic costs in the ECPDR management of this industry. It constructed an optimization model with three objectives and three types of constraints. This study utilized both the NSGA-II and GDE3 optimization algorithms to solve the model, comparing their performance after 150 iterations. The result was a Pareto solution set consisting of 100 alternative scenarios. Finally, the TOPSIS method was applied for multicriteria decision-making to identify the optimal solutions under varying objective preferences. The main conclusions of this study are as follows:
(1)
The major perchlorate discharging nodes include the mother liquor from double decomposition, product drying dust, and refined pressed filter sludge. The comprehensive perchlorate discharge intensity for the potassium perchlorate manufacturing industry is estimated to be around 23.86 kg/t of product in China. This means 3760.34 t perchlorate per year is discharged into the environment, considering the current pollution discharging control policy lacks control over perchlorate.
(2)
For the optimization of the multi-objective model constructed in this study, while both the NSGA-II and GDE3 algorithms are effective in identifying the optimal trade-offs between conflicting objectives, GDE3 demonstrates superior overall performance in terms of convergence speed. It can find optimal solutions within a limited number of iterations, providing a more robust and efficient approach.
(3)
The optimization results have unveiled significant achievements that could be produced through ECPDR management of this industry. Implementing the optimal solution under ECP can achieve a 99.97% reduction in perchlorate discharge intensity (0.0097 kg/t) at an energy intensity of 3910.10 kWh/t. Under PERP, the optimal solution can reduce perchlorate discharge intensity to 0.0032 kg/t. Additionally, the optimal solution under CCP can yield an economic benefit of 432.53 CNY/t.
(4)
In the next decade of development for the potassium perchlorate manufacturing industry, hydrogen purification and recovery technology, MVR technology, bag filter dust collection technology for the drying workshop, and efficient biodegradation technology should be vigorously promoted as key technologies.
(5)
Considering both perchlorate discharge reduction and economic cost control, production processes without primary electrolysis should be gradually phased out. Instead, primary electrolysis processes equipped with MVR technology should be added.
In summary, this study provides support for formulating ECPDR management policies in potassium perchlorate manufacturing. However, some drawbacks still exist, such as the co-benefits of ECPDR measures’ application such as human health improvement (from reduced perchlorate discharging) are not considered. Filling these gaps will be the future research direction in this field.

Author Contributions

Conceptualization, Y.L.; methodology, Y.L.; software, Y.L.; validation, H.W. and G.Z.; formal analysis, Y.L.; investigation, Y.L.; resources, H.W.; data curation, Y.L. and H.W.; writing—original draft preparation, Y.L.; writing—review and editing, H.W. and G.Z.; visualization, Y.L.; supervision, H.W. and G.Z.; project administration, H.W. All authors have read and agreed to the published version of the manuscript.

Funding

This research was funded by the National Key R&D Program of China, grant number 2023YFC3205600.

Institutional Review Board Statement

Not applicable.

Data Availability Statement

Data are contained within the article.

Conflicts of Interest

The authors declare that they have no known competing financial interests or personal relationships that could have appeared to influence the work reported in this paper.

Appendix A

  • Process 1. Preparation of sodium chlorate by primary electrolysis
Using industrial salt as the primary raw material, dissolve it into the saturated solution, followed by the addition of soda ash, caustic soda, and calcium chloride to remove calcium, magnesium, and sulfate ions. After clarification and filtration, refined brine is obtained. Prior to being sent to the electrolytic cell, hydrochloric acid is introduced for pH adjustment. The electrolytic process employs external circulation electrolysis technology. The main reaction formula is shown in Equation (A1):
N a C l + 3 H 2 O e l e c t r o l y s i s N a C l O 3 + 3 H 2
The sodium chlorate solution obtained by electrolysis was de-hypochlorite, crystallized, separated and dried to obtain crystal sodium chlorate. (Method B eliminates this step and purchases sodium chlorate as raw material from outside).
  • Process 2. Preparation of sodium perchlorate by secondary electrolysis
Sodium chlorate is dissolved in water before being fed into the electrolytic cell, where direct current is applied. Electrolyzing the sodium chlorate solution leads to the formation of sodium perchlorate solution and hydrogen gas. The primary reaction is represented by Equation (A2):
N a C l O 3 + H 2 O e l e c t r o l y s i s N a C l O 4 + H 2
  • Process 3. Preparation of potassium perchlorate by double decomposition reaction
The sodium perchlorate solution produced is directed into the storage tank of the double decomposition section. Upon heating and dissolution, potassium chloride is injected into the elevated tank. Within the double decomposition reaction tank, these two substances undergo a double decomposition reaction, with agitation and cooling crystallization ensuring a complete reaction. Due to the lower solubility of potassium perchlorate compared to sodium perchlorate and potassium chloride, a mixed solution containing potassium perchlorate crystals can be formed. After cooling centrifugation, crude potassium perchlorate crystals are obtained and then subjected to airflow drying and crushing to obtain the final potassium perchlorate product. This process is described by Equation (A3).
N a C l O 4 + K C l K C l O 4 + N a C l

Appendix B

Table A1. The parameters of process equipment.
NO.Energy Conservation (kWh/t)Perchlorate Reduction
(kg ClO4-/t)
Fixed Investment (CNY/t)Operational Cost (CNY/t)Benefits
(CNY/t)
Penetration Rate-2020
(%)
Penetration Rate-2030
(%)
Tm1−200010150505020
Tm21000012017001090100
Tm3−100.41505090
Tm4−50.050.2111090
Tm5−0.10.0050.21150100
Tm6−10.0050.1111050
Tm7−10.050.51250100
Tm8−4570.429.70177.123500.994620.053080
Tm9−900029.1630070009464.63010
Rm1−130.9508.47129.46805090
Rm2−70.40.83527.120.99155.253080
Rm300.100150100
Rm40210205080
Tt1−1.2(99%) *111.1217.2800/
Tt2−1.0(99.92%) *1017.0400/
Tt3−280(99%) *106.6616000/
*: 99%, 99.92% and 99% represent the perchlorate removal rates of T1, T2 and T3, respectively.
Table A2. Sampling boundary of uncertainty parameter.
CategoriesUncertainty ParameterRange
Energy performanceEnergy consumption intensity in the base year±10%
Energy-saving effect of advanced technology±20%
Energy intensity of by-product and waste recovery technology±20%
Parameter of perchlorate discharge Perchlorate discharge intensity in base year±10%
Direct perchlorate discharge reduction amount±20%
Economic costElectricity price±10%
Potassium perchlorate price±20%
Present situation of applicationPenetration rate±20%
Table A3. Penetration rate of measures under three objective preferences.
NO.Baseline Year Penetration Rate
(%)
Predicted Penetration Rate-2030
(%)
ECP
(%)
PERP
(%)
CCP
(%)
Tm15020/00
Tm290100909390
Tm35090/100100
Tm41090806594
Tm550100/5295
Tm61050883493
Tm750100679771
Tm830800//
Tm930100//
Rm15090100100100
Rm23080999898
Rm350100/8097
Rm4508099100100
Tt10/000
Tt20/100100100
Tt30/000
Table A4. Parameter Settings for the NSGA-II Algorithm.
ParameterPopulation SizeIteration TimesMutation ProbabilityCrossover Probability
Value1001500.040.9

References

  1. Kumarathilaka, P.; Oze, C.; Indraratne, S.P.; Vithanage, M. Perchlorate as an emerging contaminant in soil, water and food. Chemosphere 2016, 150, 667–677. [Google Scholar] [CrossRef]
  2. Qu, D.; Zhang, J.; Wan, D.; Niu, Z. Perchlorate removal by a combined heterotrophic and bio-electrochemical hydrogen autotrophic system. Sci. Total Environ. 2022, 851, 158178. [Google Scholar] [CrossRef] [PubMed]
  3. Vinson, V. The double punch of perchlorate. Science 2020, 368, 1444–1445. [Google Scholar]
  4. Kumar, K.S.; Kavitha, S.; Parameswari, K.; Sakunthala, A.; Sathishkumar, P. Environmental occurrence, toxicity and remediation of perchlorate—A review. Chemosphere 2023, 311, 137017. [Google Scholar] [CrossRef]
  5. Han, Y.; Li, D.; Zou, C.; Li, Y.; Zhao, F. Effects of perchlorate, nitrate, and thiocyanate exposures on serum total testosterone in children and adolescents. Sci. Total Environ. 2023, 861, 160566. [Google Scholar] [CrossRef]
  6. Van Stempvoort, D.R.; MacKay, D.R.; Brown, S.J.; Collins, P. Environmental fluxes of perchlorate in rural catchments, Ontario, Canada. Sci. Total Environ. 2020, 720, 137426. [Google Scholar] [CrossRef] [PubMed]
  7. Kannan, K.; Praamsma, M.L.; Oldi, J.F.; Kunisue, T.; Sinha, R.K. Occurrence of perchlorate in drinking water, groundwater, surface water and human saliva from India. Chemosphere 2009, 76, 22–26. [Google Scholar] [CrossRef]
  8. EFSA Panel on Contaminants in the Food Chain (CONTAM). Scientific Opinion on the risks to public health related to the presence of perchlorate in food, in particular fruits and vegetables. EFSA J. 2014, 12, 10. [Google Scholar]
  9. Muñoz-Arango, D.; Torres-Rojas, F.; Tapia, N.; Vega, M.; Alvear, C.; Pizarro, G.; Pastén, P.; Cortés, S.; Vega, A.S.; Calderón, R.; et al. Perchlorate and chlorate assessment in drinking water in northern Chilean cities. Environ. Res. 2023, 233, 116450. [Google Scholar] [CrossRef]
  10. Kounaves, S.P.; Stroble, S.T.; Anderson, R.M.; Moore, Q.; Catling, D.C.; Douglas, S.; McKay, C.P.; Ming, D.W.; Smith, P.H.; Tamppari, L.K.; et al. Discovery of Natural Perchlorate in the Antarctic Dry Valleys and Its Global Implications. Environ. Sci. Technol. 2010, 44, 2360–2364. [Google Scholar] [CrossRef]
  11. Cao, F.; Jaunat, J.; Sturchio, N.; Cancès, B.; Morvan, X.; Devos, A.; Barbin, V.; Ollivier, P. Worldwide occurrence and origin of perchlorate ion in waters: A review. Sci. Total Environ. 2019, 661, 737–749. [Google Scholar] [CrossRef] [PubMed]
  12. Fournier, E.W.; Brady, B.B. Perchlorate Leaching from Solid Rocket Motor Propellant in Water. J. Propuls. Power 2005, 21, 937–941. [Google Scholar] [CrossRef]
  13. Karunanidhi, D.; Aravinthasamy, P.; Subramani, T.; Jayasena, H.C. Perchlorate Contamination in Groundwater and Associated Health Risks from Fireworks Manufacturing Area (Sivakasi region) of South India. Expo. Health 2022, 14, 359–373. [Google Scholar] [CrossRef]
  14. Chen, W.; He, N.; Shi, Y.; An, W.; Yang, M. Analysis of exposure routes and contribution rate of perchlorate in China. Chin. Sci. Bull. 2020, 65, 1387–1394. (In Chinese) [Google Scholar] [CrossRef]
  15. GB 5749-2022; Standards for Drinking Water Quality. State Administration for Market Regulation and National Administration of Standardization: Beijing, China, 2022.
  16. Shi, G. A new process for the combined production of potassium perchlorate. Chem. Eng. Equip. 2014, 3, 54–58. (In Chinese) [Google Scholar]
  17. Wang, Y.; Wen, Z.; Yao, J.; Dinga, C.D. Multi-objective optimization of synergic energy conservation and CO2 emission reduction in China’s iron and steel industry under uncertainty. Renew. Sustain. Energy Rev. 2020, 134, 110128. [Google Scholar] [CrossRef]
  18. Ma, H.; Fei, M.; Jiang, Z.; Li, L.; Zhou, H.; Crookes, D. A Multipopulation-Based Multiobjective Evolutionary Algorithm. IEEE Trans. Cybern. 2020, 50, 689–702. [Google Scholar] [CrossRef]
  19. Deb, K.; Pratap, A.; Agarwal, S.; Meyarivan, T.A.M.T. A fast and elitist multiobjective genetic algorithm: NSGA-II. IEEE Trans. Evol. Comput. 2002, 6, 182–197. [Google Scholar] [CrossRef]
  20. Huang, W.; Zhang, Y.; Li, L. Survey on Multi-Objective Evolutionary Algorithms. J. Phys. Conf. Ser. 2019, 1288, 012057. [Google Scholar] [CrossRef]
  21. Chen, P. Effects of the entropy weight on TOPSIS. Expert Syst. Appl. 2021, 168, 114186. [Google Scholar] [CrossRef]
  22. Hwang, C.L.; Yoon, K. Methods for multiple attribute decision making. In Multiple Attribute Decision Making: Methods and Applications a State-of-the-Art Survey; Springer: Berlin/Heidelberg, Germany, 1981; pp. 58–191. [Google Scholar]
  23. Opricovic, S.; Tzeng, G.H. Compromise solution by MCDM methods: A comparative analysis of VIKOR and TOPSIS. Eur. J. Oper. Res. 2004, 156, 445–455. [Google Scholar] [CrossRef]
  24. China’s Development and Reform Commission. Notice on the Issuance of the Plan for Improving the Double Control Degree of Energy Consumption Intensity and Total Amount. Available online: https://www.gov.cn/zhengce/zhengceku/2021-09/17/content_5637960.htm (accessed on 11 September 2021).
  25. Wen, Z.; Wang, Y.; Zhang, C.; Zhang, X. Uncertainty analysis of industrial energy conservation management in China’s iron and steel industry. J. Environ. Manag. 2018, 225, 205–214. [Google Scholar] [CrossRef] [PubMed]
  26. Olsson, A.; Sandberg, G.; Dahlblom, O. On Latin hypercube sampling for structural reliability analysis. Struct. Saf. 2003, 25, 47–68. [Google Scholar] [CrossRef]
  27. Ma, H.; Zhang, Y.; Sun, S.; Liu, T.; Shan, Y. A comprehensive survey on NSGA-II for multi-objective optimization and applications. Artif. Intell. Rev. 2023, 56, 15217–15270. [Google Scholar] [CrossRef]
  28. Huang, D.; Dinga, C.D.; Wen, Z.; Razmadze, D. Industrial-environmental management in China’s iron and steel industry under multiple objectives and uncertainties. J. Environ. Manag. 2022, 310, 114785. [Google Scholar] [CrossRef]
  29. Menzel, G.; Och, S.H.; Mariani, V.C.; Moura, L.M.; Domingues, E. Multi-objective optimization of the volumetric and thermal efficiencies applied to a multi-cylinder internal combustion engine. Energy Convers. Manag. 2020, 216, 112930. [Google Scholar] [CrossRef]
  30. Wang, Y.; Chen, C.; Tao, Y.; Wen, Z.; Chen, B.; Zhang, H. A many-objective optimization of industrial environmental management using NSGA-III: A case of China’s iron and steel industry. Appl. Energy 2019, 242, 46–56. [Google Scholar] [CrossRef]
  31. Sandoval, C.; Cuate, O.; González, L.C.; Trujillo, L.; Schütze, O. Towards fast approximations for the hypervolume indicator for multi-objective optimization problems by Genetic Programming. Appl. Soft Comput. 2022, 125, 109103. [Google Scholar] [CrossRef]
  32. Guerreiro, A.P.; Fonseca, C.M.; Paquete, L. The Hypervolume Indicator. ACM Comput. Surv. 2021, 54, 1–42. [Google Scholar] [CrossRef]
  33. Yang, K.; Emmerich, M.; Deutz, A.; Bäck, T. Multi-Objective Bayesian Global Optimization using expected hypervolume improvement gradient. Swarm Evol. Comput. 2019, 44, 945–956. [Google Scholar] [CrossRef]
  34. Shang, K.; Ishibuchi, H.; He, L.; Pang, L.M. A Survey on the Hypervolume Indicator in Evolutionary Multiobjective Optimization. IEEE Trans. Evol. Comput. 2021, 25, 1–20. [Google Scholar] [CrossRef]
  35. Li, F.; Shang, Z.; Shen, H.; Liu, Y.; Huang, P.Q. Combining modified inverted generational distance indicator with reference-vector-guided selection for many-objective optimization. Appl. Intell. 2023, 53, 12149–12162. [Google Scholar] [CrossRef]
  36. Chang, C.H.; Lin, J.J.; Lin, J.H.; Chiang, M.C. Domestic open-end equity mutual fund performance evaluation using extended TOPSIS method with different distance approaches. Expert Syst. Appl. 2010, 37, 4642–4649. [Google Scholar] [CrossRef]
  37. GB8978-1996; Integrated Wastewater Discharge Standard. Ministry of Ecology and Environment of the People’s Republic of China: Beijing, China, 1996.
  38. GB 31573−2015; Emission Standards of Pollutants for the Inorganic Chemical Industry. Ministry of Ecology and Environment of the People’s Republic of China: Beijing, China, 2015.
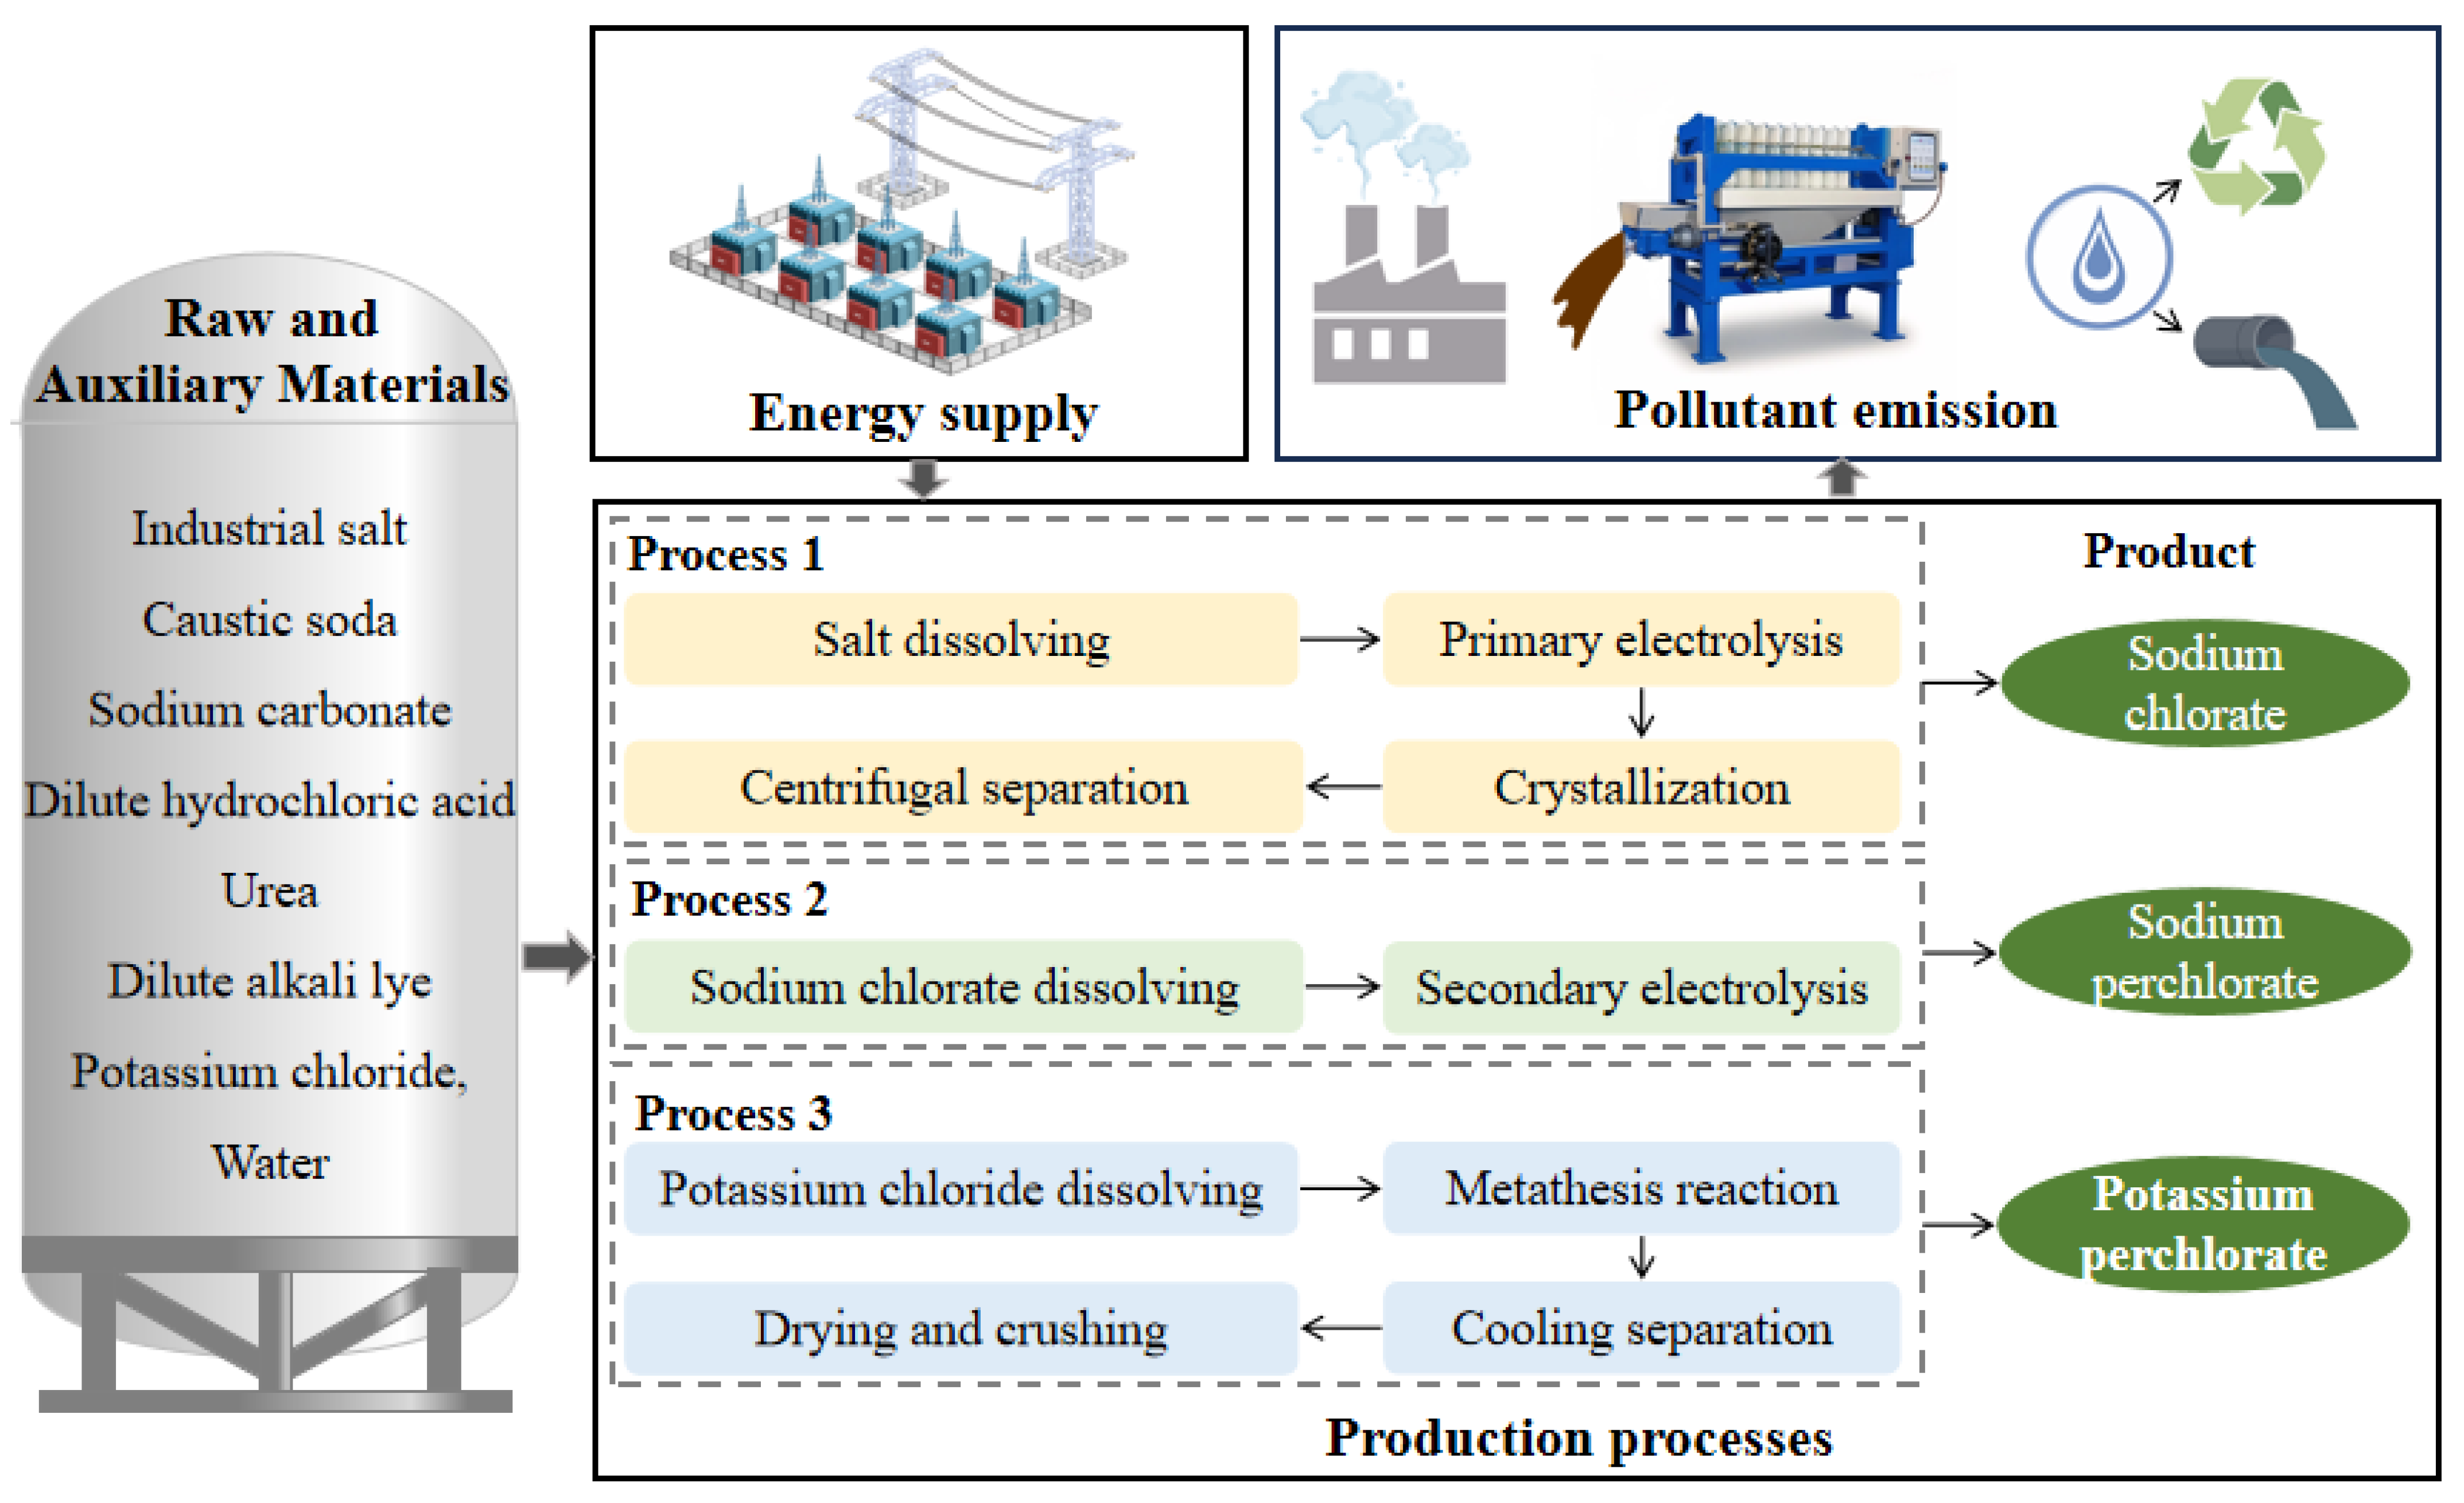
Figure 1. Potassium perchlorate production process system.
Sustainability 16 06924 g001
Figure 2. The framework of solution methods.
Sustainability 16 06924 g002
Figure 3. Algorithm performance verification results (The red dashed line indicates that the value of the algorithm performance indicator has leveled off since this iteration).
Sustainability 16 06924 g003
Figure 4. The minimum objective values of the solutions in each generation: (a) Objective function F1 of Method A; (b) Objective function F1 of Method B; (c) Objective function F2 of Method A; (d) Objective function F2 of Method B; (e) Objective function F3 of Method A; (f) Objective function F3 of Method B.
Sustainability 16 06924 g004
Figure 5. Penetration rate of Tm, Rm, and Tt in different scenarios.
Sustainability 16 06924 g005
Table 1. List of technical measures.
NO.MethodsMethod AMethod B
Tm1Improved coating formulation technology for single-pole gas stripping external circulation electrolyzers; it could be used in primary electrolysis, could enhance current density and reduce equipment footprint, but significantly increase energy consumption intensity.
Tm2Continuous cycle electrolysis, which could be used in secondary electrolysis, could improve the current efficiency compared with the traditional deep electrolysis technology.
Tm3Filtering electrolyzed brine with a precise membrane filtration system could improve brine quality and lower electrolysis energy consumption.
Tm4Treatment and reuse of workshop floor and plant flushing water could reduce the perchlorate escaping from the production process into the environment.
Tm5Separate storage and management of hazardous waste and general solid waste could save some unnecessary cost input, and the management is more reasonable.
Tm6Vacuum dust collection system: it could be employed for dust cleaning on workers’ hands and workwear surfaces and could prevent perchlorate materials from being discharged into the environment through workers’ hands and clothing.
Tm7Constructing rainwater collection ponds could prevent the dispersion of perchlorate from the factory road during rainy days.
Tm8Adding the primary electrolysis process (accompanied by Mechanical vapor recompression (MVR)) could realize the reuse of the mother liquor from double decomposition, and the potassium perchlorate and sodium chloride separated by MVR can bring certain economic benefits.
Tm9Adding the primary electrolysis process (without MVR) could realize the reuse of the mother liquor from double decomposition; some excess sodium chlorate will be sold to the market, but this part of sodium chlorate contains a small amount of perchlorate.
Rm1Hydrogen purification and recovery technology could recover hydrogen from an electrolysis tank.
Rm2MVR could efficiently recover NaCl and potassium perchlorate from the double decomposition mother liquor.
Rm3Extracting and reusing perchlorate from filter-pressed sludge.
Rm4Recovering dust from the potassium perchlorate drying workshop using a bag filter.
Tt1In ion exchange, the modified resin material has a selective adsorption capacity for perchlorate ions in wastewater, and the adsorption capacity of the resin material is greatly improved.
Tt2Efficient biodegradation technology. The efficient and harmless transformation of perchlorate in wastewater was achieved by adding efficient reducing bacteria, controlling the REDOX potential of the reactor, and regulating hydraulic conditions of the UASB unit to promote sludge flocculation.
Tt3The catalytic reduction technique includes pretreatment and the “HJ-PERCl” REDOX system, which can decompose perchlorate into chloride under specific conditions.
√ indicates the technologies that can be applied to the corresponding production mode.
Table 2. The key discharging nodes and pollutant intensities in the potassium perchlorate manufacturing industry.
NO.NodesIntensities
(kg/t KClO4)
Method AMethod B
The mother liquor from double decomposition36.156.45
The dust from the drying shop1.90
The salt sludge from pressure filters1.20
The potassium perchlorate powder scattered to the floor of the packaging workshop0.051
The potassium perchlorate residual on the factory road surface0.001
The potassium perchlorate carried on workers’ hands and clothing0.0056
Total (kg/t KClO4) 9.6138.11
√ denotes the nodes that were presented in this method.
Table 3. The optimal target value under the two production methods.
Method AMethod B
Value in 2020CertaintyUncertaintyValue in 2020CertaintyUncertainty
Energy intensity
(kW·h/t)
78207622.357620.1137903692.773693.52
Perchlorate discharging intensity
(kg/t)
9.613.17 × 10−33.17 × 10−338.112.4 × 10−73 × 10−6
Economic cost
(CNY/t)
/−457.03 *−456.31 */−514.65 *−531.16 *
*: A negative cost value indicates that the benefits exceed the costs.
Table 4. The objective values are under different objective preferences.
ObjectiveECPPERPCCP
Energy intensity (kW·h/t)3910.107831.427840.82
Perchlorate discharge intensity (kg/t)0.00970.00320.0032
Economic cost (CNY/t)−310.95−417.90−442.09
Table 5. Key measures under different preferences.
PreferenceKey Measures
ECPTm6, Rm1, Rm2, Rm4, Tt2
PERPTm3, Rm1, Rm2, Rm4, Tt2
CCPTm3, Tm4, Tm6, Rm1, Rm2, Rm4, Tt2
Disclaimer/Publisher’s Note: The statements, opinions and data contained in all publications are solely those of the individual author(s) and contributor(s) and not of MDPI and/or the editor(s). MDPI and/or the editor(s) disclaim responsibility for any injury to people or property resulting from any ideas, methods, instructions or products referred to in the content.