

Research on Evaluation of City–Industry Integration in Industrial Parks

Abstract
1. Introduction
2. Evaluation Indicator System of City–Industry Integration in Industrial Parks
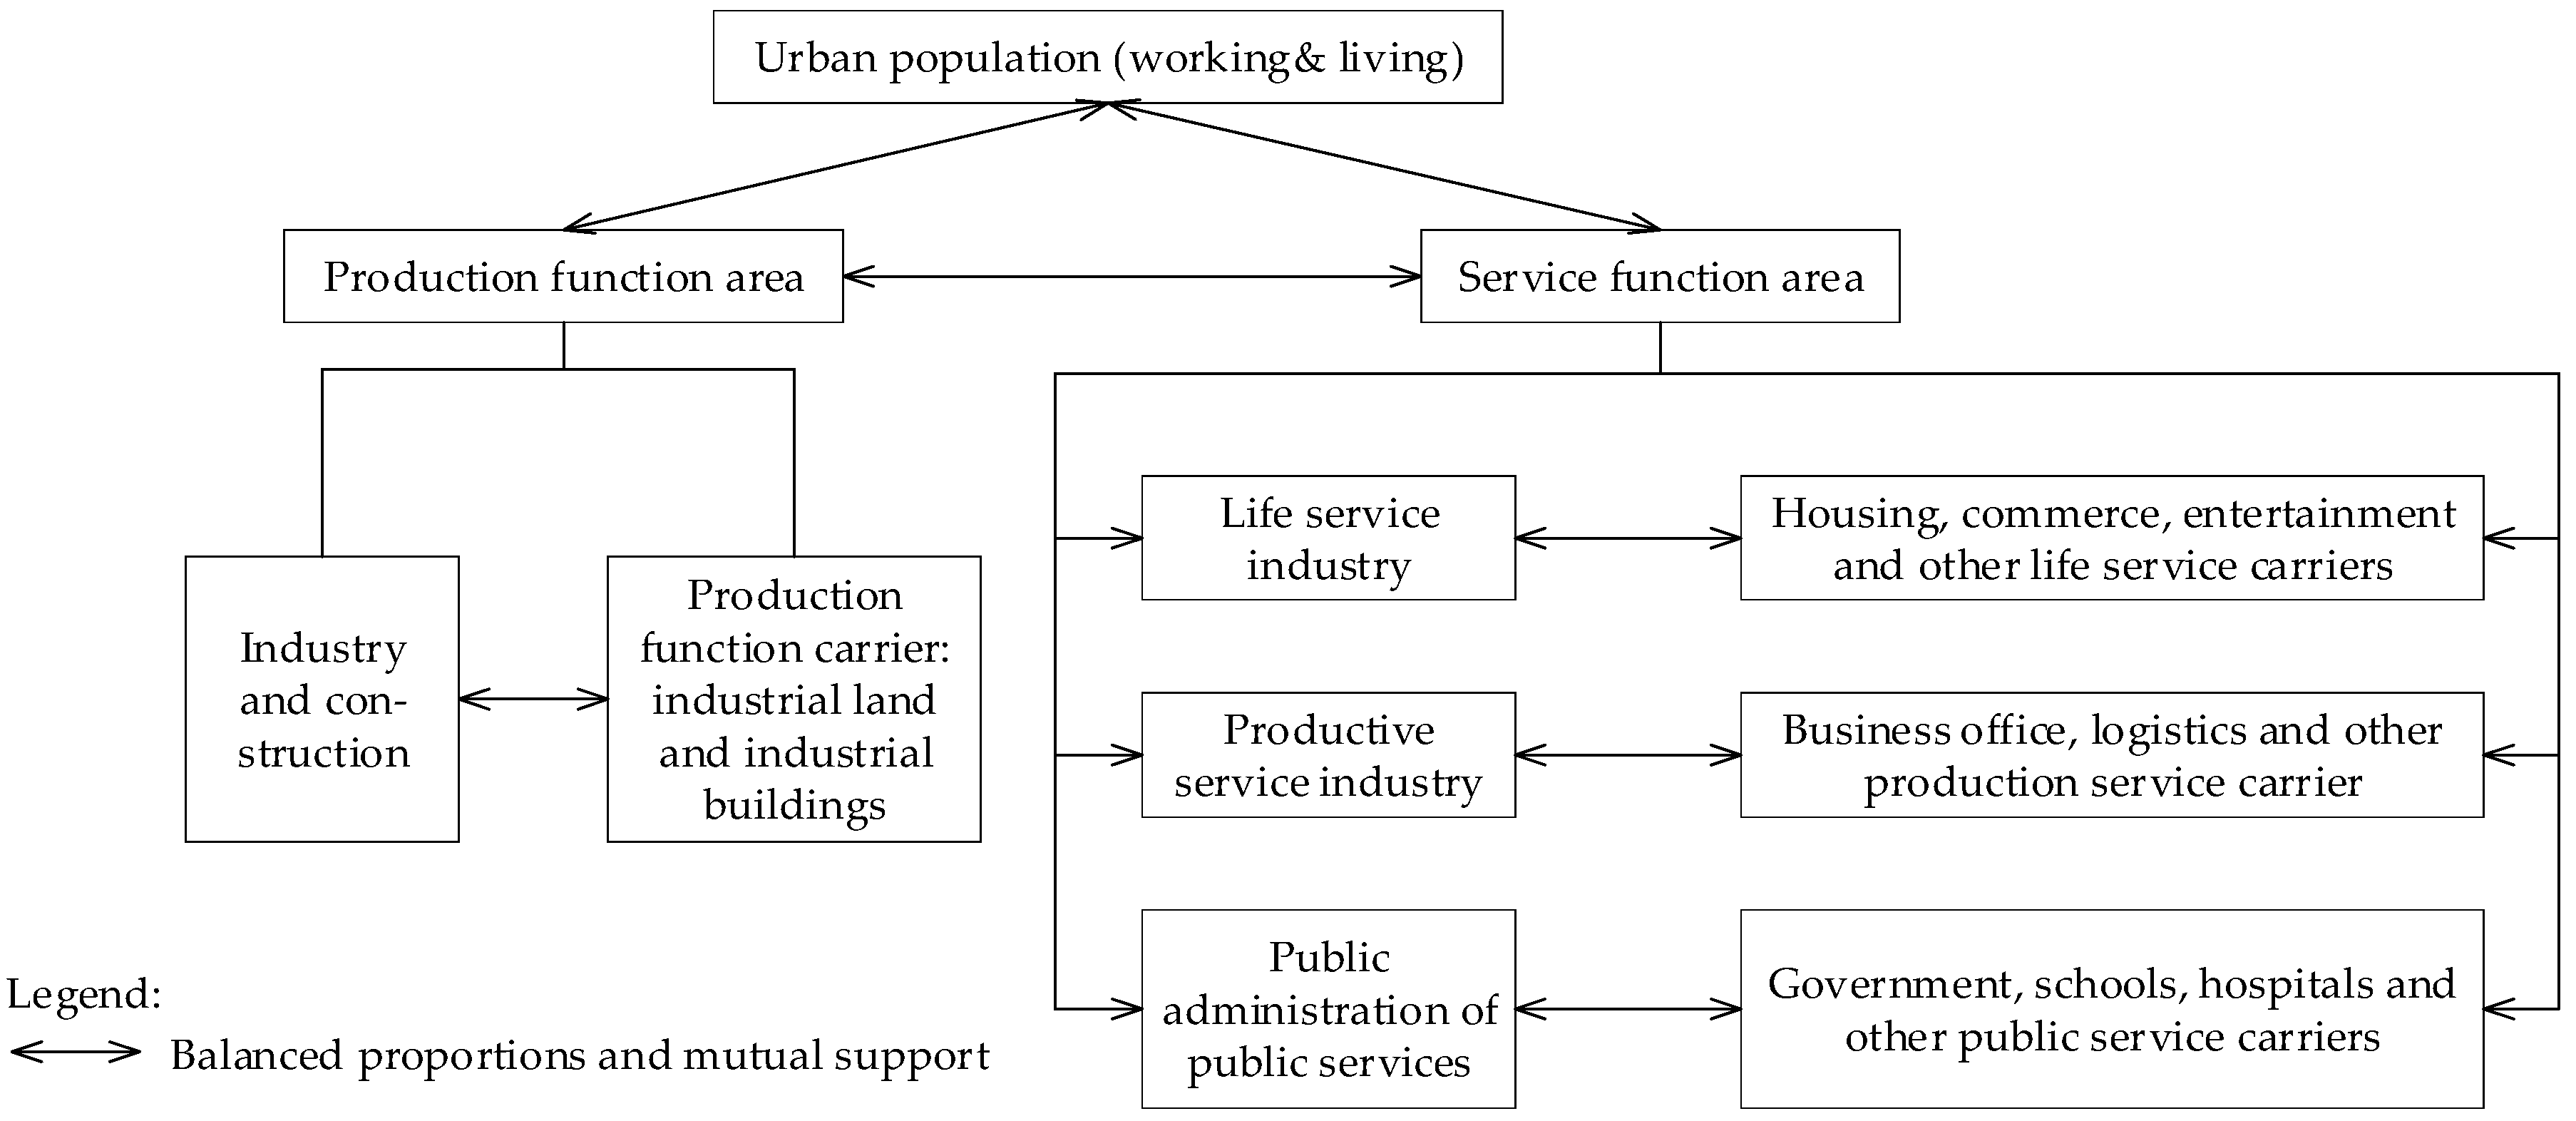
2.1. The Original Meaning of Industry-City Integration
2.2. Indicators of Land–Industry Integration in Industrial Park
2.3. Indicators of Residence–Industry Integration in Industrial Park
3. Data Collection and Processing of City–Industry Integration in Industrial Parks
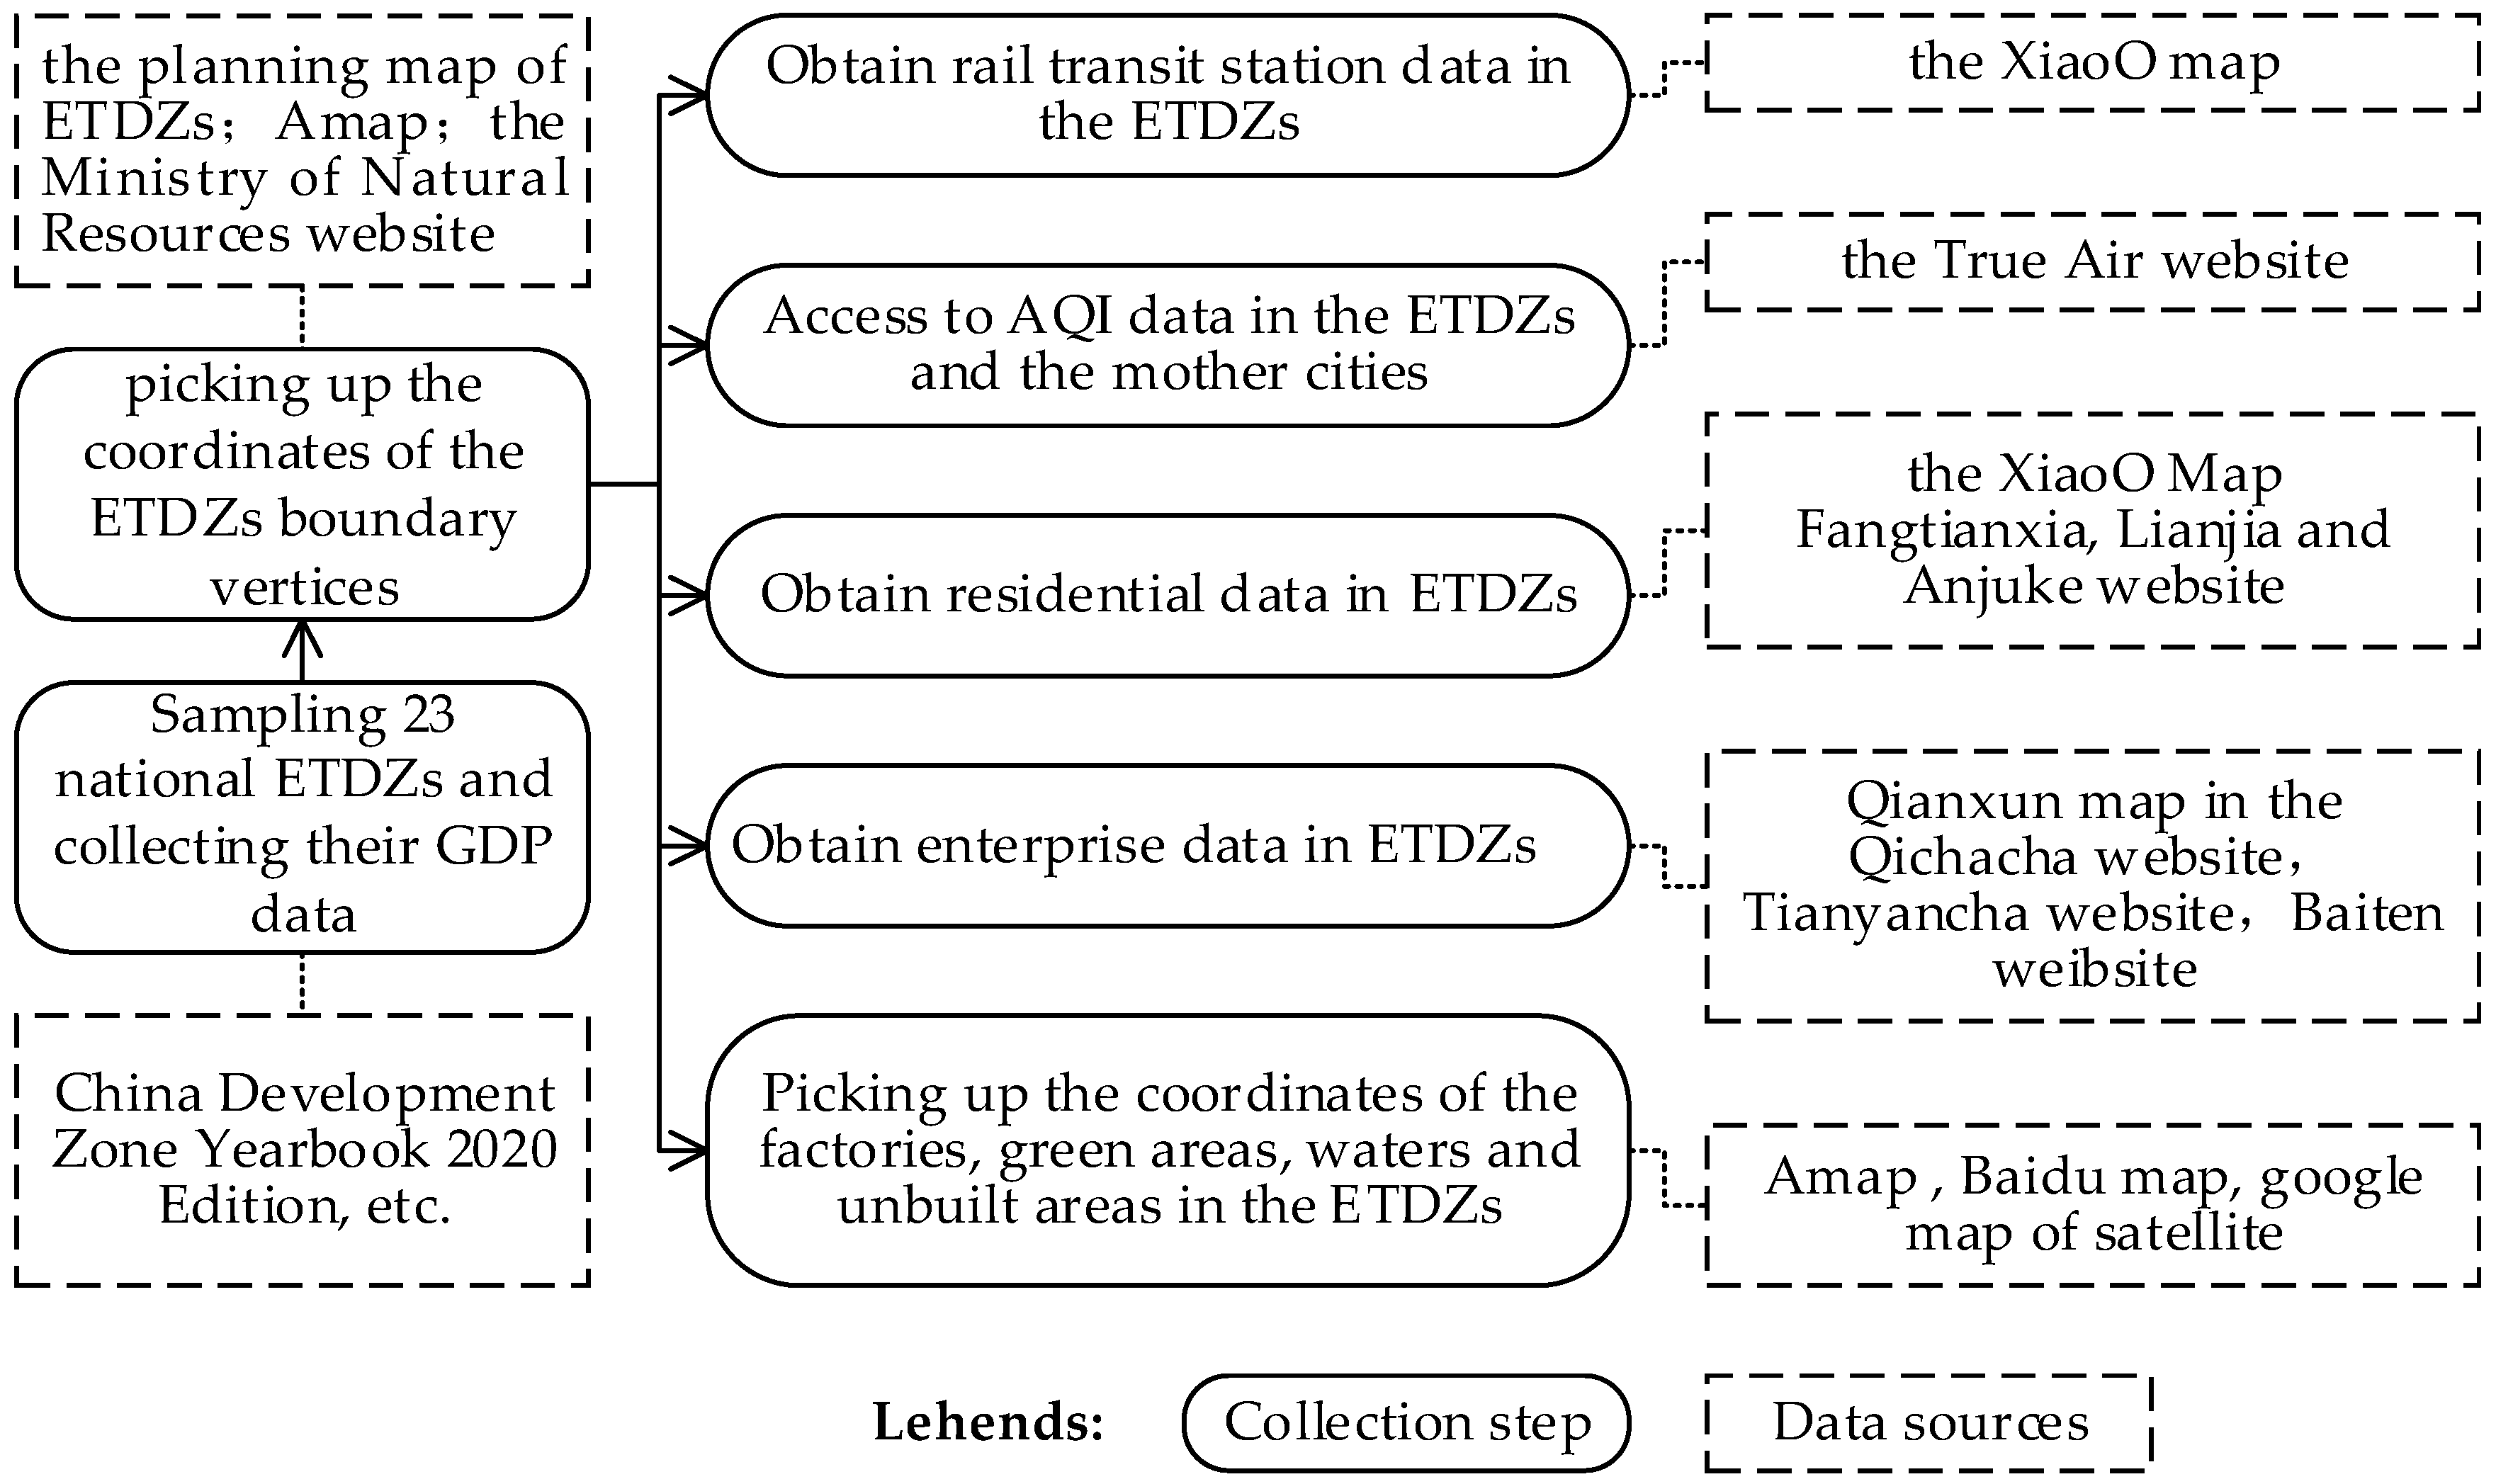
3.1. Data Collection Methods and Procedures
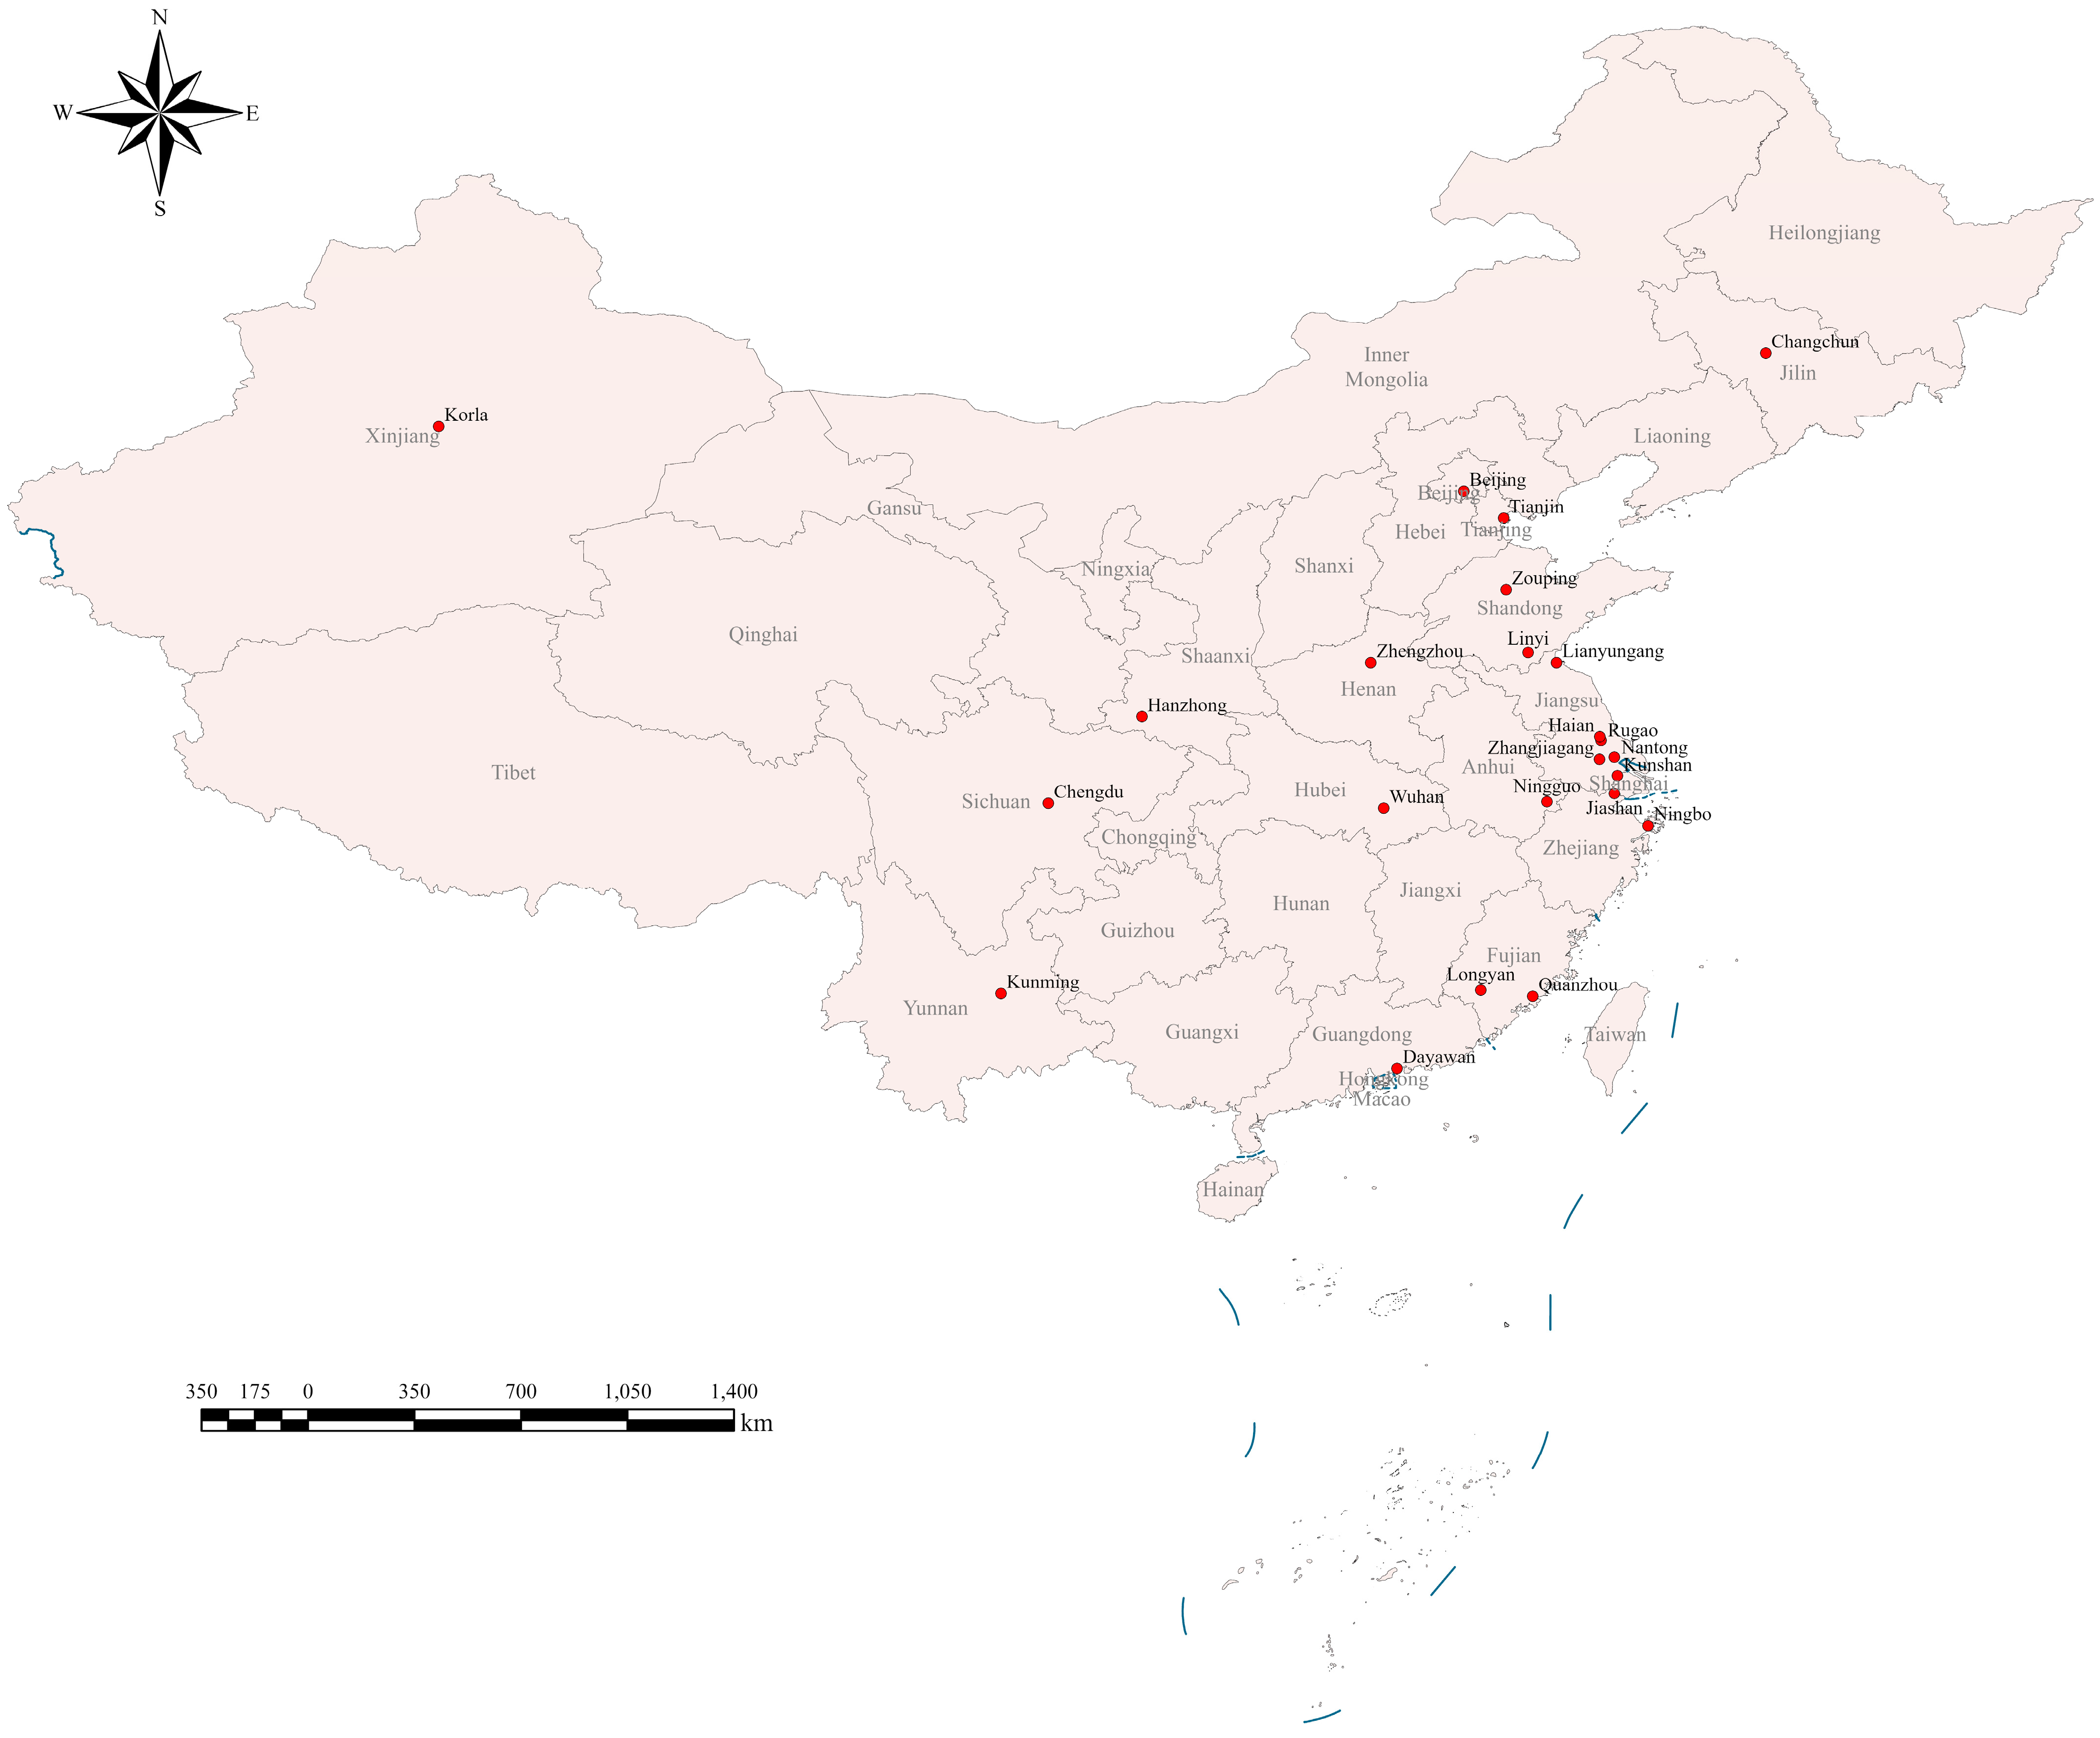
3.1.1. Select the Evaluation Objects of City–Industry Integration in ETDZs
- (1)
- Inclusion in China Development Zone Yearbook 2020 Edition;
- (2)
- Economic growth data are disclosed;
- (3)
- The planning map can be found through open channels.
3.1.2. Determine the Scope of the Sample ETDZs on the Map
3.1.3. Pick up the Polygon Vertex Coordinates of Factories, Green Space Water Area and Unbuilt Area in ETDZs and Calculate Their Area
3.1.4. Obtain the Data of Enterprises in ETDZs
3.1.5. Get Data on the Land Area of Residential Areas in ETDZs
3.1.6. Get Air Quality Index (AQI) Data
3.1.7. Obtain the Data of Rail Transit Stations
3.2. Calculation Process and Data Characteristics of the Complex Index—Matching Degree between Residence and Environment
3.2.1. Supportive Residential Area Score in Industrial Parks
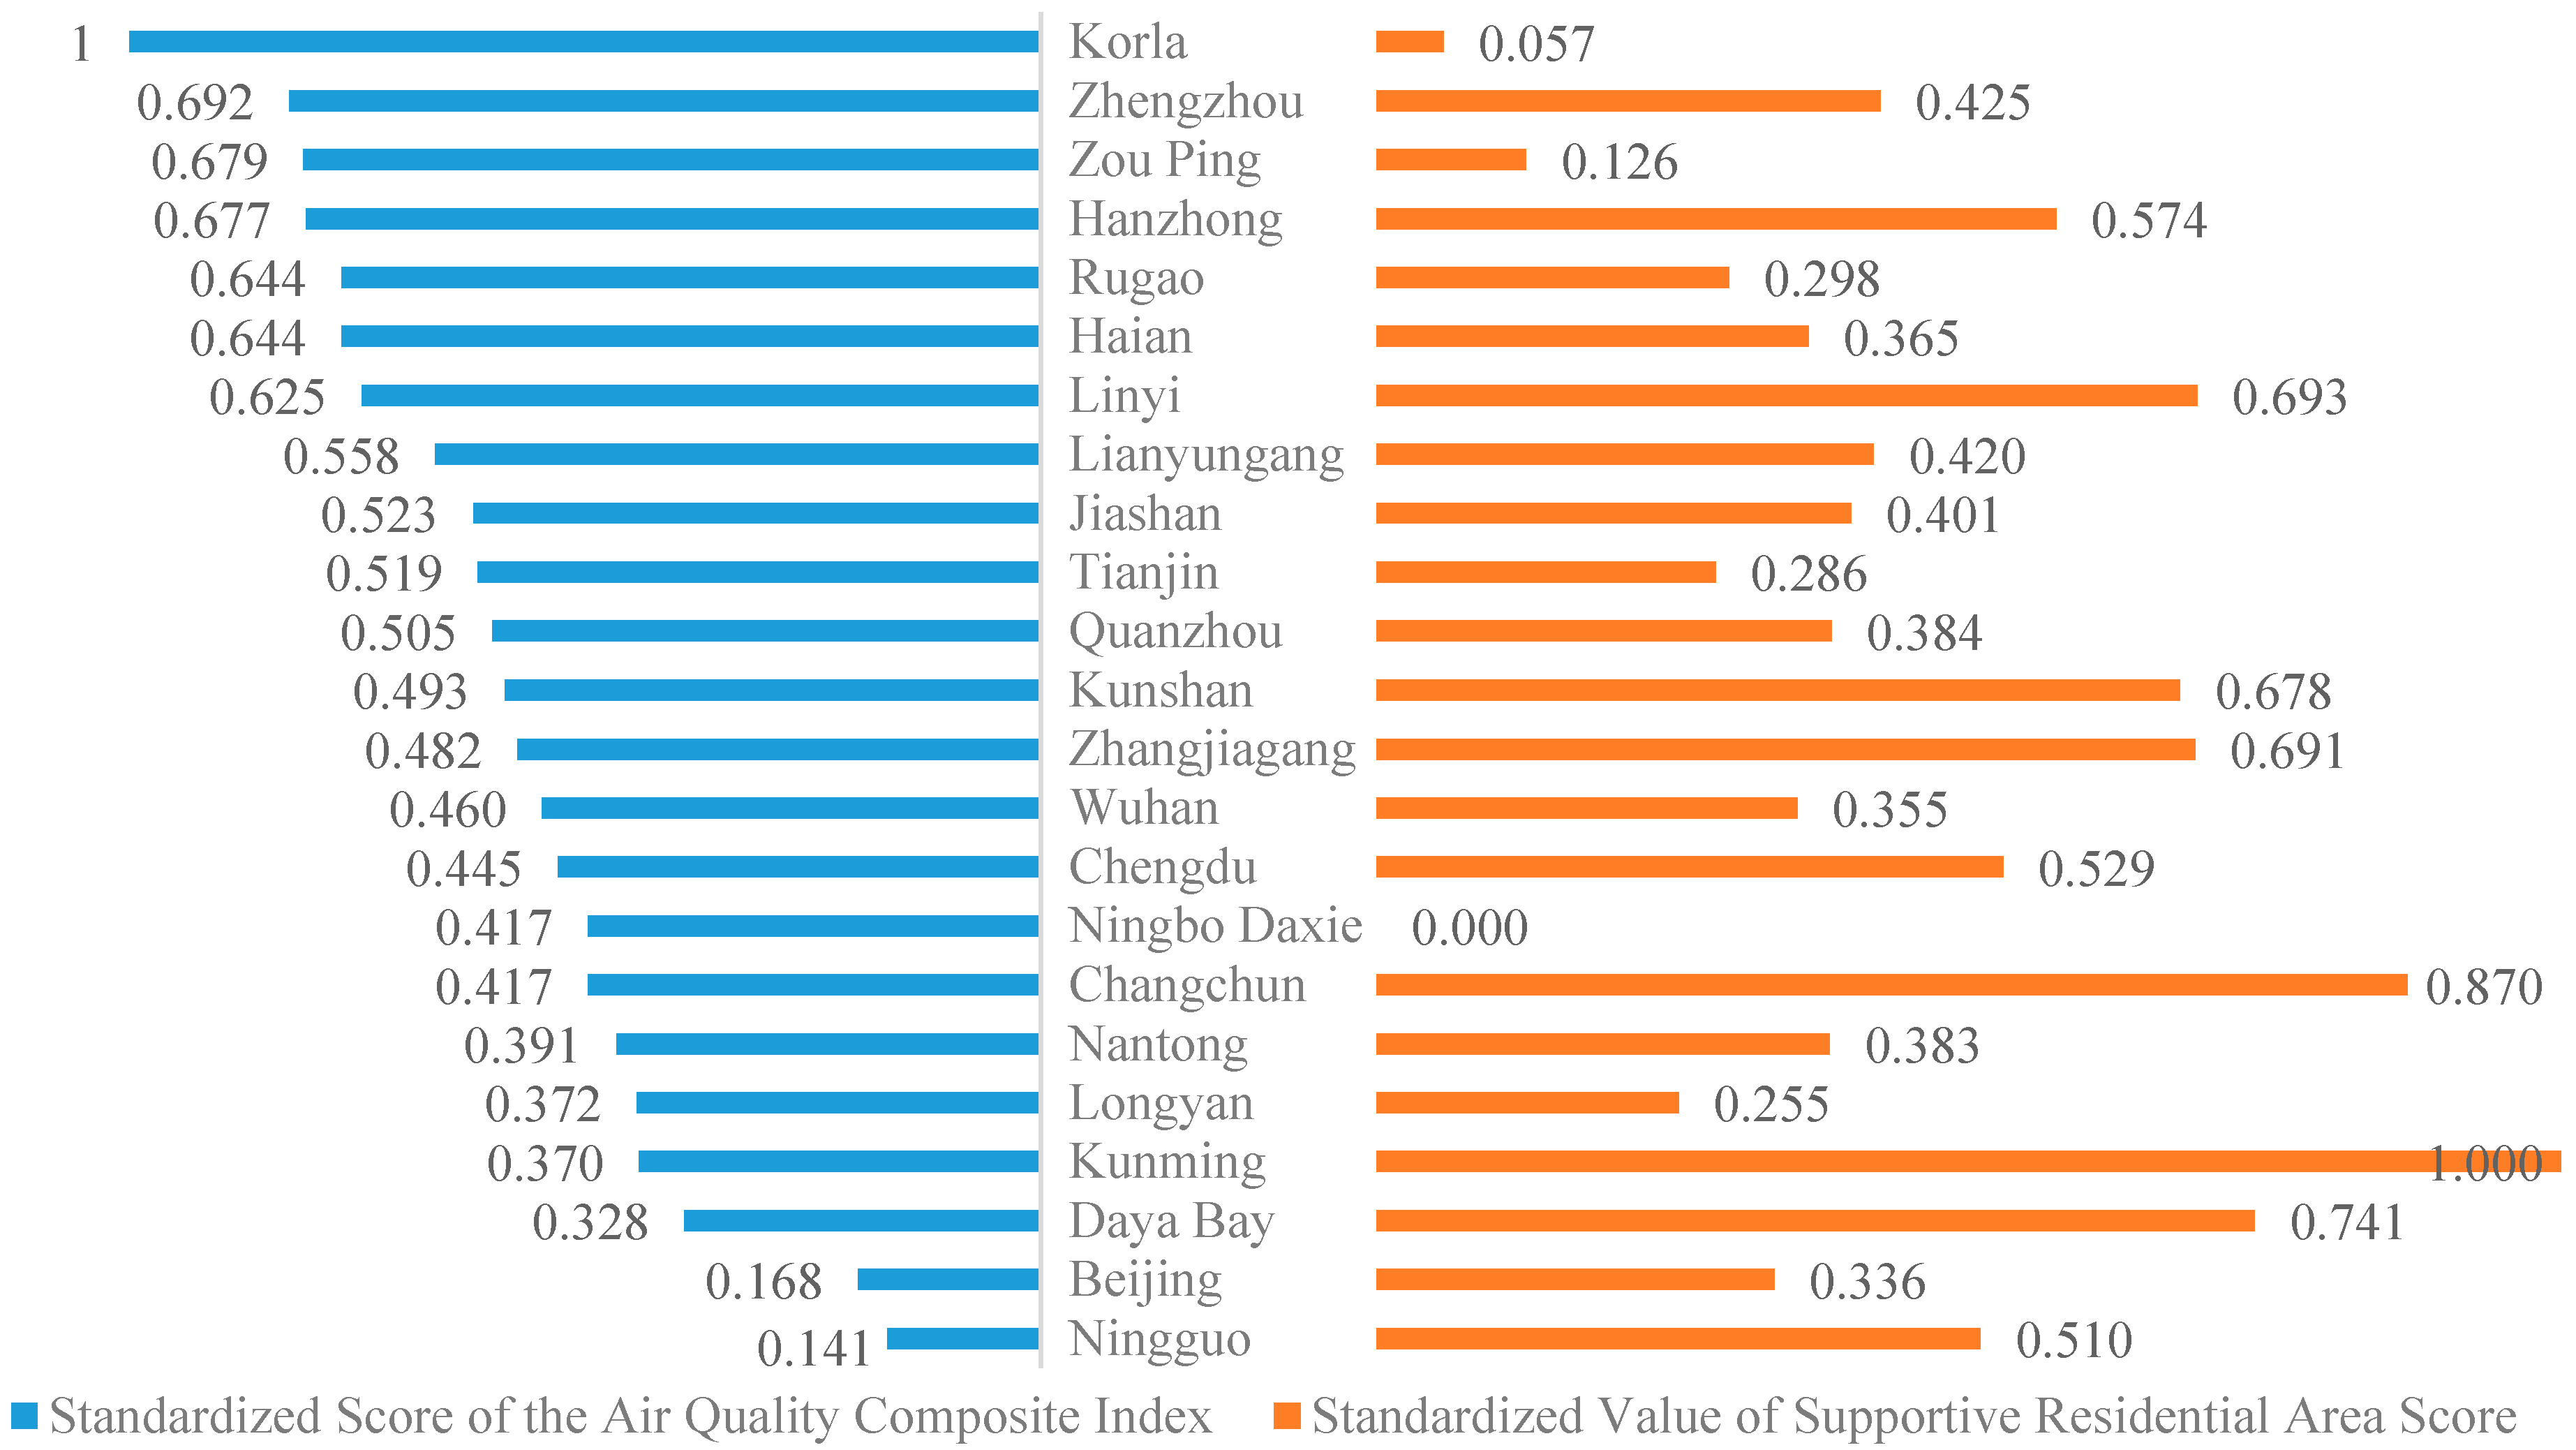
3.2.2. The Inverse Matching Relationship between the Air Quality Composite Index and Supportive Residential Area
3.2.3. Matching Degree Score between Residence and Environment in Industrial Parks
4. Evaluation Process and Results of City–Industry Integration in Industrial Parks
4.1. Standardization of Basic Indicators
4.2. Determine the Weight of Indicators Based on the Analytic Hierarchy Process of Expert Scores
4.2.1. Modelling the Hierarchy
4.2.2. Constructing the Comparison Discriminant Matrix
4.2.3. Hierarchical Single Sorting with Individual Expert Weights for Indicators
4.2.4. Maximum Eigenvalues of Judgement Matrices and Consistency Tests
4.2.5. Determine the Average Weight of Experts for the Indicator
4.3. Evaluation Results of City–Industry Integration in Sample Industrial Parks
4.4. Evaluation Verification Based on Entropy Weight Method
- From judgment matrix to normalization matrix P = (pij)23×4
- 2.
- Calculate the entropy matrix E from the P matrix
- 3.
- Calculate the entropy weight matrix W
5. Discussion
5.1. The Enlightenment for Practice from the Benchmark Industrial Park of City–Industry Integration: From the Chengdu Model to the Beijing Model
5.2. Academic Contributions
6. Conclusions
Author Contributions
Funding
Institutional Review Board Statement
Informed Consent Statement
Data Availability Statement
Acknowledgments
Conflicts of Interest
Appendix A

| Name of ETDZ | Vertex Number | Longitude | Latitude |
|---|---|---|---|
| Beijing ETDZ | 2\1 | 116.593694686889 | 39.7775400221545 |
| Beijing ETDZ | 2\2 | 116.566790061568 | 39.8058337127532 |
| Beijing ETDZ | 2\3 | 116.563310623168 | 39.8012829059164 |
| Beijing ETDZ | 2\4 | 116.552753448486 | 39.7962052557995 |
| Beijing ETDZ | 2\5 | 116.532583236694 | 39.8201394667626 |
| Beijing ETDZ | 2\6 | 116.512670516967 | 39.8113711500501 |
| Beijing ETDZ | 2\7 | 116.502628326416 | 39.8184254477015 |
| Beijing ETDZ | 2\8 | 116.476020812988 | 39.8052392565111 |
| Beijing ETDZ | 2\9 | 116.478853225708 | 39.8024698349971 |
| Beijing ETDZ | 2\10 | 116.470527648925 | 39.7974582172923 |
| Beijing ETDZ | 2\12 | 116.492757797241 | 39.7848616184177 |
| Beijing ETDZ | 2\13 | 116.483144760131 | 39.7802444862761 |
| Beijing ETDZ | 2\14 | 116.495332717895 | 39.7737140133473 |
| Beijing ETDZ | 2\15 | 116.493530273437 | 39.7645439197561 |
| Beijing ETDZ | 2\16 | 116.481084823608 | 39.7655995323052 |
| Beijing ETDZ | 2\17 | 116.486663818359 | 39.7322739560859 |
| Beijing ETDZ | 2\26 | 116.503314971923 | 39.7116766334180 |
| Beijing ETDZ | 2\27 | 116.532339864756 | 39.7147385924770 |
| Beijing ETDZ | 2\29 | 116.530622866242 | 39.7422610182087 |
| Beijing ETDZ | 2\30 | 116.547775268554 | 39.7675787622142 |
| Beijing ETDZ | 2\32 | 116.575155258178 | 39.7733182071942 |
Appendix B
| Digital Scale | Implication |
|---|---|
| 1 | Equally important |
| 3 | One factor is slightly more important than the other |
| 5 | One factor is significantly more important than the other |
| 7 | One factor is more strongly important than the other |
| 9 | One factor is extremely more important than the other |
| 2, 4, 6, 8 | The median of the two adjacent judgments above |
| First-Level Indicator (Intermediate Layer Element) | Second-Level Indicator (Intermediate Layer Element) | Three-Level Indicator (Factor Layer) | Index Calculation Formula |
|---|---|---|---|
| Intensive degree of production function areas (Land–industry integration) | Industrial land efficiency | Investment intensity | 0.5 × Registered capital of unit industrial land + 0.5 × paid-in capital of unit industrial land |
| Employment density | Number of people paying social security in industrial enterprises/Industrial land area | ||
| Density of invention patents on industrial land | Authorized patents of inventions for industrial enterprises /industrial land area | ||
| Industrial output intensity | Industrial added value/industrial land area | ||
| Service industry land efficiency | Service output intensity | Added value of service sector/land use of service sector(built-up area—factory area—green space and water area—residential area) | |
| Density of invention patents on services land | Authorized patents of inventions for services enterprises/service sector land area | ||
| Service employment density | Number of people paying social security in services enterprises/services land area | ||
| Integration degree of production functional area and life service functional area (Residence–industry integration) | Match degree between residence and environment | - | match degree between residence and environment calculation formula: 1 − |zr + za − 1|. zr refers to industrial park residential area support, positive indicator. za refers to the composite air quality index of the industrial park, inverse indicator. |
| Supportive Rail transit facilities | - | Standardization of rail traffic numbers |
References
- Minchin, T.J. It knocked this city to its knees’: The closure of Pillowtex Mills in Kannapolis, North Carolina and the decline of the US textile industry. Labor Hist. 2009, 50, 287–311. [Google Scholar] [CrossRef]
- Pallagst, K.; Fleschurz, R.; Nothof, S.; Uemura, T. PlanShrinking2-Trajectories of Planning Cultures in Shrinking Cities: The Cases Cleveland/USA, Bochum/Germany, and Nagasaki/Japan. IPS Working Paper. 2018. Available online: https://www.ru.uni-kl.de/fileadmin/intplan/Publikationen/Working_Paper_Series/IPS_WP_1_2018_-_PlanShrinking.pdf (accessed on 23 May 2024).
- Schackmar, J.; Fleschurz, R.; Pallagst, K. The Role of Substitute Industries for Revitalizing Shrinking Cities. Sustainability 2021, 13, 9250. [Google Scholar] [CrossRef]
- Rosenfeld, M.T.; Hornych, C. Could cities in de-industrialized regions become hot spots for attracting cultural businesses? The case of media industry in Halle an der Saale (Germany). Eur. Plan. Stud. 2010, 18, 371–384. [Google Scholar] [CrossRef]
- Liu, Z.; Adams, M.; Cote, R.P.; Geng, Y.; Li, Y. Comparative study on the pathways of industrial parks towards sustainable development between China and Canada. Resour. Conserv. Recycl. 2018, 128, 417–425. [Google Scholar] [CrossRef]
- Hudalah, D.; Nurrahma, V.; Sofhani, T.F.; Salim, W.A. Connecting fragmented enclaves through network? Managing industrial parks in the Jakarta-Bandung Urban Corridor. Cities 2019, 88, 1–9. [Google Scholar] [CrossRef]
- Maynard, N.J.; Raj Kanagaraj Subramanian, V.; Hua, C.Y.; Lo, S.F. Industrial symbiosis in Taiwan: Case study on Linhai industrial park. Sustainability 2020, 12, 4564. [Google Scholar] [CrossRef]
- Xi, J.P. Speech at the Central Urbanization Work Conference. Available online: http://www.bjzx.gov.cn/ztzl/ztxs/xsyz/ldjh/201911/t20191108_25284.html (accessed on 6 March 2023).
- Kong, X.; Yang, F. The development of City-industry Integration and the Transformation and Upgrading of Development Zones. Inq. Into Econ. Issues 2013, 5, 124–128. [Google Scholar]
- Xi, J.P. Several Major Issues in the Country’s Medium- and Long-Term Economic and Social Development Strategy [EB/OL]. Available online: https://www.gov.cn/xinwen/2020-10/31/content_5556349.htm (accessed on 12 March 2023).
- Li, Y.X.; Zhang, Z.Y. Study on the measurement of city-industry integration and threshold effect in western region. Stat. Decis. Mak. 2021, 37, 86–90. [Google Scholar]
- Wang, X.; Wang, Y.H.; Su, L. Index Evaluation System on the Degree of Production-City Integration in High-Tech Zones in China: Based on Factor Analysis and Entropy-Based Weight. J. Sci. Sci. Manag. S. T. 2014, 35, 79–88. [Google Scholar]
- Dong, W.; Gao, X.; Chen, X.; Lin, L. Industrial Park Renovation Strategy in a Poverty-Alleviated County Based on Inefficient Land Evaluation. Sustainability 2023, 15, 10345. [Google Scholar] [CrossRef]
- Tang, X.H. Evaluation and Suggestions of City-industry Integration in Development Zones from the Perspective of Urban Renewal. Econ. Issues Explor. 2014, 8, 144–149. [Google Scholar]
- Jia, J.; Bai, S.S.; Wang, X.F. Evaluation of City-industry Integration Measure about National Hi-tech Zones of Henan Province. Areal Res. Dev. 2019, 38, 30–34. [Google Scholar]
- He, Y.; Xia, Y. Evaluation and Countermeasures of City-industry Integration in Jiangsu Province. Mod. Econ. Res. 2017, 2, 72–76. [Google Scholar]
- Tang, X.H. A Study for City-industry Integration Evaluation Model of Development Zone Based on Grey Correlation Analysis. Shanghai J. Econ. 2014, 6, 85–92+102. [Google Scholar]
- Shi, B.; Deng, Y. Research on the Dynamic Coupling and Coordinated Development of the Integration of the Industries and the City in the Process of Resource-Based Cities. Ecol. Econ. 2017, 33, 122–125. [Google Scholar]
- Shao, Z. Industry and City Integration; Springer: Berlin/Heidelberg, Germany, 2015. [Google Scholar]
- Zheng, B.; Zhu, J. Evaluation of City-industry Integration Degree of National Independent Innovation Demonstration Zone. Stat. Decis. 2016, 18, 65–68. [Google Scholar]
- Kuznetsova, S.N.; Romanovskaya, E.V.; Artemyeva, M.V.; Andryashina, N.S.; Egorova, A.O. Advantages of residents of industrial parks (by the example of AVTOVAZ). In The Impact of Information on Modern Humans; Springer: Berlin/Heidelberg, Germany, 2018; pp. 502–509. [Google Scholar]
- Lambert, A.J.D.; Boons, F.A. Eco-industrial parks: Stimulating sustainable development in mixed industrial parks. Technovation 2002, 22, 471–484. [Google Scholar] [CrossRef]
- Nuhu, S.K.; Manan, Z.A.; Alwi, S.R.W.; Reba, M.N.M. Roles of geospatial technology in eco-industrial park site se-lection: State–of–the-art review. J. Clean. Prod. 2021, 309, 127361. [Google Scholar] [CrossRef]
- Park, J.Y.; Park, Y. Housing prices and environmental hazards: The effects of industrial park openings in Korea. Appl. Econ. Lett. 2024, 1–13. [Google Scholar] [CrossRef]
- Pilouk, S.; Koottatep, T. Environmental performance indicators as the key for eco-industrial parks in Thailand. J. Clean. Prod. 2017, 156, 614–623. [Google Scholar] [CrossRef]
- Son, C.H.; Oh, D.; Ban, Y.U. Eco-industrial development strategies and characteristics according to the performance evaluation of eco-industrial park projects in Korea. J. Clean. Prod. 2023, 416, 137971. [Google Scholar] [CrossRef]
- Valenzuela-Venegas, G.; Salgado, J.C.; Díaz-Alvarado, F.A. Sustainability indicators for the assessment of eco-industrial parks: Classification and criteria for selection. J. Clean. Prod. 2016, 133, 99–116. [Google Scholar] [CrossRef]
- Bellantuono, N.; Carbonara, N.; Pontrandolfo, P. The organization of eco-industrial parks and their sustainable practices. J. Clean. Prod. 2017, 161, 362–375. [Google Scholar] [CrossRef]
- Park, J.M.; Park, J.Y.; Park, H.S. A review of the National Eco-Industrial Park Development Program in Korea: Progress and achievements in the first phase, 2005–2010. J. Clean. Prod. 2016, 114, 33–44. [Google Scholar] [CrossRef]
- Gan, L.; Wei, L.; Huang, S.; Lev, B.; Jiang, W. Evaluation of City–Industry Integration Development and Regional Differences under the New Urbanization: A Case Study of Sichuan. Appl. Sci. 2022, 12, 4698. [Google Scholar] [CrossRef]
- Shi, Y.S.; Li, J.Q.; Li, B.; Hang, T.Y. A New Approach to Evaluate the Integrated Development of City and Industry: The Cases of Shanghai and the Kangqiao Industrial Park. Buildings 2022, 12, 1851. [Google Scholar] [CrossRef]
- Hao, H.M.; Ruan, L.; Yin, J.; Zhang, L.; Long, Y. Evaluation of urban industrial service facilities support based on industrial land survey data—Jiangsu Changzhou City as an example. Geogr. Res. Dev. 2021, 40, 88–93. [Google Scholar]
- Fang, L.; Liu, Z.; Jin, C. How Does the Integration of Cultural Tourism Industry Affect Rural Revitalization? The Mediating Effect of New Urbanization. Sustainability 2023, 15, 10824. [Google Scholar] [CrossRef]
- Zhang, J.Q.; Shen, S.W. Evaluation of city-industry integration in the middle reaches of Yangtze River urban agglomeration. Shanghai Econ. Res. 2017, 3, 109–114. [Google Scholar]
- Huang, H.; Zhang, W.X.; Cui, Y.N. Evaluation and Countermeasures of City-industry Integration in Development Zones in the Context of Transformation and Upgrading—Shanxi as an Example. Econ. Issues 2018, 11, 110–114. [Google Scholar]
- An, J.; Wang, R. The Coupling and Coordination Evaluation of City–industry Integration in State-level New Area—Taking Zhoushan Islands New Area and Qingdao West Coast New Area as Examples. Resour. Dev. Mark. 2021, 37, 287–293. [Google Scholar]
- Cong, H.; Zou, D.; Liu, C. Spatial-temporal pattern analysis of city-industry integration in the context of new urbanization: A case study of 285 prefecture-level cities in China. Econ. Geogr. 2017, 37, 46–55. [Google Scholar]
- Wang, X.; Su, L.; Guo, B.; Li, X. Evaluation of City-industry Integration of High-Tech District Based on Factor Analysis and Cluster Analysis. Sci. Technol. Prog. Policy 2013, 30, 26–29. [Google Scholar]
- Zhou, Z.J.; Zhou, G.H.; Wang, Y.B.; Xiao, J. Study on the measurement of city-industry integration in the city cluster around Changzhutan. J. Nat. Sci. Hunan Norm. Univ. 2016, 39, 8–13. [Google Scholar]
- Le Tellier, M.; Berrah, L.; Audy, J.F.; Stutz, B.; Barnabé, S. A sustainability assessment model for industrial parks: A Choquet integral aggregation approach. J. Environ. Manag. 2022, 316, 115165. [Google Scholar] [CrossRef]
- Wang, F. Research on the evaluation of city-industry integration development in industrial agglomerations based on combined empowerment and four-grid quadrant method. Ecol. Econ. 2014, 30, 36–41+46. [Google Scholar]
- Gan, L.; Shi, H.; Hu, Y.; Lev, B.; Lan, H. Coupling coordination degree for urbanization city-industry integration level: Sichuan case. Sustain. Cities Soc. 2020, 58, 102136. [Google Scholar] [CrossRef]
- Li, Y.; Cao, X.; Cui, C. System Dynamics Theory Applied to Differentiated Levels of City–Industry Integration in China. Sustainability 2023, 15, 3987. [Google Scholar] [CrossRef]
- Zheng, J.Q. Exploration and Practice of Space Evaluation System Based on the Concept of City–Industry Integration: A case study of urban design of Tongxiang New Town in Xiamen. Urban. Archit. 2023, 20, 82–87+112. [Google Scholar]
- Li, Y. Study on Comprehensive Evaluation of the level of City–Industry Integration in Fujian Province. J. Shanxi Inst. Econ. Manag. 2022, 30, 30–36. [Google Scholar]
- Kong, X.; Tian, Y. Exploration of High-spatial-resolution Integration Evaluation Method of Industry and City. In Proceedings of the 2022 29th International Conference on Geoinformatics, Beijing, China, 15–18 August 2022; Volume 29, pp. 1–6. [Google Scholar]
- Luo, D.; Xiao, J. The Urban City-industry Integration Degree Evaluation Based on Ordinal Logistic Regression. In Proceedings of the 2021 7th Annual International Conference on Network and Information Systems for Computers (ICNISC), Guiyang, China, 23–25 July 2021; Volume 7, pp. 582–588. [Google Scholar]
- Zou, D.L.; Cong, H.B. Spatio-Temporal Diversity Pattern of City-industry Integration and Its Influencing Factors in China. Econ. Geogr. 2019, 39, 66–74. [Google Scholar]
- Perrucci, D.V.; Aktaş, C.B.; Sorentino, J.; Akanbi, H.; Curabba, J. A review of international eco-industrial parks for implementation success in the United States. City Environ. Interact. 2022, 16, 100086. [Google Scholar] [CrossRef]
- Ceglia, D.; de Abreu, M.C.S.; Da Silva Filho, J.C.L. Critical elements for eco-retrofitting a conventional industrial park: Social barriers to be overcome. J. Environ. Manag. 2017, 187, 375–383. [Google Scholar] [CrossRef] [PubMed]
- Zhang, X.Z.; Zeng, Y.F.; Li, X.H. Evaluation Study on the Development of Industry City Integration Driven by Manufacturing Industry Transfer. Jiangxi Soc. Sci. 2020, 40, 105–115. [Google Scholar]

| First-Level Indicator (Criterion Layer B) | Second-Level Indicator (Sub-Criterion Layer C) | Three-Level Indicator (Elements Layer D) | Index Calculation Formula | |
|---|---|---|---|---|
| Land–industry integration (Coordination degree and balance between internal industries and carriers of production function zones and ser-vice function zones, B1) | Industrial land efficiency (C11) | Investment intensity (D111) | 0.5 × Registered capital of unit industrial land + 0.5 × paid-in capital of unit industrial land | |
| Employment density (D112) | Number of people paying social security in industrial enterprises/Industrial land area (factory area) | |||
| Density of invention patents on industrial land (D113) | Authorized patents of inventions for industrial enterprises/industrial land area | |||
| Industrial output intensity (D114) | Industrial added value/industrial land area | |||
| Service industry land efficiency (C12) | Output intensity of the service sector (D121) | Added value of service sector/land use of service sector, where land area of service sector = built-up area—factory area—green space and water area—residential area | ||
| Density of invention patents on services land (D122) | Authorized patents of inventions for services enterprises/service sector land area | |||
| Services employment density (D123) | Service employment density = Number of people paying social security in service sector enterprises/service sector land area | |||
| Residence–industry integration (Coordination and integration of production functional areas and residential service functional areas, B2) | Matching degree be-tween residence and environment (C21) | Residential area supporting scale (zr) | The standardized value of per capita residential area × 0.5 + the standardized value of the proportion of residential area to built-up area × 0.5 | match degree be-tween residence and environment calculation formula: |zr + za − 1| |
| Air Quality Composite Index (za) | AQI standardized value of industrial park× 0.5+ standardized value of (AQI of industrial park ÷ AQI of the mother city of industrial park) × 0.5 | |||
| Rail transit supporting facilities (C22) | The range standardization of “number of rail transit stations/built-up area of ETDZs” | |||
| ETDZs | Industrial Investment Intensity | Employment Density in Industrial Area | Patent Density of Industrial Inventions | Industrial Output Intensity | Service Output Intensity | Service Employment Density | Patent Density of Inventions in the Service Sector | Air Quality Composite Index | Match Degree between Residence and Environment | Rail Stations per Unit Area |
|---|---|---|---|---|---|---|---|---|---|---|
| Tianjin | 0.147 | 0.329 | 0.166 | 0.615 | 0.743 | 0.249 | 0.099 | 0.519 | 0.287 | 0.44 |
| Beijing | 1.000 | 1.000 | 1.000 | 1.000 | 0.912 | 1.000 | 1.000 | 0.168 | 0.337 | 1.00 |
| Nantong | 0.056 | 0.052 | 0.090 | 0.171 | 0.084 | 0.025 | 0.007 | 0.391 | 0.384 | 0.00 |
| Kunshan | 0.024 | 0.059 | 0.132 | 0.554 | 0.405 | 0.056 | 0.043 | 0.493 | 0.679 | 0.000 |
| Ningguo | 0.030 | 0.127 | 0.053 | 0.088 | 0.535 | 0.463 | 0.017 | 0.141 | 0.511 | 0.000 |
| Daya Bay | 0.024 | 0.015 | 0.004 | 0.162 | 0.069 | 0.004 | 0.000 | 0.328 | 0.742 | 0.000 |
| Kunming | 0.055 | 0.064 | 0.034 | 0.182 | 0.076 | 0.062 | 0.029 | 0.370 | 1.000 | 0.180 |
| Ningbo Daxie | 0.066 | 0.064 | 0.128 | 0.300 | 0.167 | 0.034 | 0.003 | 0.417 | 0.001 | 0.000 |
| Chengdu (Damian) | 0.127 | 0.242 | 0.098 | 0.612 | 0.117 | 0.059 | 0.009 | 0.445 | 0.530 | 0.987 |
| Rugao | 0.095 | 0.174 | 0.136 | 0.866 | 0.331 | 0.011 | 0.008 | 0.644 | 0.299 | 0.000 |
| Quanzhou | 0.154 | 0.474 | 0.222 | 0.720 | 0.542 | 0.133 | 0.096 | 0.505 | 0.385 | 0.000 |
| Jiashan | 0.056 | 0.166 | 0.094 | 0.446 | 1.000 | 0.107 | 0.021 | 0.523 | 0.401 | 0.000 |
| Zouping | 0.212 | 0.158 | 0.014 | 0.207 | 0.088 | 0.009 | 0.001 | 0.679 | 0.128 | 0.000 |
| Lianyungang | 0.001 | 0.060 | 0.099 | 0.102 | 0.029 | 0.037 | 0.002 | 0.558 | 0.421 | 0.000 |
| Hanzhong | 0.019 | 0.030 | 0.005 | 0.580 | 0.229 | 0.033 | 0.000 | 0.677 | 0.574 | 0.000 |
| Korla | 0.053 | 0.145 | 0.000 | 0.629 | 0.000 | 0.003 | 0.000 | 0.839 | 0.058 | 0.000 |
| Zhangjiagang | 0.173 | 0.465 | 0.247 | 0.358 | 0.138 | 0.042 | 0.018 | 0.482 | 0.692 | 0.000 |
| Linyi | 0.033 | 0.047 | 0.028 | 0.061 | 0.008 | 0.000 | 0.001 | 0.625 | 0.693 | 0.000 |
| Longyan | 0.000 | 0.000 | 0.076 | 0.000 | 0.213 | 0.120 | 0.045 | 0.372 | 0.256 | 0.000 |
| Hai’an | 0.053 | 0.097 | 0.191 | 0.346 | 0.083 | 0.013 | 0.008 | 0.644 | 0.366 | 0.423 |
| Wuhan | 0.128 | 0.181 | 0.135 | 0.474 | 0.056 | 0.013 | 0.009 | 0.460 | 0.356 | 0.436 |
| Zhengzhou | 0.040 | 0.080 | 0.036 | 0.355 | 0.132 | 0.046 | 0.005 | 0.692 | 0.426 | 0.236 |
| Changchun | 0.060 | 0.126 | 0.010 | 0.522 | 0.304 | 0.009 | 0.002 | 0.417 | 0.870 | 0.539 |
| First-Level Indicator (Guideline Layer B) | Weight (w) | Second-Level Indicator (Sub-Guideline Layer C) | Weight (w) | Three-Level Indicator or Definitions (Element Layer D) | Weight (w) |
|---|---|---|---|---|---|
| Land–industry integration (Coordination degree and balance between internal industries and carriers of production function zones and service function zones, B1) | 0.417 | Industrial land efficiency (C11) | 0.597 | Industrial investment intensity D111 | 0.211 |
| Industrial employment density D112 | 0.183 | ||||
| density of invention patents on industrial land D113 | 0.098 | ||||
| Industrial output intensity D114 | 0.508 | ||||
| Service industry land efficiency (C12) | 0.403 | Service industry output intensity D121 | 0.512 | ||
| density of invention patents on services land D122 | 0.178 | ||||
| Services employment density D1232 | 0.31 | ||||
| Residence–industry integration (Coordination and integration of production functional areas and residential service functional areas, B2) | 0.583 | Matching degree be-tween residence and environment (C21) | 0.556 | The degree of negative correlation between residential area size and AQI | |
| Rail transit supporting facilities (C22) | 0.444 | Rail transit station per unit area |
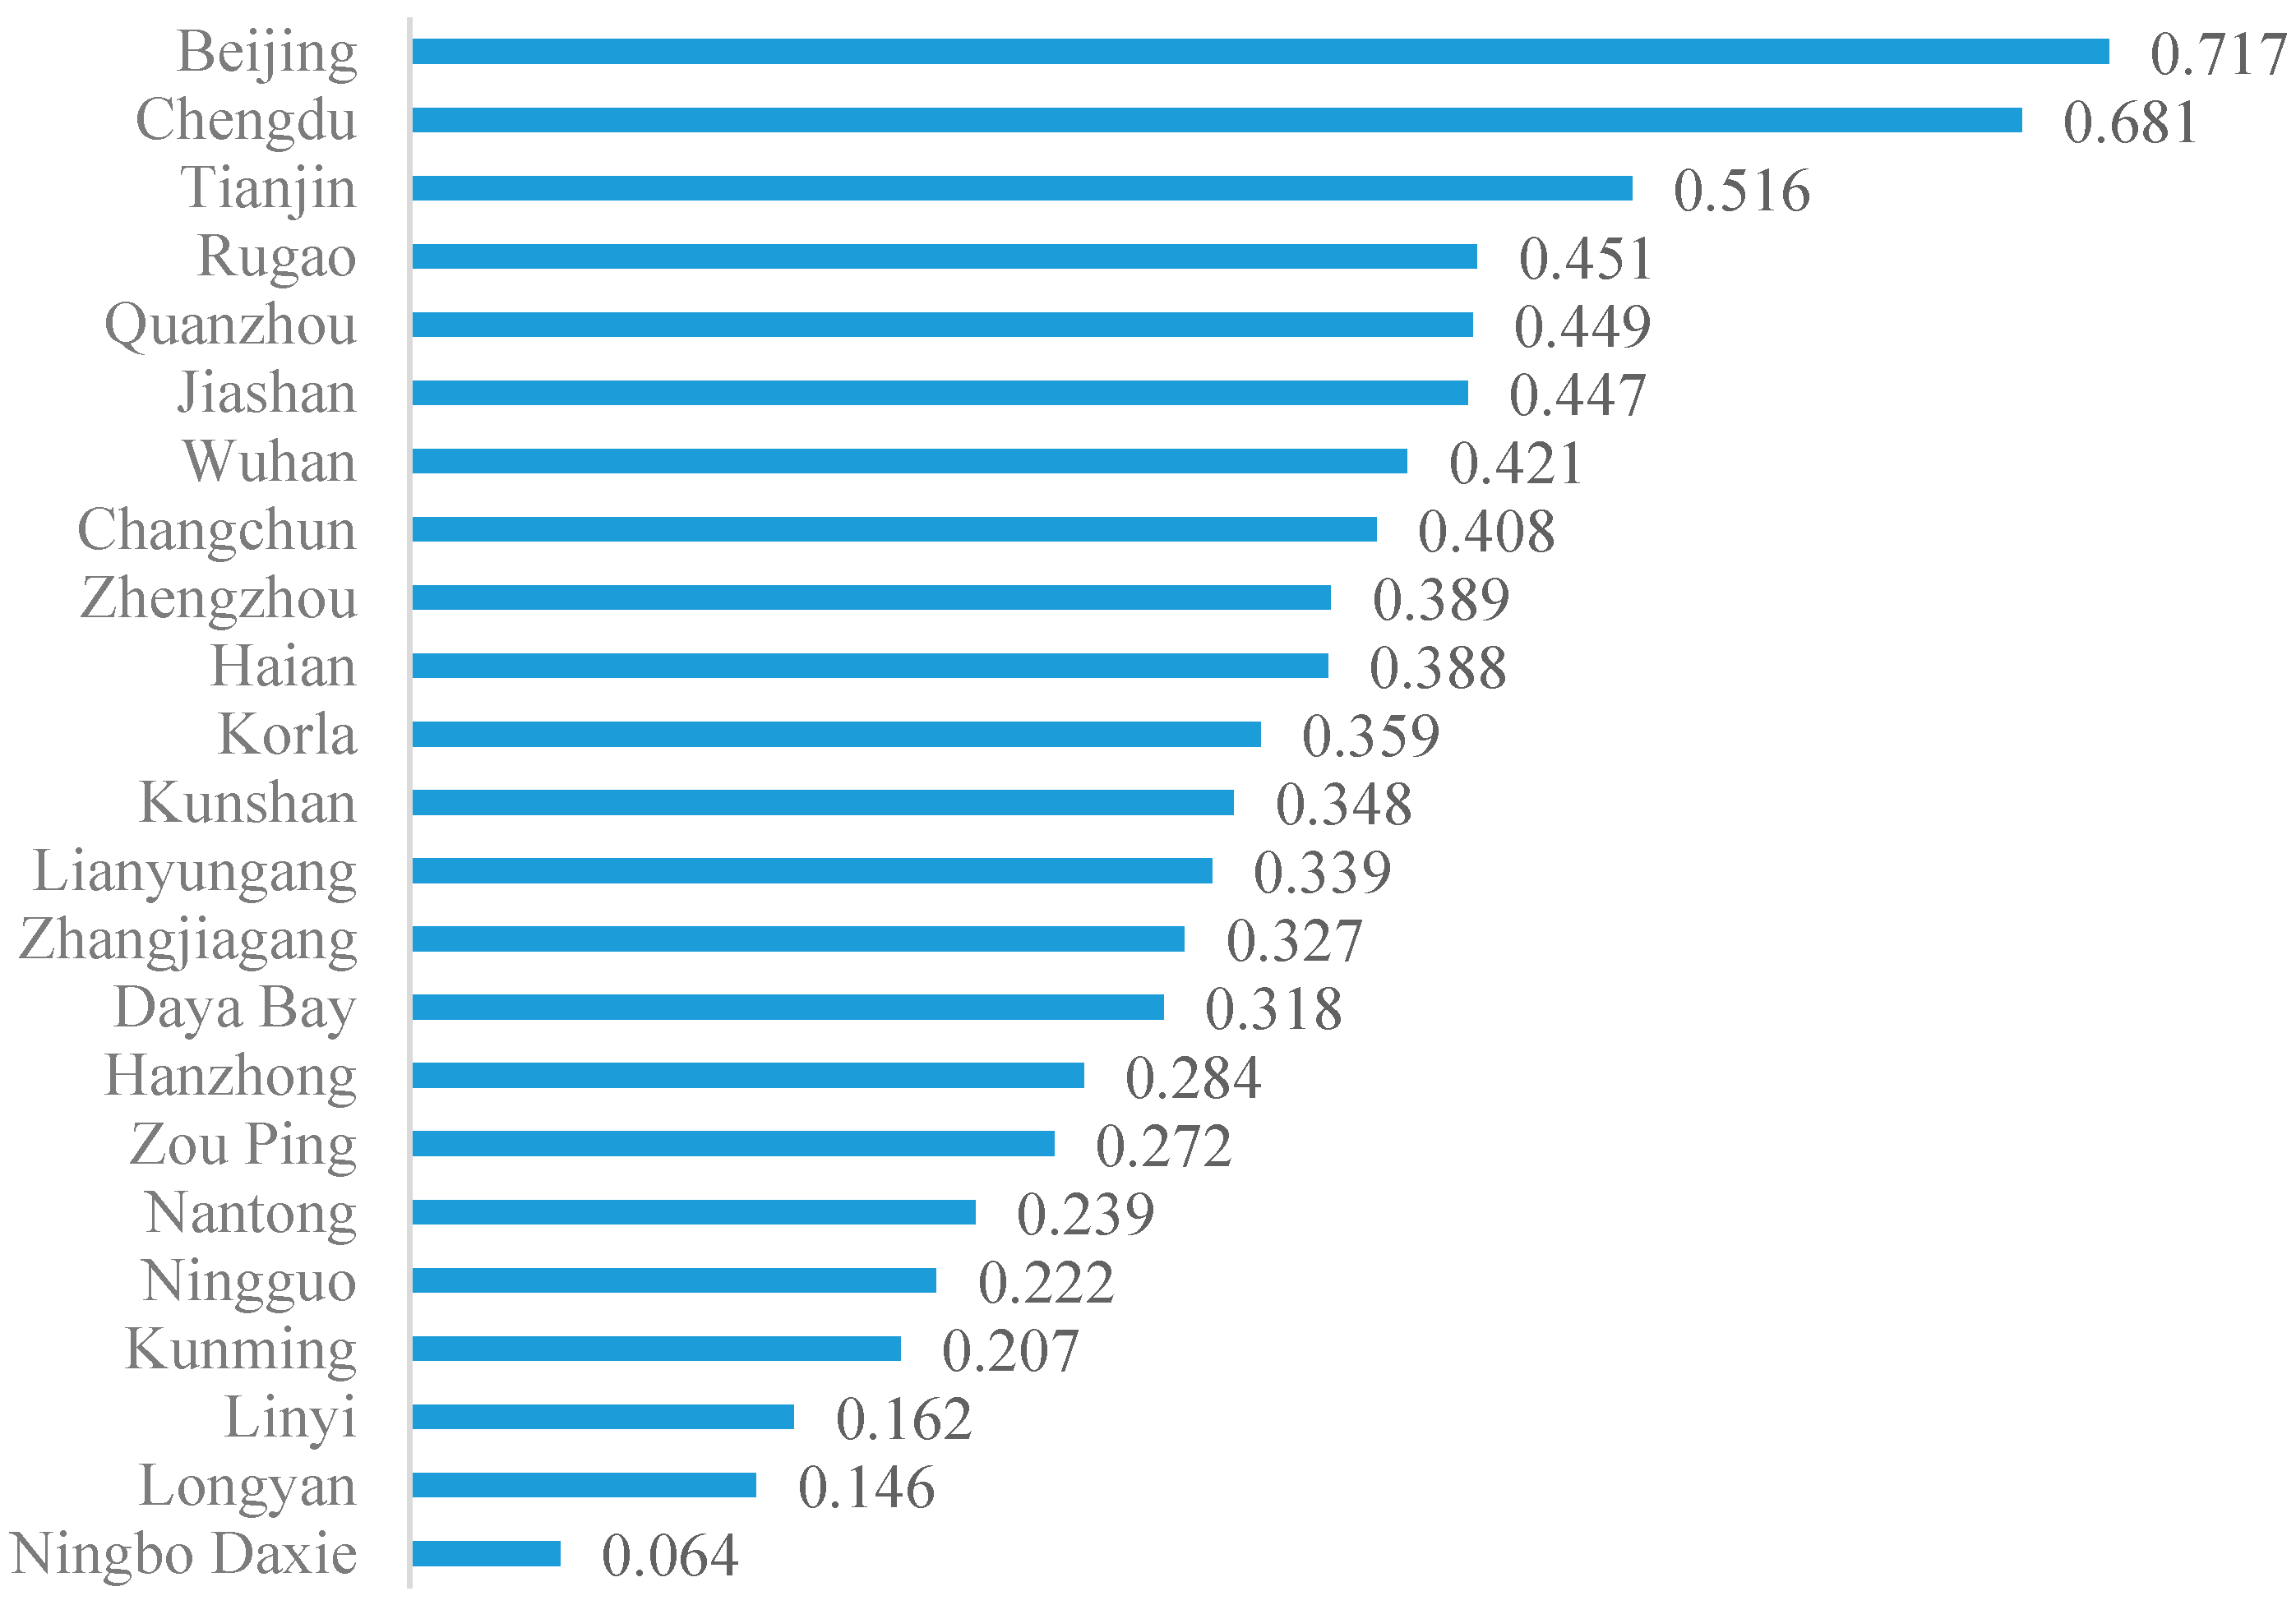
| ETDZs | Land–Industry Integration Weighted Score with Ranking | Industrial Land Efficiency Weighted Score and Ranking | Weighted Score and Ranking of Service Sector Land Use Efficiency | |||
|---|---|---|---|---|---|---|
| Beijing | 0.982 | 1 | 1.000 | 1 | 0.955 | 1 |
| Tianjin | 0.442 | 2 | 0.420 | 4 | 0.475 | 3 |
| Quanzhou | 0.438 | 3 | 0.507 | 2 | 0.336 | 5 |
| Jiashan | 0.387 | 4 | 0.278 | 12 | 0.548 | 2 |
| Rugao | 0.372 | 5 | 0.505 | 3 | 0.174 | 7 |
| Kunshan | 0.279 | 6 | 0.310 | 9 | 0.232 | 6 |
| Chengdu | 0.266 | 7 | 0.392 | 5 | 0.080 | 14 |
| Changchun | 0.244 | 8 | 0.302 | 11 | 0.159 | 8 |
| Hanzhong | 0.233 | 9 | 0.304 | 10 | 0.128 | 10 |
| Ningguo | 0.217 | 10 | 0.079 | 20 | 0.420 | 4 |
| Korla | 0.214 | 11 | 0.357 | 6 | 0.001 | 23 |
| Zhangjiagang | 0.231 | 12 | 0.328 | 7 | 0.087 | 12 |
| Wuhan | 0.201 | 13 | 0.314 | 8 | 0.034 | 20 |
| Zhengzhou | 0.157 | 14 | 0.207 | 14 | 0.083 | 13 |
| Ningbo Daxie | 0.153 | 15 | 0.190 | 15 | 0.096 | 11 |
| Hai’an | 0.153 | 16 | 0.223 | 13 | 0.048 | 17 |
| Zouping | 0.127 | 17 | 0.180 | 16 | 0.048 | 18 |
| Kunming | 0.097 | 18 | 0.119 | 17 | 0.063 | 15 |
| Nantong | 0.090 | 19 | 0.117 | 18 | 0.052 | 16 |
| Daya Bay | 0.069 | 20 | 0.090 | 19 | 0.036 | 19 |
| Longyan | 0.067 | 21 | 0.007 | 23 | 0.154 | 9 |
| Lianyungang | 0.054 | 22 | 0.073 | 21 | 0.027 | 21 |
| Linyi | 0.031 | 23 | 0.049 | 22 | 0.005 | 22 |
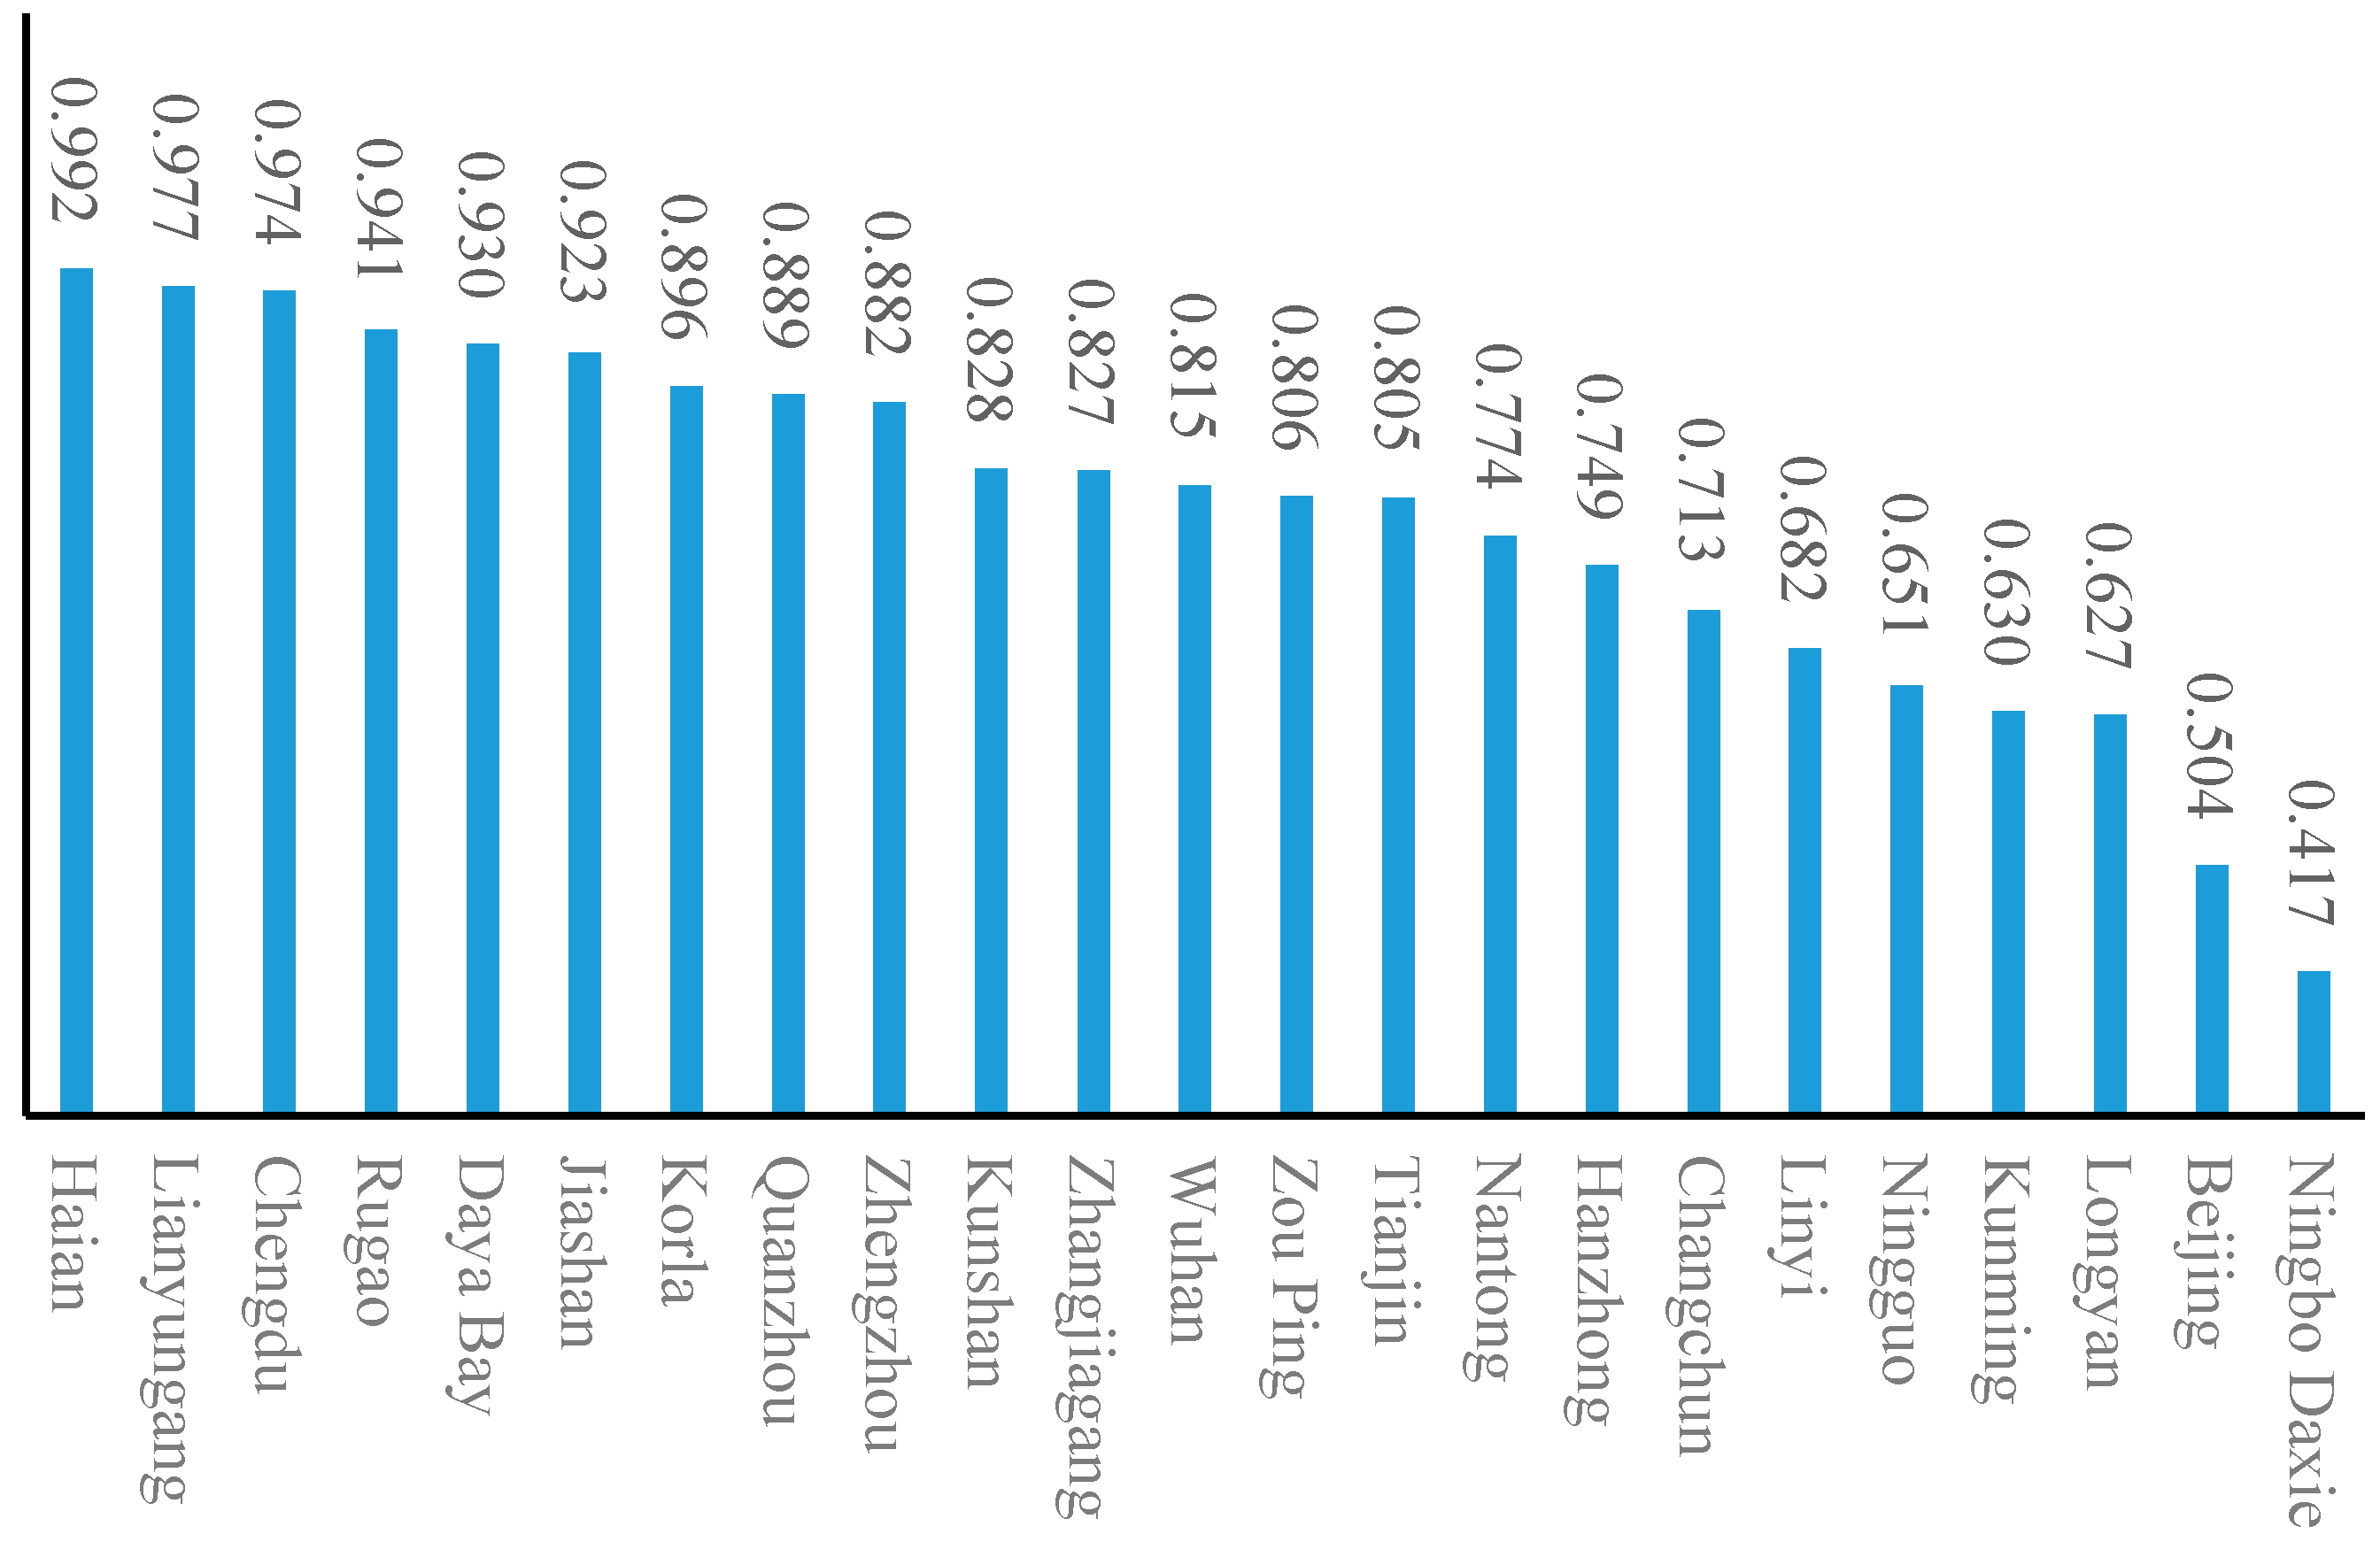
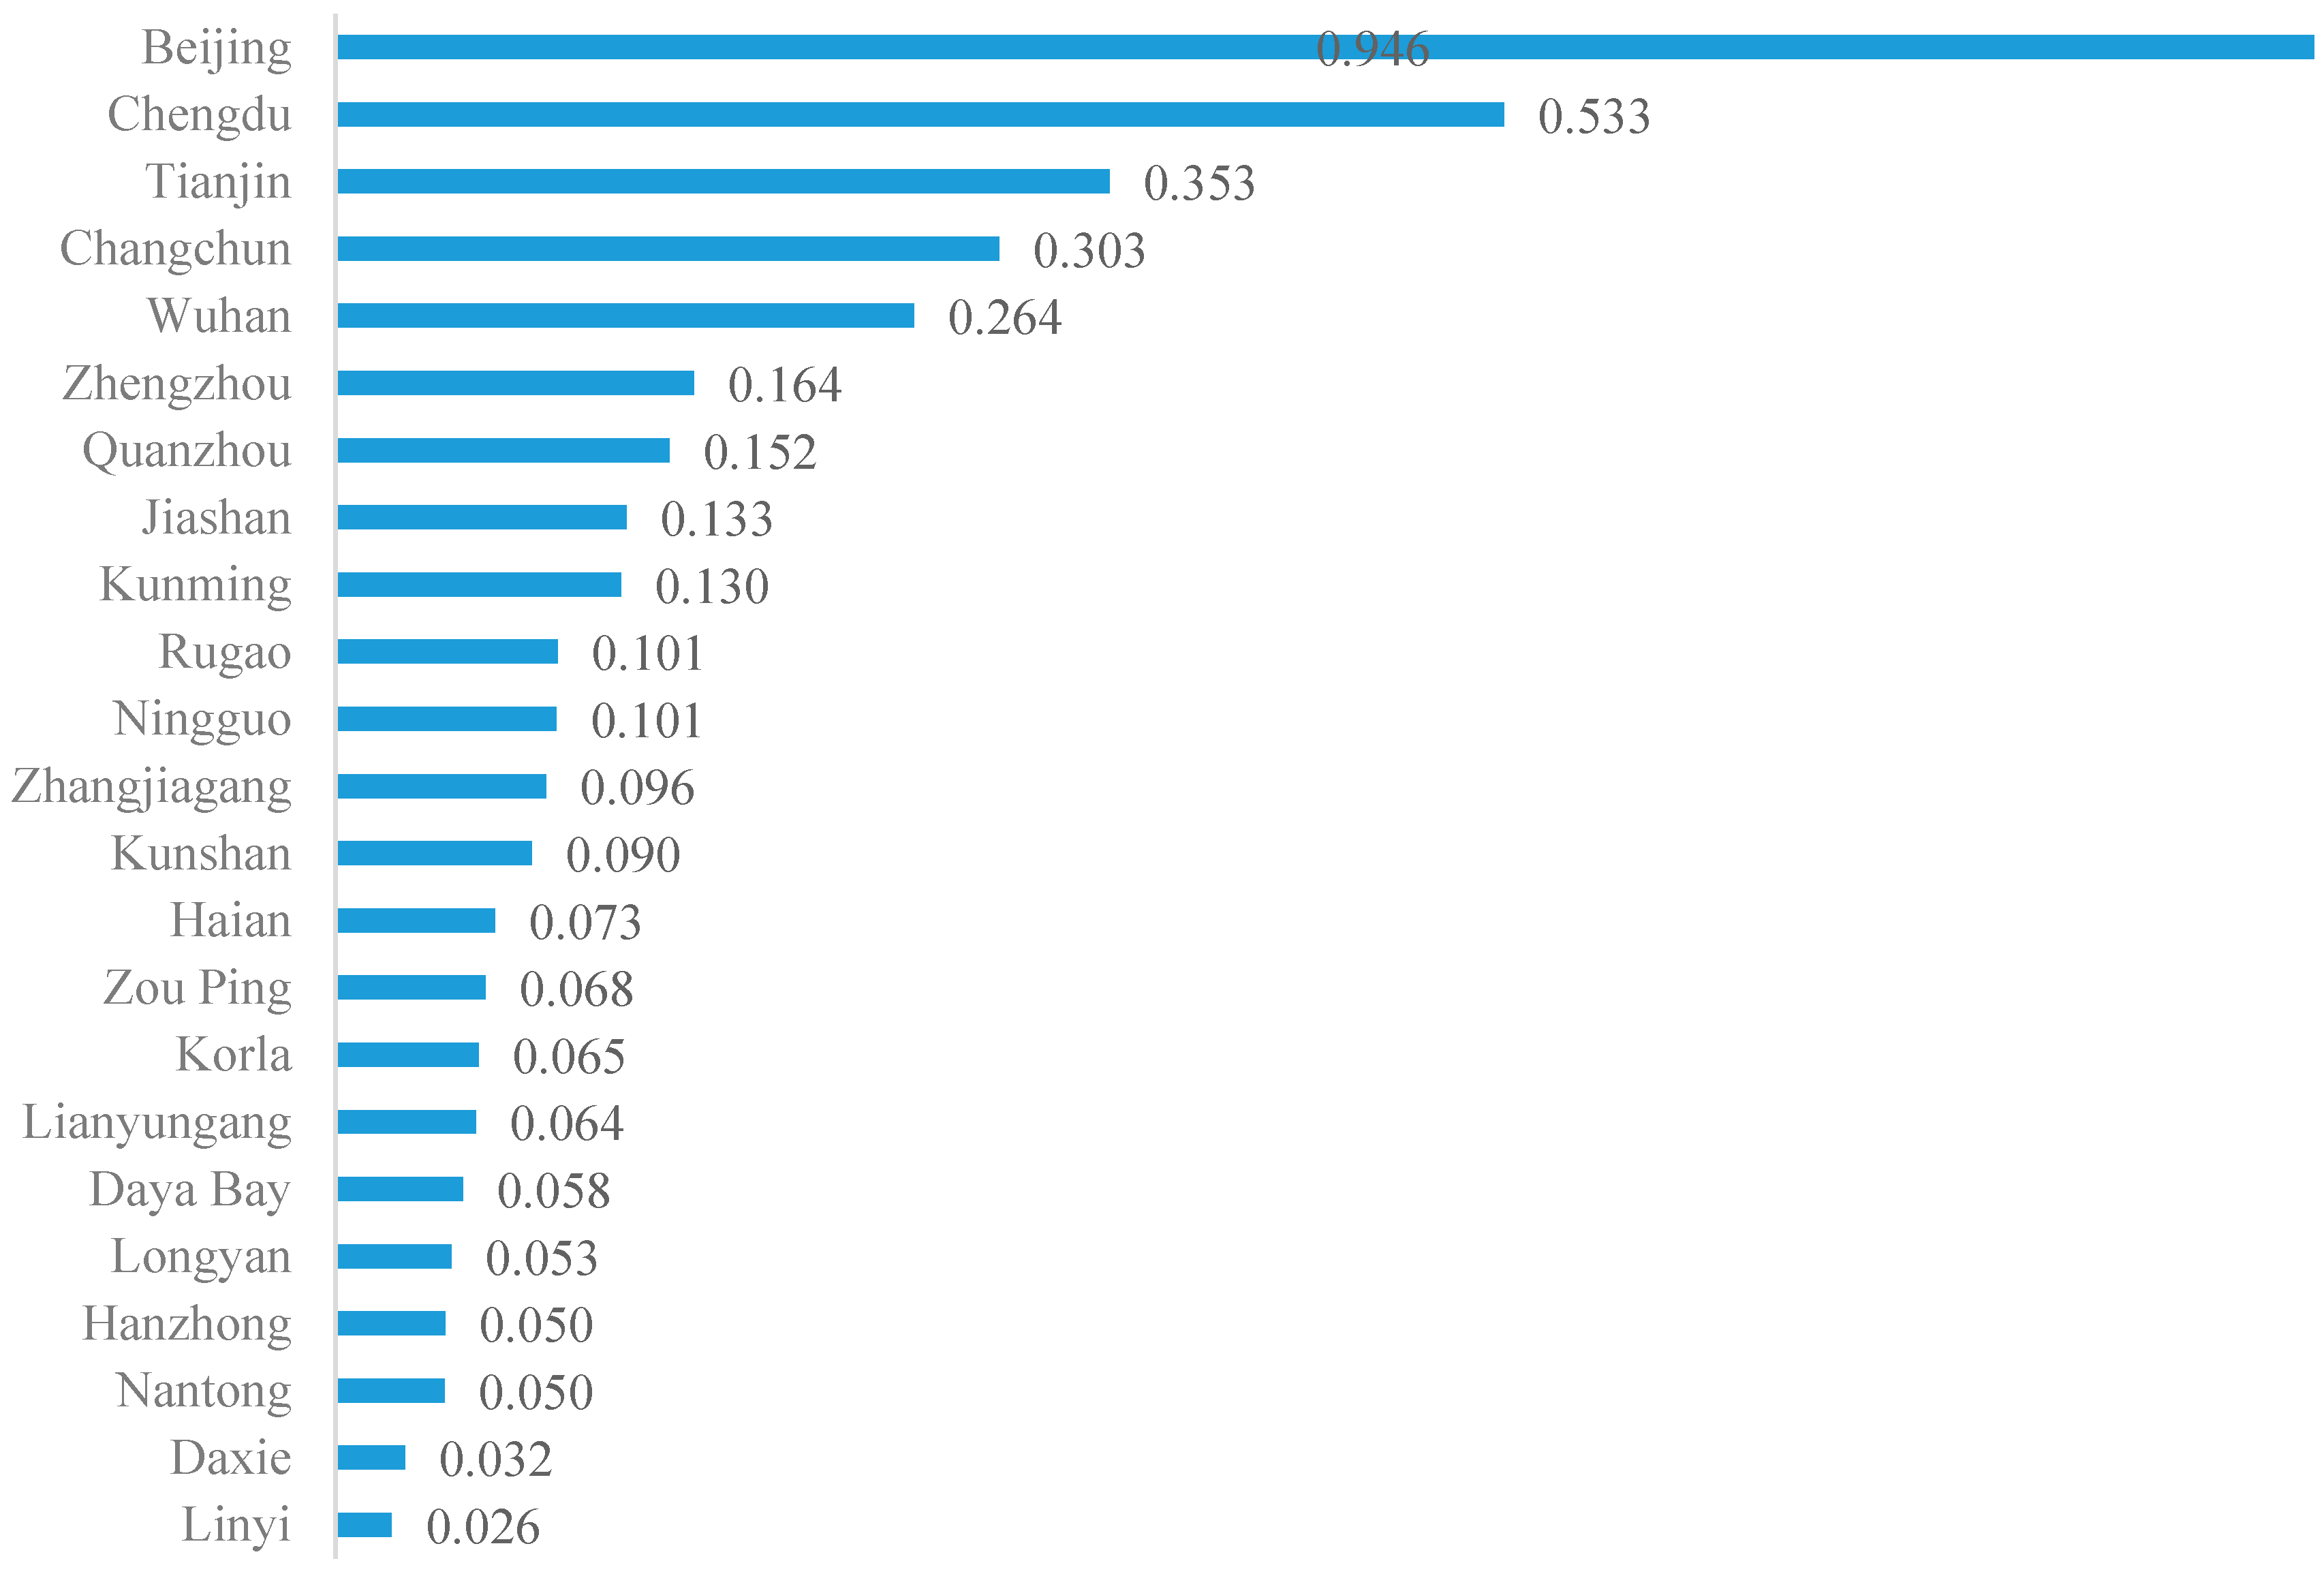
| ETDZs | Weighted Score and Ranking for Residence–Industry Integration | Match Degree between Residence and Environment and Ranking | Standardized Scores and Rankings of Rail Transit Stations per Unit Area | |||
|---|---|---|---|---|---|---|
| Chengdu | 0.978 | 1 | 0.971 | 3 | 0.987 | 2 |
| Wuhan | 0.579 | 2 | 0.694 | 12 | 0.436 | 5 |
| Tianjin | 0.570 | 3 | 0.677 | 14 | 0.437 | 4 |
| Hai’an | 0.556 | 4 | 1.000 | 1 | 0 | 8 |
| Zhengzhou | 0.554 | 5 | 0.809 | 9 | 0.236 | 6 |
| Lianyungang | 0.543 | 6 | 0.978 | 2 | 0 | 8 |
| Beijing | 0.529 | 7 | 0.151 | 22 | 1.000 | 1 |
| Changchun | 0.525 | 8 | 0.514 | 17 | 0.539 | 3 |
| Rugao | 0.509 | 9 | 0.916 | 4 | 0 | 8 |
| Daya Bay | 0.497 | 10 | 0.894 | 5 | 0 | 8 |
| Jiashan | 0.491 | 11 | 0.884 | 6 | 0 | 8 |
| Korla | 0.465 | 12 | 0.837 | 7 | 0 | 8 |
| Quanzhou | 0.458 | 13 | 0.824 | 8 | 0 | 8 |
| Kunshan | 0.397 | 14 | 0.715 | 10 | 0 | 8 |
| Zhangjiagang | 0.396 | 15 | 0.712 | 11 | 0 | 8 |
| Zouping | 0.377 | 16 | 0.678 | 13 | 0 | 8 |
| Nantong | 0.346 | 17 | 0.622 | 15 | 0 | 8 |
| Hanzhong | 0.320 | 18 | 0.577 | 16 | 0 | 8 |
| Kunming | 0.285 | 19 | 0.370 | 20 | 0.180 | 7 |
| Linyi | 0.255 | 20 | 0.459 | 18 | 0 | 8 |
| Ningguo | 0.226 | 21 | 0.408 | 19 | 0 | 8 |
| Longyan | 0.204 | 22 | 0.366 | 21 | 0 | 8 |
| Ningbo Daxie | 0 | 23 | 0 | 23 | 0 | 8 |
| First-Level Indicator | Entropy Weight (w) | Second-Level Indicator | Entropy Weight (w) | Three-Level Indicator or Interpretations | Entropy Weight (w) |
|---|---|---|---|---|---|
| Land–industry integration | 0.577 | Industrial land efficiency | 0.373 | Industrial investment intensity, | 0.313 |
| Industrial employment density | 0.248 | ||||
| Density of invention patents on industrial land | 0.329 | ||||
| Industrial output intensity | 0.111 | ||||
| Service industry land efficiency | 0.627 | Service industry output intensity | 0.142 | ||
| Density of invention patents on industrial land | 0.549 | ||||
| Services employment density | 0.309 | ||||
| Residence–industry integration | 0.423 | Matching degree be-tween residence and environment | 0.1 | The degree of negative correlation between residential area size and AQI | |
| Rail transit supporting facilities | 0.9 | Rail transit station per unit area |
| Industrial Technology Level | Green Manufacturing Maturity | Negative Externality | Service Sector Development | Residential Area Ratio | Residential Land Area per Capita | Density of Rail Transit Stations | |
|---|---|---|---|---|---|---|---|
| Beijing | extremely high | extremely high | extremely low | high | medium to high | medium to low | high |
| Chengdu | medium | medium to high | medium to low | medium | medium to high | medium to high | high |
Disclaimer/Publisher’s Note: The statements, opinions and data contained in all publications are solely those of the individual author(s) and contributor(s) and not of MDPI and/or the editor(s). MDPI and/or the editor(s) disclaim responsibility for any injury to people or property resulting from any ideas, methods, instructions or products referred to in the content. |
© 2024 by the authors. Licensee MDPI, Basel, Switzerland. This article is an open access article distributed under the terms and conditions of the Creative Commons Attribution (CC BY) license (https://creativecommons.org/licenses/by/4.0/).
Share and Cite
Xu, M.; Luo, Y.; Li, D. Research on Evaluation of City–Industry Integration in Industrial Parks. Sustainability 2024, 16, 6906. https://doi.org/10.3390/su16166906
Xu M, Luo Y, Li D. Research on Evaluation of City–Industry Integration in Industrial Parks. Sustainability. 2024; 16(16):6906. https://doi.org/10.3390/su16166906
Chicago/Turabian StyleXu, Mingqiang, Yaoyao Luo, and Dingyao Li. 2024. "Research on Evaluation of City–Industry Integration in Industrial Parks" Sustainability 16, no. 16: 6906. https://doi.org/10.3390/su16166906
APA StyleXu, M., Luo, Y., & Li, D. (2024). Research on Evaluation of City–Industry Integration in Industrial Parks. Sustainability, 16(16), 6906. https://doi.org/10.3390/su16166906