Article

Exploring Factors Influencing Consumers’ Willingness to Pay Healthy-Labeled Foods at a Premium Price

1
Department of Agricultural Economics, Ferdowsi University of Mashhad, Mashhad 9177948974, Iran
2
Department of Economic and Legal Studies, Parthenope University of Naples, 80132 Naples, Italy
*
Authors to whom correspondence should be addressed.
Sustainability 2024, 16(16), 6895; https://doi.org/10.3390/su16166895
Submission received: 10 July 2024 / Revised: 6 August 2024 / Accepted: 9 August 2024 / Published: 11 August 2024
(This article belongs to the Section Sustainable Food)

Abstract

:
Food safety in developing countries has always been a concern, and deciding to purchase foods with a healthy label can be challenging. The goal of this study was to investigate the behavior of consumers for healthy foods by evaluating the factors influencing the prevalence of purchasing them despite having to pay a premium. Required data were collected in 2022 from 359 households in Mashhad, Iran, through an online questionnaire. A Generalized Poisson model was employed for analysis and the results indicate that the consumer’s field of study, the importance of food shape and size, the importance of food healthiness, the level of government supervision, practicing the 5Rs, awareness of the harmful effects of fast food on health (1% level) and variables of trust in a brand of healthy food, and the level of knowledge about the harmful effects of chemical fertilizers and toxins on human health (10% level) have a direct and significant relationship with consumers’ willingness to purchase more healthy foods for which they are willing to pay a premium. On the other hand, the relationship of some other factors, such as the importance of food price (1% level) and household size, household expenses, presence of individuals over 60 years old in the household, and the importance of food taste and flavor (5% level) became negative and significant. Therefore, to promote the consumption of foods with a healthy label for the purpose of reducing environmental issues and human health problems, it is recommended to produce and offer various healthy foods, create local markets, provide discounts and economic incentives to the public, and use attractive packaging with accurate and readable labels.

Graphical Abstract

1. Introduction

The health and environmental effects of pesticides, genetically modified organisms, and other non-natural substances used in agricultural production have spurred consumers’ interest in healthy foods [1]. This, in turn, has led to a shift in consumers’ shopping styles worldwide. Consumers have become aware that consuming healthy foods and products is key to maintaining their health [2], resulting in significant changes in their purchasing habits [3]. This awareness stems from concerns about health and the rise in diseases associated with the consumption of unhealthy foods and products, such as obesity, diabetes, hypertension, cardiovascular diseases, and so on [4,5,6]. Today, the primary concern in the food and agriculture sector is simultaneously ensuring adequate and high-quality food to meet the nutritional needs of the growing population and preserving natural resources for future generations [7]. Consequently, efforts are being made to replace conventionally made foods with healthy-labeled foods. Since fewer toxins, pesticides, and fertilizers are utilized in the production process of healthy-labeled materials, these foods contribute to improved public health and hygiene and impose fewer environmental threats. Moreover, their production is simpler, easier, and more accessible compared to organic products [8,9] and the price consumers pay for these products must correspond to their quality and benefits [10].
In the foreseeable future, the global market will place significant emphasis on the production and supply of healthy and organic food products, especially in the garden products sector [11]. However, in developing nations like Iran, despite possessing considerable potential and resources such as diverse climates, a wide array of agricultural and livestock products, and a rich historical heritage in food traditions [12,13], the area under organic cultivation has decreased to 7053 hectares in 2022, indicating a 40% reduction compared to 2021. Consequently, the healthy and organic agriculture sector constitutes only a small portion of agriculture [11]. Additionally, the measures taken to guide and support producers and consumers of these food products within the country have been insufficient, resulting in a lack of public awareness and attention to the advantages of these food types [14]. One of the basic and important approaches to the development of the consumption market of healthy foods is to understand consumer behavior in line with the development of healthy agriculture because one of the main obstacles and limitations to increasing the volume of healthy foods is the unwillingness of customers to buy and consume these foods, which leads to farmers considering the production of healthy foods a risk and not having much desire to produce these foods [11]. In addition, evaluating consumers’ willingness to pay a premium for environmentally friendly and healthy foods, which come at a higher price compared to conventional foods, is essential for determining the feasibility of producing these foods [15]. Therefore, investigating consumers’ behavior and identifying the influential factors in choosing food products with a healthy label at a premium in Mashhad, the second-largest and most highly populated city in Iran, is crucial. In recent years, there has been an alarming increase in diet-related diseases, such as cardiovascular diseases, cancers, respiratory diseases, and neurological disorders, within this city [13]. This underscores the critical importance of research to address the urgent public health concerns related to these conditions, particularly given the current unfamiliarity among consumers with healthy foods [16].
Many studies have examined various influential factors on consumers’ purchasing behavior. Some of these factors are related to food characteristics and others result from consumers themselves, such as economic and social factors [17,18,19]. For example, Alberto de Morais Watanabe et al. (2023) [20], Van der Stricht et al. (2023) [21], Britwum et al. (2021) [22], and Van Loo et al. (2011) [23] considered environmental and organic labels as influential factors in the willingness to pay a premium for the purchase of organic and environmentally friendly products. Alsubhi et al. (2022) [24] and Misra and Singh (2016) [25] indicated that consumers aiming for a healthier lifestyle are more willing to pay higher prices for healthy and organic foods. The studies by Chowdhury et al. (2021) [26], Wang et al. (2019) [27], and Krystallis and Chryssohoidis (2005) [28] showed that quality, security, and trust in food and products are factors influencing the willingness to pay a premium. Arora et al. (2022) [29], Nandi et al. (2017) [30], and Boccia and Sarno (2013) [31] listed the price of the food as one of the main factors affecting the purchase of organic food products. Lan and Truong (2023) [32], Vapa-Tankosić et al. (2018) [33], and Bryła (2016) [34] stated that environmental concerns and individuals’ health concerns are factors influencing the higher payment for safe vegetables and organic foods. In the study conducted by Miquel Vidal and Castellano-Tejedor (2022) [35], product price and the price-quality ratio were identified as two influential factors affecting consumers’ perception of product healthiness. Yang et al. (2020) [36] examined consumer willingness to pay for Arctic food products and found that attributes such as origin, certification, production method, and price significantly influence consumers’ willingness to pay. The study conducted by Velčovská and Del Chiappa (2015) [37] demonstrated that consumers are willing to pay a higher price for products labeled with quality. However, reasons preventing individuals from purchasing foods labeled as quality include lack of information, distrust, and unawareness (or insufficient awareness) of quality labels.
Research conducted so far has mainly focused on consumers’ preferences for healthy foods in general and specific items. However, the aspect of diversity in healthy food choices across various food categories such as vegetables, fruits, greens, grains, dried fruits, and spices, each with unique nutritional values and price and consumed at different meals, has often been overlooked. This is where awareness of consumer preferences regarding the variety of foods labeled as healthy in the conventional daily diet can be effective for policymakers and stakeholders in the health and food production sectors to make informed decisions and guide agricultural production activities, as well as in modifying dietary consumption patterns and consumer preferences. To fill this gap, the present study does not limit itself to one or a few specific foods and adopts a distinctive approach by examining the factors affecting the willingness to pay a premium for the number of foods that hold significant importance in household food baskets, as well as the extent of price increase each consumer is willing to pay for each healthy food.

2. Materials and Methods

2.1. Study Area

This study has occurred in Mashhad, the capital of Razavi Khorasan province. Mashhad is a metropolis in northeastern Iran with an area of 351 km2 [38] and a population of 3,619,800 in 2021, the second-largest and most populous city in Iran [39].

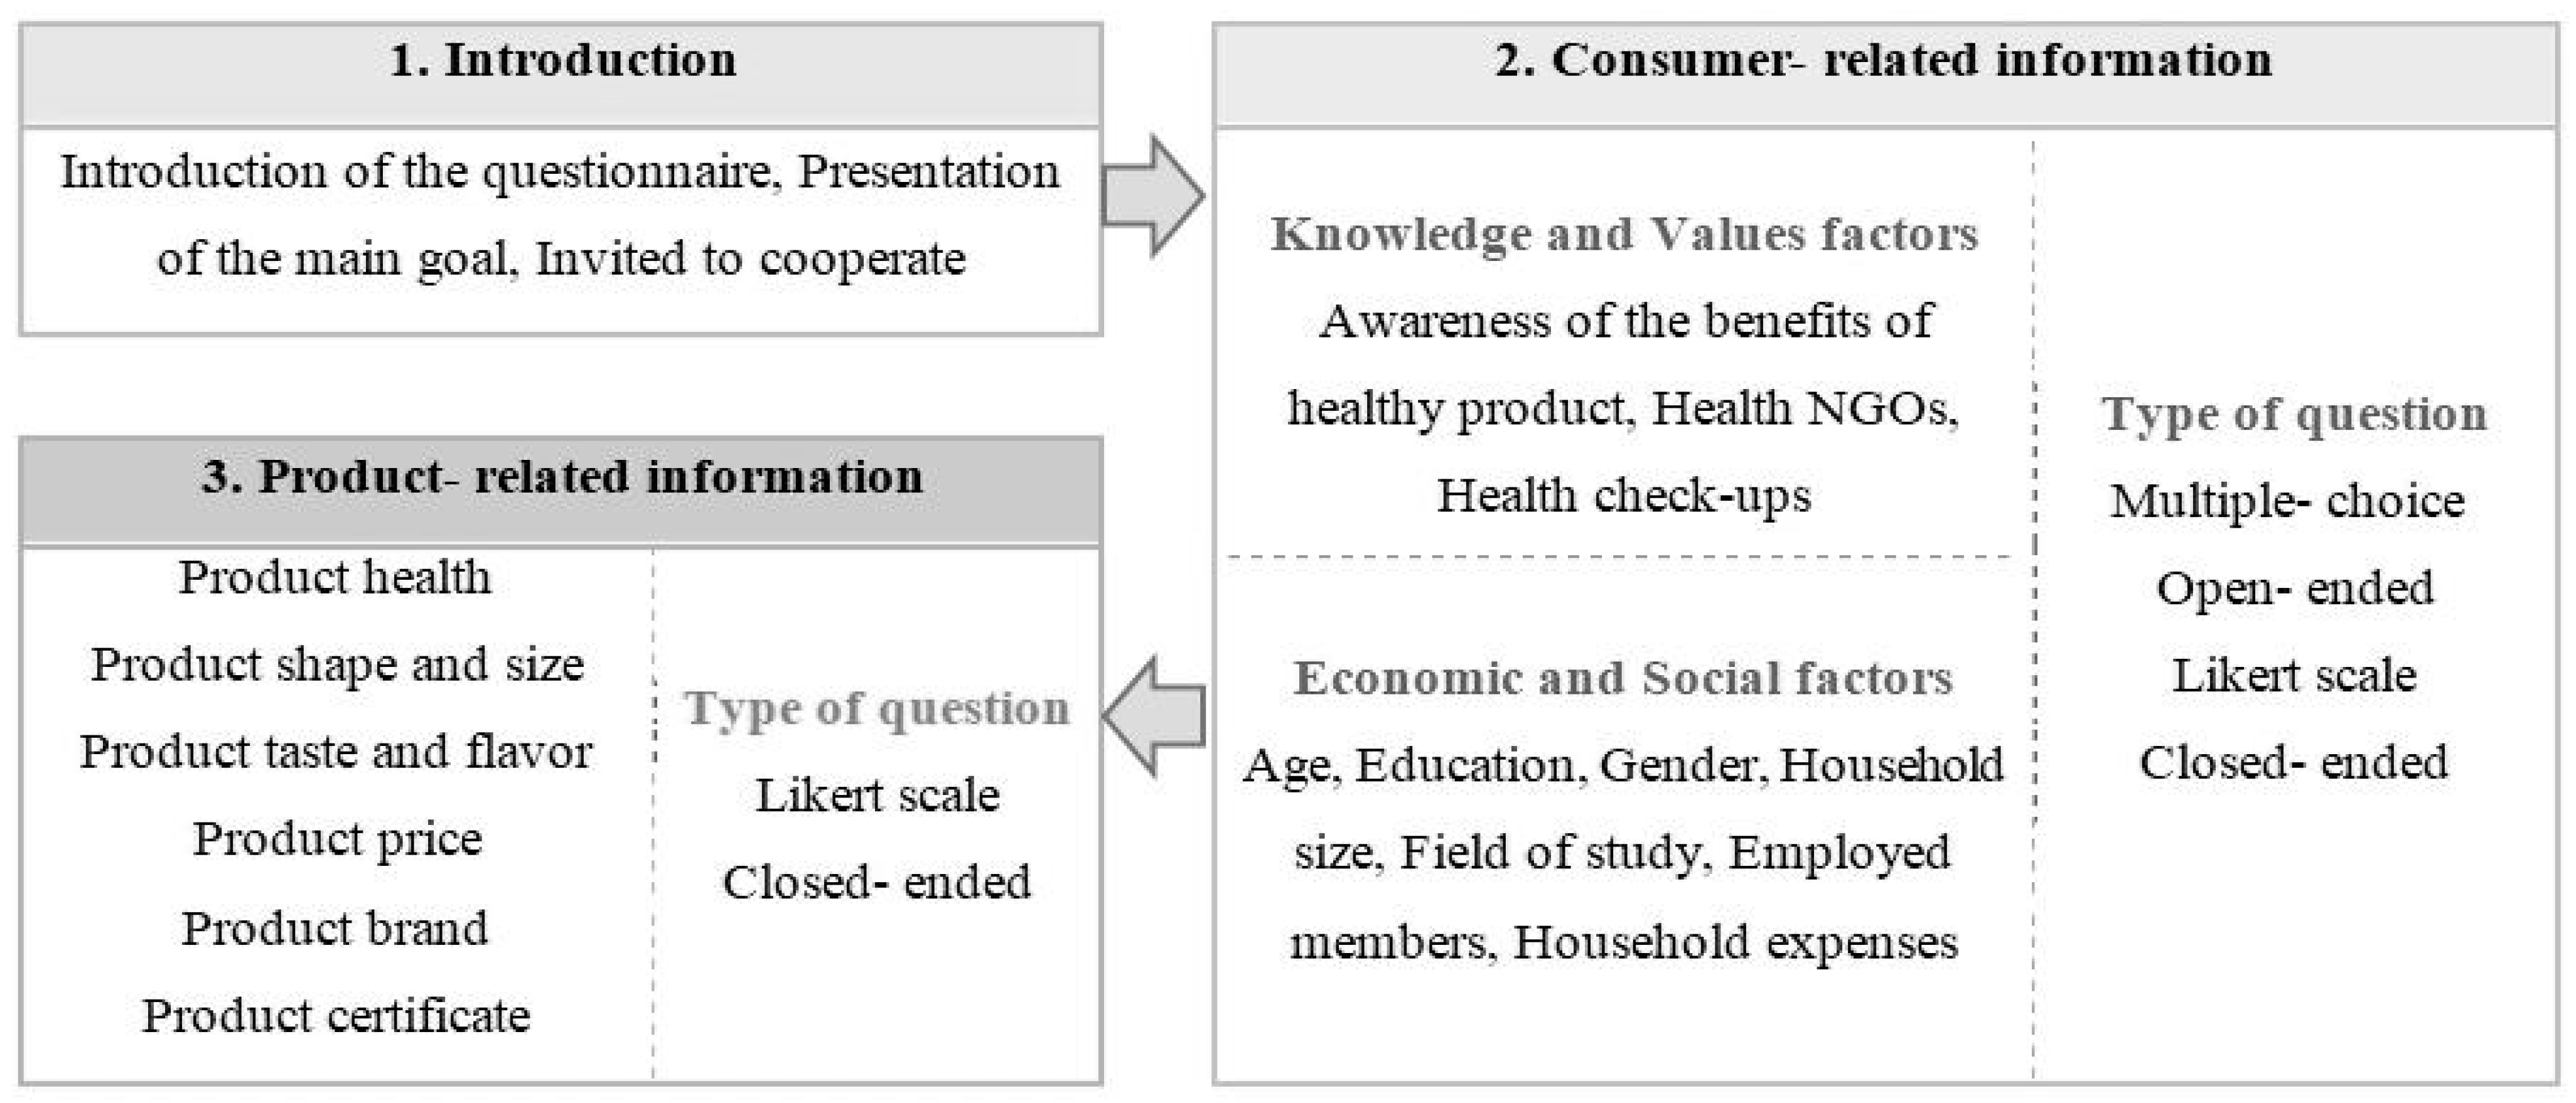
2.2. Data Collection
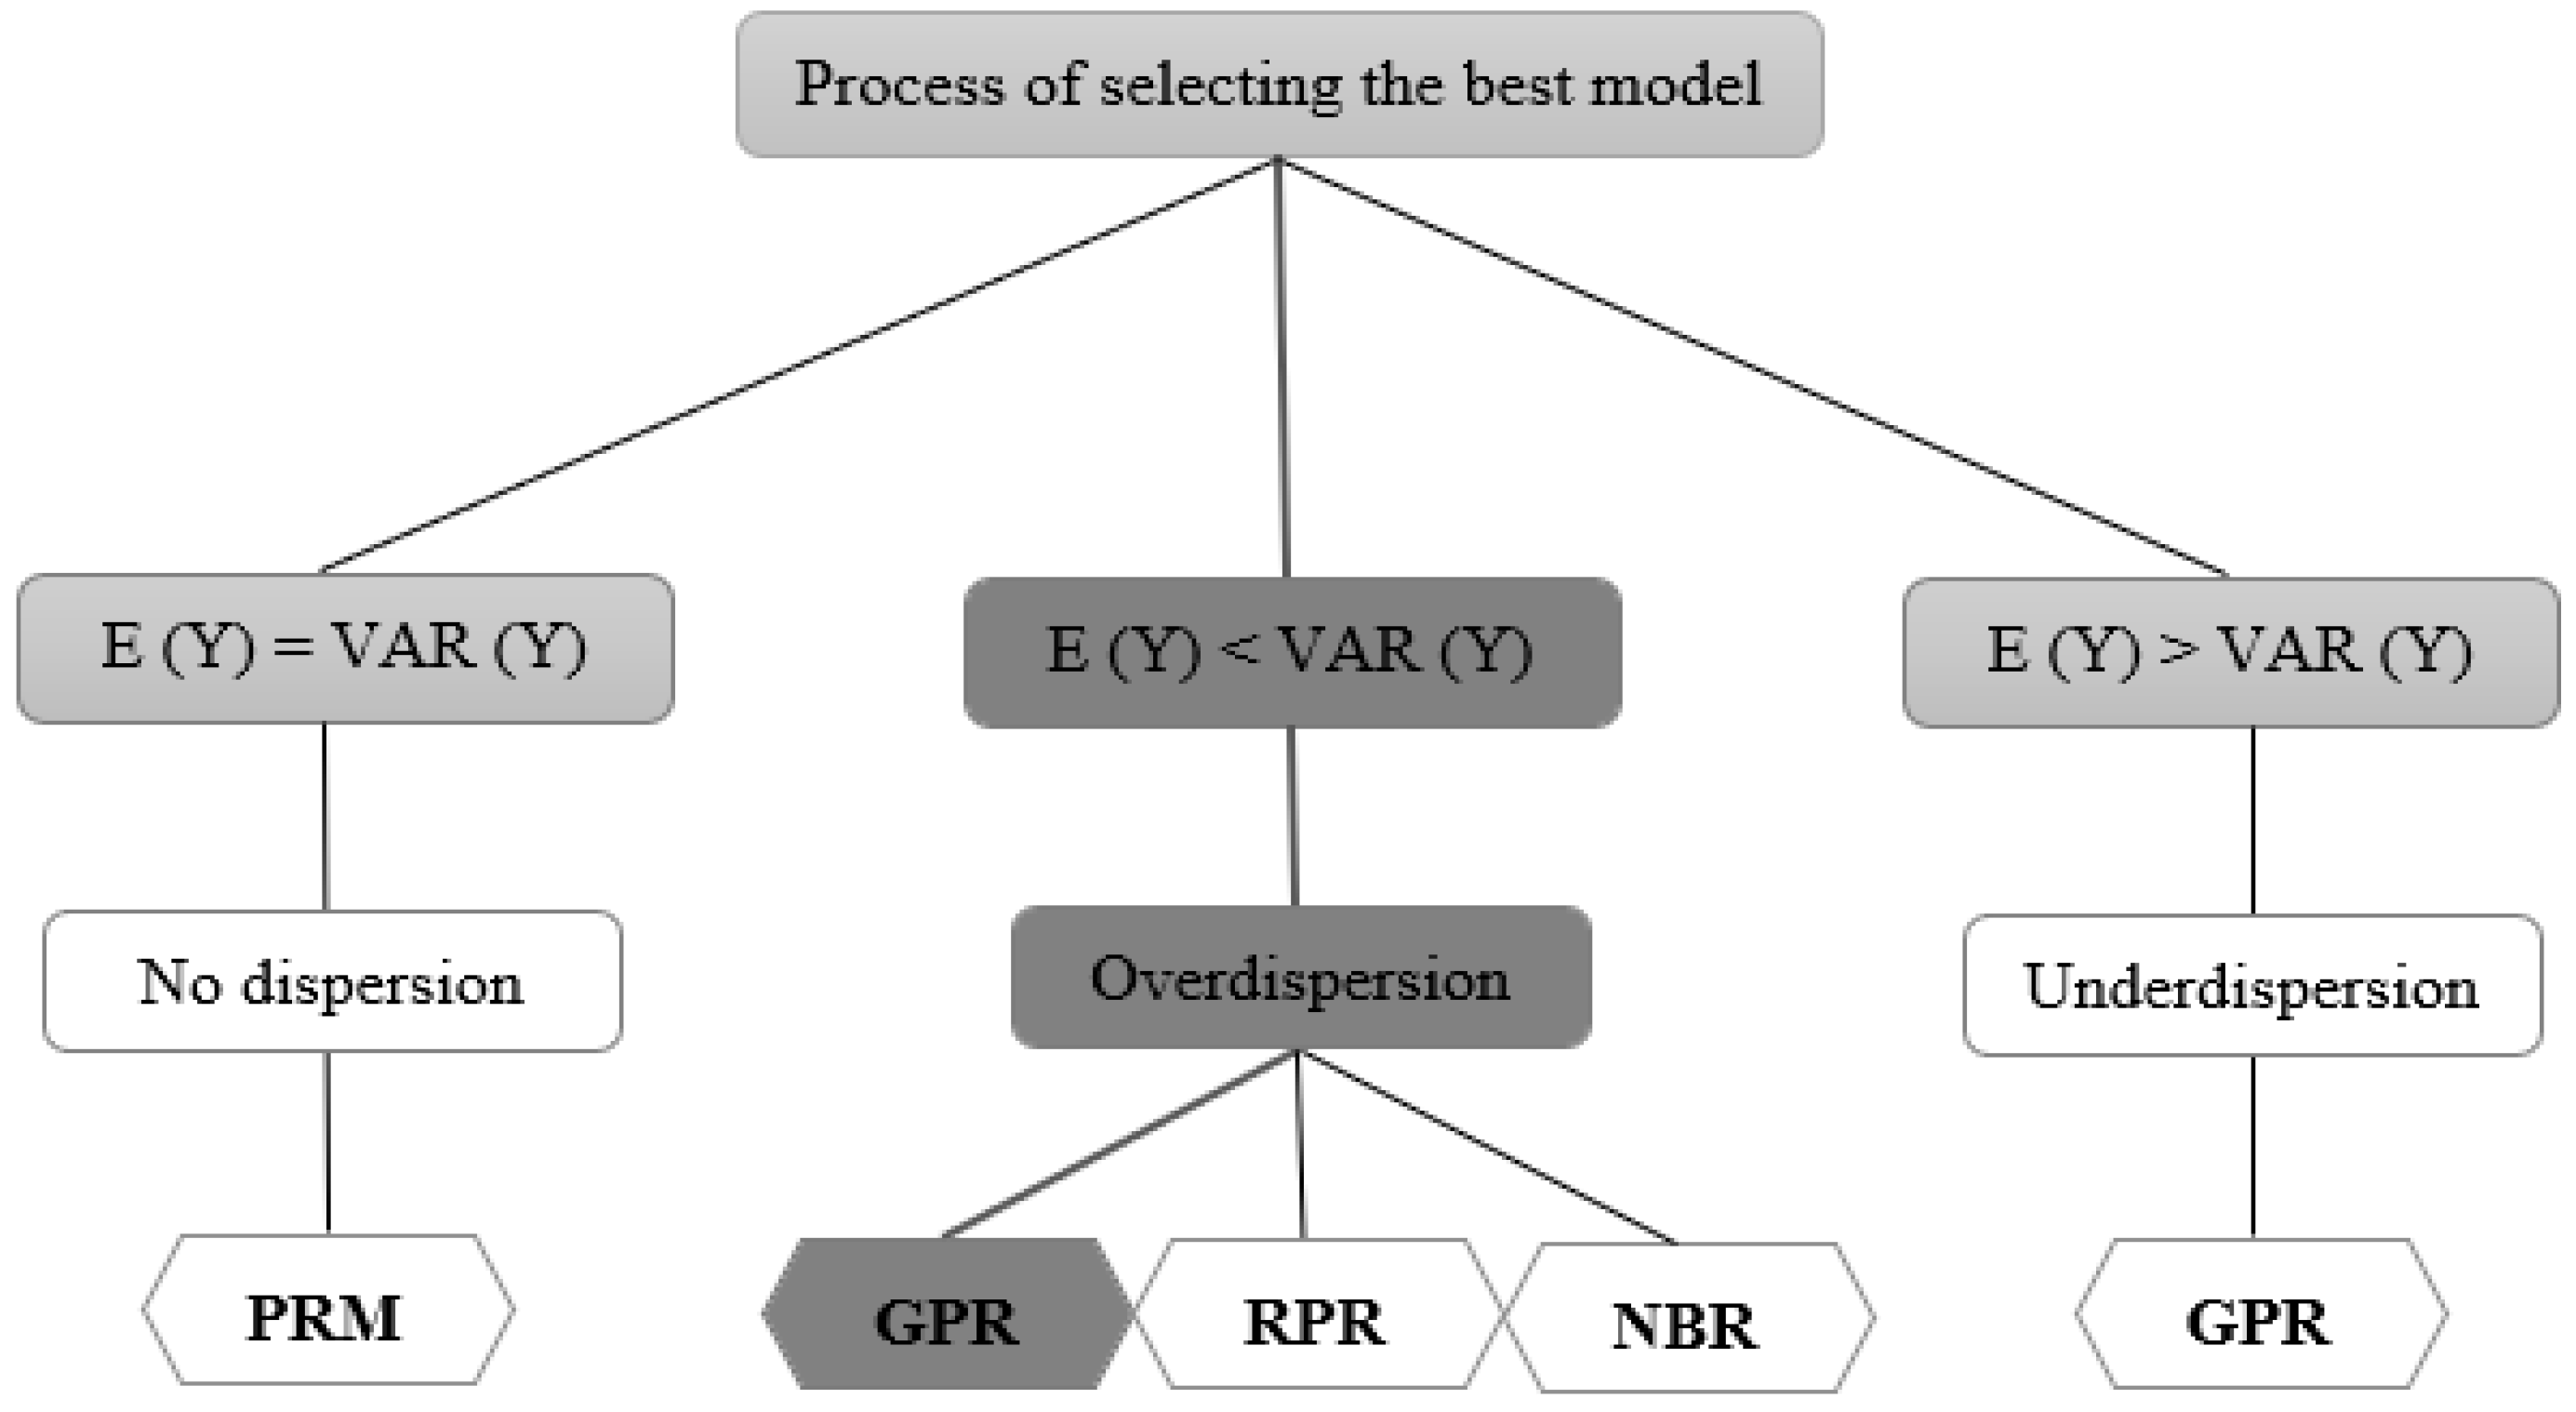
The required data for this research were gathered through an online questionnaire in Mashhad in 2022. The questionnaire link was randomly distributed to 804 households via social media and electronic platforms such as Instagram, WhatsApp, and email. A total of 359 participants voluntarily completed the questionnaire (a response rate of 44.7%) and policies were implemented to prevent numerous submissions. Before completion, the validity of the questionnaires was assessed, and their reliability was confirmed using Cronbach’s alpha. The randomization process aimed to minimize selection bias and ensure that each household had an equal chance of being included, thereby enhancing the validity and generalizability of the study’s findings.
Figure 1 illustrates the overall structure of the questionnaire, which consists of different parts. To achieve the research aims, 118 questions with different types considered the effect of socio-psychological, economic, attitudinal, and moral factors on the choices of consumers regarding the purchase of healthy foods. The required time to complete the questionnaire was between 25 and 30 min.

2.3. Count Models

Count models were used to analyze the number of times an event occurs within a fixed period or area. As mentioned before, the aim of this research was to focus on the number of healthy foods that consumers are willing to purchase at a premium. Therefore, considering the discrete and non-negative integers for counting healthy foods, count models were used in this study which arise from counting rather than ranking [40,41,42,43,44]. Counting data usually do not have a normal distribution, so statistical methods based on normal distribution are not suitable for analyzing such data, and in this case, it is more appropriate to use generalized models [45,46]. Among the count models, the following were considered.

2.3.1. Poisson Regression Model (PRM)

Linear regression is not suitable for estimating count data. For a random variable Y representing counts, the Poisson model is a common approach for analysis. In this model, which is appropriate when the values take on non-negative integer values y = 0, 1, 2, …, the Poisson distribution with parameter μ is used [47,48]
Pr = Y = y e μ i μ y i y i ! y i = 0 , 1 , 2 ,  
when I ? > 0 . In this model, the response variable ( y i ) indicates the number of events in a period of time or the incidence rate ratio (IRR). That is, its equation is equal to:
ln Y ^ i = X i T I 2
where X i is a vector of independent variables and β is a vector of the model parameters [49]. One important feature of this model is the equality of mean and variance E (Y) = VAR (Y) = μ [50]. In the Poisson model, if the condition of equal mean and variance is not met when the expected variance is greater than the expected mean, it leads to overdispersion, and when the variance is smaller than the mean, it results in underdispersion. In such cases, the Poisson model may not be suitable and can lead to incorrect inferences about model parameters [51]. Incorrect standard errors and smaller prediction intervals can result from overdispersion. The main reasons for overdispersion may include heterogeneity in the sample, a high number of zeros in the data, lack of consideration of important variables in regression, and correlation between responses [52,53].
In the case of overdispersion, models of Negative Binomial, Generalized Poisson, and Robust Poisson are used, and in the case of underdispersion, a Generalized Poisson model is used [54].

2.3.2. Negative Binomial Regression (NBR)

The most common model for estimating count data with the feature of overdispersion is the Negative Binomial model [2,55,56], which is defined as follows:
P r Y i = y i = Γ y + 1 α Γ y + 1 Γ 1 α ( 1 1 + μ α ) 1 α ( 1 1 + μ α ) y i  
where E ( Y i ) = I ? i is the mean and Var ( Y i ) = μ ( 1 + μ α ) is the variance of the Negative Binomial model. Therefore, the amount of overdispersion is equal to ( 1 + μ α ) which, if α = 0, it will become a Poisson model.

2.3.3. Generalized Poisson Regression (GPR)

Another model used for counting data with the issue of overdispersion or underdispersion is the Generalized Poisson model. Let us assume that yi (I = 1, …, n) is a random variable with the following probability density function.
P r Y i = y i = ( μ i 1 + α   μ i ) y i 1 + α y i y i 1 y i ! e x p μ i 1 + α y i 1 + α y i
Then, α is a parameter of dispersion and E ( Y i ) = I ? i , and V a r ( Y i ) = ( 1 + α μ i )2 μ i   are respectively the mean and variance of yᵢ. If α   = 0, then the Generalized Poisson model transforms into the Poisson model with mean μᵢ. If α < 0 then the phenomenon of underdispersion occurs in the model, and if α > 0 the problem of overdispersion happens [42,43].

2.3.4. Robust Poisson Regression (RPR)

The main feature of this model is that it is statistically more resistant to the original Poisson assumption. Usually, in the simple Poisson model, it is assumed that the variance is equal to the mean, and this assumption may not be appropriate in some cases. The Robust Poisson model weakens this assumption and is less sensitive to data dispersion and deviations from the mean. This model is used in overdispersion conditions [57].
i = 1 n = 1 α y i μ i x i j
In the Equation above, α is the dispersion parameter, and j = 1, 2, …, n.
Figure 2 illustrates a summary of the count model selection process. The colored path in this figure represents the selected model in this study, which is fully presented in the next sections of the selection stages.

2.4. Introduction of Count Model Variables (Dependent/Independent)

The dependent variable in this study is the number of foods labeled as healthy in Mashhad that consumers are willing to spend more money on. Due to the positivity and countable nature of this variable, a count model has been utilized. Moreover, the independent variables were pinpointed and utilized following an extensive examination of the scholarly literature, views from local consumers, and discussions with both academic and practitioner experts, along with key players in the nutrition and marketing industry. Table 1 indicates these independent variables with their nature.

3. Results

3.1. Investigating the Effective Factors to Purchase Healthy-Labeled Agricultural Foods at a Premium by Consumers

Table 2 presents the distribution of responses for the dependent variable in the model. As it can be observed, 163 respondents (45.40%) expressed a willingness to pay a premium for 11 specified foods if they come with a healthy label. Conversely, 46 individuals (12.81%) were not inclined to pay more for healthy foods. These foods include various agricultural items such as tomatoes, melons, cucumbers, onions, apples, potatoes, strawberries, rice, peppers, walnuts, and saffron. The mean of the dependent variable is 7.58 ± 4.20, and according to the table below, the mode (the highest frequency) corresponds to 11 foods.
Table 3 illustrates the frequency distribution of foods that consumers are willing to pay a premium for when labeled as healthy (indicating lower levels of toxins, fertilizers, etc.) and are also accessible in the market during their respective seasons.
As revealed in column B of Table 3, a higher percentage of individuals are willing to pay more for the tomato product, while fewer are willing to do so for the strawberry product. According to the data in column G, for foods with a lower current price (regular foods), such as cucumbers and onions (column A), the percentage increase in price that people are willing to pay for healthy food is higher.

3.2. Statistical Characteristics of Healthy Foods Consumers

As shown in Table 4, the average age of the respondents is 30.63 years, ranging from 18 to 63 years. For 94.71% of the respondents, the shape and size of healthy foods were considered unimportant. However, taste and flavor as well as the food price were deemed as highly and moderately important by 73.45% and 48.75% of individuals, respectively. Furthermore, 82.73% of respondents emphasized the importance of food healthiness. About 62.95% of the participants had moderate trust in a brand of healthy foods, and slightly more than 50% of the respondents (53.20%) rated government supervision as low. Additionally, 39.55% of respondents demonstrated moderate knowledge of the harmful effects of chemical fertilizers and toxins on human health and 62.12% expressed significant concern about the presence of these substances in foods. Finally, 50.42% of respondents showed a high awareness of the detrimental effects of fast food consumption on their health.
In the Poisson model, the equality of the mean and variance of the dependent variable is a requirement. In this study, the mean and variance of the dependent variable were 7.58 and 17.64, respectively. By observing that the variance of the number of foods (2.32) is equivalent to the mean, it can be inferred that the frequency distribution of the number of foods demonstrates overdispersion. To support this conclusion, the study conducted an overdispersion test, which is a critical assessment in the Poisson model, with the null hypothesis assuming equality between the mean and variance. The results of this test can be found in Table 5.
The significance of the coefficient of the variable in the above table indicates that using the Poisson model was not appropriate. Therefore, it was necessary to employ alternative models such as the Negative Binomial distribution, Generalized Poisson model, and Robust Poisson.
Table 6 presents the analysis of the Negative Binomial, Generalized Poisson, and Robust Poisson models. In this table, the coefficients for each of the independent variables and the hazard ratios are provided. Since the coefficients in Poisson models are interpreted logarithmically, the hazard ratio, which is presented as e I 2 , is used for interpretation.
The positivity of the dispersion parameter, α , in the Negative Binomial and Generalized Poisson models proves that the variance of observations is greater than their mean, signifying overdispersion in the model. Therefore, utilizing the simple Poisson model would result in overestimation of the standard error and, consequently, a reduction in the amount of coefficient estimates. Hence, considering the criteria mentioned in Table 7, the best model among the three options was selected.
Based on the Akaike Information Criterion (AIC), a lower value indicates a more appropriate model. In this case, the AIC value for the Generalized Poisson model is lower than that of the other two models as per this criterion. Additionally, the Bayesian Information Criterion (BIC) also favors the Generalized Poisson model, with a lower statistic compared to the Robust Poisson and Negative Binomial models. Moreover, a lower absolute value of the log likelihood test statistic indicates a better model fit, and the Generalized Poisson model exhibits a lower log likelihood value than the other two models. Consequently, the use of the Generalized Poisson model is preferred over the Poisson and Negative Binomial models. The number of significant variables in the Generalized Poisson and Negative Binomial models is equal, and less than that in the Poisson model. However, given the better fit of the Generalized Poisson model across various criteria, it was chosen as the optimal model for this study. Therefore, the results of this model were employed to interpret the coefficients.
According to the results of the Generalized Poisson model in Table 6, some variables, including consumer field of study, the importance of food shape and size, the significance of food’s healthiness, government supervision over the healthiness of agricultural food, practicing the 5Rs, and individuals’ awareness about adverse effects of fast food, have become positive and significant at the level of 1%. In addition, this significance percentage for other factors, such as awareness of the harms of pesticides and fertilizers on people’s health and confidence in the inclusion of a healthy label on foods, reached 10%. It is expected that with a 1% increase in these variables, the logarithm of the probability of the expected number of purchases of foods with a healthy label at a premium by consumers will increase. On the other hand, household size, the presence of individuals over 60 years old in the household, household expenses, and the importance of food taste and flavor are negatively and significantly associated with the logarithm of the probability of the expected number of purchases of foods with a healthy label, at 5%. Also, the importance of food price has become negative at the level of 1%. This means that with a 1% increase in these variables, the logarithm of the probability of the expected number of purchases of foods with a healthy label reduces. Since the coefficients in the Poisson model are interpreted logarithmically, it may be challenging to understand the meaning of the logarithm. Therefore, instead of the coefficients βi, the focus is on examining the concept of Incidence Rate Ratios (IRR).
Based on the results of the Generalized Poisson model, individuals majoring in fields related to medicine, agriculture, etc., are 1.3236% more likely to buy more foods with a premium with a healthy food label. The negative and significant coefficient for the household size variable suggests that with a 1% increase in household size, the probability of individuals paying a premium for more foods with a healthy label decreases by 0.9424%. A variable representing the presence of individuals above 60 years old in the family reduces the likelihood of purchasing more foods with a healthy label at a premium by 0.8501%. The negative and significant coefficient for the household expenses variable indicates that with a 1% increase in this variable, the probability of paying a premium for more foods with a healthy label decreases by 0.9843. Individuals who consider the physical features of a food, such as its shape and size, as the influential factors during their purchases are 1.5566% more likely to buy more foods with a healthy label at a premium. For consumers who prioritize taste and flavor and price during their purchases, the probability of paying a premium for more foods with a healthy label decreases by 0.8242% and 0.8592%, respectively. The variable representing the importance of food healthiness indicates that for individuals who place moderate and high importance on the healthiness of the food, the likelihood of purchasing more foods with a healthy label at a premium increases by 17.2382% and 15.5281%, respectively, compared to people who attach less importance to the health of the food. Trust in a brand of healthy food increases individuals’ willingness to pay a premium for purchasing more foods by 1.1172%. Individuals who perceived higher levels of government supervision over the healthiness of foods in the market are 1.1289% more likely to purchase more foods with a healthy label at a premium.
Individuals who are aware of the adverse effects of toxins and chemical fertilizers on human health are 1.0768% more likely to purchase more foods with a healthy label at a premium. The coefficient for the variable of practicing the 5Rs indicates that people who follow one of the five principles of waste management are 1.2381% more likely to purchase more foods with a healthy label at a premium compared to those who do not. Consumers who declared that fast food consumption is harmful to their health are 1.1782% more likely to pay more for foods with a healthy label at a premium.
Although the other variables have become statistically insignificant, their signs still conform to the theory. The gender variable [4,59,60,61,62,63,64] has a negative relationship with the frequency of buying foods with a healthy label at a premium; this means that men are less inclined than women to buy these foods at a premium, and variables of age [59], education [2,65,66,67,68,69], employed household members, the presence of children under 5 years old in the household [33,70,71], annual health check-ups, membership in health NGOs, worry about remaining toxins and fertilizers in foods [67,68,72], and property position (a measure of people’s well-being and economic status) have a positive relationship with the frequency of buying foods with a healthy label at a premium.

4. Discussion

The production and consumption of healthy foods are vital to solve serious environmental, health, and safety problems. However, this action in Iran comes with challenges, including the fact that the production of these foods incurs higher costs compared to conventional agricultural food products. This results in higher pricing and, consequently, limited availability of these foods, reducing purchases compared to regular foods. Since the future of healthy and organic agriculture is considered one of the instances of sustainable agriculture and depends to a large extent on consumer demand and their motivation to pay a premium for healthy foods, this study has been done with the aim of identifying the inhibiting and stimulating factors and analyzing consumer behavior and understanding their motivations and preferences. By analyzing these factors, effective changes can be made in the healthy foods market and encourage people to adopt a healthy lifestyle.
Therefore, we first analyzed the price increase that consumers were willing to pay for 11 foods labeled as healthy, finding that the premium does not act as a deterrent for purchasing foods labeled as healthy. In fact, a majority of individuals expressed a preference for buying even slightly more expensive healthy foods. This suggests that, for this particular group of consumers, the significance of a healthy label on foods is so substantial that a premium is considered acceptable and does not hinder their decision to make a purchase. Additionally, it has been found that for items deemed more essential and prominent in people’s food baskets, there is a greater willingness to purchase these foods with a healthy label and at a premium. This implies that considering Iran’s economic conditions (in recent years, Iran’s economy has faced various challenges like high inflation and a devaluation of the Iranian rial), for foods with a higher current price, such as saffron, there is an increase in people’s resistance and sensitivity to paying a higher percentage for a healthy-labeled food. In other words, as the absolute price of a food increases, consumers’ willingness to purchase tends to decrease. This is in contrast to developed countries and those where individuals enjoy higher levels of welfare and income, where resistance and sensitivity to paying higher amounts for healthy foods may be lower. Research by Alsubhi et al. (2022) [24] found that 88.2% of consumers are prepared to pay a premium ranging from 5.6% to 91.5%, with an average of 30.7%, for healthier foods. Similarly, Ali and Ali (2020) [2] reported that 44% of consumers are willing to pay an average of 9% more for wellness food products. Bozoglu et al. (2019) [73] demonstrated that 68% of households were willing to pay an additional USD 0.35 per liter to enhance milk safety. Furthermore, Yu et al. (2014) [74] discovered that, on average, Chinese consumers are willing to pay 47% more for green vegetables and 40% more for green meat compared to conventional options. Sckokai et al. (2014) [75] illustrated that Italian consumers are willing to pay an average premium of 29% for healthy milk. Ting et al. (2021) [76] indicated that Taiwanese consumers are willing to pay extra for rice with a food safety label. Additionally, Kucher et al. (2019) [15] found that consumers generally prefer not to pay more than 25% extra for safe food products. Alberto de Morais Watanabe et al. (2023) [20] revealed that most consumers are willing to pay a premium, between 5% to 10% for organic products.
In the next step, we examined the factors that make consumers pay a premium to buy more foods with a healthy label. Considering the discrete and countable nature of the dependent variable, the assumption of normality for this variable creates uncertainty in the results. Therefore, it is essential to employ count regression models, such as PRM, NBR, GPR, and RPR, for the dependent variable. The limitation of the Poisson model is the assumption of equal mean and variance for the dependent variable. In this study, it was demonstrated that the variance exceeds the mean, resulting in excessive dispersion within the model. In such circumstances, the PRM is not suitable, and alternative models, including the RPR, GPR, and NBR, should be utilized. Various goodness-of-fit criteria were employed for model selection and comparison, all of which confirmed the appropriateness of the GPR distribution over other count regression models. In comparison to other models, the GPR is more comprehensive as it can accommodate both the simple Poisson model and address issues of overdispersion and underdispersion effectively.
From the results obtained, it can be inferred that individuals majoring in fields related to medicine, agriculture, etc., have more knowledge and awareness regarding the potential hazards of pesticides, fertilizers, and other substances used in food production. Therefore, their familiarity and understanding of the healthy label and its benefits are higher. Cardoso et al. (2020) [66] found that the relationship between the field of study and the understanding of healthy eating was significant. As household size increases, household consumption expenses rise, leading to a reduced willingness among individuals to pay a premium for healthy-labeled foods. In contrast, Vapa-Tankosić et al. (2018) [33] and Haghjou et al. (2011) [77] reported a positive relationship between household size and willingness to pay a premium, while Morales and Higuchi (2018) [78], Rezaei and Gholami (2013) [79], and Firoozzare et al. (2024) [80] found this relationship to be negative. Elderly individuals may have limited access to information, less familiarity with communication devices, and may tend to maintain their traditional purchasing habits, leading to insufficient awareness regarding the importance of nutrition and healthy choices. Lima et al. (2021) [60], Zheng et al. (2021) [81], and Bacârea et al. (2021) [82] noted that young people, due to their greater knowledge of the benefits of healthy and organic food products, showed more desire to purchase such items, whereas Alsubhi et al. (2022) [24] and Carbonneau et al. (2021) [83] reported positive motivations among older people towards a healthy diet.
High household expenses reduce their purchasing power and may limit their ability to spend more on foods with healthy labels. Polimeni et al. (2018) [67], Zhang et al. (2018) [70] identified household expenses as a negative factor in the decision to purchase safety foods. The shape and size of a food, due to their connection with consumers’ visual and psychological perceptions, can convey a sense of quality and healthiness. These factors have been identified as influential in the selection of healthy foods by consumers and are consistent with the findings of Alphonce and Alfnes (2012) [84]. For individuals who prioritize taste and flavor, negative perceptions of healthy food taste, old eating habits, previous negative experiences, etc., reduce their inclination to choose healthier foods. Ali and Ali (2020) [2], Bryła (2016) [34], Chiciudean et al. (2012) [85], and Yiridoe et al. (2005) [86] considered the taste of foods as one of the factors influencing the preferences of healthy consumers. Moreover, the higher price of these foods discourages their purchase. The studies by Zhang et al. (2018) [70], Zheng et al. (2021) [81], and Gil and Soler (2006) [87] noted that there is a negative relationship between food price and the willingness to pay a premium. Individuals who prioritize food health are more inclined to purchase healthy foods due to their lower risks and greater safety compared to other foods, which is consistent with the findings of Misra and Singh (2016) [25], Zhang et al. (2018) [70], Albornoz et al. (2024) [88], Firoozzare et al. (2023) [89], Liu (2021) [90], Basha and Lal (2018) [91], and Pandurangaro et al. (2017) [92]. A healthy food brand is as a benchmark for confidence in food quality and health, adherence to high standards, and commitment to ethical and environmental practices, thereby increasing consumers’ willingness to pay a premium for these foods. When consumers trust a brand, they are assured that its foods not only offer high nutritional value and are free from harmful substances, but also that their production processes meet the highest quality standards. A study by Pandurangaro et al. (2017) [92] found that brand advertising is one of the most influential factors in the purchase of organic foods.
High levels of government oversight on food health increase individuals’ willingness to purchase healthy foods at higher prices due to the increased assurance of safety and quality. This oversight reduces concerns about potential health risks and enhances consumer confidence in the food’s effectiveness and benefits. Tikkanen (2014) [93] and Barbosa et al. (2014) [94] identified the lack of government support as the primary reason for the reluctance to purchase healthy and environmentally friendly food products. Individuals with more knowledge and information opt for foods with a healthy label that not only contain fewer toxins, fertilizers, etc., but also provide higher safety and better health benefits, which is compatible with the results of studies by Polimeni et al. (2018) [67], Pakseresht et al. (2022) [95], Iqbal et al. (2021) [96], Ali et al. (2021) [97], Hansmann et al. (2020) [98], and Boccia (2015) [99]. Practicing the 5Rs contributes to environmental protection and resource and energy conservation. This action by individuals can signify their maximum interest and attention to health and environmental issues. Foods with a healthy label are more appealing to individuals who follow the 5Rs, due to their lower impact on the environment and health. Kusdiyanto et al. (2020) [100], Gomes et al. (2023) [101], Wang et al. (2020) [102], and Royne et al. (2011) [103] considered attention to environmental issues as one of the important factors in the demand for healthy foods in their research. Furthermore, Iqbal et al. (2021) [96] regarded higher environmental motivations as influential in the purchase of healthy foods. Individuals who are aware of the harmful effects of fast food tend to use foods that are healthier, safer, and more effective in preventing diseases. Melesse and Van Den Berg (2021) [104] considered the knowledge and awareness of harmful food consumption as influential in choosing healthy food products.

5. Conclusions

In exploring the factors influencing consumers’ willingness to pay a premium price for healthy-labeled foods, our study has identified several key determinants. These factors range from individual consumer perceptions and preferences to broader socio-economic and environmental influences. The results underscore the complexity of consumer behavior in the context of healthy food choices and highlight the necessity of multifaceted approaches to promote healthier eating habits.
In light of these findings, several recommendations are presented below to guide future initiatives and policies aimed at increasing the purchase and consumption of healthy-labeled foods:
Enhancing quality and awareness of healthy food: Considering the shift in people’s behavior towards a healthy lifestyle and diet, efforts to enhance and improving the quality of foods should be directed by government authorities and relevant organizations. Participation in health and food exhibitions can provide an excellent opportunity to increase public awareness regarding the superior quality of these foods compared to regular ones. It also serves as a chance to educate people about the risks associated with unhealthy food ingredients and agricultural food products, especially for the elderly, who play a vital role in reducing diet-related illnesses and advancing a healthier society.
Utilizing technology: The use of technology (To facilitate the production, transportation, and marketing of healthy foods), dedicated applications, and websites focused on selling healthy foods can assist consumers in easily finding and purchasing items. Customers can also be asked to share their opinions, stories, recipes, or creative uses of healthy foods.
Organizational support: In order to spread healthy agricultural technology more effectively, demonstration farms should be created in collaboration with agricultural organizations and pioneering farmers. This initiative will enable other farmers to better comprehend the benefits of this technology and expand the cultivated area and production of healthy foods.
Encouragement to participate: Promoting active engagement by implementing loyalty programs that incentivize customers purchasing healthy foods. This can include providing discounts, rewards, and other benefits as a means of fostering continued support and loyalty from the customer base.
Innovation creation: In the realm of innovation for foods and products labeled as healthy, various approaches include suitable packaging to enhance the freshness and quality of foods for a longer duration, the use of environmentally-friendly and recyclable packaging, leveraging new technologies to improve the shelf life of foods without the need for harmful additives, and incorporating smart labels for nutritional information or tracking the origin of the food.
Market expansion: Holding events and exhibitions, such as local markets and health festivals showcasing healthy products, can attract more attention to these items and increase purchasing opportunities. Additionally, expanding the market for healthy foods through the development of local markets and partnerships with stores and restaurants, combined with improving infrastructure for easier access, including parking and public transportation, can facilitate the buying process and enhance the purchase of healthy foods.
In addition to the above suggestions, further recommendations are presented based on the results of this research.
The promotion of a healthy lifestyle: Educating consumers about the healthy food and its definition, specifying the criteria of a healthy food, and emphasizing its benefits (production and processing methods, taste, and improved nutritional content) promote healthy lifestyles. These actions lead to awareness of the drawbacks of fast food, harmful foods and foods, and the criticisms associated with them as well.
Fair price: The price difference between healthy foods and regular ones is one of the deterrent factors for consumers when purchasing healthy-labeled foods. Therefore, it is recommended to reduce the prices of these foods through subsidies, discounts, and facilities to promote a healthier society and assist low-income segments, enabling most people to access healthy nutrition.
Government supervision: Drafting and implementing standards and regulations related to the production and sale of healthy foods. Establishing an appropriate monitoring and quality control system for these foods. The continuous and accurate implementation of these measures by the government is increased people’s trust in the quality and health of healthy foods. As a result, people’s desire to consume such foods increase.
Promotion and education about the concept of 5Rs: Preserving the environment and promoting responsible consumption involve activities such as separation of wet and dry waste, using reusable or recyclable containers and packaging, avoiding unnecessary waste, and minimizing material contribute to promoting usage to reduce waste, and etc. These actions by the public can support the consumption of healthy foods.
Health labels: Health labels play a crucial role in ensuring the value and safety of foods for consumers. Purchasing and consuming foods with health labels not only guarantees the quality of the foods but also contributes to improving environmental health and preserving natural resources for future generations, thereby enhancing the overall sustainability and food security of the country. By relying on indicators such as labels and government certifications, consumers can ensure the safety and nutritional value of agricultural food products.
However, several issues exist in identifying healthy foods, some of which are mentioned below:
  • Incorrect or ambiguous labeling information: Labels may provide inaccurate or incomplete information, and some health claims may be exaggerated or unsupported. This issue can lead to confusion and poor decision making by consumers [105,106].
  • Lack of consumer education and awareness: Many consumers may not know how to properly read and interpret labels. This lack of knowledge can lead to incorrect health decisions and ineffective use of label information [107,108].
  • Issues with label validation and certification: Some labels may not be properly validated or certified, which can lead to the dissemination of incorrect information about food products and undermine trust in labels [109].
  • Limited coverage of ingredient information and production details: Food labels might not provide sufficient information about the percentage of ingredients or production details, leading to a lack of transparency in consumer food choices [110,111].
Although not all consumers read food labels, the importance of labeling lies in the fact that certified labels indicate that the food complies with government requirements and meets hygiene standards. To increase consumer trust, it is essential to use clear and readable labels that provide accurate information about ingredient percentages and production details. Educating consumers on how to read and interpret labels can also enhance their awareness. Additionally, implementing stricter regulations on health claims can reduce misleading information and increase consumer confidence, as these regulations ensure that claims made on labels are accurate and based on scientific evidence.
In summary, the findings of our study can serve as a suitable basis for designing comprehensive strategies that enhance public health, agricultural policies, and economic and social development in developing countries. These strategies include designing and implementing public health campaigns to promote the consumption of healthy foods and educate about the long-term benefits of nutritional values of healthy foods, supporting healthy agriculture and improving infrastructure to identify and address supply chain barriers to reduce costs and increase access to healthy foods, reducing healthcare costs through the prevention of chronic diseases, and increasing consumer awareness to stimulate demand for healthier food options and promote market growth in this sector. By considering consumer behavior, policymakers can create an environment that facilitates broader adoption and use of healthy eating practices.
Suggestions for future studies are as follows:
Examine price sensitivity of consumers towards different categories of healthy food, such as dairy or other food and agricultural food products to inform pricing strategies.
Identifying and prioritizing factors that have a more significant impact on consumers’ behavior towards these foods, helping understand consumers’ behavior better to expand the market for these foods globally.
Identify cultural and regional differences in consumer preferences for healthy-labeled foods to develop tailored marketing strategies.
Study long-term health outcomes and consumer loyalty associated with the consumption of healthy-labeled food products to better understand their benefits and market potential.

Author Contributions

Conceptualization, A.F. and F.B.; methodology, A.F., S.G. and N.P.; software, N.P.; validation, D.C. and N.P.; formal analysis, S.G.; investigation, S.G.; resources, D.C.; data curation, S.G.; writing—original draft preparation, A.F. and F.B.; writing—review and editing, A.F., S.G., D.C. and N.P.; visualization, D.C.; supervision, A.F. and F.B.; project administration, D.C.; funding acquisition, F.B. All authors have read and agreed to the published version of the manuscript.

Funding

This research received no external funding.

Institutional Review Board Statement

Before starting data collection, participants were informed about the objective of the research and the consequent statistical analysis. Participation in the study was fully voluntary and anonymous and subjects could withdraw from the survey at any time and for any reason. Respondents were required to sign a privacy policy and consent form for collecting and processing personal data in advance, according to the Italian Data Protection Law (Legislative Decree 101/2018) in line with the European Commission General Data Protection Regulation (679/2016). The investigation was carried out following the rules of the 1975 Declaration of Helsinki, revised in 2013. All procedures involving research study participants were approved and are in line with the SWG Code of Conduct. Ethical review and approval were waived for this study because it did not involve any invasive procedure (e.g., fecal samples, voided urine, etc.), laboratory assessment, induce lifestyle changes, or impose dietary modifications.

Informed Consent Statement

Informed consent was obtained from all subjects involved in the study.

Data Availability Statement

Data will be made available on request.

Conflicts of Interest

The authors declare no conflicts of interest.

References

  1. Teng, C.C.; Wang, Y.M. Decisional factors driving organic food consumption: Generation of consumer purchase intentions. Br. Food J. 2015, 117, 1066–1081. [Google Scholar] [CrossRef]
  2. Ali, T.; Ali, J. Factors affecting the consumers’ willingness to pay for health and wellness food products. J. Agric. Food Res. 2020, 2, 100076. [Google Scholar] [CrossRef]
  3. Vyas, S.; Kushwaha, A. Consumer’s perception and knowledge concerning safety of street food services in Pantnagar India. J. Food Saf. Hyg. 2017, 3, 34–39. [Google Scholar]
  4. Guertin, C.; Pelletier, L.; Pope, P. The validation of the Healthy and Unhealthy Eating Behavior Scale (HUEBS): Examining the interplay between stages of change and motivation and their association with healthy and unhealthy eating behaviors and physical health. Appetite 2019, 144, 104487. [Google Scholar] [CrossRef] [PubMed]
  5. Thang, D.Q.; Dung, D.V.; Dung, N.T.T. Factors Affecting the Consumers’ Purchase Decision Safe Food: Case Study in Vietnam. J. Manag. Econ. Stud. 2019, 1, 43–52. [Google Scholar] [CrossRef]
  6. Vecchio, R.; Cavallo, C. Increasing healthy food choices through nudges: A systematic review. Food Qual. Prefer. 2019, 78, 103714. [Google Scholar] [CrossRef]
  7. Capone, R.; Bilali, H.E.; Debs, P.; Cardone, G.; Driouech, N. Food system sustainability and food security: Connecting the Dots. J. Food Secur. 2014, 2, 13–22. [Google Scholar] [CrossRef]
  8. Gupta, T.; Sarkar, A.K. Impact of Health Consciousness and Food Safety Concern on Consumer Buying Behaviour–A Review on Organic Food Products. Asian J. Org. Med. Chem. 2022, 7, 676–686. [Google Scholar]
  9. Faal Amand, M.; Falsafian, A. Factors Influencing Willingness to Consume Safe Products in Tabriz County, case study: Cucumber and Tomato. Sustain. Agric. Sci. Res. 2022, 2, 45–61. [Google Scholar]
  10. Humaira, A.; Hudrasyah, H. Factors influencing the intention to purchase and actual purchase behavior of organic food. J. Bus. Manag. 2016, 5, 581–596. [Google Scholar]
  11. Willer, H.; Lernoud, J. The World of Organic Agriculture. Statistics and Emerging Trends; Research Institute of Organic Agriculture FiBL IFOAM—Organics International: Huntsville, AL, USA, 2017. [Google Scholar]
  12. Khodaverdizadeh, M. Investigating the influencing factors on the willingness to pay extra for cucumber consumers Organic in Urmia. J. Agric. Econ. Res. 2016, 9, 97–122. [Google Scholar]
  13. Azizi, V.; Nikooy, M.; Khaledi, M. Strategies for the development of healthy food products market in Hamadan city. J. Agric. Econ. Dev. 2014, 27, 328–337. [Google Scholar]
  14. Yadavar, H.; Pakrooh, P. Determination of Effective Components on Consumer Behavior of Healthy and Organic Products Based on BASNEF Model (study Case: Agriculture students of Tabriz University). Agric. Ext. Educ. Res. 2021, 14, 80–92. [Google Scholar]
  15. Kucher, A.; Heldak, M.; Kucher, L.; Fedorchenko, O.; Yurchenko, Y. Consumer willingness to pay a price premium for ecological goods: A case study from Ukraine. Environ. Socio-Econ. Stud. 2019, 7, 38–49. [Google Scholar] [CrossRef]
  16. Kochaki, A.R.; Mansouri, H.; Ghorbani, M.; Rajabzadeh, M. Investigating factors affecting the desire to consume organic products in Mashhad city. Econ. Agric. Dev. 2013, 27, 188–194. [Google Scholar] [CrossRef]
  17. Guiné, R.P.; Florença, S.G.; Barroca, M.J.; Anjos, O. The link between the consumer and the innovations in food product development. Foods 2020, 9, 1317. [Google Scholar] [CrossRef]
  18. Mohebbi, A.; Qureyshi, E. Organic farming and healthy eating. In Proceedings of the 4th National Congress of Organic Agriculture and Traditional, Mohaghegh Ardabili University, 2015. [Google Scholar]
  19. Chen, J.S.; Legrand, W.; Sloan, P. Factors influencing healthy meal choice in Germany. Tourism Int. Interdiscip. J. 2006, 54, 315–322. [Google Scholar]
  20. Alberto de Morais Watanabe, E.; Alfinito, S.; Castelo Branco, T.V.; Felix Raposo, C.; Athayde Barros, M. The Consumption of Fresh Organic Food: Premium Pricing and the Predictors of Willingness to Pay. J. Food Prod. Mark. 2023, 29, 41–55. [Google Scholar] [CrossRef]
  21. Van der Stricht, H.; Profeta, A.; Hung, Y.; Verbeke, W. Consumers’ willingness to buy pasta with microalgae proteins–Which label can promote sales? Food Qual. Prefer. 2023, 110, 104948. [Google Scholar] [CrossRef]
  22. Britwum, K.; Bernard, J.C.; Albrecht, S.E. Does importance influence confidence in organic food attributes? J. Food Qual. Prefer. 2021, 87, 104056. [Google Scholar] [CrossRef]
  23. Van Loo, E.J.; Caputo, V.; Nayga, R.M., Jr.; Meullenet, J.F.; Ricke, S.C. Consumers’ willingness to pay for organic chicken breast: Evidence from choice experiment. Food Qual. Prefer. 2011, 22, 603–613. [Google Scholar] [CrossRef]
  24. Alsubhi, M.; Blake, M.; Nguyen, T.; Majmudar, I.; Moodie, M.; Ananthapavan, J. Consumer willingness to pay for healthier food products: A systematic review. Obes. Rev. 2022, 24, e13525. [Google Scholar] [CrossRef] [PubMed]
  25. Misra, R.; Singh, D. An analysis of factors affecting growth of organic food: Perception of consumers in Delhi-NCR (India). Br. Food J. 2016, 118, 2308–2325. [Google Scholar] [CrossRef]
  26. Chowdhury, S.; Meero, A.; Rahman, A.A.A.; Islam, K.A.; Zayed, N.M.; Hasan, K.R. An empirical study on the factors affecting organic food purchasing behavior in Bangladesh: Analyzing a few factors. Acad. Strateg. Manag. J. 2021, 20, 1–12. [Google Scholar]
  27. Wang, L.; Wang, J.; Huo, X. Consumer’s willingness to pay a premium for organic fruits in China: A double-hurdle analysis. Int. J. Environ. Res. Public Health 2019, 16, 126. [Google Scholar] [CrossRef] [PubMed]
  28. Krystallis, A.; Chryssohoidis, G. Consumers’ willingness to pay for organic food: Factors that affect it and variation per organic product type. Br. Food J. 2005, 107, 320–343. [Google Scholar] [CrossRef]
  29. Arora, A.; Rani, N.; Devi, C.; Gupta, S. Factors affecting consumer purchase intentions of organic food through fuzzy AHP. Int. J. Qual. Reliab. Manag. 2022, 39, 1085–1103. [Google Scholar] [CrossRef]
  30. Nandi, R.; Bokelmann, W.; Gowdru, N.V.; Dias, G. Factors influencing consumers’ willingness to pay for organic fruits and vegetables: Empirical evidence from a consumer survey in India. J. Food Prod. Mark. 2017, 23, 430–451. [Google Scholar] [CrossRef]
  31. Boccia, F.; Sarno, V. Consumer perception and corporate social responsibility: An explorative survey on food Italian market. Qual.-Access Success 2013, 14, 110–112. [Google Scholar]
  32. Lan, B.T.H.; Truong, D.D. Factors influencing urban consumers’ premium payment for safe vegetables in Haiphong City, Vietnam. NeuroQuantology 2023, 21, 790. [Google Scholar] [CrossRef]
  33. Vapa-Tankosić, J.; Ignjatijević, S.; Kranjac, M.; Lekić, S.; Prodanović, R. Willingness to pay for organic products on the Serbian market. Int. Food Agribus. Manag. Rev. 2018, 21, 791–801. [Google Scholar] [CrossRef]
  34. Bryła, P. Organic food consumption in Poland: Motives and barriers. Appetite 2016, 105, 737–746. [Google Scholar] [CrossRef]
  35. Miquel Vidal, M.; Castellano-Tejedor, C. Identification of Marketing Strategies Influencing Consumers’ Perception of Healthy Food Products and Triggering Purchasing Decisions. Businesses 2022, 2, 410–422. [Google Scholar] [CrossRef]
  36. Yang, Y.; Hobbs, J.E.; Natcher, D.C. Assessing consumer willingness to pay for Arctic food products. Food Policy 2020, 92, 101846. [Google Scholar] [CrossRef]
  37. Velčovská, Š.; Del Chiappa, G. The food quality labels: Awareness and willingness to pay in the context of the Czech Republic. Acta Univ. Agric. Silvic. Mendel. Brun. 2015, 63, 647–658. [Google Scholar] [CrossRef]
  38. Firoozi, M.A.; Javan, J.; Tavangar, M. Genealogy as a Method for Analyzing “City Role” Developments (Case Study: Mashhad). J. Res. Hum. Geogr. 2021, 53, 173–193. [Google Scholar] [CrossRef]
  39. Statistical Centre of Iran. 2021. Available online: https://www.amar.org.ir (accessed on 15 February 2024).
  40. Ibeji, J.U.; Zewotir, T.; North, D.; Amusa, L. Modelling fertility levels in Nigeria using Generalized Poisson regression-based approach. Sci. Afr. 2020, 9, e00494. [Google Scholar] [CrossRef]
  41. Bhati, D.; Kumawat, P.; Gómez–Déniz, E. A new count model generated from mixed Poisson transmuted exponential family with an application to health care data. Commun. Stat.-Theory Methods 2017, 46, 11060–11076. [Google Scholar] [CrossRef]
  42. Xie, F.C.; Wei, B.C.; Lin, J.G. Score tests for zero-inflated generalized Poisson mixed regression models. Comput. Stat. Data Anal. 2009, 53, 3478–3489. [Google Scholar] [CrossRef]
  43. Bae, S.; Famoye, F.; Wulu, J.T.; Bartolucci, A.A.; Singh, K.P. A rich family of generalized Poisson regression models with applications. Math. Comput. Simul. 2005, 69, 4–11. [Google Scholar] [CrossRef]
  44. Ramirez, O.A.; Shultz, S.D. Poisson Count Models to Adoption of Agricultural Explain and Natural Resource Management Technologies by Small Farmers in Central American Countries. J. Agric. Appl. Econ. 2000, 32, 21–33. [Google Scholar] [CrossRef]
  45. Boccia, F.; Alvino, L.; Covino, D. This is not my jam: An Italian choice experiment on the influence of typical product attributes on consumers’ willingness to pay. Nutr. Food Sci. 2024, 54, 13–32. [Google Scholar] [CrossRef]
  46. Fallahzadeh, H.; Jahanaraei, Z.; Askarishahi, M.; Lotfi, M. Comparison of Efficiency in Generalized Poisson Regression Model and the Standard Poisson Regression Model in analyzing Fertility Behavior among Women, Kashan. Tolooebehdasht 2017, 16, 1–9. [Google Scholar]
  47. Isgin, T.; Bilgic, A.; Forster, D.L.; Batte, M.T. Using count data models to determine the factors affecting farmers’ quantity decisions of precision farming technology adoption. Comput. Electron. Agric. 2008, 62, 231–242. [Google Scholar] [CrossRef]
  48. Sakamoto, C.M. Application of the Poisson and negative binomial models to thunderstorm and hail days probabilities in Nevada. Mon. Weather Rev. 1973, 101, 350–355. [Google Scholar] [CrossRef]
  49. Nohamba, S.O.; Musara, J.P.; Bahta, Y.T.; Ogundeji, A.A. Drivers of Postharvest Loss among Citrus Farmers in Eastern Cape Province of South Africa: A Zero-Inflated Poisson (ZIP) Regression Model Analysis. Agriculture 2022, 12, 1651. [Google Scholar] [CrossRef]
  50. Zeileis, A.; Kleiber, C.; Jackman, S. Regression models for count data in R. J. Stat. Softw. 2008, 27, 1–25. [Google Scholar] [CrossRef]
  51. Chiou, Y.C.; Fu, C. Modeling crash frequency and severity using multinomial-generalized Poisson model with error components. Accid. Anal. Prev. 2013, 50, 73–82. [Google Scholar] [CrossRef] [PubMed]
  52. Yang, S.; Berdine, G. Poisson regression. Southwest Respir. Crit. Care Chron. 2015, 3, 61–64. [Google Scholar] [CrossRef]
  53. Yang, Z.; Hardin, J.W.; Addy, C.L.; Vuong, Q.H. Testing approaches for overdispersion in Poisson regression versus the generalized Poisson model. Biom. J. 2007, 49, 565–584. [Google Scholar] [CrossRef]
  54. Consul, P.; Famoye, F. Generalized Poisson regression model. Commun. Stat.-Theory Methods 1992, 21, 89–109. [Google Scholar] [CrossRef]
  55. Boucher, J.P.; Denuit, M.; Guillen, M. Models of insurance claim counts with time dependence based on generalization of Poisson and negative binomial distributions. Variance 2008, 2, 135–162. [Google Scholar]
  56. Hellerstein, D.M. Using count data models in travel cost analysis with aggregate data. Am. J. Agric. Econ. 1991, 73, 860–866. [Google Scholar] [CrossRef]
  57. Cantoni, E.; Ronchetti, E. Robust inference for generalized linear models. J. Am. Stat. Assoc. 2001, 96, 1022–1030. [Google Scholar] [CrossRef]
  58. Klikocka, H.; Jarosz-angowska, A.; Nowak, A.; Skwarylo-Bednarz, B. Assessment of Poland food security in the context of agricultural production in 2010–2020. Agron. Sci. 2022, 3, 101–122. [Google Scholar] [CrossRef]
  59. Ljubičić, M.; Sarić, M.M.; Klarin, I.; Rumbak, I.; Barić, I.C.; Ranilović, J.; Guiné, R. Motivation for health behaviour: A predictor of adherence to balanced and healthy food across different coastal Mediterranean countries. J. Funct. Foods 2022, 91, 105018. [Google Scholar] [CrossRef]
  60. Lima, J.P.; Costa, S.A.; Brandão, T.R.; Rocha, A. Food consumption determinants and barriers for healthy eating at the workplace—A university setting. Foods 2021, 10, 695. [Google Scholar] [CrossRef] [PubMed]
  61. Krishna, R.M.; Balasubramanian, P. Understanding the decisional factors affecting consumers’ buying behaviour towards organic food products in Kerala. E3S Web Conf. 2021, 234, 00030. [Google Scholar] [CrossRef]
  62. Tariq, S.; Tariq, S. Association of perceived stress with healthy and unhealthy food consumption among teenagers. J. Pak. Med. Assoc. 2019, 69, 1817–1821. [Google Scholar] [CrossRef]
  63. Munt, A.E.; Partridge, S.R.; Allman-Farinelli, M. The barriers and enablers of healthy eating among young adults: A missing piece of the obesity puzzle: A scoping review. Obes. Rev. 2016, 18, 1–17. [Google Scholar] [CrossRef]
  64. Covino, D.; Boccia, F.; Sarno, V. Global warming and environmental agreements. Qual.-Access Success 2013, 14 (Suppl. S1), 41–45. [Google Scholar]
  65. Nagy-Pénzes, G.; Vincze, F.; Sándor, J.; Bíró, É. Does better health-related knowledge predict favorable health behavior in adolescents? Int. J. Environ. Res. Public Health 2020, 17, 1680. [Google Scholar] [CrossRef] [PubMed]
  66. Boccia, F.; Sarnacchiaro, P. The Italian consumer and genetically modified food. Qual.-Access Success 2013, 14, 105–108. [Google Scholar]
  67. Polimeni, J.M.; Iorgulescu, R.I.; Mihnea, A. Understanding consumer motivations for buying sustainable agricultural products at Romanian farmers markets. J. Clean. Prod. 2018, 184, 586–597. [Google Scholar] [CrossRef]
  68. Singh, A.; Verma, P. Factors influencing Indian consumers’ actual buying behaviour towards organic food products. J. Clean. Prod. 2017, 167, 473–483. [Google Scholar] [CrossRef]
  69. Naughton, P.; McCarthy, S.N.; McCarthy, M.B. The creation of a healthy eating motivation score and its association with food choice and physical activity in a cross sectional sample of Irish adults. Int. J. Behav. Nutr. Phys. Act. 2015, 12, 74. [Google Scholar] [CrossRef] [PubMed]
  70. Zhang, B.; Fu, Z.; Huang, J.; Wang, J.; Xu, S.; Zhang, L. Consumers’ perceptions, purchase intention, and willingness to pay a premium price for safe vegetables: A case study of Beijing, China. J. Clean. Prod. 2018, 197, 1498–1507. [Google Scholar] [CrossRef]
  71. Tonkin, E.; Coveney, J.; Meyer, S.B.; Wilson, A.M.; Webb, T. Managing uncertainty about food risks–Consumer use of food labeling. Appetite 2016, 107, 242–252. [Google Scholar] [CrossRef] [PubMed]
  72. Mondelaers, K.; Verbeke, W.; Van Huylenbroeck, G. Importance of health and environment as quality traits in the buying decision of organic products. Br. Food J. 2009, 111, 1120–1139. [Google Scholar] [CrossRef]
  73. Bozoglu, M.; Bilgic, A.; Huang, C.L.; Florkowski, W.J.; Topuz, B.K. Urban households’ willingness to pay for milk safety in Samsun and Trabzon provinces of Turkey. Br. Food J. 2019, 121, 2379–2395. [Google Scholar] [CrossRef]
  74. Yu, X.; Gao, Z.; Zeng, Y. Willingness to pay for the “Green Food” in China. Food Policy 2014, 45, 80–87. [Google Scholar] [CrossRef]
  75. Sckokai, P.; Veneziani, M.; Moro, D.; Castellari, E. Consumer willingness to pay for food safety: The case of mycotoxins in milk. Bio-Based Appl. Econ. 2014, 3, 63–81. [Google Scholar] [CrossRef]
  76. Ting, C.T.; Huang, Y.S.; Lin, C.T.; Hsieh, Y. Measuring consumer’ willingness to pay for food safety certification labels of packaged rice. AIMS Agric. Food 2021, 6, 1000–1010. [Google Scholar] [CrossRef]
  77. Haghjou, M.; Hayati, B.A.; Mohammadrezaei, R.; Pishbahar, A.; Dashti, G. Factors Affecting Consumers’ Potential Willingness to Pay a Premium for Safe Food Products (Case Study: Agricultural Administration of East Azerbaijan). J. Agric. Knowl. Sustain. Prod. 2011, 2, 106–117. [Google Scholar]
  78. Morales, L.E.; Higuchi, A. Is fish worth more than meat? How consumers’ beliefs about health and nutrition affect their willingness to pay more for fish than meat. Food Qual. Prefer. J. 2018, 65, 101–109. [Google Scholar] [CrossRef]
  79. Rezaei, M.; Gholami, Z.A. Analysis of the determinants of consumers’ willingness to pay extra for organic products in Ghaemshahr city of Mazandaran province. In Proceedings of the 1st National Conference on Stable Agriculture and Natural Resources, Mazandaran; 2013. [Google Scholar]
  80. Firoozzare, A.; Boccia, F.; Yousefian, N.; Ghazanfari, S.; Pakook, S. Understanding the role of awareness and trust in consumer purchase decisions for healthy food and products. J. Food Qual. Prefer. 2024, 121, 105275. [Google Scholar] [CrossRef]
  81. Zheng, G.W.; Akter, N.; Siddik, A.B.; Masukujjaman, M. Organic foods purchase behavior among generation Y of Bangladesh: The moderation effect of trust and price consciousness. Foods 2021, 10, 2278. [Google Scholar] [CrossRef] [PubMed]
  82. Bacârea, A.; Bacârea, V.C.; Cînpeanu, C.; Teodorescu, C.; Seni, A.G.; Guiné, R.P.; Tarcea, M. Demographic, anthropometric and food behavior data towards healthy eating in Romania. Foods 2021, 10, 487. [Google Scholar] [CrossRef] [PubMed]
  83. Carbonneau, E.; Pelletier, L.; Begin, C.; Lamarche, B.; Bélanger, M.; Provencher, V.; Desroches, S.; Robitaille, J.; Vohl, M.C.; Couillard, C.; et al. Individuals with self-determined motivation for eating have better overall diet quality: Results from the PREDISE study. Appetite 2021, 165, 105426. [Google Scholar] [CrossRef] [PubMed]
  84. Alphonce, R.; Alfnes, F. Consumer willingness to pay for food safety in Tanzania: An incentive-aligned conjoint analysis. Int. J. Consum. Stud. 2012, 36, 394–400. [Google Scholar] [CrossRef]
  85. Chiciudean, D.; Funar, S.; Arion, F.; Chirla, G.; Man, A. The factors of influence over the consumer buying behaviour for organic food. Bull. UASVM Cluj-Napoca Hortic. 2012, 69, 68–71. [Google Scholar]
  86. Yiridoe, E.K.; Bonti-Ankomah, S.; Martin, R.C. Comparison of consumer perceptions and preference toward organic versus conventionally produced foods: A review and update of the literature. Renew. Agric. Food Syst. 2005, 20, 193–205. [Google Scholar] [CrossRef]
  87. Gil, J.M.; Soler, F. Knowledge and willingness to pay for organic food in Spain: Evidence from experimental auctions. Acta Agric. Scand Sect. C 2006, 3, 109–124. [Google Scholar] [CrossRef]
  88. Albornoz, R.; García-Salirrosas, E.E.; Millones-Liza, D.Y.; Villar-Guevara, M.; Toyohama-Pocco, G. Using the Theory of Perceived Value to Determine the Willingness to Consume Foods from a Healthy Brand: The Role of Health Consciousness. Nutrients 2024, 16, 1995. [Google Scholar] [CrossRef] [PubMed]
  89. Firoozzare, A.; Ghazanfari, S.; Yousefian, N. Designing and analyzing the motivational risk profile of healthy food and agricultural product purchases. J. Clean. Prod. 2023, 432, 139693. [Google Scholar] [CrossRef]
  90. Liu, M. The Effects of Organic Certification on Shoppers’ Purchase Intention Formation in Taiwan: A Multi-Group Analysis of Structural Invariance. Sustainability 2021, 14, 55. [Google Scholar] [CrossRef]
  91. Basha, M.B.; Lal, D. Indian consumers’ attitudes towards purchasing organically produced foods: An empirical study. J. Clean. Prod. 2018, 215, 99–111. [Google Scholar] [CrossRef]
  92. Pandurangaro, D.; Chiranjeevi, K.; Rao, D.S. Factors Affecting Consumers to Buy Organic Food Products in Hyderabad and Secunderabad. Int. J. Bus. Manag. Invent. 2017, 6, 24–30. [Google Scholar]
  93. Tikkanen, I. Procurement and consumption of local and organic food in the catering of a rural town. Br. Food J. 2014, 116, 419–430. [Google Scholar] [CrossRef]
  94. Barbosa, L.; Portilho, F.; Wilkinson, J.; Dubeux, V. Trust, participation and political consumerism among Brazilian youth. J. Clean. Prod. 2014, 63, 93–101. [Google Scholar] [CrossRef]
  95. Pakseresht, A.; Kaliji, S.A.; Canavari, M. Review of factors affecting consumer acceptance of cultured meat. Appetite 2022, 170, 105829. [Google Scholar] [CrossRef]
  96. Iqbal, J.; Yu, D.; Zubair, M.; Rasheed, M.I.; Khizar, H.M.U.; Imran, M. Health consciousness, food safety concern, and consumer purchase intentions toward organic food: The role of consumer involvement and ecological motives. SAGE Open 2021, 11. [Google Scholar] [CrossRef]
  97. Ali, T.; Alam, A.; Ali, J. Factors Affecting Consumers’ Purchase Behaviour for Health and Wellness Food Products in an Emerging Market. Glob. Bus. Rev. 2021, 22, 151–168. [Google Scholar] [CrossRef]
  98. Hansmann, R.; Baur, I.; Binder, C.R. Increasing organic food consumption: An integrating model of drivers and barriers. J. Clean. Prod. 2020, 275, 123058. [Google Scholar] [CrossRef]
  99. Boccia, F. Genetically Modified Organisms: What Issues in the Italian Market? Qual.-Access Success 2015, 16, 105–110. [Google Scholar]
  100. Kusdiyanto, K.; Saputro, E.P.; Sholahuddin, M.; Mabruroh, M.; Irawati, Z.; Murwanti, S.; Setyaningrum, D.P. Identification of intention to buy healthy food. Int. J. Bus. Econ. Manag. 2020, 5, 32–41. [Google Scholar] [CrossRef]
  101. Gomes, S.; Lopes, J.M.; Nogueira, S. Willingness to pay more for green products: A critical challenge for Gen Z. J. Clean. Prod. 2023, 390, 136092. [Google Scholar] [CrossRef]
  102. Wang, J.; Pham, T.L.; Dang, V.T. Environmental consciousness and organic food purchase intention: A moderated mediation model of perceived food quality and price sensitivity. Int. J. Environ. Res. Public Health 2020, 17, 850. [Google Scholar] [CrossRef] [PubMed]
  103. Royne, M.B.; Levy, M.; Martinez, J. The public health implications of consumers’ environmental concern and their willingness to pay for an eco-friendly product. J. Consum. Aff. 2011, 45, 329–343. [Google Scholar] [CrossRef]
  104. Melesse, M.B.; Van Den Berg, M. Consumer Nutrition Knowledge and Dietary Behavior in Urban Ethiopia: A Comprehensive Study. Ecol. Food Nutr. 2021, 60, 244–256. [Google Scholar] [CrossRef] [PubMed]
  105. Messer, K.D.; Costanigro, M.; Kaiser, H.M. Labeling food processes: The good, the bad and the ugly. Appl. Econ. Perspect. Policy 2017, 39, 407–427. [Google Scholar] [CrossRef]
  106. Spiteri Cornish, L.; Moraes, C. The impact of consumer confusion on nutrition literacy and subsequent dietary behavior. Psychol. Mark. 2015, 32, 558–574. [Google Scholar] [CrossRef]
  107. Kavanaugh, M.; Quinlan, J.J. Consumer knowledge and behaviors regarding food date labels and food waste. Food Control J. 2020, 115, 107285. [Google Scholar] [CrossRef]
  108. Deakin, T.A. Consumers find food labels confusing and too small to read. Pract. Diabetes Int. 2011, 28, 261–264c. [Google Scholar] [CrossRef]
  109. Jahn, G.; Schramm, M.; Spiller, A. The reliability of certification: Quality labels as a consumer policy tool. J. Consum. Policy 2005, 28, 53–73. [Google Scholar] [CrossRef]
  110. Kraemer, M.V.; Fernandes, A.C.; Chaddad, M.C.C.; Uggioni, P.L.; Bernardo, G.L.; Proença, R.P. Is the List of Ingredients a Source of Nutrition and Health Information in Food Labeling? A Scoping Review. Nutrients 2023, 15, 4513. [Google Scholar] [CrossRef]
  111. Covino, D.; Boccia, F. Potentialities of new agri-biotechnology for sustainable nutrition. Riv. Di Studi Sulla Sostenibilità 2016, 2, 97–106. [Google Scholar] [CrossRef]
Figure 1. Sections of the survey tool (questionnaire).
Sustainability 16 06895 g001
Figure 2. Count regression model selection flowchart.
Sustainability 16 06895 g002
Table 1. Characteristics of independent variables.
VariablesCodeVariable Type
Economic and Social
Age (Years)AGEQuantitative (Continuous)
GenderGENDERDummy (Female = 0, Male = 1)
Education (Years)EDUCATIONQuantitative (Continuous)
Field of study 1FIELD OF STUDYDummy (Fields related to medicine, paramedicine, and agriculture = 1, Otherwise = 0)
Household size (Person)HSIZEQuantitative (Continuous)
Employed household membersEMPLOYED MEMBERSQuantitative (Continuous)
The presence of individuals over 60 years old in the householdELDERLYDummy (Yes = 1, No = 0)
The presence of children under 5 years old in the householdCHILDRENDummy (Yes = 1, No = 0)
Household expenses (dollars per month)EXPENSESQuantitative (Continuous)
Property position 2PROPERTYDummy (Yes = 1, No = 0)
Food-related
Importance of food shape and sizeSHAPE & SIZEDummy (Yes = 1, No = 0)
Importance of food taste and flavorTASTE & FLAVOROrdered (Never = 0, Low = 1, Middle = 2, High = 3)
Importance of food pricePRICEOrdered (Never = 0, Low = 1, Middle = 2, High = 3)
Importance of food healthinessHEALTHOrdered (Never = 0, Low = 1, Middle = 2, High = 3)
Trust in a brand of healthy food BRANDOrdered (Never = 0, Low = 1, Middle = 2, High = 3)
Governance function
The level of government supervision on the health of foodsGOVERNMENT
SUPERVISION
Ordered (Never = 0, Low = 1, Middle = 2, High = 3)
Health behavior and awareness
Implement annual health check-upsCHECK-UPSDummy (Yes = 1, No = 0)
Membership in health NGOsHEALTH NGOsDummy (Yes = 1, No = 0)
Environmental behavior and awareness
The level of knowledge about the harmful effects of chemical fertilizers and toxins on human healthKNOWLEDGEOrdered (Never = 0, Low = 1, Middle = 2, High = 3)
Practicing the 5Rs 35RsDummy (Yes = 1, No = 0)
Worry about remaining toxins and fertilizers in foodsTOXINS & FERTILIZERSOrdered (Never = 0, Low = 1, Middle = 2, High = 3)
Awareness of the harmful effects of fast food on healthFAST FOODOrdered (Never = 0, Low = 1, Middle = 2, High = 3)
1 The field of study, as a measure of individuals’ knowledge and awareness regarding the importance of healthy nutrition, was categorized into two groups: (1) Related fields: Including individuals who have studied disciplines such as nutritional sciences, medicine, agriculture, or other fields related to health and nutrition. These individuals are likely familiar with concepts and principles of healthy nutrition and may apply their specialized knowledge in decision-making regarding nutrition. (2) Unrelated fields: Encompassing individuals who have studied disciplines such as engineering, economics, arts, social sciences, and so on. 2 Property position indicates the type of home ownership. Owner and Tenant. Ownership of a residential property can be perceived as an indicator of individuals’ financial stability, reflecting their financial security, stability, and purchasing power. 3 The 5Rs are usually presented as Refuse (reject or say no to unnecessary items), Reduce (minimizing the amount of waste generated), Reuse (increasing the lifespan of items instead of discarding them away after one use), Repurpose (find a new and often creative use for an item instead of discarding it), and Recycle (the process of converting used materials into new foods to reduce waste and conserve resources). These principles are meant to encourage responsible consumption, waste reduction, and sustainable resource management.
Table 2. Description of the dependent variable.
Number of Healthy FoodsFrequently Distribution
Number (People)Percentage (%)Cumulative (%)
04612.8112.81
1123.3416.16
2143.9020.06
3154.1824.23
4113.0627.30
5133.6230.92
692.5133.43
7113.0636.49
8174.7441.23
9113.0644.29
103710.3154.60
1116345.40100
Total359100-
Source: Research findings.
Table 3. Amount of willingness to pay for purchasing each food with a healthy-labeled.
Food 1 NameABCDEFG
Tomato0.4577 (21.44)0.530.5681 (22.56)0.0817.78
Melon0.4195 (26.46)0.480.4553 (14.76)0.0717.07
Cucumber0.3796 (26.74)0.440.4563 (17.54)0.0718.92
Onion0.3792 (25.62)0.440.4558 (16.15)0.0718.92
Apple0.5699 (27.57)0.640.6449 (13.64)0.0814.29
Potato0.56113 (31.47)0.620.6055 (15.32)0.0610.71
Pepper1.32131 (36.49)1.471.5092 (25.62)0.1511.36
Rice5.66124 (34.54)6.126.0370 (19.49)0.468.13
Strawberry4.15155 (43.17)4.454.3359 (16.43)0.307.23
Walnut6.41126 (35.09)6.96.7958 (16.15)0.497.64
Saffron6.79118 (32.86)7.267.1679 (22)0.476.92
Column A: The current price of the regular food on the market (USD 2).
Column B: The frequency and percentage of individuals who are willing to purchase the food with a healthy label and no premium.
Column C: The average maximum price declared by individuals in purchasing a healthy-labeled food (USD).
Column D: The mode of the maximum price declared by individuals in purchasing a healthy-labeled food (USD).
Column E: The frequency and percentage of individuals interested in purchasing a healthy-labeled food at the mode price.
Column F: The difference between the average of the maximum price and the current price (C − A) (USD).
Column G: The percentage of price increase people are willing to pay for a healthy-labeled food compared to its current price [((C − A)/A) × 100].
1 According to FAO, food groups include cereals, root crops, sugar and syrups, seeds of legumes, plant oils, vegetables, fruits, meat and offal, animal fats, eggs, milk (excluding butter), and fish and seafood [58]. 2 To better understand the prices and enable comparison with other studies, the currency unit used has been converted from rials to U.S. dollars. Source: Research findings.
Table 4. Independent variables in the counting model.
VariablesGroup Frequency (%)MeanStd. DevMaxMin
0123
Age 30.639.076318
Gender219
(61)
140
(39)
Education 14.883.07222
Field of study304
(84.68)
55
(15.32)
Hsize 4.412.07151
Employed members 2.141.1381
Elderly244
(67.97)
115
(32.03)
Children258
(71.87)
101
(28.13)
Expenses 282.39173.451132.0718.86
Property116
(32.31)
243
(67.69)
Shape and Size340
(94.71)
19
(5.29)
Taste and Flavor04
(1.11)
91
(25.35)
264
(73.54)
Price9
(2.51)
20
(5.57)
175
(48.75)
155
(43.17)
Health06
(1.67)
56
(15.60)
297
(82.73)
Brand2
(0.56)
86
(23.96)
226
(62.95)
45
(12.53)
Government supervision72
(20.06)
191
(53.20)
89
(24.79)
7
(1.95)
Check-ups125
(34.82)
234
(65.18)
Health NGOs340
(94.71)
19
(5.29)
Knowledge47
(13.09)
93
(25.91)
142
(39.55)
77
(21.45)
5Rs120 (33.43)239 (66.57)
Toxins and Fertilizers3
(0.84)
49
(13.64)
84
(23.40)
223
(62.12)
Fast food2
(0.56)
40
(11.14)
136
(37.88)
181
(50.42)
Source: Research findings.
Table 5. Overdispersion test.
Estimated CoefficientTProb
Predicted value0.0995.680.000
Source: Research findings.
Table 6. Determining the factors influencing the purchase frequency of healthy foods.
ModelRobust PoissonGeneralized PoissonNegative Binomial Regression
VariableCoefficientIRRZCoefficientIRRZCoefficientIRRZ
Age0.00511.00511.580.00641.00641.550.00581.00581.33
Gender−0.09060.9133−1.34−0.04650.9544−0.55−0.1519 *0.0859−1.68
Education0.00361.00360.450.00231.00230.250.00091.00090.09
Field of study0.2085 ***1.23193.050.2803 ***1.32363.140.2292 **1.25762.21
Hsize−0.0517 **0.9495−2.14−0.0592 **0.9424−2.35−0.0619 **0.9399−2.35
Employed members0.0711 **1.07372.080.07061.07321.600.0753 *1.07821.72
Elderly−0.1308 **0.8773−1.98−0.1623 **0.8501−2.17−0.1501 *0.8605−1.88
Children0.06441.06650.920.05651.05810.690.06941.07180.78
Expenses−0.0107 **0.9892−2.01−0.0157 **0.9843−2.52−0.01110.9888−1.63
Property0.02831.02870.430.01661.01680.210.01801.01820.22
Shape and Size0.3799 ***1.46214.490.4425 ***1.55663.290.4235 ***1.52742.67
Taste and Flavor−0.1523 **0.8587−2.34−0.1932 **0.8242−2.43−0.1763 *0.8383−1.89
Price−0.1188 ***0.8879−2.62−0.1516 ***0.8592−2.87−0.1404 **0.8690−2.47
HealthMiddle2.7715 ***15.98413.912.8471 ***17.23823.982.6624 ***14.33114.74
High2.6785 ***14.56353.772.7426 ***15.52813.832.5463 ***12.76034.54
Brand0.1151 **1.12192.320.1108 *1.11721.830.1070 *1.11291.76
Government supervision0.0991 ***1.10422.540.1212 ***1.12892.630.1081 **1.11412.15
Check−ups0.00421.00420.060.01451.01460.180.01831.01850.23
Health NGOs0.08731.09121.000.16311.17711.230.09331.09770.60
Knowledge0.05361.05511.590.0740 *1.07681.920.04931.05061.24
5Rs0.1651 **1.17962.480.2135 ***1.23812.820.1642 **1.17842.10
Toxins and Fertilizers0.02201.02230.490.03111.03160.610.05751.05921.02
Fast food0.1286 ***1.13722.730.1640 ***1.17823.070.1405 ***1.15092.65
Property0.02831.02870.430.01661.01680.210.01801.01820.22
Constant−0.94870.3872−1.17−0.98580.3731−1.16−0.72450.4845−1.00
α (Scattering coefficient)0.40300.2576
Prob (Scattering coefficient)0.0000.000
* Denotes statistical significance at the 10% significance level. ** Denotes statistical significance at the 5% significance level. *** Denotes statistical significance at the 1% significance level. Source: Research findings.
Table 7. Criteria for choosing the best model.
CriterionRobust PoissonGeneralized PoissonNegative Binomial
AIC2264.382105.472126.03
BIC2357.572202.562223.12
Log Likelihood−1108.19−1027.73−1038.02
Number of significant variables161313
Source: Research findings.
Disclaimer/Publisher’s Note: The statements, opinions and data contained in all publications are solely those of the individual author(s) and contributor(s) and not of MDPI and/or the editor(s). MDPI and/or the editor(s) disclaim responsibility for any injury to people or property resulting from any ideas, methods, instructions or products referred to in the content.

