Article

Tracking the Dynamics and Uncertainties of Soil Organic Carbon in Agricultural Soils Based on a Novel Robust Meta-Model Framework Using Multisource Data

1
International Institute for Applied Systems Analysis (IIASA), 2361 Laxenburg, Austria
2
Department of Soil and Water Sciences, China Agricultural University, Beijing 100193, China
3
Institute of Cybernetics, National Academy of Sciences of Ukraine, 03187 Kyiv, Ukraine
*
Author to whom correspondence should be addressed.
Sustainability 2024, 16(16), 6849; https://doi.org/10.3390/su16166849
Submission received: 9 July 2024 / Revised: 1 August 2024 / Accepted: 6 August 2024 / Published: 9 August 2024

Abstract

:
Monitoring and estimating spatially resolved changes in soil organic carbon (SOC) stocks are necessary for supporting national and international policies aimed at assisting land degradation neutrality and climate change mitigation, improving soil fertility and food production, maintaining water quality, and enhancing renewable energy and ecosystem services. In this work, we report on the development and application of a data-driven, quantile regression machine learning model to estimate and predict annual SOC stocks at plow depth under the variability of climate. The model enables the analysis of SOC content levels and respective probabilities of their occurrence as a function of exogenous parameters such as monthly temperature and precipitation and endogenous, decision-dependent parameters, which can be altered by land use practices. The estimated quantiles and their trends indicate the uncertainty ranges and the respective likelihoods of plausible SOC content. The model can be used as a reduced-form scenario generator of stochastic SOC scenarios. It can be integrated as a submodel in Integrated Assessment models with detailed land use sectors such as GLOBIOM to analyze costs and find optimal land management practices to sequester SOC and fulfill food–water–energy–-environmental NEXUS security goals.

1. Introduction

The monitoring, modeling, and mapping of soil organic carbon (SOC) is important for many reasons. SOC is an indicator of soil organic matter (SOM) content, which is a major determinant of soil quality and fertility for food production. Soils with higher SOC can better filter, degrade organic molecules, and purify water. SOC accumulation can substantially contribute to climate change mitigation [1,2,3]. Soils have recently become part of the global carbon agenda for climate change mitigation and adaptation. The “4p1000 initiative” was launched at COP21 by UNFCC under the framework of the Lima–Paris Action Plan (LPAP) in Paris on 1 December 2015. The name of the initiative reflects that a comparatively small proportional increase (4%) of the global SOC stocks in the topsoil of all non-permafrost soils would be similar in magnitude to the annual global net carbon dioxide (CO2) growth [4]. SOC stock is a land degradation neutrality indicator used by the United Nations Convention to Combat Desertification (UNCCD) [5]. The EU Soil Strategy for 2030 contributes to the objectives of the EU Green Deal and is a part of the Biodiversity Strategy. The new strategy updates the 2006 EU Soil Thematic Strategy [6,7] and intends to address land degradation trends. The EU Mission Board for Soil Health and Food proposed a series of quantitative targets to make the soils of Europe healthier. Among them, the aim is to reverse the current SOC concentration losses in croplands (0.5%/yr on average at a 20 cm depth) to an increase of 0.1–0.4%/yr by 2030.
There is substantial complexity and spatial variability in potential SOC changes especially due to the effects of land use changes, management practices, and in the presence of climate changes [8], which exhibit highly variable and uncertain patterns of monthly and seasonal temperature and precipitation (i.e., the two important climate-related SOC modifiers). Some studies show that an increase of 1 °C in the air temperature could cause a 10–28% greater C release (11–34 Pg C/yr) [9]. The function and structure of terrestrial ecosystems can be affected by the precipitation patterns. Increased precipitation can raise soil respiration on average by 30%, whereas decreased precipitation reduces soil respiration by 12% [10], thus affecting soil carbon stock and the overall global carbon cycle. Hence, soil’s role as a source or sink depends on the temperature and precipitation [11].
There is a strong relationship between SOC and N content, i.e., the higher SOC content indicates a higher N content. In many case studies, the ratio of carbon to nitrogen in SOM (about 58% of SOM is made up of SOC) is about 10:1 [12,13], which can vary. In general, microbes can require more nitrogen than is found in organic matter, namely at about an 8:1 ratio. For effective microbial life and the increase in carbon storage in soils, the addition of synthetic fertilizers plays a major role. Nitrogen fertilizers increase the microbial biomass, increase both the readily decomposable and less readily decomposable pools of soil carbon (the latter of which form from the dead microbes), and increase the “new” carbon inputs (from residues) while also slowing the loss of “old” soil carbon [14,15]. The higher share of carbon in soil is more beneficial for soil microbes to make available essential nutrients like N, phosphorus, and zinc to crops, thus enhancing soil health and productivity. The optimal ratio is estimated to be about 24:1 [12,13].
SOC represents the dynamic balance of carbon inflows and outflows in time. The primary source of SOC is SOM, derived from various plant materials including leaves, stems, and roots. These materials are decomposed by microbial processes, leading to respiration back into the atmosphere and recycling by microbes (measured as Carbon Use Efficiency), mineralization, or leaching from the soil [16,17]. In agriculture, typical contributors to SOM are manure, crop residues, and compost. These materials, if not properly humified, are more readily processed by microbes, leading to faster turnover rates. Microbial activity can be further enhanced by adequate precipitation and temperature.
Land use practices can alter SOC content. Such agricultural activities as optimized recycling of residues, balanced nutrient inputs, and reduced tillage can slow down SOC losses [18,19]. Although crop residues are a feedstock for renewable bioenergy production, it is frequently advised to harvest only a portion of the residues to ensure the preservation of SOC stocks. Also, crop residues that remain in the field after crops are harvested are beneficial for soil health as they decrease the risk of soil erosion by wind and water.
Amelung et al. [4] argue for the rapid and sustainable scaling up of soil carbon sequestration practices in order to contribute to climate change mitigation. Cropland soils offer the major potential for carbon sequestration [4]. The implementation of soil carbon sequestration measures requires a diverse set of options fitted for soil conditions and management opportunities and accounting for site-specific trade-offs. The costs and benefits of these options are yet to be estimated with comprehensive land use planning models such as the Global Biosphere Management Model, GLOBIOM [20].
Models are crucial to understand past and future SOC dynamics in the presence of natural and anthropogenic drivers and uncertainty. The two main approaches widely used to assess the impacts of climate change, soil parameters, and land management practices on soil nutrient content and productivity are the following:
  • Process-based simulation models, e.g., such as MIcrobial-MIneral Carbon Stabilization model (MIMICS, [21]), DeNitrification-DeComposition model (DNDC, [22]), and Environmental Policy Integrated Climate model (EPIC [23,24,25,26,27,28,29]), which represent key dynamic processes affecting soil nutrients, land emissions, and productivity (yields);
  • Statistical and machine learning models, which estimate functional relationships between historical observations of climate, soil characteristics, nutrient composition, and land productivity [30,31,32,33,34].
The Agricultural Model Intercomparison and Improvement Project (AgMIP) and the Inter-Sectoral Impact Model Intercomparison Project (ISIMIP) provide important conclusions regarding the two approaches [35]. Process-based models’ computation can be an extremely time-consuming procedure. These models include soil C and N pools and fluxes, which require long spin-up to reach equilibrium states. Because of simplifications and normalizations, the process-based models can fail to capture the impacts of extreme climate events. Reparameterization and recalibration can be demanded for each new set of data, e.g., climate projections, and this tedious task calls for proper parametrization and calibration optimization procedures.
The statistical and machine learning models are gaining popularity for their analysis of vegetation responses, crop yields, and soil nutrient content to climatic conditions, land management practices, and soil properties [32,36]. However, the statistical models can lack the necessary data for estimating SOC content in response to new land, soil, and water management practices, which are optimal or feasible in different administrative and climatic regions. In this situation, the available historical data can be enriched by the results derived using biophysical models.
Thus, the two approaches have different strengths and weaknesses. Our goal is to combine the two approaches by using multisource data, which are larger than the historical data, i.e., by incorporating both historical and model-simulated data and results. Therefore, in this paper, we develop a hybrid meta-model for generating stochastic and dynamic SOC scenarios based on historical data and on the inputs–outputs of a dynamic process-based simulation model Environment Policy Integrated Climate (EPIC) [23,24,37,38].
We train the meta-model using EPIC results on SOC content for feasible scenario combinations of residue retention and fertilization rates. Although the meta-model replicates EPIC results (therefore, it is called a meta-model, i.e., a model of a model), it can also be used relying purely on the available historical data and observations. The combinations of scenarios form the so-called EPIC hypercube, which has been designed based on studies by Balkovic et al. [23].
The meta-model is represented by a quantile regression machine learning model for predicting SOC content quantiles (percentiles) [39,40]. The estimated quantiles and their trends identify the ranges and the respective probabilities of plausible SOC content levels reflecting the variability and the uncertainty of the explanatory variables (also referred to as independent variables or covariates) [41]. Parameters such as temperature and precipitation can be regarded as exogenous, whereas soil properties depend on land use, water, and soil management practices and, therefore, these can be considered as “endogenous” decision-driven parameters. By including residue retention as an explanatory variable, it is possible to estimate the pros and cons of policies on using crop residues as feedstocks for biofuel production. Optimizing the recycling and removal rates of crop residues is essential for soil health preservation and for sustainable biofuel production.
The developed meta-model can be used as a reduced-form scenario generator of stochastic SOC content scenarios, i.e., value and respective probability. It can also be incorporated as a submodel in more complex Integrated Assessment (IAM) land use models, e.g., the Global Biosphere Management model, GLOBIOM [20,42,43]. The meta-model operates at different spatial scales and provides an effective means for scaling biophysical and land use model results to the required resolutions. By introducing SOC constraints (e.g., equal to the 50th or 75th quantile as estimated from the meta-model), the GLOBIOM model can derive an optimal combination of land use practices increasing SOC to the desired level. SOC and other food–energy–water–environmental security constraints identify the overall costs of achieving the food–water–energy–environmental NEXUS security.
The paper is organized as follows. Section 2 discusses SOC as an important soil health indicator. Improving SOC content is an essential motivation for developing a robust quantile-based meta-model and linking it with the land use model GLOBIOM. Section 2.2 presents a short overview of the two main approaches, process-based simulation models and statistical models, to analyze the impacts of weather variability, climate change, land practices on SOC content, possible ranges, and respective probabilities in the presence of inherent uncertainties. Section 2.2.3 explains the choice of covariates included in the meta-model. The proper choice of the explanatory variables guarantees the fitness of the statistical model. Section 3 outlines statistical and machine learning approaches to estimate and predict SOC content levels and their probability distributions. The data and selected results of the studies are presented in Section 4. Quantile-based SOC meta-models have been developed for all NUTS2 regions of the EU. The probability distribution functions of SOC content in different years are analyzed according to critical quantiles (25th, 50th, and 75th) as well as mean values. The results identify the interannual variability and non-normality of SOC content changes, which can be explained by the precipitation and temperature variability affecting components of SOC differently for different soil characteristics under alternative land use practices as discussed in this section. The critical quantiles or levels can be identified by experts, e.g., by the EU Mission Board for Soil Health and Food. Section 5 summarizes the main conclusions and directions for further studies.

2. Modeling SOC Dynamics: Process-Based vs. Statistical Models

2.1. SOC Analysis and Modeling

The Intergovernmental Technical Panel on Soils (ITPS) defines soil health as “the ability of the soil to sustain the productivity, diversity, and environmental services of terrestrial ecosystems”. SOC is an essential ingredient allowing soils to provide these services, making it a key indicator of soil health. SOC improves the biological, chemical, and physical properties of soil, which in turn, increase soil productivity, water-holding capacity, and structural stability [44].
The measurements of soil health are usually performed at the level of about 30 cm soil depth [45]. FAO [44] estimates that the top 30 cm of soil contains more carbon than the atmosphere and vegetation combined. This is relevant to addressing the land degradation neutrality (LDN) target of the United Nations Convention to Combat Desertification (UNCCD) (UN) and the recently adopted the European Green New Deal, which aims to bring the EU countries to climate neutrality by 2050 [46].
It is reported [47,48,49,50] that in many European countries, the topsoil organic carbon (OC) stocks are decreasing. As SOC constitutes the largest terrestrial carbon pool, any changes in this pool may have profound implications for both land productivity and carbon emissions.
Cover cropping, decreased tillage, improved crop portfolios and crop rotations, converting cropland to grassland, and optimized fertilization application and organic amendments to the soil are mentioned as essential practices that potentially increase SOC stocks [47]. Adding External Organic Matter (EOM) can improve soil quality through improved soil fertility, increased water retention capacity, reduced soil erosion, and increased crop productivity. By increasing crop productivity, e.g., through balanced fertilization, plants’ CO2 fixation is improved, and higher amounts of crop residue might be left on the soil, increasing the C input and, hence, the SOC stocks.
The process of SOC accumulation is largely uncertain and is subject to variable factors such as climate change, altering patterns of temperature and precipitation, and responses of microbial communities to climate changes. Tracking SOC dynamics in an inherently uncertain environment calls for stochastic SOC models.

2.2. Modeling SOC Dynamics: Processed-Based vs. Statistical Models

2.2.1. Process-Based EPIC Model

There are a variety of process-based models incorporating SOC quantification methodologies. Among others, the gridded agricultural models (GAMs) CENTURY (JRC.D.3 model framework, http://www.nrel.colostate.edu/projects/century/, accessed on 6 April 2024), Rothamsted carbon model (RothC, [51,52]), DeNitrification-DeComposition (DNDC) model [53,54,55], and EPIC-IIASA model [23,24] have been evaluated as tools for agricultural sector analysis at various scales. These models are increasingly used in EU-scale assessments to support land use policies, such as carbon emissions and removals from land use and land use change [35]. In this work, we make use of EPIC model inputs and results. EPIC is equipped with mechanisms to model the dynamics and the turnover of SOC, in particular, on agricultural lands.
Environment Policy Integrated Climate (EPIC, [23,24]) is a widely used and tested model for simulating many agroecosystem processes including plant growth, crop yield, tillage, wind and water erosion, runoff, soil density, and leaching. C and N modules incorporated in EPIC built on concepts from the Century model [56,57,58] to connect the simulation of soil C dynamics to crop management, tillage methods, and erosion processes. The added C and N routines interact directly with soil moisture, temperature, erosion, tillage, soil density, leaching, and translocation functions in EPIC. Equations were also added to describe the effects of soil texture on soil C stabilization.
A major benefit of using GAMs like EPIC-IIASA for the estimation of SOC changes is the ability of EPIC to simulate and derive results for both existing and potential agricultural practices across large areas. These practices can change as long as the effects of climate change continue to affect farmers and new policies regarding climate mitigation and carbon emissions are implemented to fulfill environmental goals [23,24].

2.2.2. Statistical and Machine Learning Models

We expand the existing SOC modeling approaches by developing a data-driven quantile regression robust meta-model based on statistical and machine learning approaches [39,40]. The meta-model simulates the dependencies of the response variable SOC from such covariates as soil properties, (daily or monthly) temperature and precipitation patterns, and land management practices. The quantile regression approach allows for the derivation of spatio-temporal plausible SOC content ranges and respective probabilities in the presence of uncertain covariates.
SOC models are estimated for all NUTS2 regions of the EU. The models are trained from multisource data including historical observations and EPIC results. They represent a simplified framework that captures complex interactions among the dependent variable and the covariates. Seasonal changes in temperature, precipitation, plant phenology, tillage, fertilization, crop residue recycling, climate change, and the interactions among these and multiple other factors all have the potential to change the SOC content. It is important to understand the interplays between all the SOC drivers, SOC stocks, and changes. The models can be used to identify relationships of interest and the characteristics that drive these relationships. Reduced forms of meta-models demand less computing resources and save computational time. For this, the meta-models can be used as reduced-form scenario generators and as submodels of more complex IAM models.

2.2.3. Statistical and Machine Learning Models

The data used in this work cover the period from 1980 to 2020. The selected covariates are the following: monthly temperature and precipitation, nitrogen fertilization rates, harvested residues and residue recycling levels, the carbon content in crop residues, and relevant soil characteristics such as available water-holding capacity, the concentration of SOC in the topsoil layer, clay content, bulk density, effective soil profile depth, and elevation. The proper choice of covariates guarantees the fitness of models. Varying the values of covariates enables an understanding of how a single independent variable can influence the outcome. Some of the arguments for choosing the covariates as SOC drivers are presented below.
Temperature and precipitation are mentioned among the main SOC determinants [9,10,11,59]. The increase in air temperature and, as a consequence, the increase in soil temperature and microbial activity, speeds up SOC decomposition rates by increasing soil C mineralization and respiration. Warmer temperatures expected with climate change and the potential for more extreme temperature events will impact plant productivity, its nutritional content, and soil quality.
Temperature effects are further stipulated by deficits and excesses in soil water [60,61]. Soil water content has been shown to be positively correlated with microbial C use efficiency (CUE) [62,63]. High soil water contents can, however, lead to reductions in microbial activities due to oxygen limitation, and drought has been shown to severely reduce microbial respiration, growth, and CUE [64]. The research in [65,66] emphasizes that rainfall and its intensity have a strong correlation with the rate of carbon stock accumulation. Therefore, a better understanding of the interactions among variable temperature and soil moisture and SOC can help develop more effective adaptation strategies to offset the impacts of climate extremes on soil health.
SOC in agroecosystems is influenced by physical and chemical soil properties. Soil texture (proportions of clay, sand, silt) represents one of the key soil parameters affecting root growth and soil thermal and hydraulic conductivity [67], which in turn affect SOC levels. Soil clay content can serve as a proxy for soil pH level as clay soils are usually more alkaline with pH values ranging from 7.5 to 10. The pH influences SOC by regulating such soil activities as, e.g., the soil–plant system’s capacity to supply and absorb nutrients (termed as soil nutrient bioavailability) and SOM turnover [68]. The level of initial SOC can also have an effect on SOC.
The addition of N over time presents an essential trade-off and uncertainty for SOC accumulation. On the one hand, sufficient N removes limitations for plant productivity and microbial activity and stimulates SOC increase. On the other hand, the oversupply of N can raise the microbe’s demand for carbon. The demand for carbon may exceed the available labile carbon, which may cause microbes to reach for more stable carbon [69,70]. Soil N loss due to precipitation increase can alter the C:N ratio and, therefore, affect SOC accumulation processes. The increased precipitation, however, does not directly lead to higher N losses as the N dynamics are also influenced by soil texture and management.
The vegetation parameters and the microbial activity can show strong spatio-temporal seasonal variability and uncertainty because of uncertainty in drivers, i.e., temperature, moisture, C and N availability and inputs, and soil properties. Therefore, SOM decay and SOC content levels depend on the uncertain and random explanatory drivers. Thus, the ability of soil to store OC depends on climate–soil–land use/management stochastic interactions [45]. This calls for using a quantile-based approach to identify plausible ranges in SOC content and respective probabilities in the presence of uncertain drivers.

3. Estimating SOC Level Dependencies on Land Practices and Climate Changes

The quantile-based SOC meta-models have been developed for all NUTS2 regions in the EU. The choice of spatial resolution is due to the policy-relevant heterogeneity of NUTS2. Each NUTS2 can be characterized by its individual set of prevailing land use practices, agronomic and non-agronomic drivers affecting land management and soil properties, and therefore, the level of SOC. These drivers are sectoral policies, market prices, climate change, and natural resources. The Common Agricultural Policy (CAP) is one of the main EU policies influencing agricultural management practices. Regionally or nationally, energy and climate policies can have even more influence on cropping patterns than the CAP. CAP consists of different policy instruments with different impacts on the cropping patterns, green farming, crop diversification instead of mono-cropping, environment-friendly farming, maintenance of permanent grassland, and preservation of “ecological focus areas”. Rural development programs, in particular, rural development funding, substantially determine agricultural practices at the level of NUTS2 [71]. To investigate SOC dependencies purely on landform, soil, and climatic characteristics, the analysis can be performed at the level of agroecological zones (AEZs), i.e., geographical areas exhibiting similar climate, landform, soils, and/or land cover, and having a specific range of potentials and constraints for land use.

3.1. Experimental Design

The meta-models were estimated based on multisource data combining historical observations and EPIC model inputs and results (similar to [39,40]). The time span covers years from 1980 to 2020. The EPIC results were derived for various combinations of crops, residue retentions, and chemical nutrient fertilization intensities [23,24]. Nitrogen fertilization intensities distinguish four alternative levels (scenarios): BAU (scenario with NUTS2- and crop-specific N applications), 50 kg N/ha, 100 kg N/ha, and 250 kg N/ha. The nitrogen fertilization scenarios are combined with four crop residue retention alternatives: 0% retention (100% residues harvested), 30% retention (70% residues harvested), 60% retention (40% residues harvested), and 90% retention (10% residues harvested).

3.2. Data

We use the inputs and the results of the Pan-European version of the EPIC-IIASA model calibrated and validated for EU countries [23,24], [72]. The daily meteorological data were obtained from the Joint Research Centre’s (JRC) Crop Growth Monitoring System (CGMS) meteorological database [34] at a 50 km grid resolution. Weather variables include daily and monthly averages of precipitation (Prcp, mm) and temperature (Tr), maximum temperature (Tmax, C), minimum temperature (Tmin, C), and solar radiation (Srad, MJ m−2).
Land cover information was taken from a combined CORINE 2000 and PELCOM map at a 1 km resolution provided by JRC. Digital terrain information was derived from SRTM (Shuttle Radar Topographic Mission; [73]) and GTOPO sources (Global 30 Arc Second Elevation Data; http://eros.usgs.gov, accessed on 5 May 2019).
Soil data were acquired from the European Soil Bureau Database (ESBD v. 2.0), including the Soil Geographic Database of Europe, the Soil Profile Analytical Database of Europe, the Pedo-Transfer Rules Database, the Database of Hydraulic Properties of European Soils [74], and the Map of Organic Carbon Content in topsoils in Europe [75]. Soil variables include dry bulk density (BDdry, g/cm3), clay percentage (clay, %), soil pH (pH), drained upper limit (dul, mm/mm), soil saturated hydraulic conductivity (ksat, mm/day), wilting point (ll, mm/mm), soil organic matter (om, %), sand percentage (sand, %), and saturated volumetric water content (sat, mm/mm) at nine different depths of soil: 0–5, 5–10, 10–15, 15–30, 30–45, 45–60, 60–80, 80–100, and 100–120 cm. Soil data can be considered time-invariant factors; however, they are affected by various land use and soil practices. For these, the SOC content and changes in response to weather parameters under certain practices (and, thus, soil properties) are derived from EPIC simulations. In the same way, the effects of other location-specific practices can be included.
Administrative regions were obtained from the Geographic Information System of the European Commission (GISCO) and watersheds from the European River Catchment Database, version 2 (ERC; provided by European Environment Agency, http://www.eea.europa.eu, accessed on 5 May 2019). Agricultural statistics on crop yields and fertilizer consumption were retrieved from the Statistical Office of the European Communities (EUROSTAT) and IFA/FAO datasets [76]. Information on rainfed and irrigated crop areas was taken from the European Irrigation Map (EIM) presented in [77].
The data were harmonized at a resolution of about 120,000 EPIC simulation units (SimUs). The SimUs are represented, as a rule, by one area with “representative” characteristics for soil, topography, and present weather. If sufficient time series data are available, the meta-model can be estimated at the level of SimUs.

3.3. Machine Learning Quantile Regression Meta-Model

Statistical and machine learning models provide quantitative ways to deal with such questions as estimating the contribution of each independent variable (also called predictor or covariate) and their combinations to the target variable (dependent or response variable). Statistical approaches used to spatially predict SOC differ substantially, with multiple linear regression, ordinary kriging, co-kriging, regression-kriging, and geographically weighted regression being the most commonly used techniques [74]. Models often used for soil nutrient content and crop yield prediction include random forest, neural networks, convolutional neural networks, recurrent neural networks, etc. However, due to the often “black-box” nature of these models, the tractability of the results is not straightforward. The prediction accuracy is sensitive to model structure and parameter calibration, and it can be difficult to explain the accuracy or inaccuracy of the derived results. The complex and non-linear “black-box” structure hinders the explicit integration of these models with IAMs.

3.3.1. Linear Regression Model

A linear regression (LR) can be considered one of the machine learning algorithms, which is one of the most popular models in machine learning. It is widely used because it is simple and tractable. The simplicity means it is easy to understand the responses of the dependent variables to each explanatory, i.e., the regression coefficient of an independent variable reflects the change in the dependent variable as a result of a unit change in the respective independent variables. The LR assumes that the residuals are normally distributed, which means that LR fails to capture extreme values of the independent variables. It uses the method of least squares to calculate the conditional mean of the dependent variable across different values of the explanatory variables. The LR model for calculating the mean takes the form
y i = β 0 + β 1 x i 1 + β 2 x i 2 + β 3 x i 3 + + β m x i m + ϵ i ,
where i = 1 , n is the number of observations and m is the number of independent variables. The random variables ϵ i are typically assumed to be mutually independent and to follow a normal distribution with zero mean and variance σ i 2 > 0 .
Coefficients of the LR are found by minimizing the Mean Square Error “goodness-of-fit” function (Ordinary Least Squares (OLS))
M S E = y i ( β 0 + β 1 x i 1 + β 2 x i 2 + β 3 x i 3 + + β m x i m ) 2 ,
which gives the “best regression line”. Thus, the best estimates of β i provide the estimate of the conditional mean of the variables y i in (1). The predictions focus on a single feature, i.e., the mean of the distribution of the response variables y i .
The level of SOC can vary depending on seasonal patterns of temperature and precipitation, in different soils, and for various combinations of crop residue recycling and nutrient fertilization rates. The quantiles of SOC content and SOC content changes provide ranges of possible SOC levels in different conditions. The SOC dynamics can show the non-normally distributed patterns, e.g., if the SOC 50th percentile is different from the SOC mean value. For statistical estimation and machine learning problems in the presence of non-normal probability distributions, it is more natural to use the median or other quantile-based criteria instead of the mathematical expectation. It is also important that the quantile-based regression allows for the estimation of the likelihood of possible SOC levels to occur in different environmental conditions, which is useful for working our SOC norms, e.g., by “The EU Mission Board for Soil Health and Food” [46].

3.3.2. Quantile Regression (QR) Model

Unlike regular LR, which uses the method of least squares to estimate the conditional mean of the dependent variables, quantile regression estimates the quantiles of the response variable conditional on observations of independent variables. The quantile regression estimates are more robust against outliers. For these studies, the conditional quantile functions are of major interest also for investigating and predicting the ranges and the probability distribution of the SOC content based on key factors such as highly variable temperature and precipitation, uncertain soil characteristics, and land management practices.
In the present work, SOC levels are analyzed and distinguished according to their values, i.e., mean and critical quantiles. SOC quantiles are approximated by fitting separate quantile-based regression models. In classical LR approaches, the regression coefficients ( β -coefficients) represent the mean increase in the response variable produced by one unit increase in the associated explanatory variables. Conversely, the β -coefficients obtained from QR represent the change in a specific quantile of the response variable produced by a one-unit increase in the associated driver. In this way, QR allows one to study how certain drivers affect median (quantile τ = 0.5 ), extremely low (e.g., τ = 0.05 ), or high (e.g., τ = 0.95 ) SOC stock values. Therefore, it gives a more comprehensive description of the effect of predictors on the whole SOC stock probability distribution (i.e., not just the mean) and may be used to analyze differential SOC stock responses to environmental factors.
Let us first introduce the notion of a quantile (percentile) function of a random variable. Quantiles are values that divide the probability distribution of a random variable into a specific number of intervals (continuous) with equal probabilities. It is assumed that a random variable X has a continuous and strictly monotonic cumulative distribution function F X : R [ 0 , 1 ] , F X x = P ( X x ) . The p -quantile function of X , Q X ( p ) , returns the value x such that F X x = Pr X x = p , which can be rewritten as the inverse of the cumulative distribution function Q p = F X 1 x = i n f { x : F X x p } .
For a random sample X 1 , X 2 , , X n , with empirical distribution function F ^ X x , the p th empirical quantile function can be defined as Q ^ p = F ^ X 1 x = i n f { x : F ^ X x p } . The p th empirical quantile can be determined by solving the minimization problem
Q ^ p = a r g m i n x i | X i x p X i x + ( 1 p ) i | X i < x X i x
Quantile regression is an extension of linear regression that is used when the conditions of linear regression are not met (i.e., linearity, homoscedasticity, independence, or normality).
For the quantile regression, we make an assumption that the p th quantile is given as a linear function of the explanatory variables. In the case of the empirical regression and random observations of dependent and independent variables Y 1 , Y 2 , , Y n and X 1 , X 2 , , X n , , the coefficients β τ of the τ th empirical quantile regression can be determined by solving the minimization problem
i τ max 0 , Y i β τ X i + ( 1 τ ) m a x ( 0 , β τ X i Y i )
or problem
i m a x ( τ ( Y i β τ X i ) , ( 1 τ ) ( β τ X i Y i ) ) ,
which is similar to the problem in [39,40]. The minimization problem can be reduced to a linear programming problem [39].
For quantile regression, it is possible to calculate any quantile (percentage) for particular values of the dependent variables. Solving the problem for all τ [ 0 , 1 ] , it is possible to recover the entire conditional quantile function, i.e., the conditional distribution function, of Y . If τ = 0.5 , the minimization problem derives the median. Taking a similar structure to the linear regression model, the “best” quantile regression model equation for the τth quantile is
Q τ ( y i ) = β 0 ( τ ) + β 1 ( τ ) x i 1 + β 2 ( τ ) x i 2 + β 3 ( τ ) x i 3 + + β m ( τ ) x i m ,
where i = 1 , n is the number of observations and m is the number of explanatory variables or drivers (independent variables). Coefficients β m ( τ ) are functions of the required quantile τ . They are defined as
β τ = a r g m i n β R m i | Y i β ( τ ) X i τ Y i β τ X i + 1 τ i | Y i < β ( τ ) X i Y i β τ X i ,
where Y i are observations of dependent variables, X i is the vector of independent variables X i = ( x i 1 ,   ,   x i m ) , β τ is the vector of coefficients β τ = ( β 1 τ , , β m τ ) , and m is the number of observations.
The QR models give much deeper insights into the complete conditional distribution of SOC stock values as a function of spatial and temporal predictors. By focusing on low (or high) quantiles, regression coefficients inform us about predictors that mainly influence the absence (or presence) of high/low SOC stock over space. By considering independent QR models for different values of τ , this allows for the possibility that the importance of certain predictors may change according to SOC level.

4. Selected Results

At first, we derived the best linear regression (LR) relation between the response variable (SOC) and the set of covariate variables. This was carried out to establish the “benchmark” for comparing the SOC quantiles with the mean value predictions. In the LR, in a sequential and variable-by-variable manner, we included the explanatory features in the regression model and measured the importance of these variables by observing the changes in the R2 value. The increase in the R2 due to the inclusion of a variable indicated the importance of the feature for the accuracy of the model. Trained on EPIC model inputs and results, the estimated NUTS2-specific LR meta-models have an R2 of about 0.9 to 0.98 for all NUTS2 regions, meaning that about 10 to 2% of the variation in the response variable (SOC) cannot be accounted for by the independent variables. Figure 1 presents the historical SOC content values and Figure 2 indicates the percentage difference between the SOC content level as estimated by LR and compared to the historical values. The legend on the right-hand side panel provides the maximal and minimal percentage difference between the historical and the LR estimates of the SOC content values by NUTS2 region. The SOC percentage difference varies in the range of [−5, 10] percent.
The estimated QR trends identify the ranges and the respective probabilities of possible SOC content in different years. The goodness of fit of the QR meta-models is based on the definition of the QR. Depending on the quantile, a percentage of the data used for the estimation should be below each of the QR lines. For example, the 0.25th quantile (or 25th percentile) trend has a quarter of the data values less than the 0.25th quantile and three-quarters of the data values larger than the quantile. The values below the quantile line can be considered extreme ones, and their probability of occurrence is smaller than 0.25 (can also be interpreted as 25 times in 100 years). The 0.5th quantile (50th percentile or median) line cuts the data in two equal portions, i.e., half of the data have values smaller than the median and half have values larger than the median. The difference between the median and the average trend indicates that the values are non-normally distributed. Three-quarters of the data lie below the 75th quantile values (also called the third quartile or 75th percentile), and only one-quarter of the values are larger than the 0.75 quantile. The values smaller than the quantile can occur with a probability larger than 0.75.
After training the LR and QR models, it is possible to derive projections of the SOC for different combinations of the covariates, in particular, alternative nitrogen fertilization and residue recycling rates. Thereby, it is possible to analyze the trade-offs and the dependencies of the SOC on the covariates. The covariate data comprise the monthly temperature and precipitation values, soil characteristics (topsoil clay content, water-holding capacity, bulk density, etc.), nitrogen fertilization, and residue retention intensities, representing alternative dimensions of the EPIC hypercube. The business-as-usual data correspond to the historical SOC and covariates scenario. In what follows, we discuss only the BAU scenario, which allows us to compare the results of the estimated models to the actual historical data.

Results Discussion

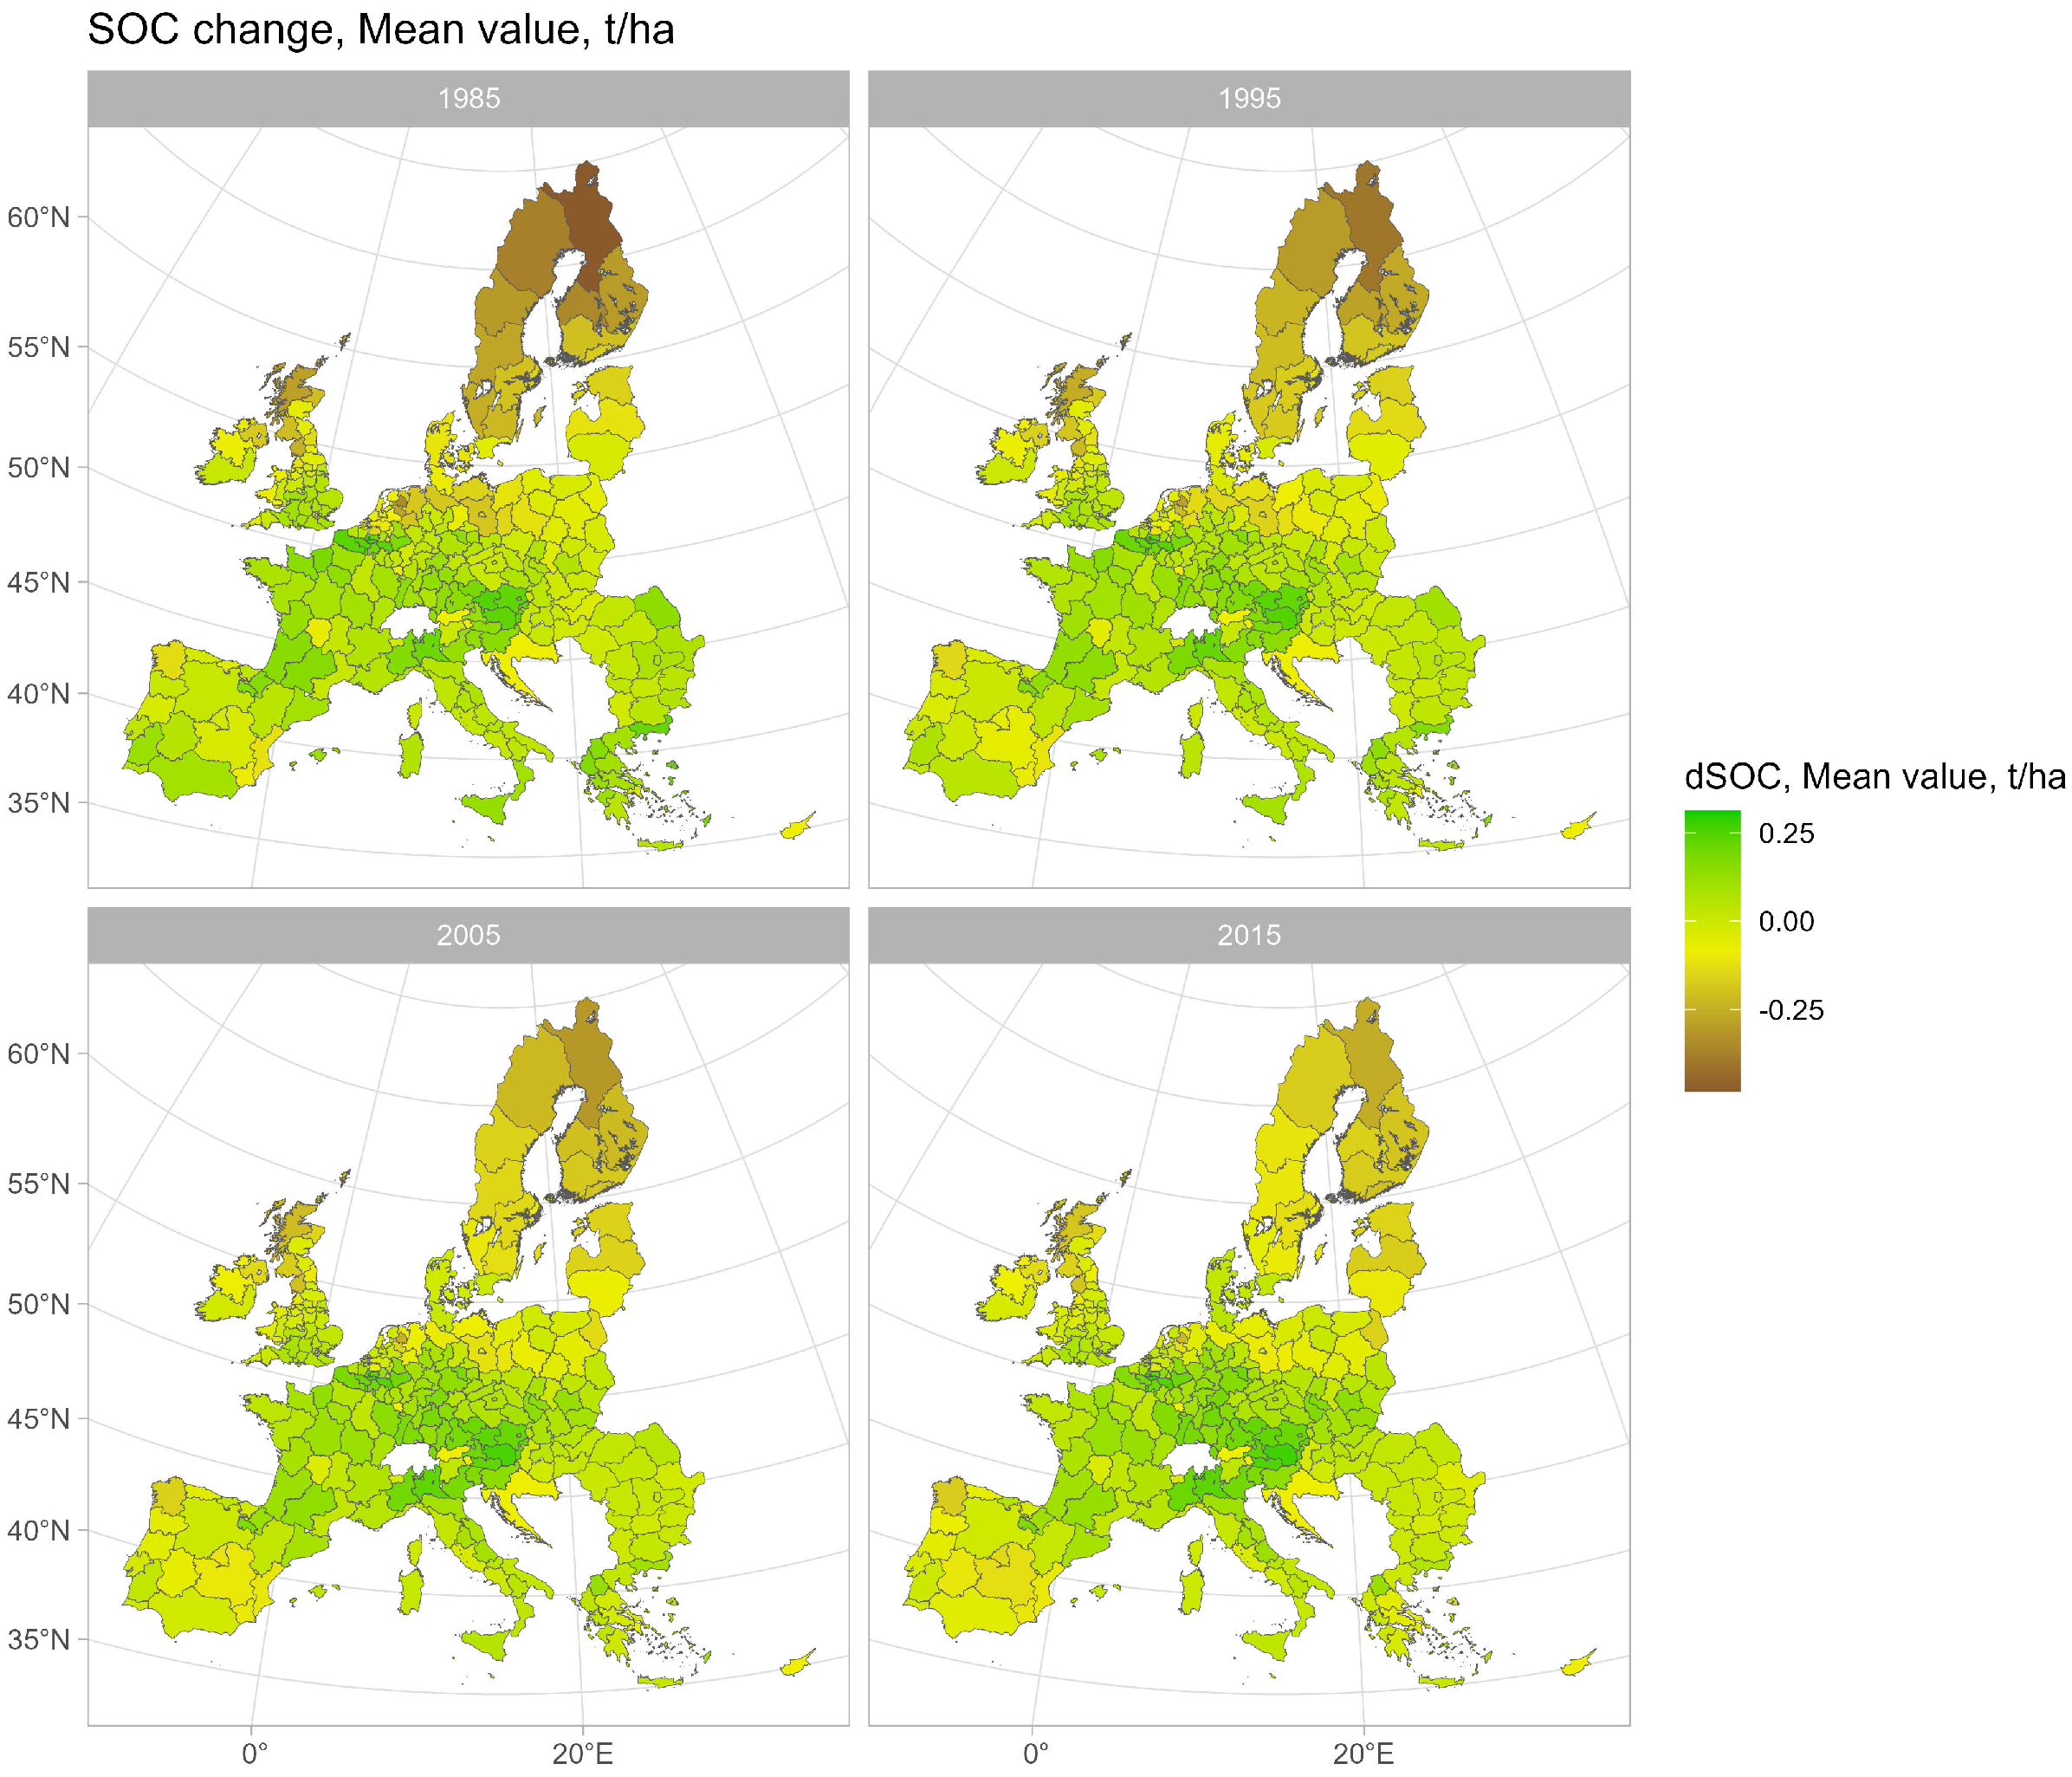
Figure 3, Figure 4, Figure 5 and Figure 6 display the SOC content change between the consequent years for NUTS2 regions in the period from 1980 to 2020 in mean change, the percentage difference between the 50th quantile and the mean value, the 75th quantile change, and the 25th quantile change, respectively, in t/ha. In Figure 3, more brownish colors indicate the decrease in SOC between the years, and the greenish point to the NUTS2 regions with positive changes between the consequent years. In the upper-left panel of Figure 3, the mean changes in SOC are positive in Central Europe, i.e., the SOC stocks increased. However, the decreasing accumulation of SOC stocks can be observed already in the period from 1985 to 1995; the upper-right panel has less green color when compared to the upper-left one. More of a rapid decumulation of SOC stocks is observed in the southern countries of Europe such as Spain and Portugal. The SOC loss slows down in the north, especially in Sweden, perhaps because of increasing ley farming and subsidies introduced in the early 1990s. This reveals the strong impact of rather local socio-economic policies on soil carbon storage [75], which can be captured by the QR meta-model at the resolution of the NUTS2 regions characterized by region- and country-specific characteristics. The policy-driven context needs to be considered in the models’ design and applications. The slowing down of SOC decumulation in Sweden and Finland persists as time goes on, as it is shown in the panels of Figure 3.
Figure 4 visualizes the percentage difference between the 50th quantile and the mean value of the SOC content change for NUTS2 regions from 1980 to 2020.
Figure 4 shows that the mean value of the SOC content change, as estimated by the LR model, can differ from the most likely one, i.e., the 50th quantile. The brownish colors in Figure 4 correspond to the locations (NUTS2 regions), where the mean value is lower than the 50th quantile and the greenish colors correspond to where it is higher. Thus, the brownish colors identify the NUTS2 with underestimated and the greenish with overestimated SOC changes by the traditional LR (using symmetrical or least square goodness-of-fit criteria) models as they cannot properly address the non-normality and the variability of the covariates [33,34].
The discrepancies between the 50th percentile and the mean value of the SOC content changes indicate that the interannual changes in the SOC content are non-normally distributed. The non-normality can be explained by the variability of the monthly precipitation and temperature patterns affecting components of SOC differently for different soil characteristics [78,79,80]. SOC meta-models have been estimated at the NUTS2 level, and, therefore, the discrepancies between the LR and the quantile estimates point to heterogeneities across SimUs within respective NUTS2 regions. Extending quantile estimates to the range τ [ 0 , 1 ] would allow for the recovery of the whole distribution of possible SOC content changes in different environmental conditions.
The 50th quantile of the SOC content changes identifies the dominating response of the SOC labile fraction to the interannual variability of temperature and precipitation including the response to possible extreme weather conditions. Experimental studies show the unalike interannual SOC changes on different soils. For example, Chen et al. [80] investigate and compare precipitation effects on forest soil carbon dynamics driven by differences in soil characteristics for dry and wet areas. Silt and clay soil can hold more water than sandy soils and, therefore, have a higher water-holding capacity. The effects of precipitation on different SOC fractions can be opposite at wet and dry sites. Both the soil DOC (Dissolved Organic Carbon) and MBC (Microbial Organic Carbon) concentrations can decrease at the wet sites but increase at the dry sites under increased precipitation conditions [80]. The responses of the soil MBC concentrations can be influenced by precipitation intensity. DOC is a potential source and a stability indicator of SOC, and it plays an essential role in global C cycling and sequestration. SOC accumulation is also influenced by interannual N response to changing climatic conditions in different soils under alternative land use practices. This determines the C:N ratio and, therefore, can significantly influence DOC degradability and leaching and, thus, affect SOC content [44]. The combined effects of precipitation and temperature patterns and their variability on SOC content changes indicate the differing response mechanisms in different soils under alternative land use practices, which can be addressed by the quantile-based SOC meta-models.
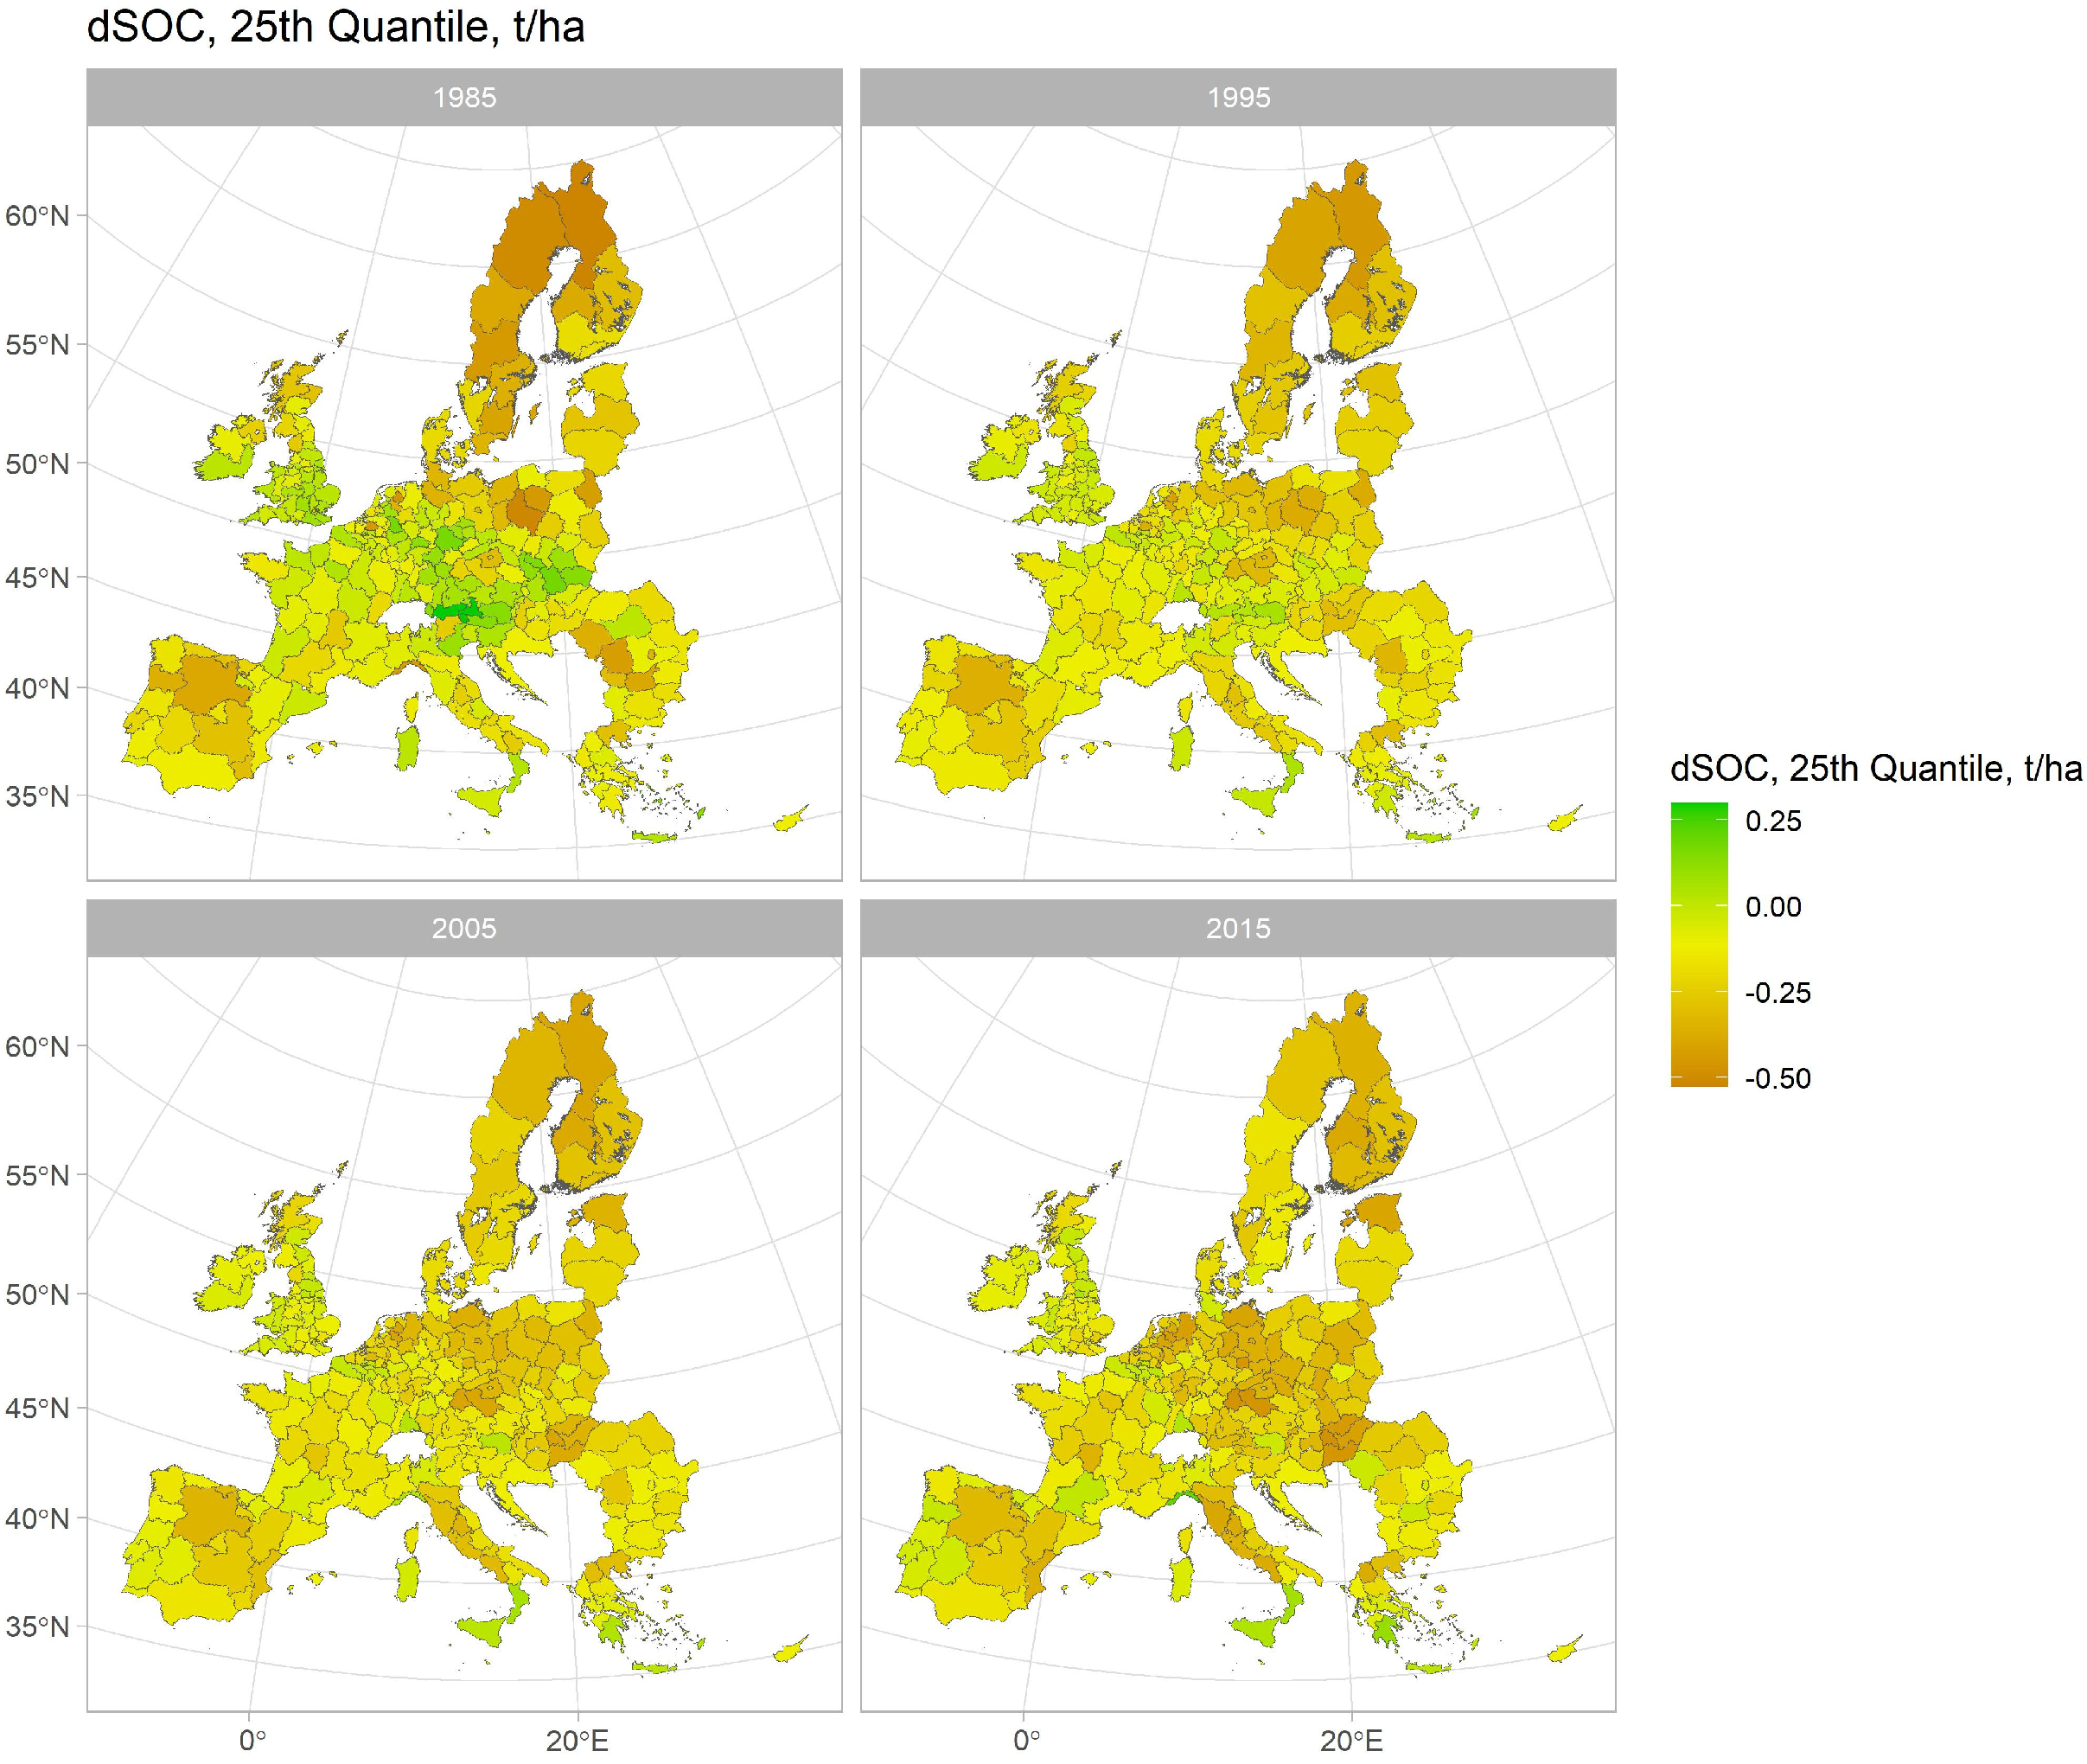
Figure 5 and Figure 6 show the 75th and the 25th quantiles of the SOC content changes, thus estimating the ranges and the respective probabilities of how slow and how fast the SOC can change under varying exogenous drivers and local economic and policy conditions [81]. Figure 4, displaying the 75th quantile value, tells that the SOC changes can be “better” than the 75th quantile value exhibited in the figure, only with a probability of 0.25, however. Correspondingly, the 25th quantile value in Figure 5 tells that the SOC changes with the probability of 0.25 can drop below the 25th quantile value exhibited in Figure 5, i.e., below 0.5 t/ha.
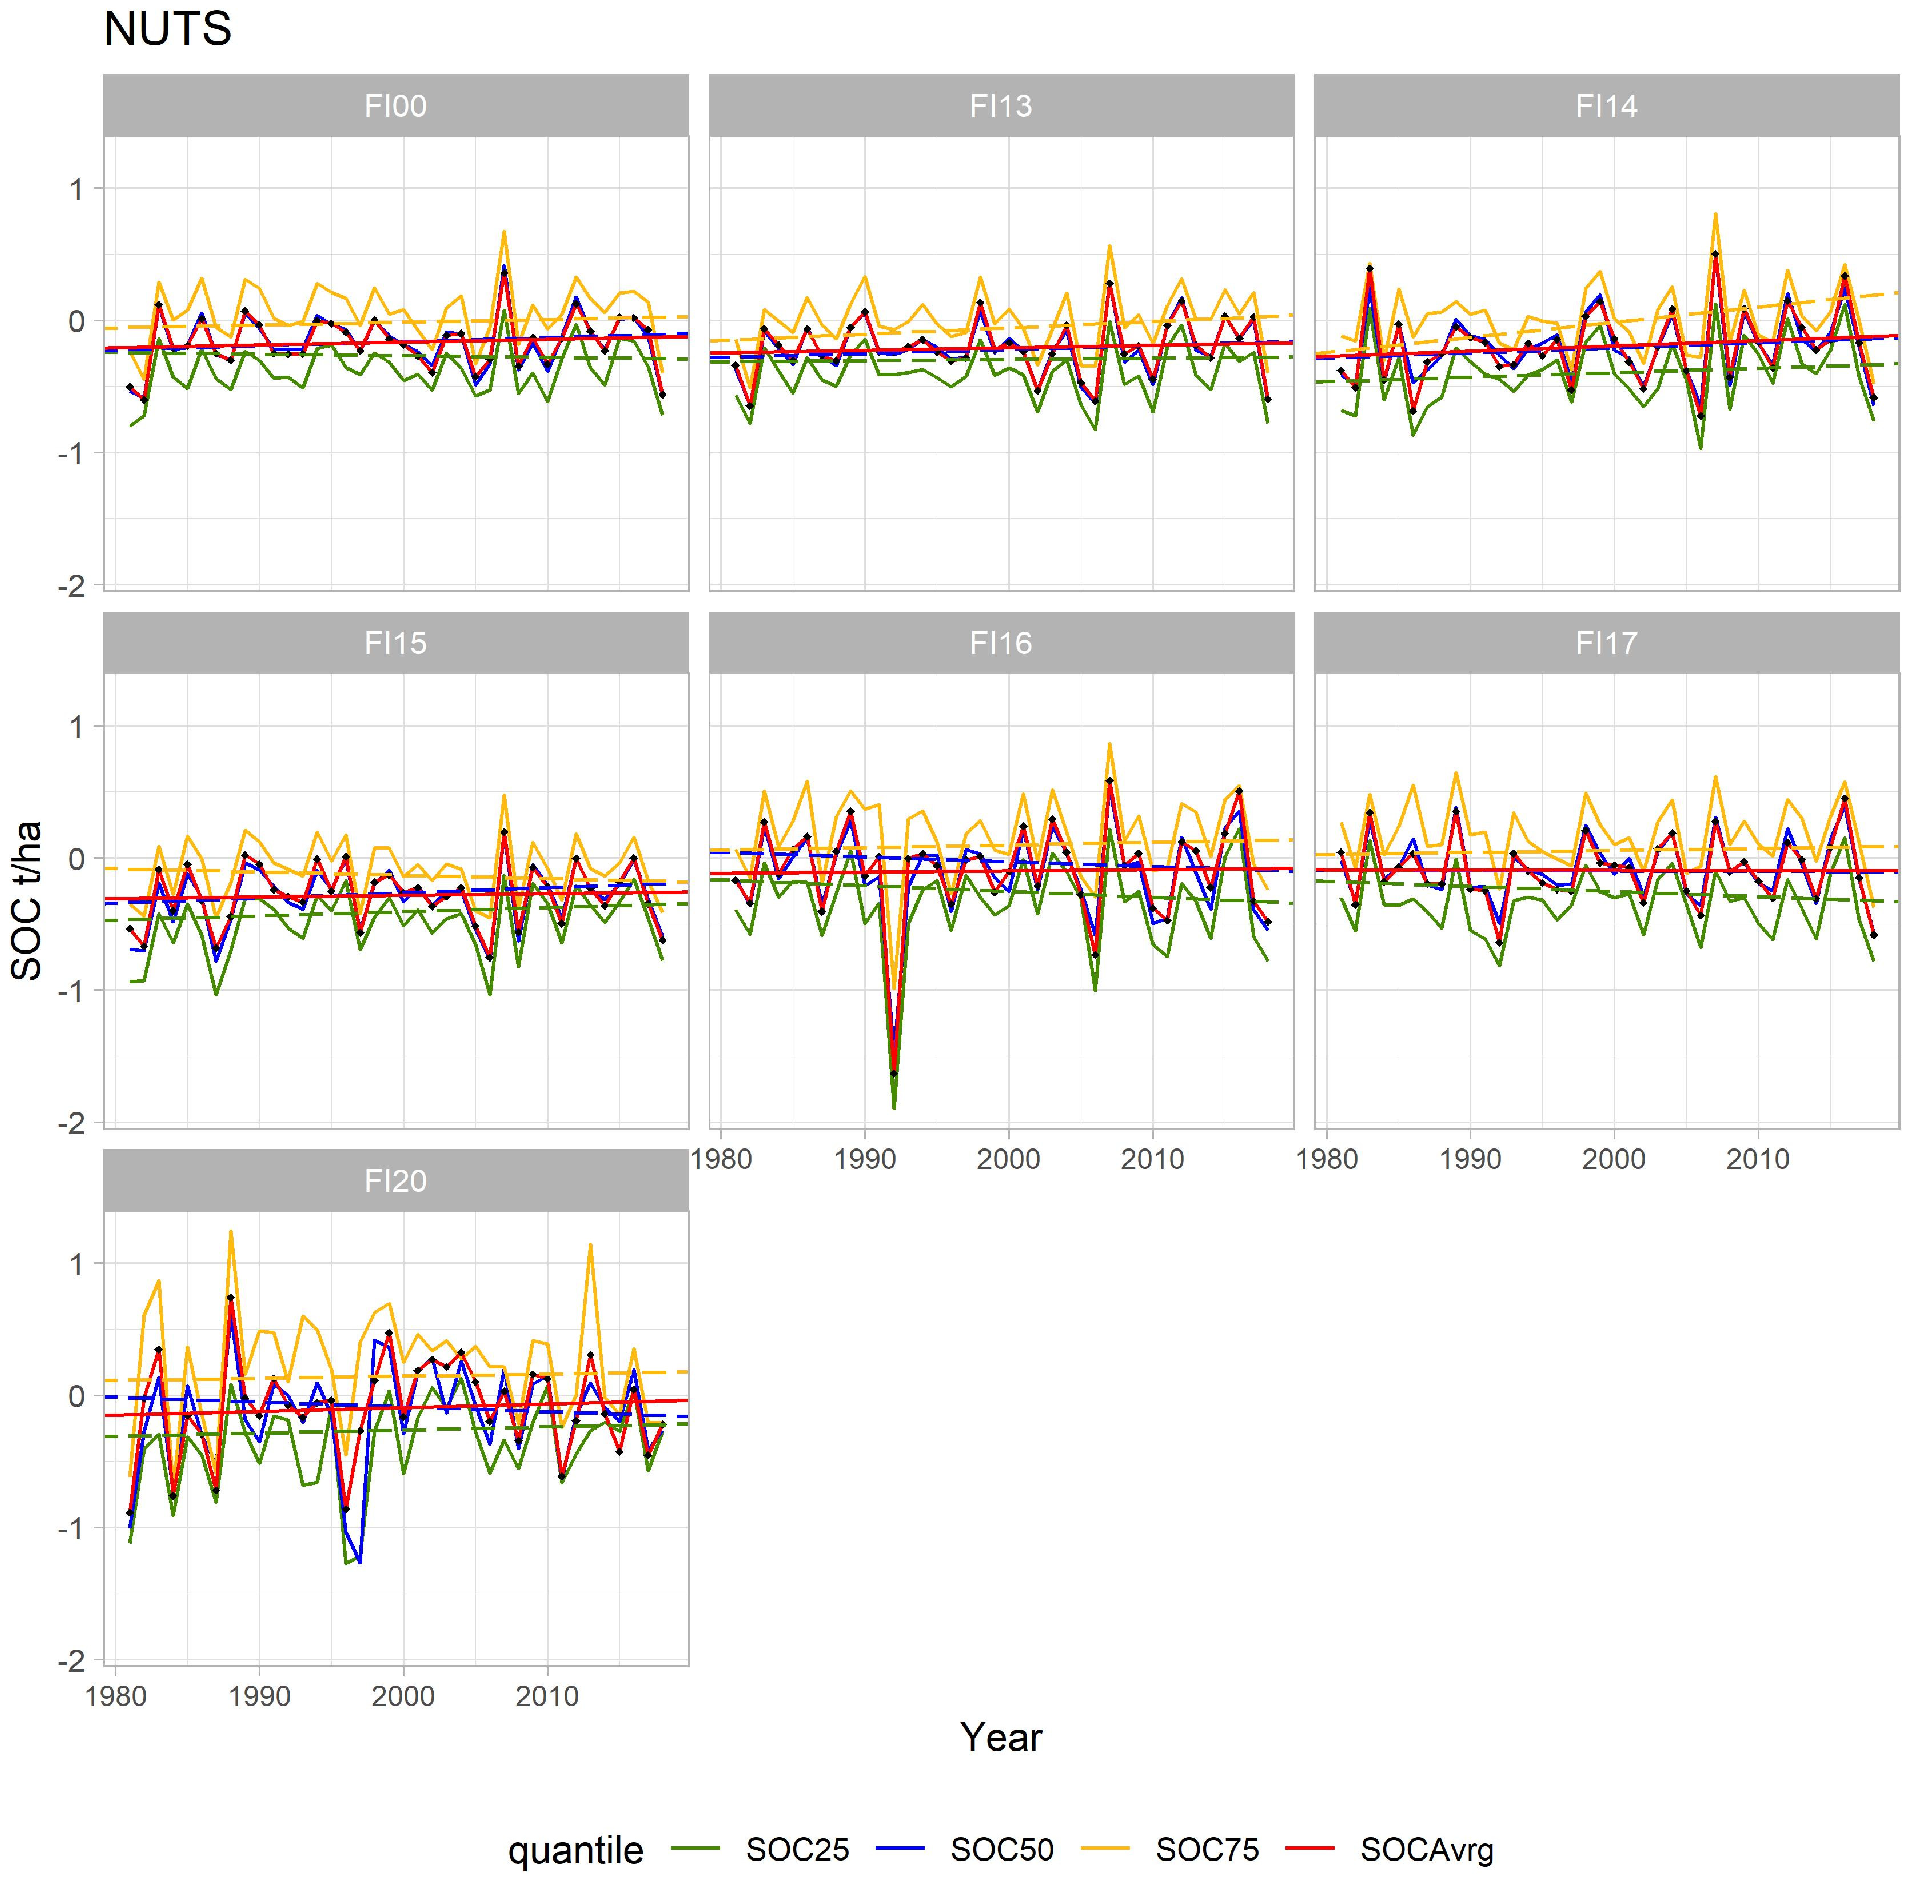
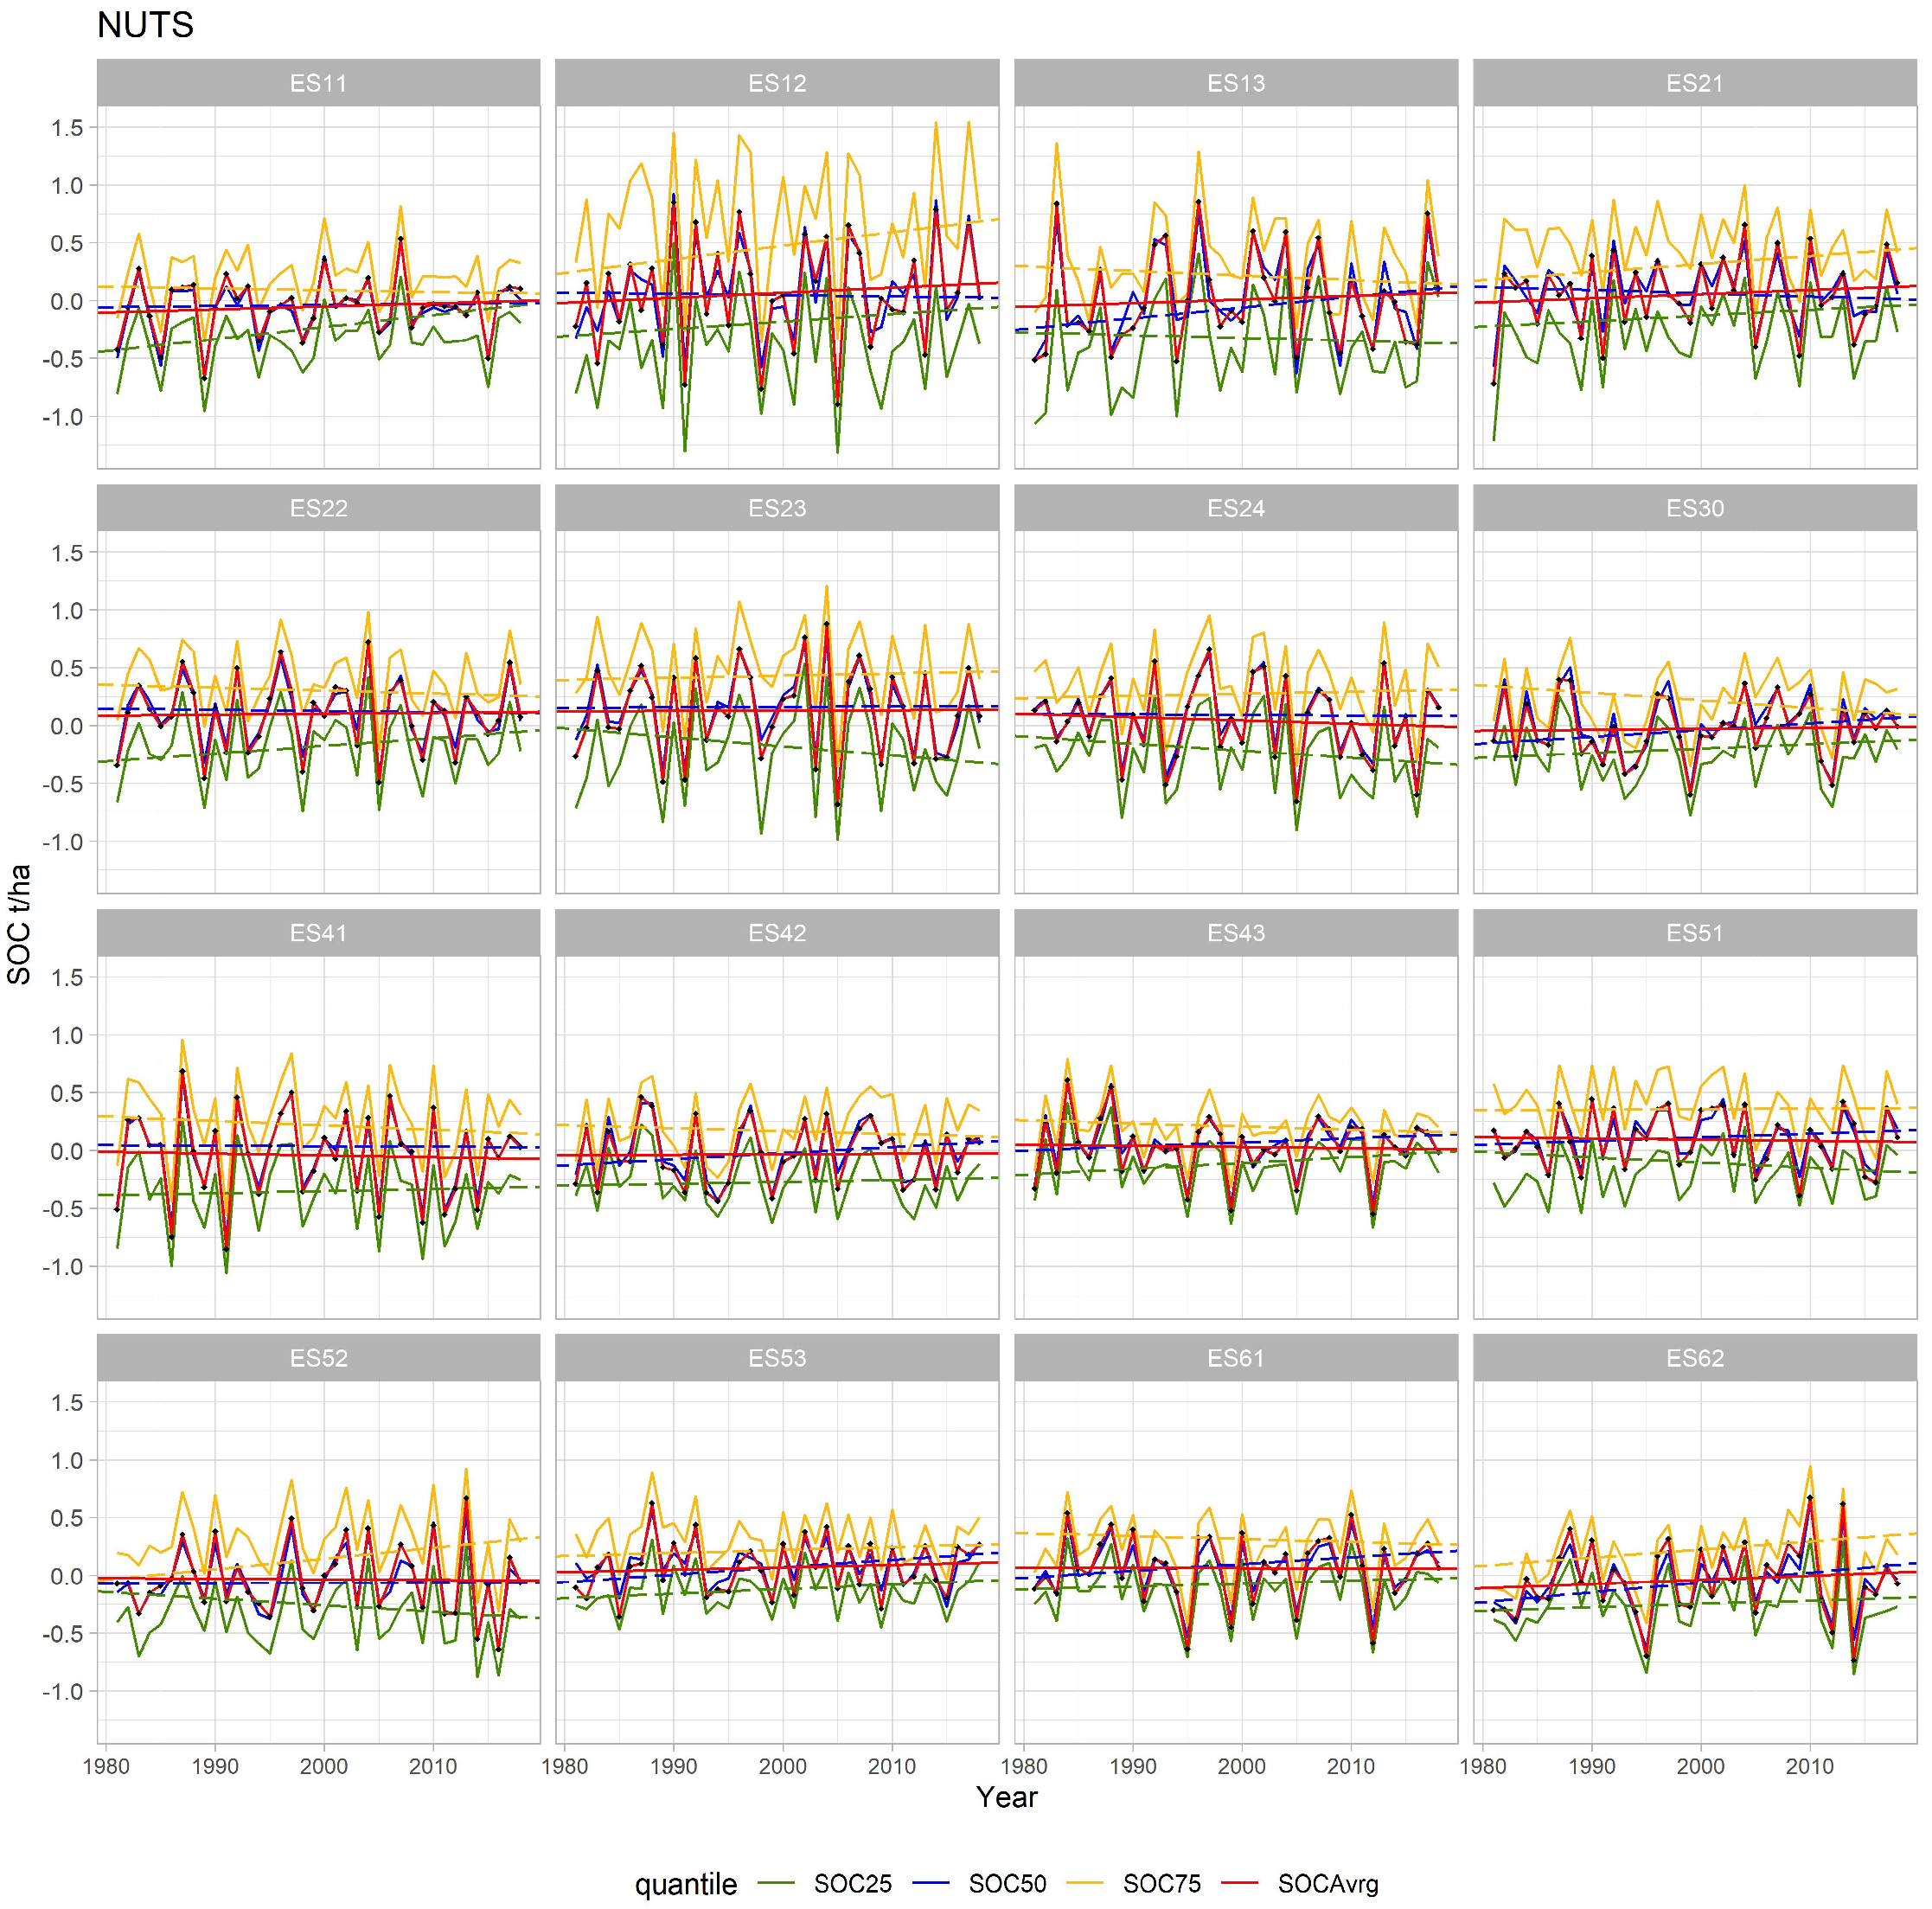
Figure 7, Figure 8, Figure 9, Figure 10, Figure 11 and Figure 12 illustrate the results of estimating the “best” quantile regression fit line aggregated to the level of a country-specific NUTS2 region. As an example, we take Sweden, Finland, France, Germany, Spain, and Italy, which represent the North, Middle, and South of Europe. Visualized quantiles are 25th (green), 50th (blue), and 75th (yellow). In addition, the figures display the mean value of the SOC content change (in red) for the years from 1980 to 2020. The estimates of the SOC quantile level Q τ ( y i ) in each SimUs within all NUTS2 regions and EU countries have a probability of
P r o b Q τ ( y i β 0 τ + β 1 τ x i 1 + β 2 τ x i 2 + β 3 τ x i 3 + + β m τ x i m } = τ .
They are calculated with coefficients β m ( τ ) (5) for each quantile τ (percentile 100 τ ), where i = 1 , n is the number of observations and m is the number of covariates (independent variables). Coefficients β m ( τ ) are functions of quantile τ . Equation (5) means that 100 τ percent of the data are less than the value of the τ —quantile. Equation (5) provides the basis for the validation of the quantile regression model.

5. Conclusions

This paper develops quantile regression meta-models for the analysis and prediction of soil organic carbon (SOC) content and SOC changes for all NUTS2 regions of the EU. There exist multiple statistical and machine learning approaches to estimate and predict soil nutrients, in particular, SOC content. However, the complex and non-linear “black-box” structure of these models hinders the interpretation and the explicit integration of these models with IAMs.
LR models are the simplest and most popular among other approaches because of their simplicity and tractability. However, LR can fail to capture extreme values as they assume normally distributed residuals. They calculate a single parameter—the conditional mean of the dependent (response) variable across different values of the explanatory variables. The QR models are nonparametric as they assume no distribution of residuals. They give much deeper insights into the complete conditional distribution of SOC stock values as a function of spatial and temporal predictors. SOC content in different years is analyzed according to critical quantiles (25th, 50th, and 75th) as well as mean values. For example, the dynamics of the 25th and 75th quantiles show how uncertainty ranges can change in time, i.e., if low/high quantile increases or decreases. The NUTS2-level QR models allow for the investigation of the dynamics of specific SOC content levels that are of interest to experts, e.g., by the EU Mission Board for Soil Health and Food.
By focusing on low (or high) quantiles, regression coefficients β inform us about predictors that mainly influence the absence (or presence) of high/low SOC stock values in space and time. Considering independent QR models for different values of quantile τ allows for the possibility that the importance of certain predictors may change according to SOC level.
The models are trained using multisource data, i.e., the available historical measurements and the results of the EPIC model. The results of the EPIC model are derived for feasible scenario combinations of different residue retention and chemical fertilization rates. The combinations of scenarios form the so-called EPIC hypercube, which has been designed based on studies by Balkovic et al. [23].
We found discrepancies between the 50th percentile and the mean value of the SOC content changes, which indicates that the interannual changes in the SOC content are non-normally distributed. The non-normality can be explained by the variability of the monthly precipitation and temperature patterns affecting components of SOC differently for different soil characteristics and management practices. By developing meta-models for a broader range of quantiles, e.g., τ [ 0 , 1 ] , it is possible to recover the whole distribution of SOC content responses to altering weather, soil, and management conditions in SimUs within respective NUTS2.
The NUTS2-level meta-models can be used to find out an optimal combination of residue retention and fertilization rates for improving soil health, crop productivity, and sustainable biofuel production. Compared to a biophysical model (e.g., EPIC), the computations with the meta-models are less memory-, time-, and data-demanding. The models can be easily explicitly integrated into a larger IAM such as GLOBIOM. In this way, the two models (the biophysical and the economic land use planning models) are linked to derive the costs of optimal and robust land use decisions and food–water–energy–environment NEXUS security management options under constraints on SOC as discussed in Section 2.

Author Contributions

Methodology conceptualization, T.E., P.H., A.L.-D.-A., J.B., R.S., A.D., T.K., N.K. and G.W.; methodology, T.E., P.H., J.B., R.S., T.K., N.K. and P.S.K.; software, T.E., A.L.-D.-A. and M.N.; validation, T.E., P.H., A.L.-D.-A., M.N., J.B., R.S. and C.F.; formal analysis, T.E., A.L.-D.-A., M.N., J.B., R.S. and C.F.; investigation, T.E., A.L.-D.-A., J.B., R.S., M.N. and C.F.; resources, T.E., A.L.-D.-A., J.B., R.S. and C.F.; data T.E., A.L.-D.-A., M.N., J.B., R.S. and C.F.; writing—original draft preparation, T.E., A.L.-D.-A., S.F., J.B. and R.S. writing—review and editing, T.E., A.L.-D.-A., S.F., J.B., R.S., A.D., M.N., N.K. and G.W.; visualization, T.E., A.L.-D.-A., J.B., R.S. and M.N.; supervision, T.E., P.H. and S.F.; project administration, T.E., P.H., S.F., A.D. and N.K. All authors have read and agreed to the published version of the manuscript.

Funding

This research has been funded by the European Union’s H2020 Projects ENGAGE (Grant Agreement No. 821471) and COACCH (Proposal ID 776479), European Union’s Horizon Europe research and innovation action under grant agreement No. 101086179 (AI4SoilHealth), and the EU PARATUS project (CL3-2021-DRS-01-03, SEP-210784020). This work received support from and contributes to a joint project between the International Institute for Applied Systems Analysis (IIASA) and the National Academy of Sciences of Ukraine (NASU) on “Integrated robust modeling and management of food-energy-water-land use nexus for sustainable development” (the National Research Foundation of Ukraine, grant No. 2020.02/0121).

Institutional Review Board Statement

Not applicable.

Informed Consent Statement

Not applicable.

Data Availability Statement

The original contributions presented in the study are included in the article, further inquiries can be directed to the corresponding author. The data and material can be available upon request to interested researchers.

Conflicts of Interest

The authors declare no conflict of interest.

References

  1. Alexander, P.; Paustian, K.; Smith, P.; Moran, D. The economics of soil C sequestration and agricultural emissions abatement. Soil 2015, 1, 331–339. [Google Scholar] [CrossRef]
  2. Batjes, N.H. Mitigation of atmospheric CO2 concentrations by increased carbon sequestration in the soil. Biol. Fertil. Soils 1988, 27, 230–235. [Google Scholar] [CrossRef]
  3. Batjes, N.H.; Ribeiro, E.; Van Oostrum, A. Standardized soil profile data to support global mapping and modelling (WoSIS snapshot 2019). Earth Syst. Sci. Data Discuss. 2019, 12, 299–320. [Google Scholar] [CrossRef]
  4. Amelung, W.; Bossio, D.; de Vries, W.; Kögel-Knabner, I.; Lehmann, J.; Amundson, R.; Bol, R.; Collins, C.; Lal, R.; Leifeld, J.; et al. Towards a global-scale soil climate mitigation strategiy. Nat. Commun. 2020, 11, 5427. [Google Scholar] [CrossRef]
  5. Cowie, A. Guidelines for Land Degradation Neutrality. A report prepared for the Scientific and Technical Advisory Panel of the Global Environment Facility, 2020. Available online: https://catalogue.unccd.int/1474_LDN_Technical_Report_web_version.pdf (accessed on 10 May 2024).
  6. Panagos, P.; Montanarella, L. Soil thematic strategy: An important contribution to policy support, research, data development and raising the awareness. Curr. Opin. Environ. Sci. Health 2018, 5, 38–41. [Google Scholar] [CrossRef]
  7. Panagos, P.; Montanarella, L.; Barbero, M.; Schneegans, A.; Aguglia, L. Soil priorities in the European Union. Geoderma Reg. 2022, 29, e00510. [Google Scholar] [CrossRef]
  8. Álvaro-Fuentes, J.; Easter, M.; Paustian, K. Climate change effects on organic carbon storage in agricultural soils of northeastern Spain. Agric. Ecosyst. Environ. 2012, 155, 87–94. [Google Scholar] [CrossRef]
  9. Schimel, D.S.; Braswell, B.H.; Holland, E.A.; McKeon, R.; Ojima, D.S.; Painter, T.H.; Parton, W.J.; Townsend, A.R. Climatic, edaphic, and biotic controls over storage and turnover of carbon in soils. Glob. Biogeochem. Cycles 1994, 8, 279–293. [Google Scholar] [CrossRef]
  10. Wu, Z.T.; Dijkstra, P.; Koch, G.W.; Peñuelas, J.; Hungate, B.A. Responses of terrestrial ecosystems to temperature and precipitation change: A meta-analysis of experimental manipulation. Glob. Chang. Biol. 2011, 17, 927–942. [Google Scholar] [CrossRef]
  11. Poll, C.; Marhan, S.; Back, F.; Niklaus, P.A.; Kandeler, E. Field-scale manipulation of soil temperature and precipitation change soil CO2 flux in a temperate agricultural ecosystem. Agric. Ecosyst. Environ. 2013, 165, 88–97. [Google Scholar] [CrossRef]
  12. USDA Natural Resources Conservation Service. Carbon to Nitrogen Ratios in Cropping Systems. 2011. Available online: https://www.nrcs.usda.gov/conservation-basics/natural-resource-concerns/soil/soil-science (accessed on 1 February 2024).
  13. Carbon to Nitrogen Ratio (C:N). Soil Health Nexus. Available online: https://soilhealthnexus.org/resources/soil-properties/soil-chemical-properties/carbon-to-nitrogen-ratio-cn/ (accessed on 8 July 2024).
  14. Rocci, K.S.; Lavallee, J.M.; Stewart, C.E.; Cotrufo, M.F. Soil organic carbon response to global environmental change depends on its distribution between mineral-associated and particulate organic matter: A meta-analysis. Sci. Total Environ. 2021, 793, 148569. [Google Scholar] [CrossRef] [PubMed]
  15. Tang, B.; Rocci, K.S.; Lehmann, A.; Rillig, M.C. Nitrogen increases soil organic carbon accrual and alters its functionality. Glob. Chang. Biol. 2023, 29, 1971–1983. [Google Scholar] [CrossRef] [PubMed]
  16. Manzoni, S.; Taylor, P.; Richter, A.; Porporato, A.; Ågren, G.I. Environmental and stoichiometric controls on microbial carbon-use efficiency in soils. New Phytol. 2012, 196, 7991. [Google Scholar] [CrossRef]
  17. Nakhavali, M.A.; Lauerwald, R.; Regnier, P.; Friedlingstein, P. Predicting future trends of terrestrial dissolved organic carbon transport to global river systems. Earth’s Future 2024, 12, e2023EF004137. [Google Scholar] [CrossRef]
  18. Zhu, K.; Ran, H.; Wang, F.; Ye, X.; Niu, L.; Schulin, R.; Wang, G. Conservation tillage facilitated soil carbon sequestration through diversified carbon conservation. Agric. Ecosyst. Environ. 2022, 337, 108080. [Google Scholar] [CrossRef]
  19. Aditi, K.; Abbhishek, K.; Chander, G.; Singh, A.; Thomas Falk, T.; Mequanint, M.B.; Cuba, P.; Anupama, G.; Mandapati, R.; Nagaraji, S. Assessing residue and tillage management options for carbon sequestration in future climate change scenarios. Curr. Res. Environ. Sustain. 2023, 5, 100210. [Google Scholar] [CrossRef]
  20. Havlík, P.; Schneider, U.A.; Schmid, E.; Boettcher, H.; Fritz, S.; Skalský, R.; Aoki, K.; de Cara, S.; Kindermann, G.; Kraxner, F.; et al. Global land-use implications of first and second generation biofuel targets. Energy Policy 2011, 39, 5690–5702. [Google Scholar] [CrossRef]
  21. Kyker-Snowman, E.; Wieder, W.R.; Frey, S.D.; Grandy, A.S. Stoichiometrically coupled carbon and nitrogen cycling in the MIcrobial-MIneral Carbon Stabilization model version 1.0 (MIMICS-CN v1.0). Geosci. Model Dev. 2020, 13, 4413–4434. [Google Scholar] [CrossRef]
  22. Li, C.; Frolking, S.; Frolking, T.A. A model of N2O evolution from soil driven by rainfall events: 1. Model structure and sensitivity. J. Geophys. Res. 1992, 97, 9759–9776. [Google Scholar] [CrossRef]
  23. Balkovič, J.; Madaras, M.; Skalsky, R.; Folberth, C.; Smatanova, M.; Schmid, E.; van der Velde, M.; Kraxner, F.; Obersteiner, M. Verifiable soil organic carbon modelling to facilitate regional reporting of cropland carbon change: A test case in the Czech Republic. J. Environ. Manag. 2020, 274, 111206. [Google Scholar] [CrossRef]
  24. Balkovič, J.; van der Velde, M.; Schmid, E.; Skalský, R.; Khabarov, N.; Obersteiner, M.; Stürmer, B.; Xiong, W. Pan-European crop modelling with EPIC: Implementation, up-scaling and regional crop yield validation. Agric. Syst. 2013, 120, 61–75. [Google Scholar] [CrossRef]
  25. Jones, C.A.; Dyke, P.T.; Williams, J.R.; Kiniry, J.R.; Benson, V.W.; Griggs, R.H. EPIC: An operational model for evaluation of agricultural sustainability. Agric. Syst. 1991, 37, 341–350. [Google Scholar] [CrossRef]
  26. Jones, R.J.A.; Hiederer, R.; Rusco, E.; Loveland, P.J.; Montanarella, L. Estimating organic carbon in the soils of Europe for policy support. Eur. J. Soil. Sci. 2015, 56, 655–671. [Google Scholar] [CrossRef]
  27. Jones, J.W.; Antle, J.M.; Basso, B.; Boote, K.J.; Conant, R.T.; Foster, I.; Godfray, H.C.J.; Herrero, M.; Howitt, R.E.; Janssen, S.; et al. Toward a new generation of agricultural system data, models, and knowledge products: State of agricultural systems science. Agric. Syst. 2017, 155, 269–288. [Google Scholar] [CrossRef] [PubMed]
  28. Williams, J.R.; Jones, C.A.; Dyke, P.T. A modelling approach to determining the relationship between erosion and soil productivity. Trans. ASAE 1984, 27, 129–144. [Google Scholar] [CrossRef]
  29. Williams, J.R. The erosion productivity impact calculator (EPIC) model: A case history. Phil. Trans. Roy. Soc. 1990, 329, 421–428. [Google Scholar]
  30. Drummond, S.T.; Sudduth, K.A.; Joshi, A.; Birrell, S.J.; Kitchen, N.R. Statistical and neural methods for site-specific yield prediction. Trans. ASAE 2003, 46, 5. [Google Scholar] [CrossRef]
  31. Van Klompenburg, T.; Kassahun, A.; Catal, C. Crop yield prediction usingmachine learning: A systematic literature review. Comput. Electron. Agric. 2020, 177, 105709. [Google Scholar] [CrossRef]
  32. Lobell, D.B.; Burke, M.B. On the use of statistical models to predict crop yield responses to climate change. Agric. Forest Meteorol. 2010, 150, 1443–1452. [Google Scholar] [CrossRef]
  33. Micale, F.; Genovese, G. Methodology of the MARS Crop Yield Forecasting System; Statistical data collectoin, processing and analysis; EUR.; No. 21291 EN/4; EC: Luxenburg, 2004; Volume 4, ISBN 9789289481830. [Google Scholar]
  34. Zayani, H.; Fouad, Y.; Michot, D.; Kassouk, Z.; Baghdadi, N.; Vaudour, E.; Lili-Chabaane, Z.; Walter, C. Using Machine-Learning Algorithms to Predict Soil Organic Carbon Content from Combined Remote Sensing Imagery and Laboratory Vis-NIR Spectral Datasets. Remote Sens. 2023, 15, 4264. [Google Scholar] [CrossRef]
  35. Rosenzweig, C.; Jones, J.W.; Hatfield, J. The Agricultural Model Intercomparison and Improvement Project (AgMIP): Protocols and pilot studies. Agric. For. Meteorol. 2013, 170, 166–182. [Google Scholar] [CrossRef]
  36. Schlenker, W.; Roberts, M.J. Nonlinear effects of weather on corn yields. Rev. Agr. Econ. 2006, 28, 391–398. [Google Scholar] [CrossRef]
  37. Izaurralde, R.C.; Williams, J.R.; McGill, W.B.; Rosenberg, N.J.; Jakas, M.C.Q. Simulating soil C dynamics with EPIC: Model description and testing against long-term data. Ecol. Modell. 2006, 192, 362–384. [Google Scholar] [CrossRef]
  38. Causarano, H.J.; Doraiswamy, P.C.; McCarty, G.W.; Hatfield, J.L.; Milak, S.; Stern, A.J. EPIC Modeling of Soil Organic Carbon Sequestration in Croplands of Iowa; USDA-ARS/UNL Faculty: Washington, DC, USA, 2008; p. 1363. Available online: https://digitalcommons.unl.edu/usdaarsfacpub/1363 (accessed on 24 April 2024).
  39. Ermolieva, T.; Ermoliev, Y.; Havlik, P.; Lessa-Dersi-Augustynczik, A.; Kahil, T.; Balkovic, J.; Skalsky, R.; Folberth, C.; Knopov, P.S.; Wang, G. Connections between robust statistical estimation, robust decision making withtwo-stage stochastic optimization, and robust machine learning problems. Cybern. Syst. Anal. 2023, 59, 33–47. [Google Scholar] [CrossRef]
  40. Ermolieva, T.; Havlik, P.; Derci Augustynczik, A.L.; Boere, E.; Frank, S.; Kahil, T.; Wang, G.; Balkovič, J.; Skalský, R.; Folberth, C.; et al. A Novel Robust Meta-Model Framework for Predicting Crop Yield Probability Distributions Using Multisource Data. Cybern. Syst. Anal. 2023, 59, 844–858. [Google Scholar] [CrossRef]
  41. Liu, T.; Wang, L.; Feng, X.; Zhang, J.; Ma, T.; Wang, X.; Liu, Z. Comparing soil carbon loss through respiration and leaching under extreme precipitation events in arid and semiarid grasslands. Biogeosciences 2018, 15, 1627–1641. [Google Scholar] [CrossRef]
  42. Ermolieva, T.; Havlík, P.; Ermoliev, Y.; Mosnier, A.; Obersteiner, M.; Leclere, D.; Khabarov, N.; Valin, H.; Reuter, W. Integrated management of land use systems under systemic risks and security targets: A Stochastic Global Biosphere Management Model. J. Agric. Econ. 2016, 67, 584–601. [Google Scholar] [CrossRef]
  43. Ermolieva, T.; Havlik, P.; Frank, S.; Kahil, T.; Balkovic, J.; Skalsky, R.; Ermoliev, Y.; Knopov, P.S.; Borodina, O.M.; Gorbachuk, V.M. A Risk-Informed Decision-Making Framework for Climate Change Adaptation through Robust Land Use and Irrigation Planning. Sustainability 2022, 14, 1430. [Google Scholar] [CrossRef]
  44. FAO. Global Soil Partnership: RECSOIL, Recarbonization of Global Agricultural Soils; FAO: Rome, Italy, 2023; Available online: https://www.fao.org/global-soil-partnership/areas-of-work/recsoil/what-is-soc/en/ (accessed on 20 December 2023).
  45. Liptzin, D.; Norris, C.E.; Cappellazzi, C.B.; Bean, G.M.; Cope, M.; Greub, K.L.H.; Rieke, E.L.; Tracy, R.W.; Aberle, E.; Ashworth, A.; et al. An evaluation of carbon indicators of soil health in long-term agricultural experiments. Soil Biol. Biochem. 2022, 172, 108708. [Google Scholar] [CrossRef]
  46. European Commission. A Soil Deal for Europe; European Commission: Brussels, Belgium, 2021; Available online: https://research-and-innovation.ec.europa.eu/document/download/1517488e-767a-4f47-94a0-bd22197d18fa_en?filename=soil_mission_implementation_plan_final.pdf (accessed on 20 December 2023).
  47. Oldfield, E.E.; Bradford, M.A.; Wood, S.A. Global meta-analysis of the relationship between soil organic matter and crop yields. SOIL 2019, 5, 15–32. [Google Scholar] [CrossRef]
  48. Bruni, E.; Guenet, B.; Clivot, H.; Kaetterer, T.; Martin, M.; Virto, I.; Chenu, C. Defining quantitative targets for topsoil organic carbon stock increase in European croplands: Case studies with exogenous organic matter inputs. Front. Environ. Sci. 2020, 10, 824724. [Google Scholar] [CrossRef]
  49. Goidts, E.; van Wesemael, B. Regional Assessment of Soil Organic Carbon Changes under Agriculture in Southern Belgium (1955–2005). Geoderma 2007, 141, 341–354. [Google Scholar] [CrossRef]
  50. Meersmans, J.; Van Wesemael, B.; Goidts, E.; Van Molle, M.; De Baets, S.; De Ridder, F. Spatial Analysis of Soil Organic Carbon Evolution in Belgian Croplands and Grasslands, 1960-2006. Spat. Anal. Soil Org. Carbon Evol. 2011, 17, 466–479. [Google Scholar] [CrossRef]
  51. Smith, P.; Smith, J.U.; Powlson, D.S.; McGill, W.B.; Arah, J.R.M.; Chertov, O.G.; Coleman, K.; Franko, U.; Frolking, S.; Jenkinson, D.S.; et al. A comparison of the performance of nine soil organic matter models using datasets from seven long-term experiments. Geoderma 1997, 81, 153–225. [Google Scholar] [CrossRef]
  52. Guo, L.; Falloon, P.; Coleman, K.; Zhou, B.; Li, Y.; Lin, E.; Zhang, F. Application of the RothC model to the results of long-term experiments on typical upland soils in northern China. Soil Use Manag. 2007, 23, 63–70. [Google Scholar] [CrossRef]
  53. Gilhespy, S.L.; Anthony, S.; Cardenas, L.; Chadwick, D.; del Prado, A.; Li, C.; Misselbrook, T.; Rees, R.M.; Salas, W.; Sanz-Cobena, A.; et al. First 20 years of DNDC (DeNitrification DeComposition): Model evolution. Ecol. Model. 2014, 292, 51–62. [Google Scholar] [CrossRef]
  54. Li, C. Biogeochemical concepts and methodologies: Development of the DNDC model. Quat. Sci. 2001, 2, 89–99. [Google Scholar]
  55. Li, C.; Frolking, S.; Harriss, R. Modeling carbon biogeochemistry in agricultural soils. Glob. Biogeochem. Cycles 1994, 8, 237–254. [Google Scholar] [CrossRef]
  56. Parton, W.J.; Schimel, D.S.; Cole, C.V.; Ojima, D.S. Analysis of factors controlling soil organic matter levels in Great Plains grasslands. Soil Sci. Soc. Am. J. 1987, 51, 1173–1179. [Google Scholar] [CrossRef]
  57. Parton, W.J.; Scurlock, J.M.O.; Ojima, D.S.; Gilmanov, T.G.; Scholes, R.J.; Schimel, D.S.; Kirchner, T.; Menaut, J.-C.; Seastedt, T.; Garcia Moya, E.; et al. Observations and modelling of biomass and soil organic matter dynamics for the grassland biome worldwide. Glob. Biogeochem. Cycles 1993, 7, 785–809. [Google Scholar] [CrossRef]
  58. Müller, C.; Elliott, J.; Chryssanthacopoulos, J.; Arneth, A.; Balkovic, J.; Ciais, P.; Deryng, D.; Folberth, C.; Glotter, M.; Hoek, S.; et al. Global Gridded Crop Model evaluation: Benchmarking, skills, deficiencies and implications. Geosci. Model Dev. Discuss. (GMDD) 2016, 1–39. [Google Scholar] [CrossRef]
  59. Lembaid, I.; Moussadek, R.; Mrabet, R.; Bouhaouss, A. Soil organic carbon changes under alternative climatic scenarios and soil properties using DNDC model as a semi-arid Mediterranean environment. Climate 2022, 10, 23. [Google Scholar] [CrossRef]
  60. Kahil, M.T.; Dinar, A.; Albiac, J. Modeling water scarcity and droughts for policy adaptation to climate change in arid and semiarid regions. J. Hydrol. 2015, 522, 95–109. [Google Scholar] [CrossRef]
  61. Kahil, M.T.; Connor, J.D.; Albiac, J. Efficient water management policies for irrigation adaptation to climate change in Southern Europe. Ecol. Econ. 2015, 120, 226–233. [Google Scholar] [CrossRef]
  62. Schnecker, J.; Baldaszti, L.; Gündler, P.; Pleitner, M.; Sandén, T.; Simon, E.; Spiegel, F.; Spiegel, H.; Malo, C.U.; Zechmeister-Boltenstern, S.; et al. Seasonal dynamics of soil microbial growth, respiration, biomass, and carbon use efficiency in temperate soils. Geoderma 2023, 440, 116693. [Google Scholar] [CrossRef]
  63. Zheng, Q.; Hu, Y.; Zhang, S.; Noll, L.; Böckle, T.; Dietrich, M.; Herbold, C.W.; Eichorst, S.A.; Woebken, D.; Richter, A.; et al. Soil multifunctionality is affected by the soil environment and by microbial community composition and diversity. Soil Biol. Biochem. 2019, 136, 07521. [Google Scholar] [CrossRef] [PubMed]
  64. Pietikäinen, J.; Pettersson, M.; Bååth, E. Comparison of temperature effects on soil respiration and bacterial and fungal growth rates. FEMS Microbiol. Ecol. 2005, 52, 49–58. [Google Scholar] [CrossRef] [PubMed]
  65. Burke, I.C.; Yonker, C.M.; Parton, W.J.; Cole, C.V.; Schimel, D.S.; Flach, K. Texture, Climate, and Cultivation Effects on Soil Organic Matter Content in U.S. Grassland Soils. Soil Sci. Soc. Am. J. 1989, 53, 800. [Google Scholar] [CrossRef]
  66. Haddad, A.N. Evaluating the Relationship between Soil Texture and Soil Organic Carbon across California Grasslands. Soil Clay Content Soil Carbon 2017. Available online: https://nature.berkeley.edu/classes/es196/projects/2017final/HaddadA_2017.pdf (accessed on 4 January 2024).
  67. Bengough, A.G.; Bransby, M.F.; Hans, J.; McKenna SJRoberts, T.J.; Valentine, T.A. Root responses to soil physical conditions; growth dynamics from field to cell. J. Exp. Bot. 2006, 57, 437–447. [Google Scholar] [CrossRef]
  68. Soldatova, E.; Krasilnikov, S.; Kuzyakov, Y. Soil organic matter turnover: Global implications from δ13C and δ15N signatures. Sci. Total Environ. 2023, 912, 169423. [Google Scholar] [CrossRef]
  69. Wang, C.; Kuzyakov, Y. Soil organic matter priming: The pH effects. Glob. Chang. Biol. 2023, 30, e17349. [Google Scholar] [CrossRef] [PubMed]
  70. Mahal, N.K.; Osterholz, W.R.; Miguez, F.E.; Poffenbarger, H.J.; Sawyer, J.E.; Olk, D.C.; Archontoulis, S.V.; Castellano, M.J. Nitrogen Fertilizer Suppresses Mineralization of Soil Organic Matter in Maize Agroecosystems. Front. Ecol. Evol. 2019, 7, 59. [Google Scholar] [CrossRef]
  71. Smit, M.J.; van Leeuwen, E.S.; Florax, R.J.G.M.; de Groot, H.L.F. Rural development funding and agricultural labour productivity: A spatial analysis of the European Union at the NUTS2 level. Ecol. Indic. 2015, 59, 6–18. [Google Scholar] [CrossRef]
  72. Scholtz, R.; Tarasovičová, Z.; Balkovič, J.; Schmid, E.; Fuchs, M.; Moltchanova, E.; Kindermann, G.; Scholtz, P. GEOBENE Global Database for Bio-Physical Modeling. GEOBENE Project 2008. Available online: https://geo-bene.project-archive.iiasa.ac.at/files/Deliverables/Geo-BeneGlbDb10(DataDescription).pdf (accessed on 1 June 2023).
  73. Werner, M. Shuttle Radar Topography Mission (SRTM), Mission overview. J. Telecom. 2001, 55, 75–79. [Google Scholar] [CrossRef]
  74. Wösten, J.H.M.; Lilly, A.; Nemes, A.; Le Bas, C. Development and use of a database of hydraulic properties of Europen soils. Geoderma 1999, 90, 169–185. [Google Scholar] [CrossRef]
  75. Jones, R.J.A.; Hiederer, R.; Rusco, E.; Loveland, P.J.; Montanarella, L. The Map of Organic Carbon in Topsoils in Europe, Version 1.2, September 2003: Explanation of Special Publication Ispra 2004 No.72 (S.P.I.04.72); European Soil Bureau Research Report 2004, No.17, EUR 21209 EN, 26pp. and 1 map in ISO B1 format; Office for Official Publications of the European Communities: Luxembourg, 2003. [Google Scholar]
  76. IFA; IFD; IPI; PPI; FAO. Fertiliser Use by Crop; FAO: Rome, Italy, 2002. [Google Scholar]
  77. Wriedt, G.; van der Velde, M.; Aloe, A.; Bouraoui, F. A European irrigation map for spatially distributed agricultural modelling. Agric. Water Manag. 2009, 96, 771–789. [Google Scholar] [CrossRef]
  78. Rodríguez-Lado, L.; Martínez-Cortizas, A. Modelling and mapping organic carbon content of topsoils in an Atlantic area of southwestern Europe (Galicia, NW-Spain). Geoderma 2015, 245–246, 65–73. [Google Scholar] [CrossRef]
  79. Evans, C.D.; Monteith, D.T.; Cooper, D.M. Long-term increases in surface water dissolved organic carbon: Observations, possible causes and environmental impacts. Environ. Pollut. 2005, 137, 55–71. [Google Scholar] [CrossRef]
  80. Chen, Z.; Wei, X.; Ni, X.; Wu, F.; Liao, S. Changing presipitation effect on forest soil carbon dynamics is driven by different attributes between dry and wet areas. Geoderma 2023, 429, 116279. [Google Scholar] [CrossRef]
  81. Poeplau, C.; Bolinder, M.A.; Eriksson, J.O.; Lundblad, M.; Kätterer, T. Increasing organic carbon stocks in Swedish agricultural soils due to unexpected socio-economic drivers. Geophys. Res. Abstr. 2015, 17, EGU2015-9264. [Google Scholar]
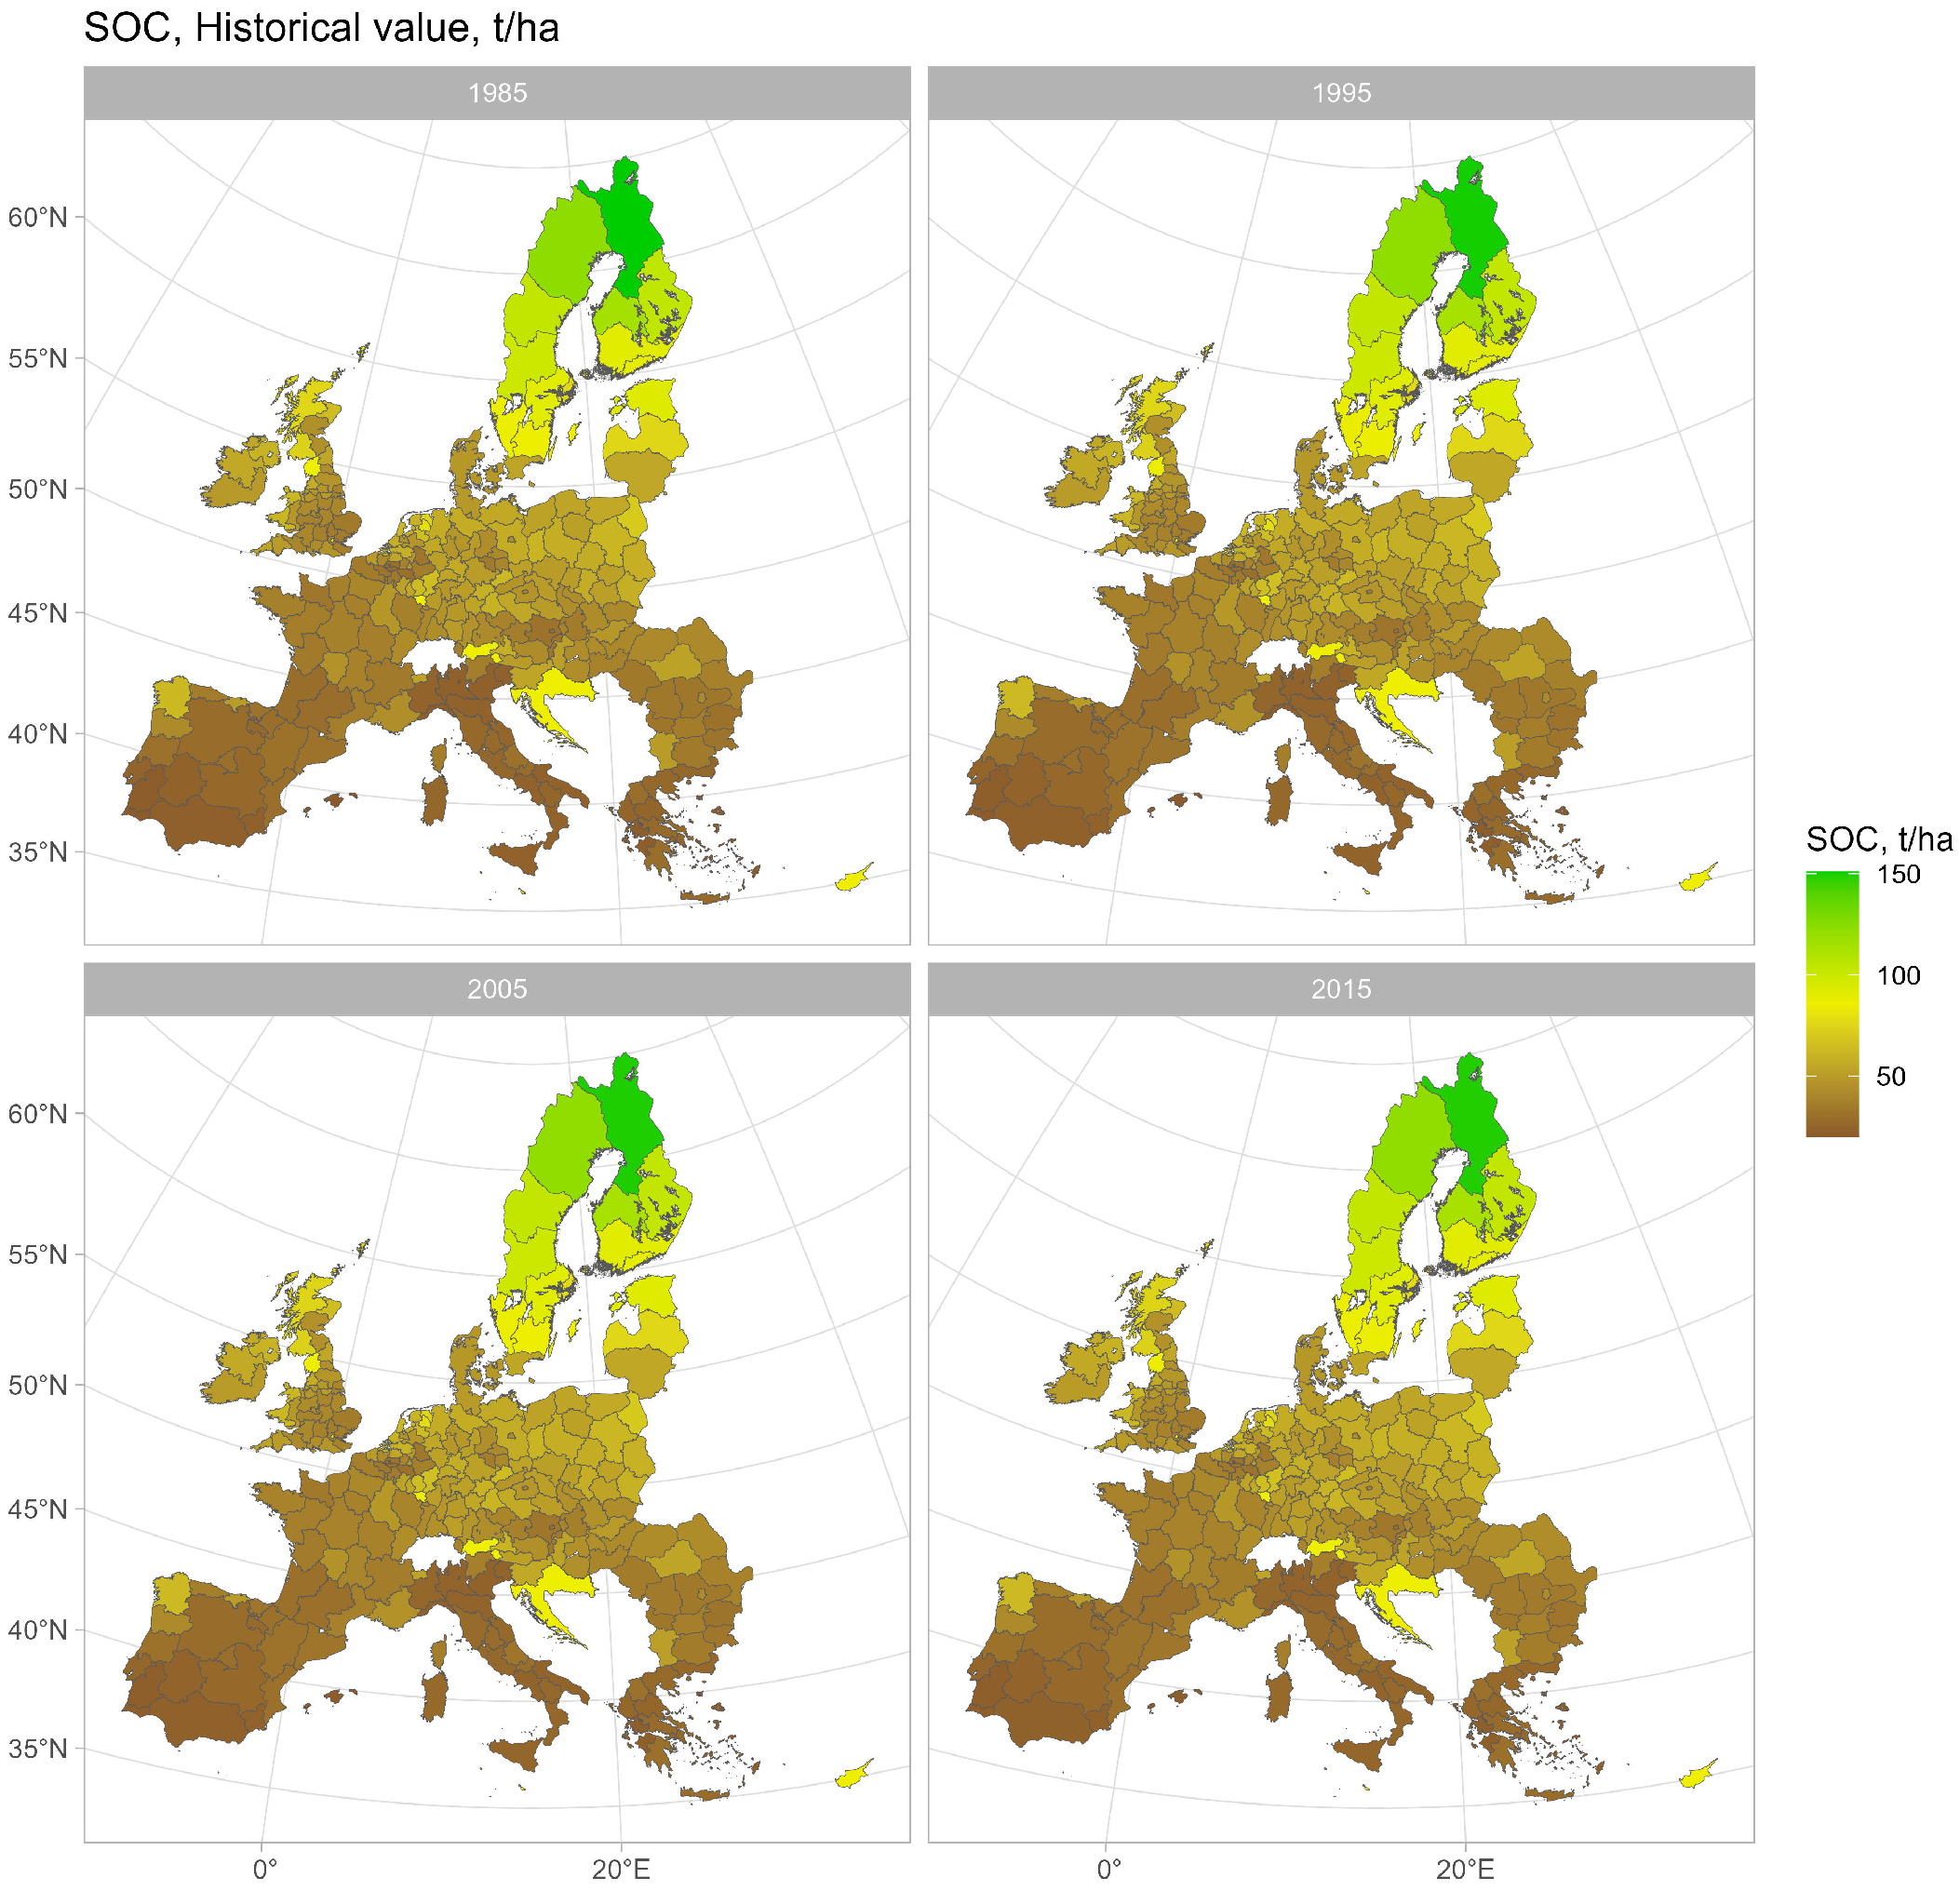
Figure 1. Historical SOC for NUTS2 regions from 1980 to 2000.
Sustainability 16 06849 g001
Figure 2. Percentage difference between the linear regression estimates and the historical SOC content for NUTS2 regions from 1980 to 2000.
Sustainability 16 06849 g002
Figure 3. Mean value of the SOC content change for 1980–2000.
Sustainability 16 06849 g003
Figure 4. Percentage difference between the 50th quantile and the mean value of the SOC content change for NUTS2 regions from 1980 to 2020.
Sustainability 16 06849 g004
Figure 5. The 75th quantile of the SOC content changes between the consequent years for NUTS2 regions.
Sustainability 16 06849 g005
Figure 6. The 25th quantile of the SOC content changes between the consequent years for NUTS2 regions.
Sustainability 16 06849 g006
Figure 7. The SOC change dynamics, in t/ha, Finland, by NUTS2 region, between consequent years from 1980 to 2000.
Sustainability 16 06849 g007
Figure 8. The SOC change dynamics, in t/ha, Sweden, by NUTS2 region, between consequent years from 1980 to 2020.
Sustainability 16 06849 g008
Figure 9. The SOC change dynamics, in t/ha, France, by NUTS2 region, between consequent years from 1980 to 2020.
Sustainability 16 06849 g009
Figure 10. The SOC change dynamics, in t/ha, Germany, by NUTS2 region, between consequent years from 1980 to 2020.
Sustainability 16 06849 g010
Figure 11. The SOC change dynamics, in t/ha, Italy, by NUTS2 region, between consequent years from 1980 to 2020.
Sustainability 16 06849 g011
Figure 12. The SOC change dynamics, in t/ha, Spain, by NUTS2 region, between consequent years from 1980 to 2020.
Sustainability 16 06849 g012
Disclaimer/Publisher’s Note: The statements, opinions and data contained in all publications are solely those of the individual author(s) and contributor(s) and not of MDPI and/or the editor(s). MDPI and/or the editor(s) disclaim responsibility for any injury to people or property resulting from any ideas, methods, instructions or products referred to in the content.