Article

Green Supply Chain Management Practices and Organizational Performance: A Mediated Moderation Model with Second-Order Constructs

by
Mohitul Ameen Ahmed Mustafi
1,*,
Ya-Juan Dong
1,
Md Sajjad Hosain
2,*,
Mohammad Bin Amin
3,*,
Md. Atikur Rahaman
4 and
Masuk Abdullah
5
1
Department of Logistic Engineering & Management, Chang’an University, Middle-Section of Nan’er Huan Road, Xi’an 710064, China
2
Department of Business Administration, University of Science and Technology Chittagong, Zakir Hossain Road, Chattogram 4202, Bangladesh
3
Károly Ihrig Doctoral School of Management and Business, Faculty of Economics and Business, University of Debrecen, Böszörményi út 138, 4032 Debrecen, Hungary
4
School of Economics and Management, Jiujiang University, 551 Qianjin Donglu, Jiujiang 332005, China
5
Faculty of Engineering, University of Debrecen, Ótemető Street, 2–4, 4028 Debrecen, Hungary
*
Authors to whom correspondence should be addressed.
Sustainability 2024, 16(16), 6843; https://doi.org/10.3390/su16166843
Submission received: 8 June 2024 / Revised: 26 July 2024 / Accepted: 6 August 2024 / Published: 9 August 2024

Abstract

:
This study highlights the rising significance of green supply chain management practices (GSCMPs) in elevating organizational performance (OP) within the Bangladeshi manufacturing sector. GSCMPs, structured as the single second-order independent construct, were formed by three first-order independent constructs: green eco-design (GED), green supply chain partnering (GSCP), and internal green orientation (IGO). This study proposes that GSCMPs can contribute to the overall OP, structured as the single second-order dependent construct, comprising financial performance (FP), marketing performance (MP), and environmental performance (EP) as its first-order dependent constructs. Furthermore, this research involved the mediating role of perceived competitive advantage (PCA) on the relationship between GSMPs and OP as well as the moderating role of supply chain leadership skill (SCLS) on the relationship between PCA and OP. Primary data were gathered from 340 Bangladeshi respondents involved in higher-level and mid-level management roles at different manufacturing firms using a structured survey questionnaire. Partial least square-based structural equation modeling (PLS-SEM) was employed for statistical analysis using Smart-PLS 4.0. GSCMPs exhibited a significant positive correlation with OP. Additionally, PCA was found to partially mediate the relationship between GSCMPs and OP, while SCLS was found to strengthen the positive relationship between PCA and OP. This study explores the GSCMPs-OP nexus in the Bangladeshi manufacturing sector, aiming to inspire further theoretical and empirical studies. The findings offer insights for policymakers and managers in formulating and executing GSCM-related policies and strategies.

1. Introduction

Supply chain management (SCM) is the process of managing the operational activities that occur outside the firm’s borders, such as the extraction and conversion of raw materials from suppliers, the production of finished goods, and the delivery of those finished goods to wholesalers, retailers, and final consumers [1]. Different supply chains are used to manage the design, manufacture, marketing, and delivery of items to end customers based on the kind and distinctiveness of the products [2]. The green supply chain distinguishes itself from the conventional supply chain by considering the environmental consequences in supply chain operations and decision-making processes related to production [3]. The green supply chain undertakes several tasks, including extracting green/environment-friendly raw materials, recycling or reusing the raw materials or by-products, producing completed/semi-completed items, and distributing, storing, and packing products in an environment-friendly manner, with the ultimate goal of minimizing environmental damage. Thus, the green supply chain includes reducing carbon emissions, optimizing energy and natural resource utilization [3,4,5,6,7].
Green supply chain management (GSCM) has emerged as a novel organizational philosophy whereby firms can accept and adapt to environment-centric business strategies to achieve economic goals by reducing their negative environmental impacts and improving their environmental efficiency [8]. Greening the supply chain operations and activities can increase competitive and cooperative advantages, resulting in increased competitiveness and financial performance [8,9]. To maintain the balance between financial, operational, and environmental performance, the GSCM approach must be developed and implemented [10]. Numerous studies on GSCM have been conducted, but many of those studies focus on the Western perspective. Thus, there is a need for more empirical studies from the perspectives of developing countries like India, Bangladesh, Sri Lanka, Vietnam, etc.
Global SCM practices have been implemented by numerous manufacturing firms over the past 20 years to enhance their competitive edge in the global market [11]. An increasing number of manufacturing firms are currently putting more importance on environmental objectives and engaging in GSCM practices, including eco-design, sustainable sourcing, recycling, and re-manufacturing [12]. Several developed countries in North America, Europe, and Australia have implemented legal requirements for manufacturers that regulate the recovery, reuse, and disposal of used products and packaging. This regulation system has resulted in the emergence of terms such as “reverse logistics”, “closed-loop supply chains”, and “green supply chains” [3,13]. There is a heightened level of awareness among business firms, governments, and consumers about the significance of environmental preservation and the decrease in pollution [14,15,16]. However, manufacturing firms in developing countries such as China, India, Brazil, and Bangladesh are still placing comparatively less emphasis on environmental protection [3,14,17], although customers, governments, and social and civil groups are putting continuous pressure on firms to be environmentally conscious [18]. Thus, by adopting GSCM practices (GSCMPs), manufacturing firms can have several competitive advantages over their rivals [18].
GSCMPs are particularly beneficial for developing countries, where pollution is a leading cause of death, disability, and poor health for millions of people every year [19]. A high level of pollution plagues developing countries because of poverty, insufficient investments in innovative technology, lack of environmental legislation, and rapid/unplanned industrialization [19]. As a result, there is an urgent need to focus on strategies to improve the GSCM’s performance [20]. However, there is still a large gap in the literature [3,14] regarding GSCMP-related studies. The extent to which GSCMPs contribute to organizational performance (OP) is also unclear in the existing literature, especially in the context of a developing economy such as that of Bangladesh [21]. A manufacturing firm’s top management priority has historically been and continues to be its financial performance (FP) [22]. Similarly, most studies consider GSCMPs to be significantly related to financial performance [9,23], while a few studies [24,25,26] do not. Several studies have found that GSCMPs can provide a “win-win” situation for any firm by improving both environmental and financial performance [9], whereas a few other studies [27,28] have found the opposite to be true.
However, numerous researchers have rarely examined two other dimensions of performance, namely, marketing performance (MP) and environmental performance (EP) [20,27]. There is very little concrete evidence in the existing literature that identifies the relationships between GSCMPs and different organizational performance (such as environmental, marketing, and financial) in a single research framework [3,14,21]. The performance of top management in South Asian countries is generally measured by its financial performance [29], while that of middle management is measured by its operational performance [30]. The assessment of a manager’s commitment to green practices must be based on how environmental and marketing performance improve and how those performance affect their financial performance [31]. Thus, GSCMPs must be evaluated to determine if such practices improve financial, marketing, and environmental performance. Economic, operational, and environmental performance should also be aligned with each other. In this particular regard, the impact of GSCMPs on the managers and policymakers of Bangladeshi manufacturing firms is unclear [21]. A highly uncertain environment makes it difficult for most business firms to adopt/implement GSCMPs [16]. Accordingly, this research aims to determine the relationship between GSCMPs, i.e., the single independent second-order construct formed by three independent first-order constructs, green eco-design (GED), green supply chain partnering (GSCP), and internal green orientation (IGO), and OP, i.e., the single dependent second-order construct formed by three dependent first-order constructs, namely, FP, MP, and EP.
The manufacturing sector of Bangladesh is growing steadily. According to a report produced by the Bangladesh Bureau of Statistics (BBS), under the Ministry of Planning, the manufacturing sector of Bangladesh accounted for 28.79% of the Gross Domestic Product (GDP) in 2020 [32]. Due to the increasing social and public awareness as well as pressure from suppliers and buyers, Bangladeshi manufacturing firms, in particular, have recently started to understand the strategic value of GSCMPs to achieve the overall OP and to gain competitive advantages [30,33,34]. However, empirical studies focusing on the role of GSCMPs on OP of Bangladeshi manufacturing firms are still quite rare, despite being a fast-growing export-based economy [30,33].
Although GSCMPs can evidently increase the competitive advantage of a firm over its rivals, the use of competitive advantage as perceived by managers is quite rare in academia [3]. According to the few available studies, firms that adopt/comply/practice GSCMPs or are environmentally conscious have a better reputation among customers, suppliers, environmental agencies, and government regulators compared to their rivals [3]. Considering its importance, we included perceived competitive advantage (PCA) as a mediator on the relationship between GSCMPs and OP. In addition, this study considered a novel variable, i.e., supply chain leadership skill (SCLS), as a moderator on the relationship between PCA and OP. In this regard, Chen [35] argues that SCLS can increase the overall OP of a firm. On the other hand, Purwantoa and Julianaa [36] identified the existence of a significant relationship between transformational SCLS and supply chain performance, ultimately leading to OP. With the overarching goal of improving OP, we put forward the following research questions for this empirical study:
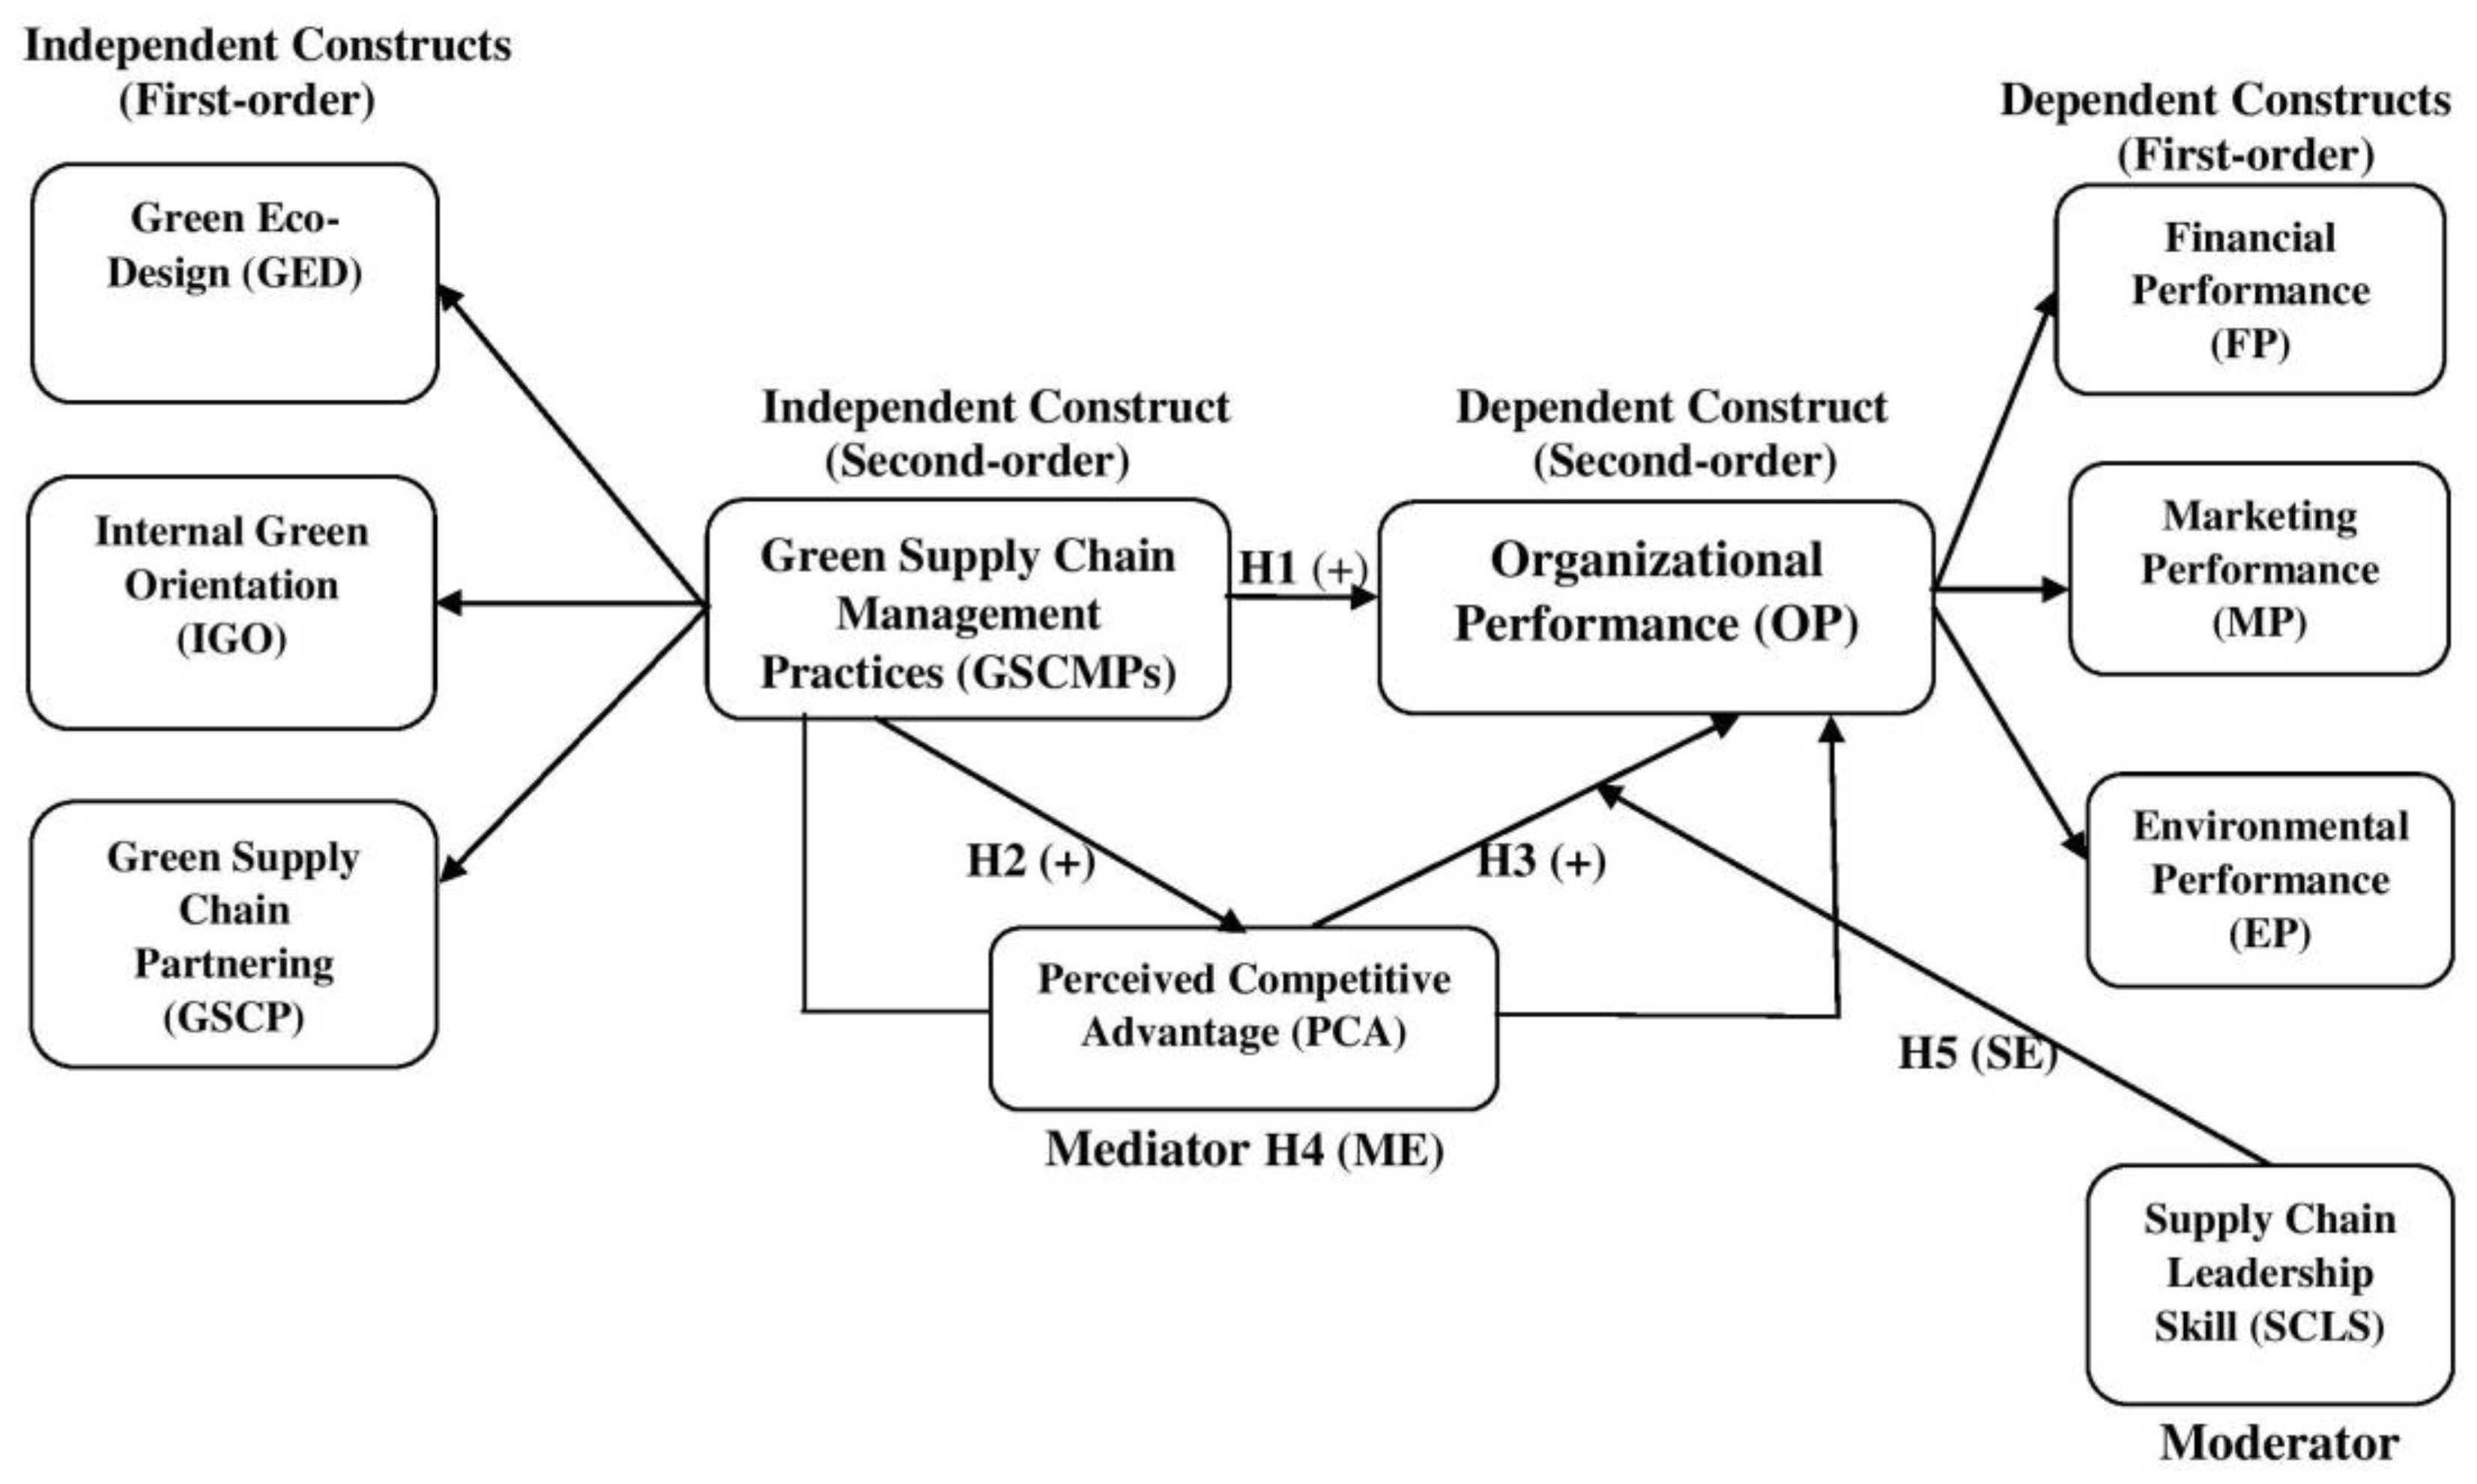
  • RQ1: What is the relationship between green supply chain management practices (as the single second-order independent construct) and organizational performance (as the single second-order dependent construct)?
  • RQ2: What is the mediating role of perceived competitive advantage on the relationship between green supply chain management practices and organizational performance?
  • RQ3: Can supply chain leadership skill moderate (strengthen) the relationship between perceived competitive advantage and organizational performance?
This paper has several sections. Section 1 introduces this study, along with its rationale based on the existing research gap. Section 2 reviews the relevant literature associated with pertinent constructs/variables. Section 3 explains the research methodology, while the Section 4 analyzes and interprets the results. Section 5 compares the study outcomes to the earlier findings reported by researchers. Section 6 highlights the study implications (theoretical and practical), while Section 7 highlights the limitations of this study and the scope of additional research. Finally, Section 8 concludes this paper.

2. Literature Review

This section contains the literature relevant to the constructs/variables and the interrelationships between those constructs/variables according to previous studies. This section is divided into multiple sub-sections in order to indicate the relationships between the constructs/variables.

2.1. OP

OP encompasses the comprehensive attainment of financial and market-oriented objectives within a firm [37]. The short-term goals of OP encompass enhancing productivity, minimizing inventory, and shortening cycle times, while long-term aspirations entail augmenting market share and profitability for all the stakeholders of a firm [38]. Although financial metrics serve as the benchmarks for comparing the business firms and assessing performance trends over time [39], every firm should emphasize on enhancing the overall OP that includes environmental, financial, operational, and marketing performance. However, this research indicates that OP is the single second-order dependent construct, which is the aggregate outcome of three first-order dependent constructs: FP, MP, and EP.

2.1.1. FP

FP can be normally measured by a firm’s financial abilities, such as operational income, return on investment (ROI), and return on assets (ROA). It is one of the most important dimensions of the overall OP of a firm. According to Arefin and Hosain [22], a manufacturing firm’s top management priority has historically been and continues to be FP, while a service-oriented firm’s priority has been both financial and operational efficiency. In this study, FP is one of the three first-order dependent constructs of aggregate OP (second-order dependent construct).

2.1.2. MP

MP is the link between a marketing team’s predetermined goal and actual performance. In general, it is measured by using several key performance indices (KPIs) such as cost per sale, cost per lead, customers’ lifetime value, customers’ loyalty, and many more. The measurement of MP is data-driven, focusing on the realizable results that are related to sales, brand value, and customer loyalty [20,27]. In this study, MP is one of the three first-order dependent constructs of aggregate OP (second-order dependent construct).

2.1.3. EP

EP is the outcome of a firm’s commitments and actions towards the environment and society. For example, a firm may use green energy or recycled products or source a green supply chain through inbound and outbound logistics. However, such performance is not always measurable in terms of a numerical value but is reflected in the eyes of external stakeholders such as local people, customers, and government regulatory agencies [18]. In this study, EP is one of the three first-order dependent constructs of aggregate OP (second-order dependent construct).

2.2. GSCMPs

GSCMPs include are the green and environment-friendly business policies and practices that help a firm achieve its economic goals by reducing negative environmental impacts and improving its environmental efficiency [8]. In this study, GSCMPs is the single second-order independent construct, formed as the aggregate outcome of three first-order independent constructs: GED, GSCP, and IGO.

2.2.1. GED

GED, often referred to as “design for the environment”, denotes the degree to which firms develop products and/or manufacturing processes with a reduced negative environmental impact [40]. It constitutes a long-term pollution mitigation strategy involving product design for ease of disassembly, re-manufacturing, or recycling, encompassing various environment-friendly measures throughout the product’s life cycle, including proper disposal. A GED-focused supply chain approach offers firms several advantages over their competitors, such as the production of more robust products and the design of items or processes with lower energy consumption or reduced pollutant waste. The successful implementation of such GSCMPs necessitates investment in infrastructure, including technology and human resources, and effective coordination with customers and suppliers [41,42].

2.2.2. GSCP

Establishing strong supplier connections is generally recognized as a fundamental aspect of supply chain design and a valuable source of competitive advantage, which is widely acknowledged in the literature [43,44]. These partnerships aim to generate value for all parties involved, entailing an exchange of mutually beneficial “value packages” [45]. Although extensive research studies have been conducted to determine which factors contribute to effective partnerships [46,47], the potential impact of environmental and ethical behavior in this context has not been thoroughly explored through empirical studies. Consequently, managers faced with decisions about adopting sustainable SCM practices may not know whether integrating environmental and ethical behavior will enhance or impede the positive effects of GSCMPs.

2.2.3. IGO

From a resource-based perspective, a firm’s strategic orientation, such as environmental orientation, can be regarded as a valuable intangible asset guiding strategic actions, thus enhancing overall firm performance [48]. Previous studies conducted by marketing and business scholars have provided empirical support for this proposition. For instance, Murray et al. [49] discovered that firms involved in export ventures in China exhibiting higher levels of marketing orientation are inclined to undertake strategic initiatives like pricing, new product development, and marketing communication.

2.3. GSCMPs and OP

Although numerous studies have investigated GSCMPs over the last two decades, particularly in the manufacturing sectors in Asian countries, empirical studies linking GSCMPs and OP remain scarce in specialized sectors like the shipping industry [50]. Cost advantages over competitors can be gained by embracing early technology adoption and devising innovative solutions to environmental challenges [42]. However, the literature reveals a lack of consensus regarding the effects of GSCMPs on OP in manufacturing firms, possibly due to sample heterogeneity or the exclusion of key variables like green marketing [3]. Testa and Iraldo [51] found no conclusive evidence of the relationship between GSCMPs and OP in OECD countries, while Rao and Holt [52] demonstrated a positive impact of GSCMPs on the sales and profitability of Asian manufacturing firms. These conflicting findings necessitate the demand for further investigation into the influence of GSCMPs on OP.
Implementing GSCMPs is imperative for manufacturing firms, particularly those in developing nations grappling with pollution-related health concerns [19]. Research suggests that GSCMPs can enhance OP by fostering customer loyalty, bolstering brand reputation, and facilitating differentiation from competitors [53,54,55]. Moreover, initiatives such as eco-design and sustainable sourcing under GSCMPs can spur the creation of environment-friendly products, appealing to environmentally conscious consumers [21]. Additionally, GSCMPs can enhance supply chain visibility and transparency, thereby augmenting customers’ trust and satisfaction [53]. Nevertheless, the relationship between GSCMPs and OP may be complex and influenced by multiple external factors like industry characteristics, firm size, and market orientation [55]. Given the significant resource investment required, firms must diligently weigh the costs and benefits before embarking on GSCM initiatives [54].
Therefore, acknowledging the critical role of GSCMPs in fostering sustainable business operations, research confirms their positive impact on both environmental conservation and firm performance [56]. Studies indicate that GSCMPs are associated with enhanced financial, operational, and environmental performance [9]. Zhu et al. [57] found that market and regulatory pressures contribute to improved EP, while competitive pressure enhances economic benefits without compromising EP, offering strategic insights for operational planners and sustainability advocates. In addition, GSCMPs have been shown to drive green innovation and EP, with green innovation mediating the relationship between GSCMPs and EP [58,59]. Pagell and Wu [60] developed a sustainable supply chain model based on case studies of 10 firms, emphasizing both social and environmental outcomes and incorporating a blend of traditional and innovative SCM practices. Based on the above literature, the present study proposes to examine the following research hypothesis:
Hypothesis 1 (H1).
Green supply chain management practices (as the single second-order independent construct) has a positive relationship with organizational performance (as the single second-order dependent construct).

2.4. PCA

Competitive advantage refers to a firm’s capacity to secure a defensible edge over its competitors [61], stemming from pivotal management decisions and encompassing competencies that enable differentiation from its rivals [62]. The empirical literature identifies price/cost, quality, delivery, and flexibility as fundamental competitive capabilities [62,63]. Moreover, several studies [64,65,66,67] highlight time-based competition as a critical competitive priority, where “time” emerges as the next significant source of advantage.
Tracey et al. [62] proposed a framework for competitive capabilities, delineating five characteristics based on the existing literature: competitive price, premium pricing, value-to-customer quality, dependable delivery, and product innovation. This study adopts aspects of competitive advantage structures such as price/cost, quality, delivery dependability, product innovation, and time to market, as outlined by Tracey et al. [62]. Consequently, PCA in this study reflects managerial perceptions regarding firms’ proficiency in these aspects, serving as the proposed mediator. The following research hypotheses are proposed for testing:
Hypothesis 2 (H2).
Perceived competitive advantage has a positive relationship with green supply chain management practices.
Hypothesis 3 (H3).
Perceived competitive advantage has a positive relationship with organizational performance.
Hypothesis 4 (H4).
Perceived competitive advantage can mediate the positive relationship between green supply chain management practices and organizational performance.

2.5. SCLS

This study introduces a variable that has received little to no research attention, namely, SCLS, as a moderator. According to Zhu et al. [15], effective supply chain leadership may mitigate the adverse impacts of supply chain risks through superior competitive advantage. Conversely, Lee et al. [68] posit that supply chain leadership can moderate the relationship between supply chain performance and innovation. These findings imply that a robust SCLS can strengthen the positive association between supply chain performance and organizational agility.
Additionally, Liu et al. [69] suggest that SCLS moderate the link between supply chain transparency and performance. Drawing from these limited studies on SCLS, it is inferred that proficient SCLS can enhance supply chain performance by adding superior competitive advantage over the rivals, thereby positively impacting a firm’s overall OP by facilitating the interactions between various supply chain factors. In this empirical investigation, we propose that proactive and robust SCLS can enhance competitive advantage(s) and that competitive advantage(s) later elevate OP through the interplay of diverse supply chain elements, including GSCMPs. Consequently, we propose to examine the following research hypothesis:
Hypothesis 5 (H5).
Supply chain leadership skill can moderate (strengthen) the positive relationship between perceived competitive advantage and organizational performance.

2.6. Conceptual Framework
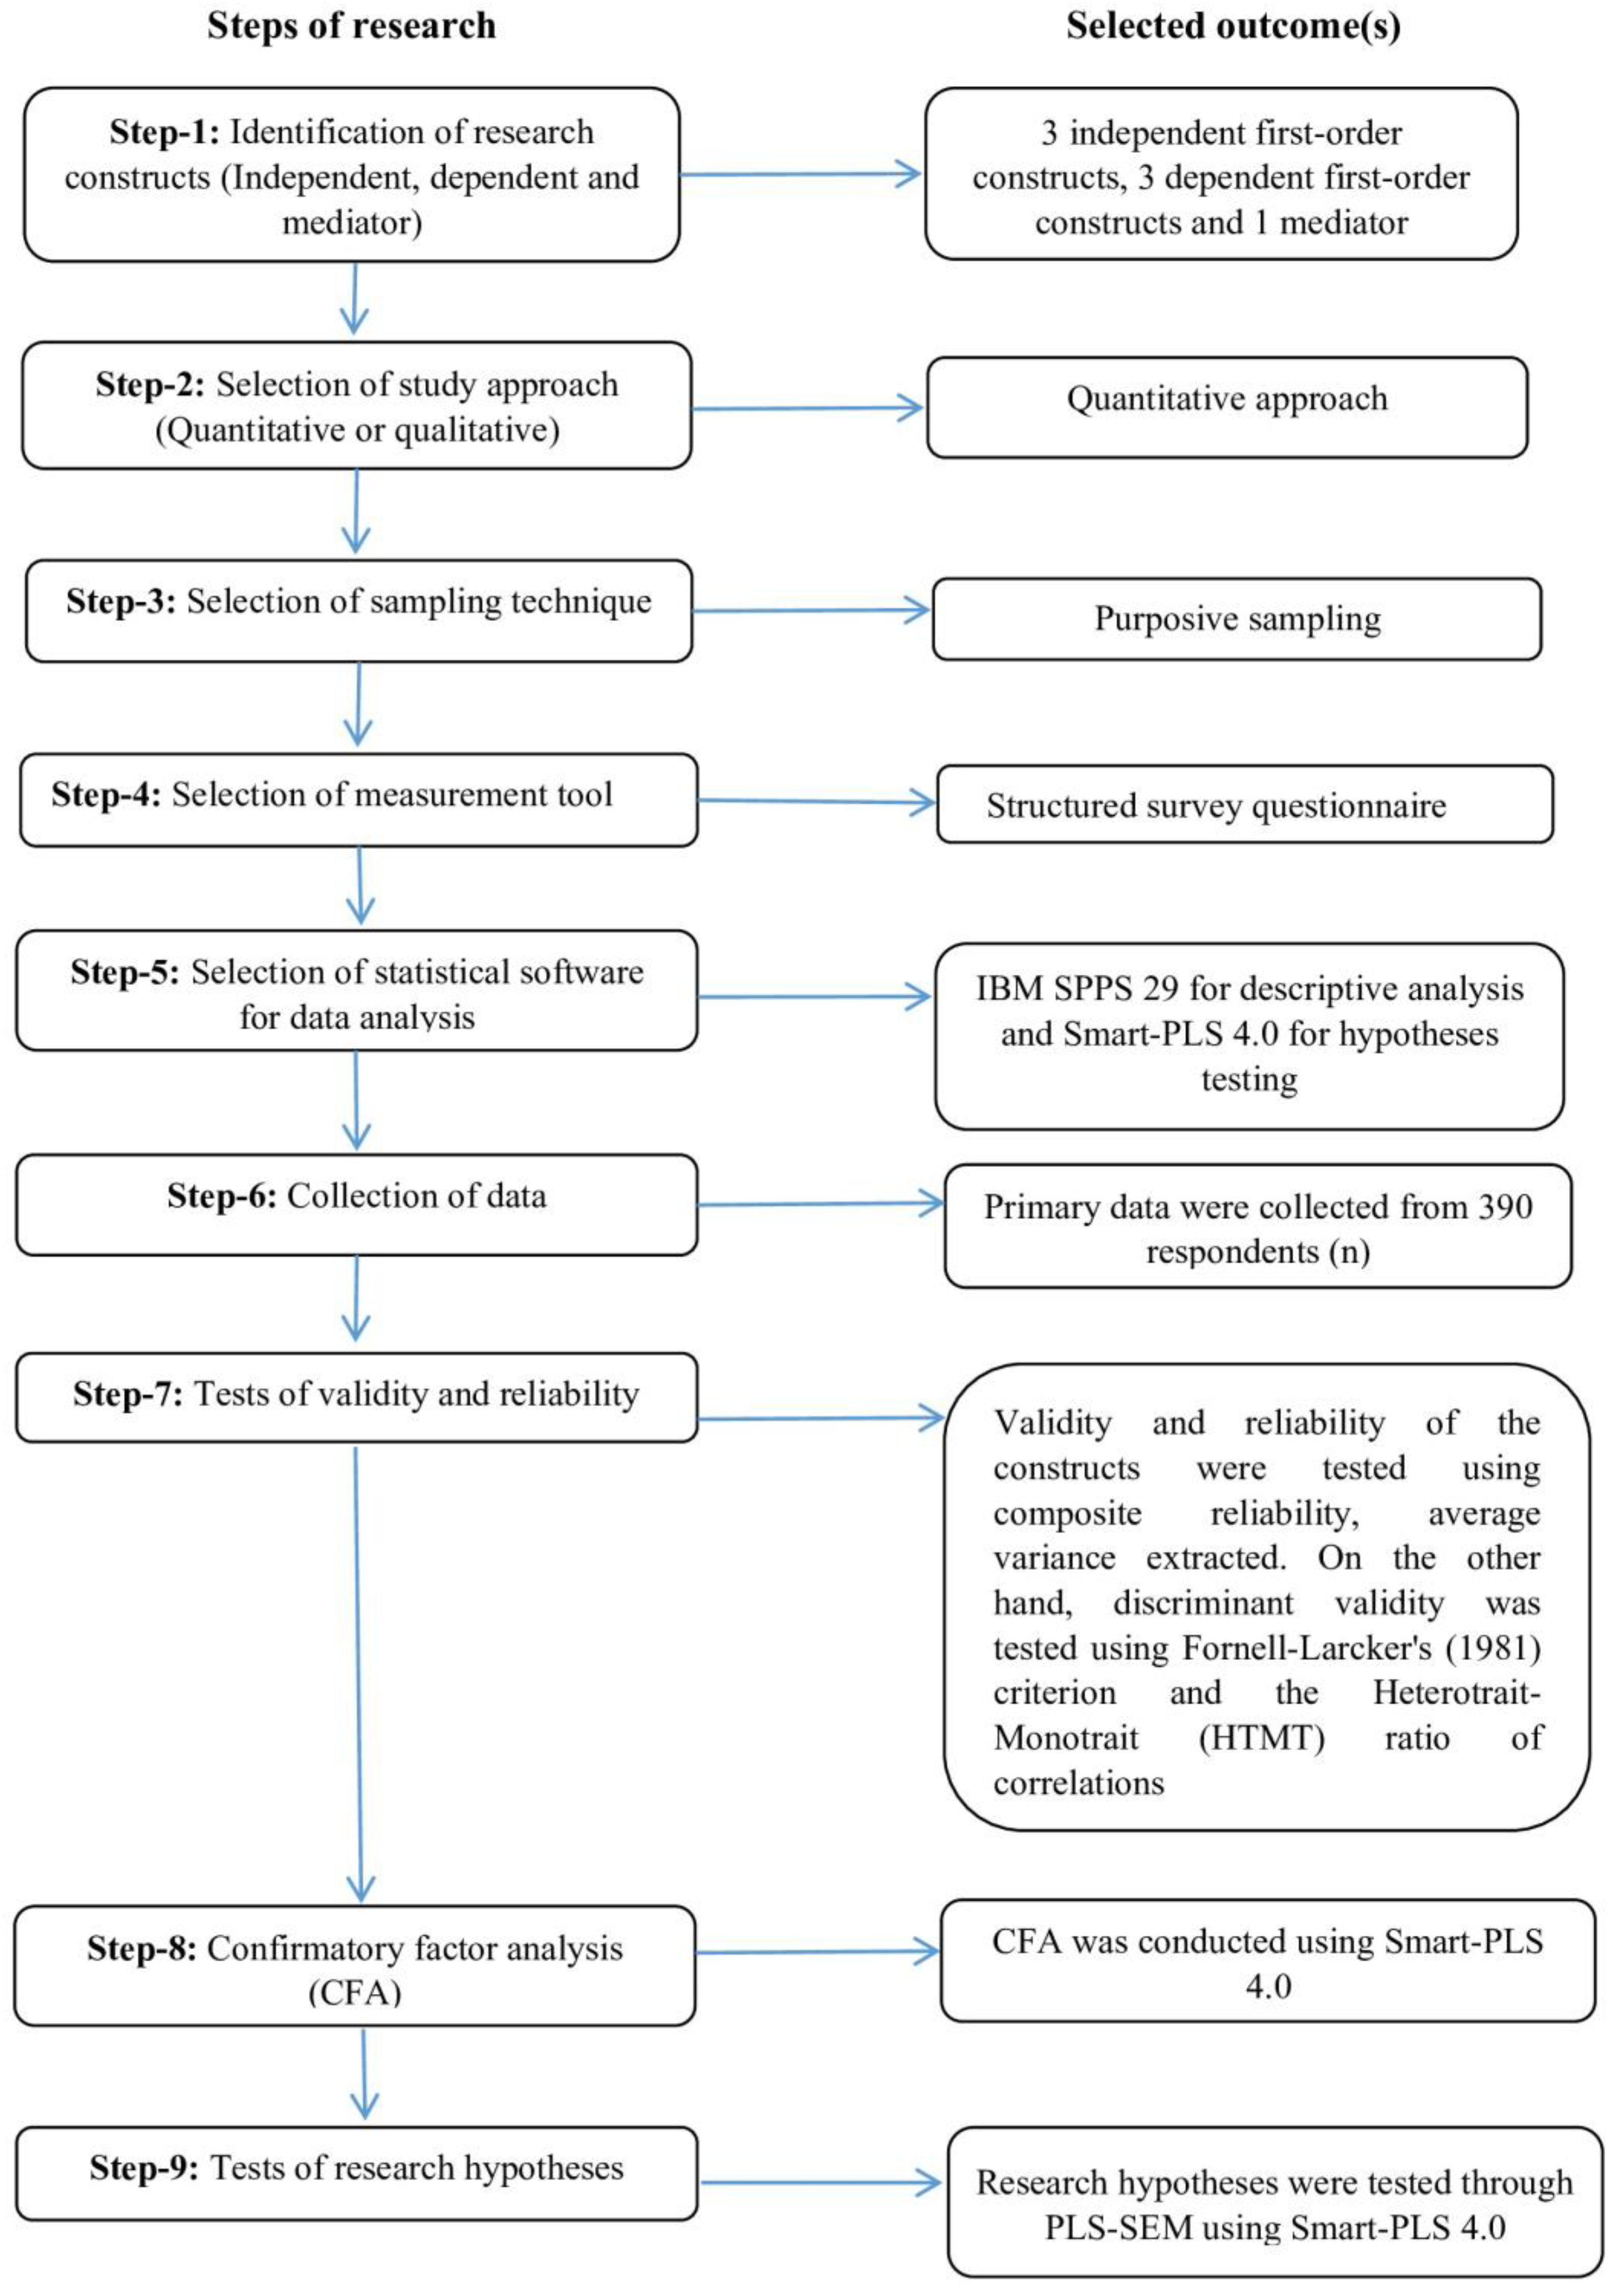
The conceptual model of this empirical study has been shown in Figure 1. In this empirical study, three independent first-order constructs (GED, GSCP, and IGO) formed the aggregated second-order independent construct (GSCPMs) while three dependent first-order constructs (FP, MP, and EP) formed the aggregated second-order dependent construct, i.e., OP. In this study, PCA was considered the single mediator, while SCLS was considered as the single moderator.

3. Research Method

The overall research methodology from the beginning to the end is presented in the following flowchart. It should be noted that the steps are interconnected in order to maintain a logical flow of this study’s methodology.
Figure 2 indicates the chronological order of the research method that we followed in this study. As mentioned above, the steps are interrelated and systematic.

3.1. Nature of Data, Selection of Respondents, and Sampling Technique

In this empirical study, primary data were chosen over secondary information as the latter was deemed unsuitable for this perception-based investigation. Specifically, perception-based primary data were collected from the highest-level and mid-level managers of 61 different manufacturing firms in Bangladesh, covering almost all the manufacturing sub-sectors. The data were collected between June 2023 and December 2023. We obtained a “Consent of Participation Letter” from each study respondent and an “Organizational Approval Letter” from each firm where the respondents worked at the time of data collection. We selected our respondents from almost all the manufacturing sub-sectors (such as cement) in our study. Such a balanced selection of respondents considering all the manufacturing sub-sectors of Bangladesh is expected to make a representative sample pool.
We used the purposive sample strategy to choose respondents carefully, considering the unique aim of this research. Purposive sampling is particularly appropriate when the researchers want to obtain certain types of data from a particular subset of respondents, either because they possess exclusive knowledge or satisfy specific criteria set by the researchers [70]. This sampling method is especially advantageous when researchers want to choose a sample that fulfills specific criteria [71]. Therefore, we chose purposive sampling to deliberately collect data from respondents who could provide complete insights on GSCMPs, OP, PCA, and SCLS.

3.2. Measurement Tool

We devised and employed a “structured survey questionnaire” to gather data from the respondents, utilizing a “5-point Likert scale” ranging from 1 to 5, where 1 stood for “Strongly Disagree” and 5 stood for “Strongly Agree”. The questionnaire comprised a total of 35 items, addressing 8 factors (Appendix B). Due to the geographical dispersion of the study respondents, the questionnaire link was distributed to them via “Google Forms” after they consented to participate in this study. The respondents received thorough instructions regarding the survey items to ensure clarity and facilitate the ease of completion.

3.3. Sample Size (n)

Initially, 350 respondents were identified through personal contacts, comprising CEOs and other top-level managers as well as mid-level managers from 61 diverse manufacturing firms in Bangladesh (Appendix A). Subsequently, all completed questionnaires were collected via Google Forms. Following a screening process, 10 questionnaires were deemed incomplete, biased, and/or faulty and were consequently excluded from the analysis. Hence, the final sample size (n) comprised 340 respondents.

4. Analysis and Interpretation

4.1. Demographic Profile

Table 1 displays the demographic information of the selected respondents, such as gender, age group, education, job title, and years of experience at the same firm, gathered from the survey responses.
According to Table 1, almost all the respondents (94.41%) were male, and about half of them (47.36%) were aged between 50 and 59 years. Almost all of them (99.12%) had a Master’s degree, while only three of them had PhD degrees. Among the respondents, 79.41 (17.06 + 62.35) were CEOs and other top-level managers (such as chief operational officer). Finally, it was identified that more than half (57.94%) of those respondents served at the same organization for 20 to 29 years.

4.2. Univariate Normality of the Data

The latent factor indices that we used had a high normal distribution in terms of skewness and kurtosis (Table 2), with a range below 3.3, as proposed by Sposito et al. [72].

4.3. Measurement Model

Table 3 indicates the outcomes of average variance extracted (AVE), composite reliability (CR), and Cronbach’s alpha (CA) measurements that determined the validity and reliability of the research model. There are no latent variables or model constructs with AVE values below 0.50, making the constructs of this model acceptable. Each construct in the model has a CR value greater than or equal to 0.80. Models that have a CR value of 80 or greater are acceptable [73].
On the other hand, the internal reliability of the model was assessed using Cronbach’s alpha test. The results of CA are presented in Table 3, all of which exceeded 0.70, indicating acceptable reliability [74]. These results demonstrate a robust relationship among the indicators of the model constructions (Table 4).
Additionally, the convergence validity of the model’s constructs was evaluated by examining their loading values, as depicted in Table 3. In this regard, Sarstedt et al. [77] suggested that the loading values of each indicator for the latent variable should be greater than 0.60 [81]. However, as seven loading values fell below this threshold, the corresponding seven items were eliminated from the model. Following the removal of these indicators, the remaining loading values ranged from 0.64 to 0.86. Consequently, these findings support the convergence validity of the research model, indicating a strong correlation among all construct indicators (Table 3).

4.4. Discriminant Validity

To assess the discriminant validity of the model’s constructs according to the Fornell–Larcker [81] criterion, we analyzed the square root of AVE for each latent construct (Table 5). It is required that the AVE of the square root value be higher than the corresponding correlations with all other latent variables.
To confirm this criterion, the square root values of the AVE coefficients in the correlation matrix and diagonal were examined, following the guidelines of Hair et al. [75]. The findings regarding discriminant validity indicate that the AVE square root values exceed the correlations with any other components or latent variables in the model, as presented in Table 5.
Moreover, to evaluate the discriminant validity, Henseler et al. [82] proposed the use of the Heterotrait–Monotrait ratio (HTMT) to assess correlations. This method provides an estimation of the actual correlation between two latent variables. According to Henseler et al. [82], a threshold of 0.90 is recommended for HTMT, with values exceeding this threshold indicating a lack of discriminant validity.
Additionally, it is important that the confidence interval of the HTMT does not include the value of 1. The fulfillment of these criteria for our PLS model is presented in Table 6, demonstrating that the HTMT criterion was satisfied.

4.5. Common Method Bias (CMB) Test

According to Hair et al. [73], the variance inflation factors (VIFs) have a minimum value range of 1 to 10. The VIF provides information on the extent to which the variance of each coefficient is inflated. When analyzing the VIFs, a value of 1 indicates no correlation, a value between 1 and 5 indicates moderate correlation, and a value larger than 5 indicates substantial correlation [73].
In order to assess the impact of multicollinearity among the variables, we estimated the VIF values. The highest VIF value obtained was 1.479 (Table 7), which is within the acceptable range, as suggested by Hair et al. [73]. Therefore, the factors do not exhibit any multicollinearity issue. A VIF score over 3.3 indicates the presence of pathological collinearity and suggests that a model may have multicollinearity issues. This model is devoid of collinearity, as shown by the VIFs, which are all equal to or below 3 [83].

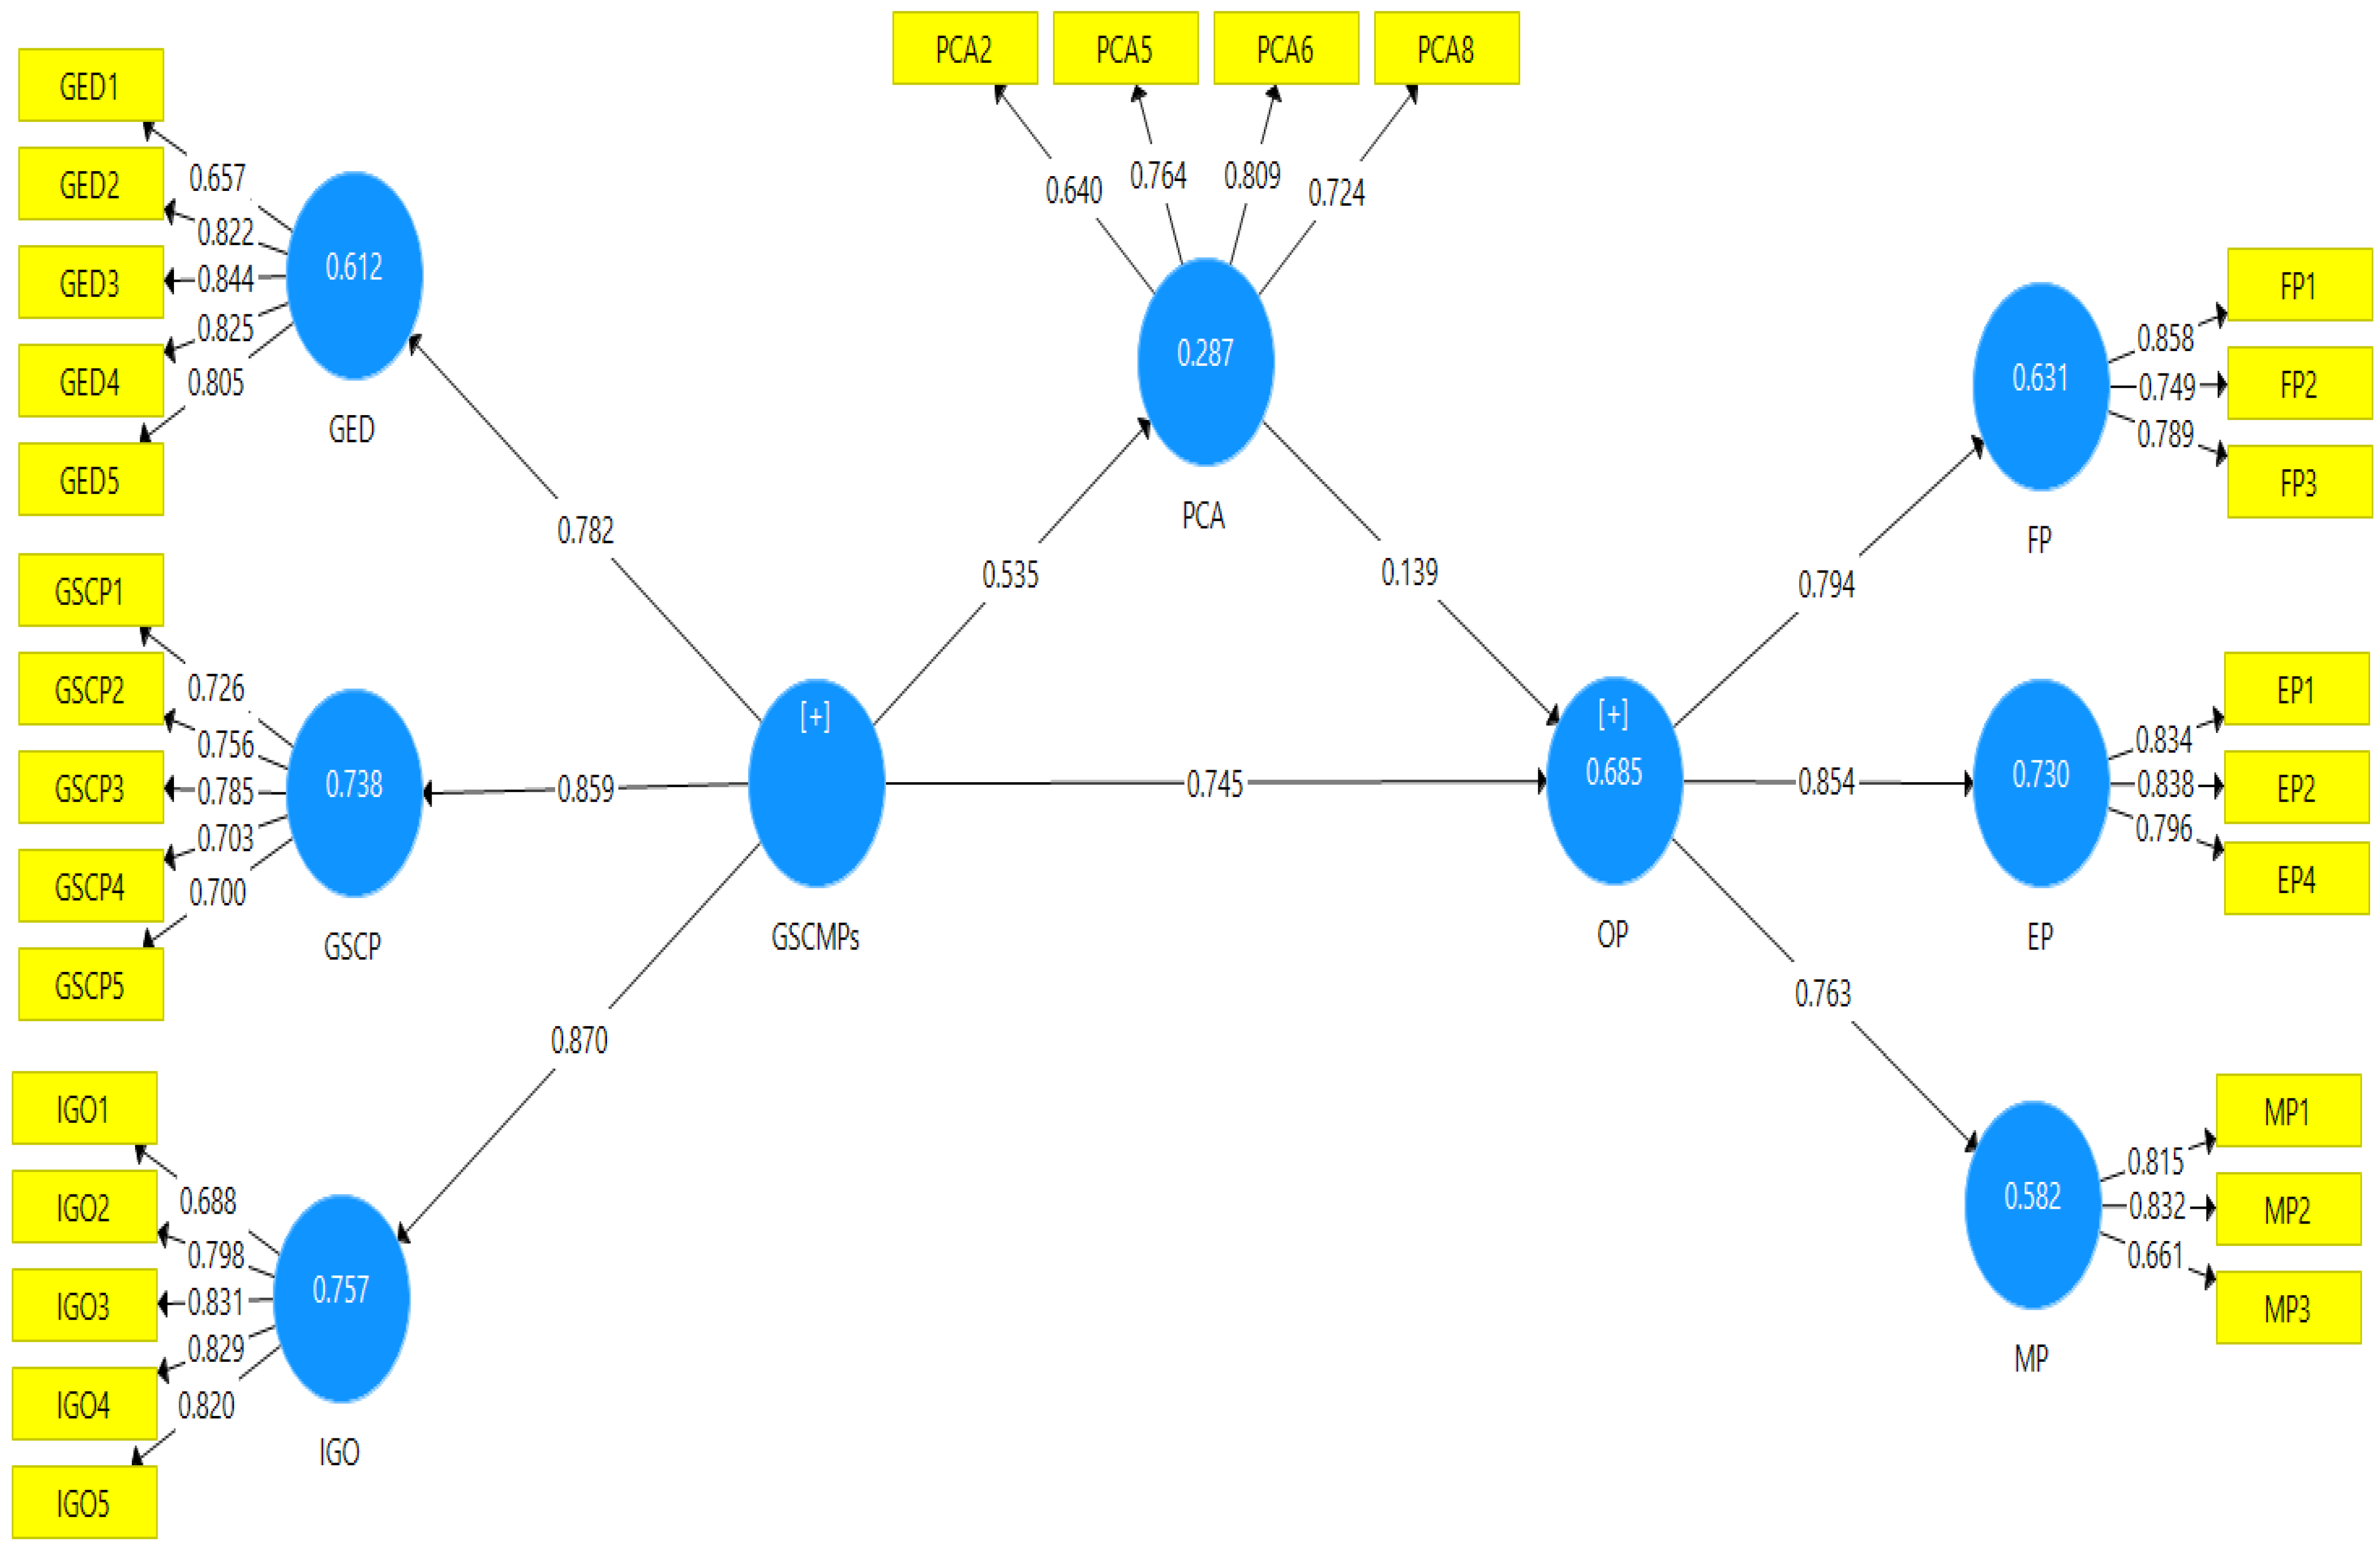
4.6. Structural Model

Variance-based structural equation modeling (SEM), a multivariate analysis technique, was used to identify significant relationships between the three constructs: (i) GSCMPs, (ii) OP, and (iii) PCA. From Table 8 and Figure 3, considering the direct effect, it can be observed that GSCMPs has a positive significant relationship with OP (β = 0.745, t = 24.436, p < 0.001), supporting the first hypothesis (H1). The same variable (GSCMPs) is also significantly and positively related to PCA (β = 0.535, t = 12.180, p < 0.001), supporting the second hypothesis (H2). On the other hand, PCA has a significant positive relationship with OP (β = 0.139, t = 4.691, p < 0.001), supporting the third hypothesis (H3). All the p-values were less than 0.001 (far less than 0.05), indicating that the beta values of the corresponding relationships were highly significant.
Regarding marketing or social science research, Cohen [84] provided recommendations for interpreting R2 values. He suggested that R2 values ranging from 0.02 to 0.12 should be considered weak, values between 0.13 and 0.25 should be considered moderate, and values of 0.26 or higher should be considered large. In the present study, the R2 value for OP related to GSCMPs is 0.685. This indicates that GSCMPs can explain 68.5% of the variation of the OP regarding manufacturing firms in Bangladesh.
Conversely, the R2 value for PCA related to GSCMPs is 0.287. Based on Cohen’s [84] recommendations, this implies that GSCMPs alone can explain 28.7% of the variation of the PCA regarding manufacturing firms in Bangladesh. Finally, the R2 value for PCA related to OP is 0.334, indicating that PCA can explain 33.4% of the variance of OP regarding manufacturing firms in Bangladesh.

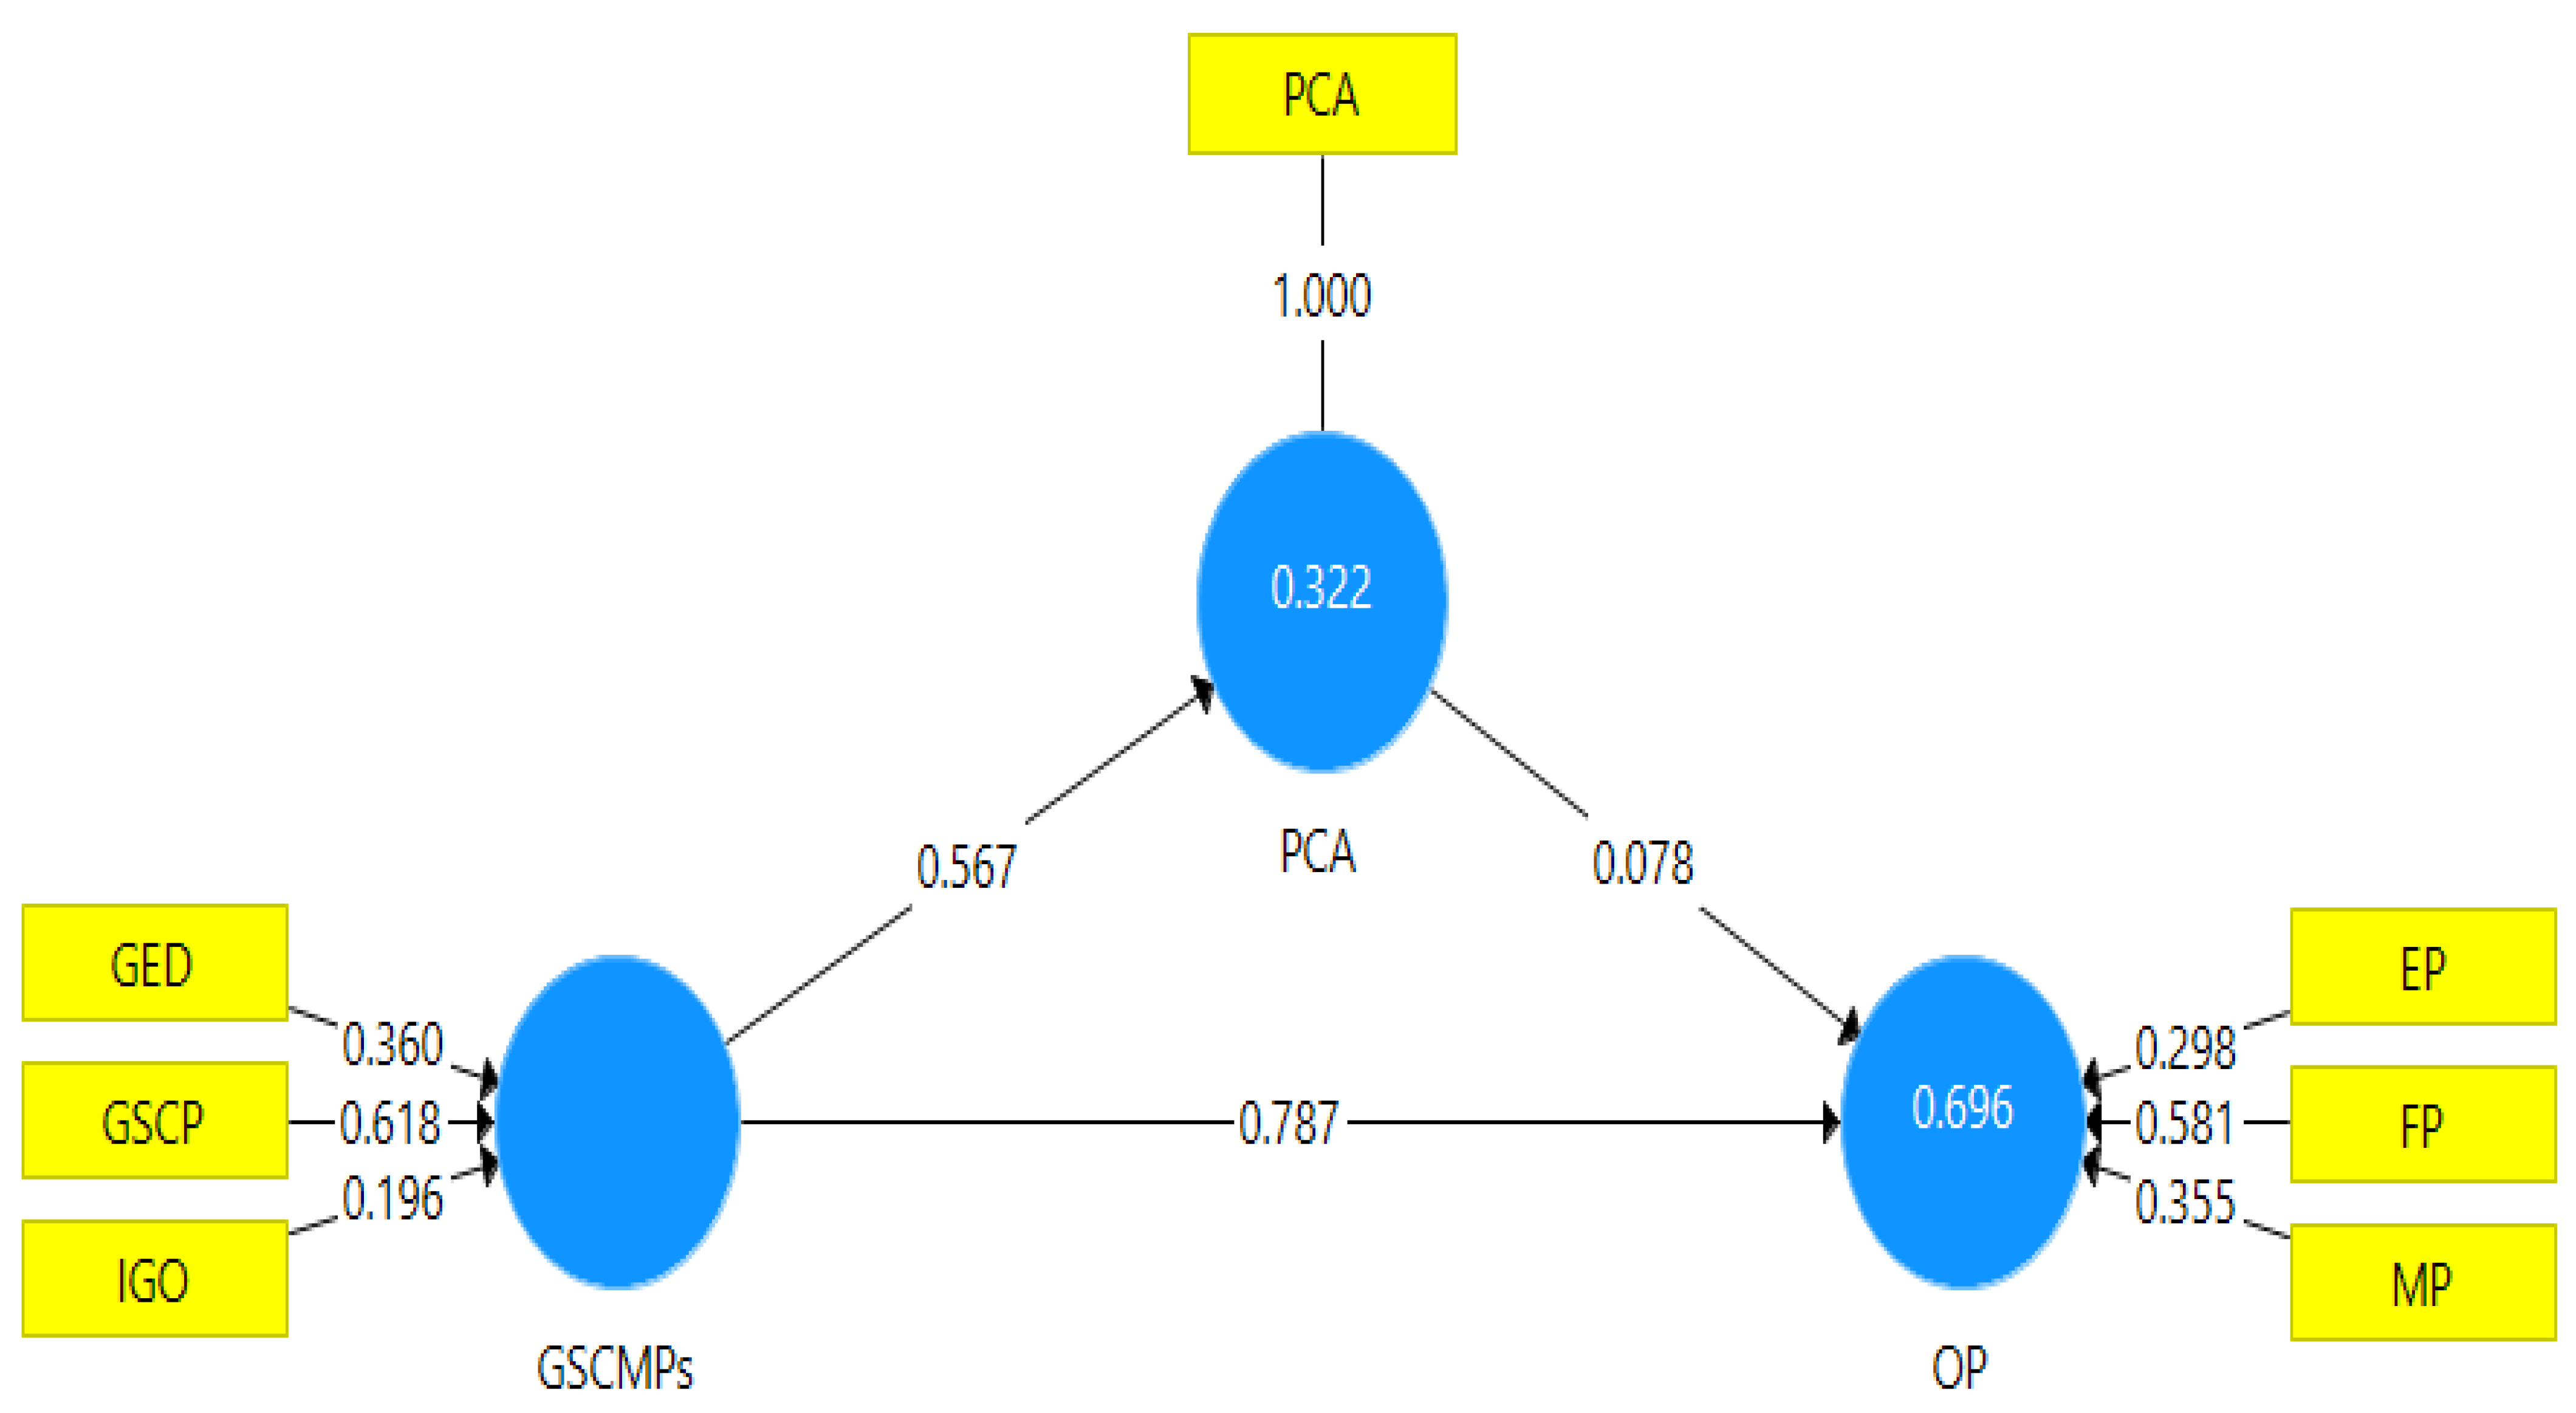
4.7. Mediating Effect

The findings of this study indicate that PCA plays a partial mediating role in the relationship between GSCMPs and OP (β = 0.093, t = 4.205, p < 0.001) (Table 9).
This conclusion is supported by the significant direct effect observed, where GSCMPs exhibit a significant relationship with OP (β = 0.745, t = 24.436, p < 0.001). Furthermore, there is a significant indirect effect as GSCMPs are significantly related to PCA (β = 0.535, t = 12.180, p < 0.001) and PCA is significantly related to OP (β = 0.139, t = 4.691, p < 0.001). Hence, these findings provide support for H4.

4.8. Moderating Effect

According to Table 10, we can observe that OP and PCA increase with an increase in SCLS. It should be noted that although PCA was considered as the mediator in this study, it was considered as an independent construct while testing the moderating effect of SCLS. The results support hypothesis 5, indicating that SCLS can strengthen the positive relationship between PCA and OP (having a positive value of 0.056 at the point of intersection). Such an outcome implies that the effectiveness of SCLS plays a significant role in shaping the impact of PCA on OP. In essence, the leadership abilities of individuals responsible for developing PCA can greatly influence the extent to which they contribute to improving OP.

4.9. Goodness-of-Fit (GoF) Index

In a prior study, Peng and Lai [85] applied the Stone-Geisser Q2 test to evaluate the quality and strength of the structural model; however, no test has yielded unsatisfactory conclusions yet. The findings for the Stone-Geisser Q2 test, i.e., the relative effect sizes (F2) of the GSCMPs construct and R2 values, are shown in Table 11. All these metrics were found to be greater than zero. On the other hand, a GoF index, which is particularly useful for endogenous variables, is defined as the geometric mean of the average commonality and average R2 [86]. The GoF index was used for the path modeling in this study. To calculate the GoF, the following formula was used:
GoF = √ (AVE × R2)
In this study, the GoF value (Table 11) for examining the impact of GSCMPs on the OP of Bangladeshi manufacturing firms was 0.62 (R2 value = 0.62 and average AVE = 0.62). Thus, the GoF value was greater than 0.36, indicating that the proposed model for this study has greater explanatory power than the recommended values of GoF large (0.36), GoF medium (0.25), and GoF small (0.10) [87].

4.10. Second-Order Construct Assessment

According to Wong [88], formative indicators within a measurement scale can exhibit a negative, a positive, or no correlation with each other. Consequently, the reporting of consistency reliability, discriminant validity, and internal indicator reliability are typically not applicable when dealing with formative measurement scales. This is because measures such as AVE, CR, and outer loadings lack significance when the construct consists of uncorrelated indicators [88]. Nonetheless, researchers have predominantly relied on two main criteria to evaluate formative measurement models: the relevance and significance of indicator weights as well as the multicollinearity of all indicators [89]. Recently, Hair et al. [90] introduced three fundamental steps for evaluating formative measurement models: (i) assessing convergent validity, (ii) evaluating collinearity issues, and (iii) examining the significance and relevance of formative indicators. In accordance with the framework proposed by Hair et al. [90], the construct of OP, viewed as a reflective-formative construct, has been approached as indicated in the following sub-sections.

4.10.1. Assessment of Convergent Validity

Hair et al. [90] proposed two methods to determine the convergent validity of formative latent constructs. The first method entails investigating the relationship between other reflective measures and the formative latent construct. In this technique, the route coefficient between the constructs should be at least 0.70, and the R2 value for endogenous constructs should be greater than or equal to 0.50 [90]. However, in order to reduce respondents’ fatigue and keep response rates high, we chose the second strategy, which entails utilizing global questions to assess the validity of the reflective-formative concept [90]. The universal item for OP encapsulated the concept perfectly. Furthermore, the global measure was carefully constructed and subjected to expert pretesting before being incorporated into the survey instrument for data collection, ensuring the assessment of convergent validity for OP. The research indicated a route coefficient magnitude of 0.787 between the constructs and an R2 value of 0.696 for the endogenous construct (Figure 4 and Table 12).

4.10.2. Evaluation of Indicators’ Collinearity

High correlations between formative measurement model indicators are not normally expected. A strong correlation between formative items also shows collinearity, which is undesirable [91]. We examined the VIFs to determine collinearity between the constructs’ formative components. We employed inner VIF values to analyze collinearity in this work since we are dealing with a reflective-formative type of second-order construct. As a result, we tested EP, FP, MP, GED, GSCMPs, GSCP, IGO, and OP for collinearity as predictors of organizational success. The VIF values should be less than or equal to 5 to be considered acceptable, as recommended by Hair et al. [90]. Table 7 shows that the VIF values for all constructs are far less than 5, suggesting the lack of collinearity difficulties across the constructs’ formative indicators [89,91].

4.10.3. Evaluation of Significance and Relevance of Indicator Weights

The significance of any indicator’s weight denotes its relative relevance, but the loading denotes its absolute importance, which may be tested through bootstrapping. The number of instances of bootstrapping should be equal to or larger than the number of observations in the original sample [89]. Smart-PLS (version 4), introduced by Ringle et al. [92], was used to evaluate the importance and relevance of indicator weights. To examine the relevance of the formative indicator weights, we used a bootstrapping approach with 1000 resamples [86,93]. In this regard, Lohmoller [94] suggested that an indicator should have a weight larger than 0.10.
The results show that all the formative indicator weights are more than the suggested threshold of 0.10. Table 12 and Figure 4 show that all the formative indicator weights have significant t-values, indicating that all the indicators should be retained. Table 12 also shows the t-values and confidence intervals for the formative indicators, demonstrating the relevance of the weights because no values of 0 occurred within the confidence ranges. All the p-values were less than 0.001 (far less than 0.05), indicating that the beta values of the corresponding relationships were highly significant.
Chin et al. [95] proposed the use of predictive sampling reuse techniques, specifically, Q2, to evaluate predictive relevance. Hair et al. [90] and Akter et al. [87] emphasized the importance of assessing how well Q2 can reconstruct data using empirically collected models and PLS-SEM parameters. According to Hair et al. [90], a model is assumed to possess predictive significance if the Q2 value surpasses 0, but it is regarded to lack predictive relevance if the Q2 value is below 0. In addition, Hair et al. [91] proposed that Q2 values of 0.35, 0.15, and 0.02 correspond to significant, moderate, and minimal values, respectively, for a particular endogenous latent construct. In the present study, the calculated Q2 value for OP is 0.43, indicating a large relevant value for the endogenous construct.

5. Discussion

This study elaborates on GED, GSCP, and IGO as the predictors of OP, indicating the relationship between GSCMPs and OP. This was accomplished by developing an SEM model based on data from the respondents working as top-level and mid-level managers at various manufacturing firms in Bangladesh. This study provides several reasons for incorporating GSCM practices into a manufacturing firm’s operations. We tested the study hypotheses based on valid responses from 340 sample respondents and applied proper statistical tools to test the hypothesized relationships. We attempted to make the whole procedure error-free as much as possible for the authenticity of the outcomes. This study identified that GSCMPs has a positive and significant relationship with OP, which is supported by a number of researchers [40,41,42,45,46,47,48,49,53,54,55], who argued that, in their studies, effective and efficient GSCM practices can enhance financial, marketing, and environmental performance by reducing costs, recycling, maintaining effective supplier and distribution channels, and having an enhanced corporate reputation by being a market leader. This study had an R2 of more than 69 percent, which is higher than the R2 values of similar earlier studies [61,62,65,66,67]. Thus, the selection of constructs was appropriate, and the results were representative.
PCA was identified to have partial mediation in the relationship between GSCMPs and OP. This outcome is consistent with the previous findings reported by [61,62,63,64,65,66,67]. Therefore, GSCMPs (as the single independent construct) enhances firm performance as well as competitive advantage through higher first-mover advantage and enhanced corporate reputation. Effective leadership is crucial for the successful adoption of GSCMPs according to several studies. For instance, executives who are dedicated to sustainability and who can convince their staffs regarding the significance of GSCMPs are more likely to benefit from them. Effective leadership abilities may also lessen some of the difficulties firms may have when introducing GSCM techniques, such as employee opposition or problems arising when determining how these policies affect performance, which is supported by [15,68,69]. Thus, our findings support all five research hypotheses, and three research questions were successfully answered through the statistical analyses based on the respondents’ expressed data. We expect that the outcomes of this study will bridge existing theoretical gaps and enhance academic as well as managerial knowledge.

6. Implications

6.1. Academic Implications

In line with the existing literature, we demonstrated how GSCMPs can boost an organization’s efficiency and effectiveness. This research has several important implications for researchers working on GSCM-related studies. With the help of digital tools, this research examined the factors that bind different participants in green supply chain operations. Using the first-order and second-order constructs, this study involved three dimensions of OP (financial, marketing, and environmental), which is quite unique and has probably been used for the first time in the academic domain of SCM. There is very little concrete evidence in the existing literature that identifies the relationships between GSCMPs and OP using multiple dimensions such as FP, MP, and EP in a single research framework [14,21]. On the other hand, we used three unique and understudied first-order independent factors (GED, GSCP, and IGO) as predictors of GSCMPs. Furthermore, this study used SCLS as the moderator, which is fairly uncommon within the GSCM-related literature.
The performance of top management in South Asian countries is frequently measured by its FP, while that of mid-level management is measured by its operational efficiency. An assessment of a manager’s commitment to green practices must be based on how EP and MP improve and how those performance affect FP [31]. Thus, GSCMPs must be evaluated to determine if such practices can improve the FP, MP, and EP of a firm. Those performance should also be interrelated with each other. The impact of GSCMPs on Bangladeshi managers and policymakers remains severely under-researched [21]. A highly uncertain environment makes it challenging to utilize GSCMPs for most manufacturing organizations [16]. Accordingly, this research aims to determine whether GSCMPs can improve the organization’s overall (financial, marketing, and environmental) performance or offer supplementary benefits through enhanced perceived competitive advantage. Finally, we considered a unique and less researched variable, i.e., SCLS, as a moderator, which is quite innovative and demands further investigation by researchers.

6.2. Managerial Implications

The current results may aid professionals in the field of GSCM by providing a better understanding of the relationship between GSCMPs and OP. Leaders at all levels of an organization (such as CEOs, directors, and other top-level managers) can benefit from adopting GSCM as a method for boosting output. GSCM in the modern era relies heavily on cutting-edge technology. This research uncovered three crucial GSCMPs (GED, GSCM, and IGO) for maximizing overall organizational performance as well as FP, MP, and EP. The success of technology providers in larger Asian economies like China, India, Japan, and South Korea depends on their commitments to GED and GSCP and an internal focus on going green. The production materials can be shipped directly from their origin to the production sites.
This research demonstrates that a manufacturing firm’s overall performance can be improved through the mediation of a sense of competitive advantage held by its employees. The right organizational performance level can only be achieved through the adoption and application of efficient GSCM strategies. Manufacturing firms can improve their overall efficiency and effectiveness by adopting GSCMPs strategically. As a result, manufacturing firms will likely gain a deeper understanding of the GSCM, including information technology, GSCM strategies, and internal structure.

7. Limitations and Further Scope

This study has several limitations. First, the study scenario was limited to one nation and one industrial sector, limiting its scope and generalizability. By conducting a cross-country study and comparing two or more countries, researchers may be able to obtain more comprehensive conclusions. Second, several GSCM factors that were not used in this study can be used to assess businesses in a real-world setting. For example, multiple mediating or moderating variables may be investigated in subsequent studies. Third, this study considered only the top-level and mid-level managers. We recommend that future studies consider more stakeholders involved, such as suppliers, local residents, buyers, and other employees.
This study used a structured survey that collected data from 340 top-level and mid-level managers of 61 manufacturing firms in Bangladesh, which were analyzed with PLS-SEM. Although PLS-SEM handles complex models and small-to-medium samples effectively, it may have biases and limited goodness-of-fit indices. The sample’s focus on upper management may cause bias and affect the reliability of self-reported data. Future studies should include different samples and longitudinal designs to increase generalizability and understand long-term effects.
Another limitation of this study is that we measured the financial performance based on the study responses rather than using quantitative data, which is slightly confusing. Thus, we had to solely depend on the respondents to obtain our desired data. Such response-based data might have made the study outcome slightly unclear.
We invite future researchers to consider these caveats and expand their understanding of the relationship between GSCMPs and OP. However, even with all the above limitations, this study can help motivate researchers to investigate this comparatively unexplored area of SCM.

8. Conclusions

The major research question of this study was whether GSCMPs has any relationship with OP. In addition, this study also aimed to determine whether PCA can mediate the relationship between GSCMPs and OP and whether SCLS can moderate (strengthen) the relationship between PCA and OP. We assumed positive relationships between the constructs/variables in our study. The analysis based on the respondents’ views supported all the hypotheses and thereby answered all the research questions clearly.
Manufacturing decision-makers can benefit from this study’s findings because they suggest a link between GSCMPs and OP. Studying and synthesizing the literature on GSCMPs and their impact on OP allowed us to determine the research objectives and formulate the central research questions. The efficiency of a manufacturer’s GSCM processes is positively proportional to the quality of those processes. It is reasonable to assume that these indicators will aid in managerial decision-making considering the findings. The results show that various GSCM practices have significant positive correlations with OP. This study’s findings are in line with those of similar earlier studies.
This research contributes to our understanding of GSCMPs and key performance indicators by examining them from previously unexplored perspectives. Here, we looked at how eco-friendliness, collaboration, and internal adaptability can help businesses succeed financially while also reducing adverse impacts on the environment. More empirical studies are required to determine if GSCMPs with similar elements can be implemented in other sectors, such as service, tourism, transport, etc. The scope of this study can be broadened to examine other sectors to see if they experience similar gains. Artificial intelligence’s higher external validity and accuracy can help boost productivity because it accurately reflects OP. In general, the effectiveness of GSCM practices in enhancing OP may be significantly influenced by perceived competitive advantage and supply chain leadership abilities. As a result, firms should concentrate on fostering and developing strong leadership capabilities inside their supply chains to guarantee the effective adoption and long-term success of GSCM policies and practices.

Author Contributions

Conceptualization, M.A.A.M.; Methodology, M.S.H. and M.B.A.; Data curation, M.A.R.; Writing—original draft, Y.-J.D.; and Writing—review and editing and Funding acquisition, M.B.A. and M.A. All authors have read and agreed to the published version of the manuscript.

Funding

This research was supported by the “University of Debrecen Program for Scientific Publication”.

Institutional Review Board Statement

Not applicable.

Informed Consent Statement

Not applicable.

Data Availability Statement

Data available within the article.

Conflicts of Interest

The researchers declare no conflicts of interest.

Appendix A

Table A1. Firm-wise distribution of respondents.
List of Industrial SectorNumber of Manufacturing OrganizationsNumber of Respondents
Garments945
Textile740
Iron and steel534
Shipbuilding331
Soap and toiletries529
Heavy machinery525
Small machinery421
Chemical421
Footwear421
Bicycle320
Pharmaceuticals418
Leather 515
Food and beverage313
Cement and construction materials37
Total (n)61340

Appendix B

Table A2. Survey items with references.
Constructs/VariablesItemsReferences
Green Eco-Design (GED)GED1: We create items that consume less material and energy.Zhu et al. (2008); Vachon (2007); Vachon and Klassen (2006) [40,41,42]
GED2: We design products that are created by reusing, recycling, and recovering materials and parts.
GED3: My firm provides product design services to eliminate or reduce the usage of hazardous products and/or manufacturing methods.
GED4: My firm specializes in product design for waste reduction.
GED5: My firm provides product design to extend the product’s life cycle.
Green Supply Chain Partnering (GSCP)GSCP1: My firm regards the major suppliers as providers of capabilities rather than just items and services.Gallear et al. (2012); Ren et al. (2010); Maheshwari et al. (2006) [43,46,47]
GSCP2: My firm has established a substantial two-way exchange of critical and technical information with essential vendors.
GSCP3: My firm involves suppliers in the development of innovative green products and services.
GSCP4: My firm has created long-term commitments to the suppliers in order to obtain mutually acceptable results.
GSCP5: The benefits of working on problems with important suppliers are always shared.
Internal Green Orientation (IGO)IGO1: My firm has defined procedures to promote environmental awareness in all functional areas.Murray et al. (2011); Ge and Ding (2005) [48,49]
IGO2: The preservation of the natural environment is a high concern for my firm.
IGO3: My firm takes steps to make sure the staffs understand the importance of environmental protection.
IGO4: My firm considers environmental protection to be a corporate duty.
IGO5: We urge our staffs to use environment-friendly goods and services.
Perceived Competitive Advantage (PCA)PCA1: I perceive that my firm offers better products to our customers than those of our rivals.Tracey et al. (1999); Koufteros et al. (1997) [62,64]
PCA2: My firm has a more capable R&D department than our competitors.
PCA3: My firm has prominent managers who possess better managerial capabilities than their competing counterparts.
PCA4: The corporate image of my firm is better than that of competitors.
PCA5: It is difficult to match my firm’s competitive advantage.
Supply Chain Leadership Skill (SCLS)SCLS1: The supply chain managers should have the necessary leadership skills.Lee et al. (2023); Liu et al. (2021); Zhu et al. (2017) [15,68,69]
SCLS2: The supply chain managers should have knowledge regarding economics and market dynamics.
SCLS3: The supply chain managers should have negotiation skills to deal with the major suppliers.
SCLS4: The supply chain managers should be informed about all the alternatives for channeling the supply of the materials in case of an emergency or a shortage.
SCLS5: The supply chain managers should have an understanding of the cost to serve regarding economics and market dynamics.
Financial Performance (FP)FP1: Financial strength is essential for a firm to survive.Alexandrou et al. (2022); Vachon and Klassen (2006) [42,50]
FP2: My firm has strong financial strength.
FP3: My firm has enough internal cash reserve to overcome an emergency supply disruption.
Marketing Performance (MP)MP1: My firm has an established and competent marketing team.Choudhary and Sangwan (2022); Namagembe et al. (2019); Saeed and Kersten (2019); Eltayeb et al. (2016) [19,21,53,54]
MP2: Our marketing policy involves customers’ opinions and surveys.
MP3: We put a strong emphasis on our marketing policy in order to achieve a satisfactory performance.
Environmental Performance (EP)EP1: Environmental performance is a key competitive advantage for modern businesses.Tang et al. (2022); Seman et al. (2019); Fahimnia et al. (2015); Choi and Hwang (2015) [9,56,58,59]
EP2: My firm has strong environment-centric policies and practices.
EP3: My firm has green supply chain management policies and practices that are conducive to achieving satisfactory environmental performance.
EP4: My firm uses environment-friendly materials that are conducive to achieving a satisfactory environmental performance.

References

  1. Chopra, S.; Meindl, P. Supply Chain Management: Strategy, Planning & Operation. In Das Summa Summarum des Management; Gabler Verlag: Wiesbaden, Germany, 2007; pp. 265–275. [Google Scholar]
  2. Vonderembse, M.A.; Uppal, M.; Huang, S.H.; Dismukes, J.P. Designing Supply Chains: Towards Theory Development. Int. J. Prod. Econ. 2006, 100, 223–238. [Google Scholar] [CrossRef]
  3. Mustafi, M.A.A.; Dong, Y.-J.; Hosain, M.S. The mediating role of perceived competitive advantage on the relationships between green supply chain management practices and operational performance: Evidence from Bangladeshi manufacturing firms. Benchmarking Int. J. 2024; Online ahead of print. [Google Scholar] [CrossRef]
  4. Rupa, R.A.; Saif, A.N.M. Impact of Green Supply Chain Management (GSCM) on Business Performance and Environmental Sustainability: Case of a Developing Country. Bus. Perspect. Res. 2022, 10, 140–163. [Google Scholar] [CrossRef]
  5. Seman, N.A.A.; Zakuan, N.; Jusoh, A.; Arif, M.S.M.; Saman, M.Z.M. The Relationship of Green Supply Chain Management and Green Innovation Concept. Procedia-Soc. Behav. Sci. 2012, 57, 453–457. [Google Scholar] [CrossRef]
  6. Carter, C.R.; Rogers, D.S. A Framework of Sustainable Supply Chain Management: Moving toward New Theory. Int. J. Phys. Distrib. Logist. Manag. 2008, 38, 360–387. [Google Scholar] [CrossRef]
  7. Seuring, S.; Müller, M. From a Literature Review to a Conceptual Framework for Sustainable Supply Chain Management. J. Clean. Prod. 2008, 16, 1699–1710. [Google Scholar] [CrossRef]
  8. Ahmed, W.; Najmi, A.; Arif, M.; Younus, M. Exploring Firm Performance by Institutional Pressures Driven Green Supply Chain Management Practices. Smart Sustain. Built Environ. 2019, 8, 415–437. [Google Scholar] [CrossRef]
  9. Choi, D.; Hwang, T. The Impact of Green Supply Chain Management Practices on Firm Performance: The Role of Collaborative Capability. Oper. Manag. Res. 2015, 8, 69–83. [Google Scholar] [CrossRef]
  10. De Felice, F.; Petrillo, A. A Strategic Multicriteria Decision Support System to Assess the Best Supply Chain Distribution Strategy and Characterize the Bullwhip Effect. Int. J. Inf. Syst. Supply Chain Manag. 2013, 6, 61–76. [Google Scholar] [CrossRef]
  11. Dubey, R.; Gunasekaran, A.; Papadopoulos, T. Green Supply Chain Management: Theoretical Framework and Further Research Directions. Benchmarking Int. J. 2017, 24, 184–218. [Google Scholar] [CrossRef]
  12. Al-Sheyadi, A.; Muyldermans, L.; Kauppi, K. The Complementarity of Green Supply Chain Management Practices and the Impact on Environmental Performance. J. Environ. Manag. 2019, 242, 186–198. [Google Scholar] [CrossRef]
  13. Mitra, S.; Datta, P.P. Adoption of Green Supply Chain Management Practices and Their Impact on Performance: An Exploratory Study of Indian Manufacturing Firms. Int. J. Prod. Res. 2014, 52, 2085–2107. [Google Scholar] [CrossRef]
  14. Sahoo, S.; Vijayvargy, L. Green Supply Chain Management Practices and Its Impact on Organizational Performance: Evidence from Indian Manufacturers. J. Manuf. Technol. Manag. 2020, 32, 862–886. [Google Scholar] [CrossRef]
  15. Zhu, Q.; Qu, Y.; Geng, Y.; Fujita, T. A Comparison of Regulatory Awareness and Green Supply Chain Management Practices among Chinese and Japanese Manufacturers. Bus. Strateg. Environ. 2017, 26, 18–30. [Google Scholar] [CrossRef]
  16. Soda, S.; Sachdeva, A.; Garg, R.K. GSCM: Practices, Trends, and Prospects in Indian Context. J. Manuf. Technol. Manag. 2015, 26, 889–910. [Google Scholar] [CrossRef]
  17. Scur, G.; Barbosa, M.E. Green Supply Chain Management Practices: Multiple Case Studies in the Brazilian Home Appliance Industry. J. Clean. Prod. 2017, 100, 1293–1302. [Google Scholar] [CrossRef]
  18. Hosain, M.S. What Does It Take to Be Green? Evidence from Asia and the Pacific. J. Sustain. Dev. Stud. 2021, 14, 1–9. [Google Scholar]
  19. Namagembe, S.; Ryan, S.; Sridharan, R. Green Supply Chain Practice Adoption and Firm Performance: Manufacturing SMEs in Uganda. Manag. Environ. Qual. Int. J. 2019, 30, 5–35. [Google Scholar] [CrossRef]
  20. Raut, R.D.; Luthra, S.; Narkhede, B.E.; Mangla, S.K.; Gardas, B.B.; Priyadarshinee, P. Examining the Performance-Oriented Indicators for Implementing Green Management Practices in the Indian Agro Sector. J. Clean. Prod. 2019, 215, 926–943. [Google Scholar] [CrossRef]
  21. Choudhary, K.; Sangwan, K.S. Green Supply Chain Management Pressures, Practices and Performance: A Critical Literature Review. Benchmarking Int. J. 2022, 29, 1393–1428. [Google Scholar] [CrossRef]
  22. Arefin, A.H.M.M.; Hosain, M.S. The Role of Human Resource Information System on Organizational Performance: Evidence from Bangladeshi Pharmaceutical Industry. Eur. J. Appl. Bus. Manag. 2019, 5, 37–53. [Google Scholar]
  23. Zhu, Q.; Sarkis, J.; Lai, K.H. Institutional-Based Antecedents and Performance Outcomes of Internal and External Green Supply Chain Management Practices. J. Purch. Supply Manag. 2013, 19, 106–117. [Google Scholar] [CrossRef]
  24. Yildiz Çankaya, S.; Sezen, B. Effects of Green Supply Chain Management Practices on Sustainability Performance. J. Manuf. Technol. Manag. 2019, 30, 98–121. [Google Scholar] [CrossRef]
  25. Liu, J.; Feng, Y.; Zhu, Q.; Sarkis, J. Green Supply Chain Management and the Circular Economy: Reviewing Theory for Advancement of Both Fields. Int. J. Phys. Distrib. Logist. Manag. 2018, 48, 794–817. [Google Scholar] [CrossRef]
  26. Masa’deh, R.; Alananzeh, O.; Algiatheen, N.; Ryati, R.; Albayyari, R.; Tarhini, A. The Impact of Employee’s Perception of Implementing Green Supply Chain Management on Hotel’s Economic and Operational Performance. J. Hosp. Tour. Technol. 2017, 8, 395–416. [Google Scholar] [CrossRef]
  27. Younis, H.; Sundarakani, B.; Vel, P. The Impact of Implementing Green Supply Chain Management Practices on Corporate Performance. Compet. Rev. 2016, 26, 246–264. [Google Scholar] [CrossRef]
  28. Luthra, S.; Garg, D.; Haleem, A. Green Supply Chain Management: Implementation and Performance—A Literature Review and Some Issues. J. Adv. Manag. Res. 2014, 11, 20–46. [Google Scholar] [CrossRef]
  29. Hossin, M.A.; Hosain, M.S.; Frempong, M.F.; Adu-Yeboah, S.S.; Mustafi, M.A.A. What Drives Sustainable Organizational Performance? The Roles of Perceived Organizational Support and Sustainable Organizational Reputation. Sustainability 2021, 13, 12363. [Google Scholar] [CrossRef]
  30. Hossain, M.I.; San, O.T.; Ling, S.M.; Said, R.M. The Role of Environmental Awareness and Green Technological Usage to Foster Sustainable Green Practices in Bangladeshi Manufacturing SMEs. Int. J. Adv. Sci. Technol. 2020, 29, 3115–3124. [Google Scholar]
  31. Singh, P.J.; Mittal, V.K.; Sangwan, K.S. Development and Validation of Performance Measures for Environmentally Conscious Manufacturing. Int. J. Serv. Oper. Manag. 2013, 14, 197–220. [Google Scholar] [CrossRef]
  32. Bangladesh Bureau of Statistics (BBS). Manufacturing Sector in Bangladesh to Generate Employment 2021; Bangladesh Bureau of Statistics (BBS): Dhaka, Bangladesh, 2021.
  33. Sarkar, B.; Sarkar, M.; Ganguly, B.; Cardenas-Barron, L.E. Combined Effects of Carbon Emission and Production Quality Improvement for Fixed Lifetime Products in a Sustainable Supply Chain Management. Int. J. Prod. Econ. 2021, 231, 107867. [Google Scholar] [CrossRef]
  34. Hussain, T.; Wahab, A. A Critical Review of the Current Water Conservation Practices in Textile Wet Processing. J. Clean. Prod. 2018, 198, 806–819. [Google Scholar] [CrossRef]
  35. Chen, L.; Jia, F.; Li, T.; Zhang, T. Supply Chain Leadership and Firm Performance: A Meta-Analysis. Int. J. Prod. Econ. 2021, 235, 108082. [Google Scholar] [CrossRef]
  36. Purwantoa, A.; Juliana, J. The Effect of Supplier Performance and Transformational Supply Chain Leadership Style on Supply Chain Performance in Manufacturing Companies. Uncertain Supply Chain. Manag. 2022, 10, 511–516. [Google Scholar] [CrossRef]
  37. Li, S.; Ragu-Nathan, B.; Ragu-Nathan, T.S.; Rao, S.S. The Impact of Supply Chain Management Practices on Competitive Advantage and Organizational Performance. Omega 2006, 34, 107–124. [Google Scholar] [CrossRef]
  38. Tan, K.C.; Handfield, R.B.; Krause, D.R. Enhancing the Firm’s Performance through Quality and Supply Base Management: An Empirical Study. Int. J. Prod. Res. 1998, 36, 2813–2837. [Google Scholar] [CrossRef]
  39. Holmberg, S. A Systems Perspective in Supply Chain Measurement. Int. J. Phys. Distrib. Logist. Manag. 2000, 30, 847–868. [Google Scholar] [CrossRef]
  40. Zhu, Q.; Sarkis, J.; Lai, K.H. Confirmation of a Measurement Model for Green Supply Chain Management Practices Implementation. Int. J. Prod. Econ. 2008, 111, 261–273. [Google Scholar] [CrossRef]
  41. Vachon, S. Green Supply Chain Practices and the Selection of Environmental Technologies. Int. J. Prod. Res. 2007, 45, 4357–4379. [Google Scholar] [CrossRef]
  42. Vachon, S.; Klassen, R.D. Green Project Partnership in the Supply Chain: The Case of the Package Printing Industry. J. Clean. Prod. 2006, 14, 661–671. [Google Scholar] [CrossRef]
  43. Gallear, D.; Ghobadian, A.; Chen, W. Corporate Responsibility, Supply Chain Partnership and Performance: An Empirical Examination. Int. J. Prod. Econ. 2012, 140, 83–91. [Google Scholar] [CrossRef]
  44. Mentzer, J.T.; Min, S.; Zacharia, Z.G. The Nature of Inter-Firm Partnering in Supply Chain Management. J. Retail. 2000, 76, 549–568. [Google Scholar] [CrossRef]
  45. Lemke, F.; Goffin, K.; Szwejczewski, M. Investigating the Meaning of Supplier-Manufacturer Partnerships: An Exploratory Study. Int. J. Phys. Distrib. Logist. Manag. 2003, 33, 12–35. [Google Scholar] [CrossRef]
  46. Ren, S.J.F.; Ngai, E.W.T.; Cho, V. Examining the Determinants of Outsourcing Partnership Quality in Chinese Small-and Medium-Sized Enterprises. Int. J. Prod. Res. 2010, 48, 453–475. [Google Scholar] [CrossRef]
  47. Maheshwari, B.; Kumar, V.; Kumar, U. Optimizing Success in Supply Chain Partnerships. J. Enterp. Inf. Manag. 2006, 19, 277. [Google Scholar] [CrossRef]
  48. Ge, G.L.; Ding, D.Z. Market Orientation, Competitive Strategy and Firm Performance: An Empirical Study of Chinese Firms. J. Glob. Mark. 2005, 18, 115–142. [Google Scholar] [CrossRef]
  49. Murray, J.Y.; Gao, G.Y.; Kotabe, M. Market Orientation and Performance of Export Ventures: The Process through Marketing Capabilities and Competitive Advantages. J. Acad. Mark. Sci. 2011, 39, 252–269. [Google Scholar] [CrossRef]
  50. Alexandrou, S.E.; Panayides, P.M.; Tsouknidis, D.A.; Andria, E.; Alexandrou, A.E. Green Supply Chain Management Strategy and Financial Performance in the Shipping Industry. Marit. Policy Manag. 2022, 49, 376–395. [Google Scholar] [CrossRef]
  51. Testa, F.; Iraldo, F. Shadows and Lights of GSCM (Green Supply Chain Management): Determinants and Effects of These Practices Based on a Multinational Study. J. Clean. Prod. 2010, 18, 953–962. [Google Scholar] [CrossRef]
  52. Rao, P.; Holt, D. Do Green Supply Chains Lead to Competitiveness and Economic Performance? Int. J. Oper. Prod. Manag. 2005, 25, 898–916. [Google Scholar] [CrossRef]
  53. Saeed, M.A.; Kersten, W. Drivers of Sustainable Supply Chain Management: Identification and Classification. Sustainability 2019, 11, 1137. [Google Scholar] [CrossRef]
  54. Eltayeb, T.K.; Zailani, S.H.M.; Ramayah, T. Green Supply Chain Initiatives among Certified Companies in Malaysia and Environmental Sustainability: Investigating the Outcomes. J. Clean. Prod. 2016, 135, 1082–1092. [Google Scholar] [CrossRef]
  55. Sarkis, J.; Zhu, Q.; Lai, K.H. An Organizational Theoretic Review of Green Supply Chain Management Literature. Int. J. Prod. Econ. 2011, 130, 1–15. [Google Scholar] [CrossRef]
  56. Fahimnia, B.; Sarkis, J.; Davarzani, H. Green Supply Chain Management: A Review and Bibliometric Analysis. Int. J. Prod. Econ. 2015, 162, 101–114. [Google Scholar] [CrossRef]
  57. Zhu, Q.; Sarkis, J. The Moderating Effects of Institutional Pressures on Emergent Green Supply Chain Practices and Performance. Int. J. Prod. Res. 2007, 45, 4333–4355. [Google Scholar] [CrossRef]
  58. Tang, Y.M.; Chau, K.Y.; Fatima, A.; Waqas, M. Industry 4.0 Technology and Circular Economy Practices: Business Management Strategies for Environmental Sustainability. Environ. Sci. Pollut. Res. 2022, 29, 49752–49769. [Google Scholar] [CrossRef] [PubMed]
  59. Seman, N.A.A.; Govindan, K.; Mardani, A.; Zakuan, N.; Saman, M.Z.M.; Hooker, R.E.; Ozkul, S. The Mediating Effect of Green Innovation on the Relationship between Green Supply Chain Management and Environmental Performance. J. Clean. Prod. 2019, 229, 115–127. [Google Scholar] [CrossRef]
  60. Pagell, M.; Wu, Z. Building a More Complete Theory of Sustainable Supply Chain Management Using Case Studies of 10 Exemplars. J. Supply Chain Manag. 2009, 45, 37–56. [Google Scholar] [CrossRef]
  61. Porter, M.E. Competitive Advantage: Creating and Sustaining Superior Performance; Free Press: New York, NY, USA, 1985. [Google Scholar]
  62. Tracey, M.; Vonderembse, M.A.; Lim, J.S. Manufacturing Technology and Strategy Formulation: Keys to Enhancing Competitiveness and Improving Performance. J. Oper. Manag. 1999, 17, 411–428. [Google Scholar] [CrossRef]
  63. Skinner, W. Manufacturing: The Formidable Competitive Weapon; John Wiley: New York, NY, USA, 1985. [Google Scholar]
  64. Koufteros, X.A.; Vonderembse, M.A.; Doll, W.J. Competitive Capabilities: Measurement and Relationships. Proc. Decis. Sci. Inst. 1997, 3, 1067–1068. [Google Scholar]
  65. Kessler, E.H.; Chakrabarti, A.K. Innovation Speed: A Conceptual Model of Context, Antecedents, and Outcomes. Acad. Manag. Rev. 1996, 21, 1143–1191. [Google Scholar] [CrossRef]
  66. Handfield, R.B.; Pannesi, R.T. Antecedents of Lead Time Competitiveness in Make-to-Order Manufacturing Firms. Int. J. Prod. Res. 1995, 33, 511–537. [Google Scholar] [CrossRef]
  67. Vesey, J.T. The New Competitors: They Think in Terms of “Speed-to-Market”. Acad. Manag. Perspect. 1991, 5, 23–33. [Google Scholar] [CrossRef]
  68. Lee, J.Y.; Kim, D.; Choi, B.; Jiménez, A. Early Evidence on How Industry 4.0 Reshapes MNEs’ Global Value Chains: The Role of Value Creation versus Value Capturing by Headquarters and Foreign Subsidiaries. J. Int. Bus. Stud. 2023, 54, 599–630. [Google Scholar] [CrossRef]
  69. Liu, W.; Wei, W.; Choi, T.; Yan, X. Impacts of Leadership on Corporate Social Responsibility Management in Multi-Tier Supply Chains. Eur. J. Oper. Res. 2021, 299, 483–496. [Google Scholar] [CrossRef]
  70. Sekaran, U.; Bougie, R. Research Methods for Business: A Skill Building Approach; John Wiley & Sons Ltd.: London, UK, 2010. [Google Scholar]
  71. Blumberg, B.; Cooper, D.R.; Schindler, P.S. Business Research Methods, 11th ed.; McGraw Hill: New York, NY, USA, 2011. [Google Scholar]
  72. Sposito, V.A.; Hand, M.L.; Skarpness, B. On the Efficiency of Using the Sample Kurtosis in Selecting Optimal Lp Estimators. Commun. Stat. Comput. 1983, 12, 265–272. [Google Scholar] [CrossRef]
  73. Hair, J.F.J.; Anderson, R.E.; Tatham, R.L.; Black, W.C. Multivariate Data Analysis, 5th ed.; Prentice Hall: Upper Saddle River, NJ, USA, 1998. [Google Scholar]
  74. Nunnally, J.C.; Bernstein, I.H. The Assessment of Reliability. Psychom. Theory 1994, 3, 248–292. [Google Scholar]
  75. Hair, J.F.; Sarstedt, M.; Pieper, T.M.; Ringle, C.M. The Use of Partial Least Squares Structural Equation Modeling in Strategic Management Research: A Review of Past Practices and Recommendations for Future Applications. Long Range Plann. 2012, 45, 320–340. [Google Scholar] [CrossRef]
  76. Ringle, C.M.; Sarstedt, M.; Straub, D.W. Editor’s Comments: A Critical Look at the Use of PLS-SEM in MIS Quarterly. Manag. Inf. Syst. Q. 2012, 36, 3–5. [Google Scholar] [CrossRef]
  77. Sarstedt, M.; Ringle, C.M.; Hair, J.F. Treating Unobserved Heterogeneity in PLS-SEM: A Multi-Method Approach. In Partial Least Squares Path Modeling; Latan, H., Noonan, R., Eds.; Springer: Cham, Switzerland, 2017. [Google Scholar]
  78. Henseler, J.; Sarstedt, M. Goodness-of-Fit Indices for Partial Least Squares Path Modeling. Comput. Stat. 2013, 28, 565–580. [Google Scholar] [CrossRef]
  79. Shi, G.; Chen, Z.; Xu, S.; Zhang, J.; Wang, L.; Bi, C.; Teng, J. Potentially Toxic Metal Contamination of Urban Soils and Roadside Dust in Shanghai, China. Environ. Pollut. 2008, 156, 251–260. [Google Scholar] [CrossRef]
  80. Hulland, J. Use of Partial Least Squares (PLS) in Strategic Management Research: A Review of Four Recent Studies. Strateg. Manag. J. 1999, 20, 195–204. [Google Scholar] [CrossRef]
  81. Fornell, C.; Larcker, D.F. Evaluating Structural Equation Models with Unobservable Variables and Measurement Error. J. Mark. Res. 1981, 18, 39. [Google Scholar] [CrossRef]
  82. Henseler, J.; Ringle, C.M.; Sarstedt, M. A New Criterion for Assessing Discriminant Validity in Variance-Based Structural Equation Modeling. J. Acad. Mark. Sci. 2015, 43, 115–135. [Google Scholar] [CrossRef]
  83. Kock, N. Common Method Bias in PLS-SEM: A Full Collinearity Assessment Approach. Int. J. e-Collab. 2015, 11, 1–10. [Google Scholar] [CrossRef]
  84. Cohen, J. Statistical Power Analysis for the Behavioral Sciences; Erlbaum: Hillsdale, NJ, USA, 1988. [Google Scholar]
  85. Peng, D.X.; Lai, F. Using Partial Least Squares in Operations Management Research: A Practical Guideline and Summary of Past Research. J. Oper. Manag. 2012, 30, 467–480. [Google Scholar] [CrossRef]
  86. Chin, W.W. How to Write up and Report PLS Analyses. In Handbook of Partial Least Squares: Concepts, Methods and Applications in Marketing and Related Fields; Vinzi, V.E., Chin, W.W., Henseler, J., Wang, H., Eds.; Springer: Berlin/Heidelberg, Germany, 2010; pp. 655–690. [Google Scholar]
  87. Akter, S.; D’Ambra, J.G.; Ray, P.K. An Evaluation of PLS Based Complex Models: The Roles of Power Analysis, Predictive Relevance and GoF Index. In Proceedings of the Americas Conference on Information Systems, Detroit, MI, USA, 4–8 August 2011. [Google Scholar]
  88. Wong, K.K.K. Partial Least Squares Structural Equation Modeling (PLS-SEM) Techniques Using SmartPLS. Mark. Bull. 2013, 24, 1–32. [Google Scholar]
  89. Hair, J.F.; Ringle, C.M.; Sarstedt, M. PLS-SEM: Indeed a Silver Bullet. J. Mark. Theory Pract. 2011, 19, 139–152. [Google Scholar] [CrossRef]
  90. Hair, J.F.; Hult, G.T.M.; Ringle, C.M.; Sarstedt, M.; Thiele, K.O. Mirror, Mirror on the Wall: A Comparative Evaluation of Composite-Based Structural Equation Modeling Methods. J. Acad. Mark. Sci. 2017, 45, 616–632. [Google Scholar] [CrossRef]
  91. Hair, J.F.; Black, W.C.; Babin, B.J.; Anderson, R.E. Multivariate Data Analysis; Pearson Education Limited: Modesto, CA, USA, 2014. [Google Scholar]
  92. Ringle, C.; Da Silva, D.; Bido, D. Structural Equation Modeling with the SmartPLS. Braz. J. Mark. 2015, 13, 56–73. [Google Scholar] [CrossRef]
  93. Streukens, S.; Sara, L.-W. Bootstrapping and PLS-SEM: A Step-by-Step Guide to Get More out of Your Bootstrap Results. Eur. Manag. J. 2016, 34, 618–632. [Google Scholar] [CrossRef]
  94. Lohmoller, J. Latent Variable Path Modelling with Partial Least Squares; Physica-Verlag: Heidelberg, Germany, 1989. [Google Scholar]
  95. Chin, W.W.; Peterson, R.A.; Brown, S.P. Structural Equation Modeling in Marketing: Some Practical Reminders. J. Mark. Theory Pract. 2008, 16, 287–298. [Google Scholar] [CrossRef]
Figure 1. Conceptual framework. Source: Researchers’ elaboration. Note: ME = mediating effect and SE = strengthening effect.
Sustainability 16 06843 g001
Figure 2. Research method. Source: Researchers’ elaboration.
Sustainability 16 06843 g002
Figure 3. Path model with hypothesis testing outcomes. Source: Smart-PLS 4.0.
Sustainability 16 06843 g003
Figure 4. Assessment of convergent validity of second-order constructs. Source: Smart-PLS 4.0.
Sustainability 16 06843 g004
Table 1. Demographic profile.
FactorCategoryFrequencyPercentage
GenderMale32194.41
Female195.59
Age (in years)30–39175.00
40–4913238.82
50–5916147.35
60 and above308.82
EducationMaster’s/Post-graduation33799.12
PhD30.88
Job titleCEOs5817.06
Top-level managers21262.35
Mid-level managers7020.59
Years of experience Less than 10195.59
10 to 1911132.65
20 to 2919757.94
30 and above133.82
Source: Survey questionnaire.
Table 2. Univariate normality.
ItemMeanStandard DeviationKurtosisSkewness
GED13.070.98−0.38−0.32
GED23.331.02−0.35−0.46
GED33.500.98−0.27−0.48
GED43.511.09−0.19−0.56
GED53.431.01−0.15−0.64
GSCP13.970.881.13−0.94
GSCP24.040.871.01−0.94
GSCP33.810.810.36−0.46
GSCP43.680.90−0.16−0.37
GSCP53.570.88−0.01−0.33
IGO13.661.03−0.66−0.43
IGO23.740.87−0.23−0.37
IGO33.890.93−0.24−0.54
IGO43.830.99−0.29−0.57
IGO53.920.90−0.21−0.54
FP13.770.89−0.01−0.43
FP23.770.792.01−1.01
FP33.850.890.02−0.48
EP13.570.890.39−0.68
EP23.460.91−0.21−0.56
EP33.241.02−0.91−0.04
EP43.590.87−0.10−0.55
MP13.460.920.06−0.59
MP23.620.790.36−0.49
MP33.421.00−0.77−0.10
PCA12.820.97−0.280.06
PCA23.430.98−0.72−0.38
PCA32.971.01−0.590.00
PCA43.021.06−0.70−0.03
PCA53.520.800.47−0.44
SCLS13.510.850.21−0.41
SCLS23.730.79−0.21−0.32
SCLS33.910.951.04−0.97
SCLS42.431.130.55−0.80
SCLS52.190.980.77−0.54
Source: SPSS 29.
Table 3. Exploratory factor analysis with indicator reliability and model fitting information.
Factor AssociationFactor Loading SDt-StatisticsIRCACRAVE
Environmental performance (EP)EP1 ← EP0.830.0241.730.700.760.860.68
EP2 ← EP0.840.0241.770.70
EP4 ← EP0.800.0233.590.63
Financial performance (FP)FP1 ← FP0.860.0249.760.740.720.840.64
FP2 ← FP0.750.0322.200.56
FP3 ← FP0.790.0330.890.62
Green eco-design (GED)GED1 ← GED0.660.0415.780.430.850.890.63
GED2 ← GED0.820.0245.430.68
GED3 ← GED0.840.0244.190.71
GED4 ← GED0.830.0244.320.68
GED5 ← GED0.810.0243.070.65
Green supply chain partnering (GSCP)GSCP1 ← GSCP0.730.0323.450.530.790.850.54
GSCP2 ← GSCP0.760.0326.310.57
GSCP3 ← GSCP0.790.0331.680.62
GSCP4 ← GSCP0.700.0320.710.49
GSCP5 ← GSCP0.700.0416.930.49
Internal green orientation (IGO)IGO1 ← IGO0.690.0418.030.470.850.900.63
IGO2 ← IGO0.800.0235.140.64
IGO3 ← IGO0.830.0243.290.69
IGO4 ← IGO0.830.0242.290.69
IGO5 ← IGO0.820.0239.520.67
Marketing performance (MP)MP1 ← MP0.820.0237.650.660.710.820.60
MP2 ← MP0.830.0242.660.69
MP3 ← MP0.660.0513.900.44
Perceived competitive advantage (PCA)PCA2 ← PCA0.640.0511.770.410.730.830.54
PCA5 ← PCA0.760.0419.360.58
PCA6 ← PCA0.810.0332.090.65
PCA8 ← PCA0.720.0418.020.52
Note: IR = indicator reliability. Source: Smart-PLS 4.0.
Table 4. Reliability indices and criteria.
Reliability IndexCriteriaReference
AVE>0.50[75,76,77]
CR>0.80[78]
CA>0.70[78,79]
ILV0.60 to 0.70[75,76,77,80]
Note: ILV = indicator loading value. Source: Smart-PLS 4.0.
Table 5. Discriminant validity.
FactorEPFPGEDGSCPIGOMPPCA
EP0.82
FP0.520.80
GED0.530.620.79
GSCP0.580.630.490.74
IGO0.510.640.490.670.80
MP0.510.390.410.580.480.77
PCA0.420.390.390.570.390.490.74
Source: Smart-PLS 4.0.
Table 6. HTMT analysis.
FactorEPFPGEDGSCPIGOMPPCA
EP
FP0.70
GED0.640.76
GSCP0.750.830.58
IGO0.620.810.540.80
MP0.690.540.520.800.61
PCA0.540.500.480.720.460.73
Source: Smart-PLS 4.0.
Table 7. CMB test.
Table 7. CMB test.
FactorEPFPGEDGSCPIGOMPOPPCA
GSCMPs 1.0001.0001.000 1.4791.000
OP1.0001.000 1.000
PCA 1.479
Source: Smart-PLS 4.0.
Table 8. Path model.
PathBetaSDLLULt-Statisticsp-ValuesCommentR2 Values
GSCMPs → OP0.7450.0290.6570.77124.4360.000Supported0.685
GSCMPs → PCA0.5350.0440.4450.61812.1800.000Supported0.287
PCA → OP0.1390.0370.1010.2474.6910.000Supported0.334
Note: SD = standard deviation; LL = lower limit; and UL = upper limit. Source: Smart-PLS 4.0.
Table 9. Mediating effect.
PathBetaSDLLULt-Statisticsp-ValuesMediation
GSCMPs → PCA → OP0.0930.0220.0520.1394.2050.000Partial mediation
Note: SD = standard deviation; LL = lower limit; and UL = upper limit. Source: Smart-PLS 4.0.
Table 10. Moderating effect.
Constructs: Sustainability 16 06843 i001
Independent constructPCA
ModeratorSCLS
Dependent constructOP
Unstandardized regression coefficients:
PCA--->OP0.263
SCLS--->OP0.189
PCA_X_SCLS--->OP0.056
Source: Smart-PLS 4.0.
Table 11. R2 value, communality, and redundancy.
ConstructR2 AdjustedQ2f2 for OPF2 for GSCMPs
EP0.7290.3482.705
FP0.630.2861.711
GED0.6110.448 1.576
GSCP0.7370.339 2.812
IGO0.7560.309 3.109
MP0.5810.4491.395
PCA0.2840.2510.0440.402
Source: Smart-PLS 4.0.
Table 12. Test of significance of weights.
PathBetaSDLLULt-Statisticsp-ValuesComment VIF
EP → OP0.2980.0510.1890.3885.7520.000Supported 1.608
FP → OP0.5810.0500.5160.71112.3750.000Supported 1.407
MP → OP0.3550.0450.2320.4117.0340.000Supported 1.388
GED → GSCMPs0.3600.0460.3210.5008.9580.000Supported 1.405
GSCP → GSCMPs0.6180.0520.3670.5698.9490.000Supported 1.945
IGO→ GSCMPs0.1960.0530.2100.4185.9560.000Supported 1.945
R Square0.696
Q2 value0.43
Note: SD = standard deviation; LL = lower level; and UL = upper level. Source: Smart-PLS 4.0.
Disclaimer/Publisher’s Note: The statements, opinions and data contained in all publications are solely those of the individual author(s) and contributor(s) and not of MDPI and/or the editor(s). MDPI and/or the editor(s) disclaim responsibility for any injury to people or property resulting from any ideas, methods, instructions or products referred to in the content.

