

Understanding Consumer Perception towards Sustainable Apparel: A Parallel Mediation Analysis on Satisfaction and Trust


Abstract
:1. Introduction
2. Literature Review and Hypothesis Development
2.1. Sustainable Apparel
2.2. Perceived Value
2.3. Satisfaction
2.4. Trust
2.5. Loyalty
2.6. Value–Satisfaction–Loyalty Chain
3. Research Design
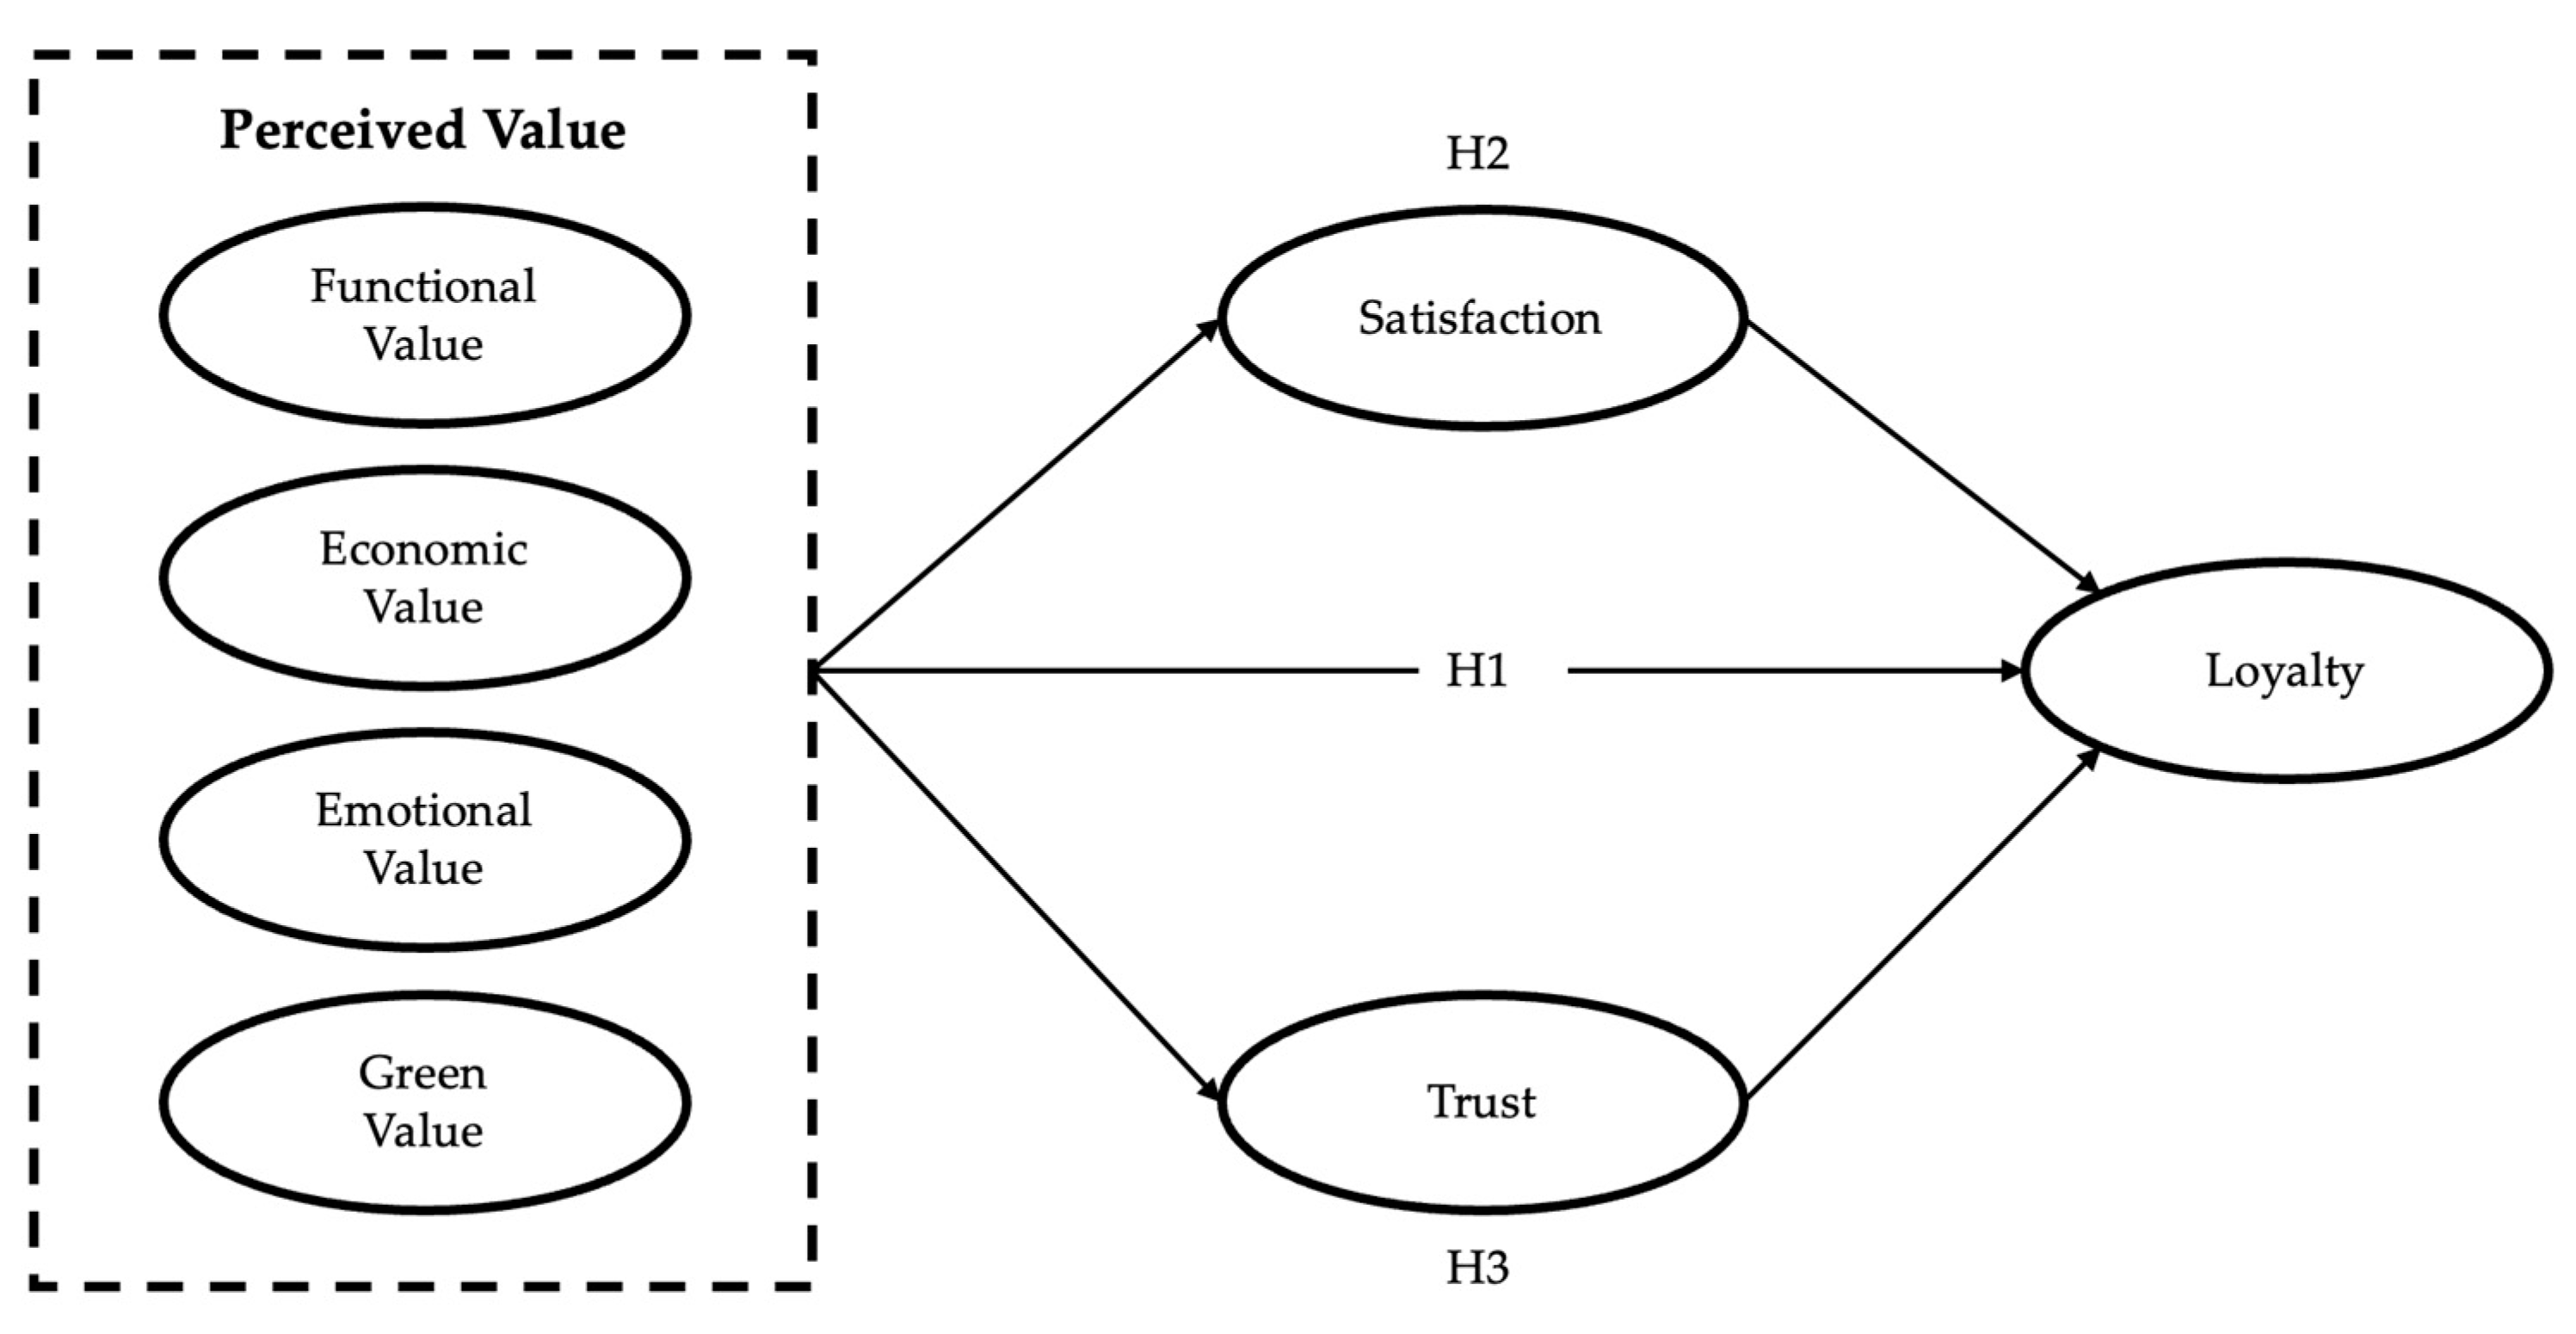
3.1. Research Model
3.2. Hypothesis Development
3.2.1. The Relationship between PV and LY
3.2.2. SAT as Mediator
3.2.3. TR as Mediator
4. Methodology
4.1. Data Collection and Sample
4.2. Measures
5. Results
5.1. Analysis Method
5.2. Validity and Reliability
5.3. Correlation Analysis
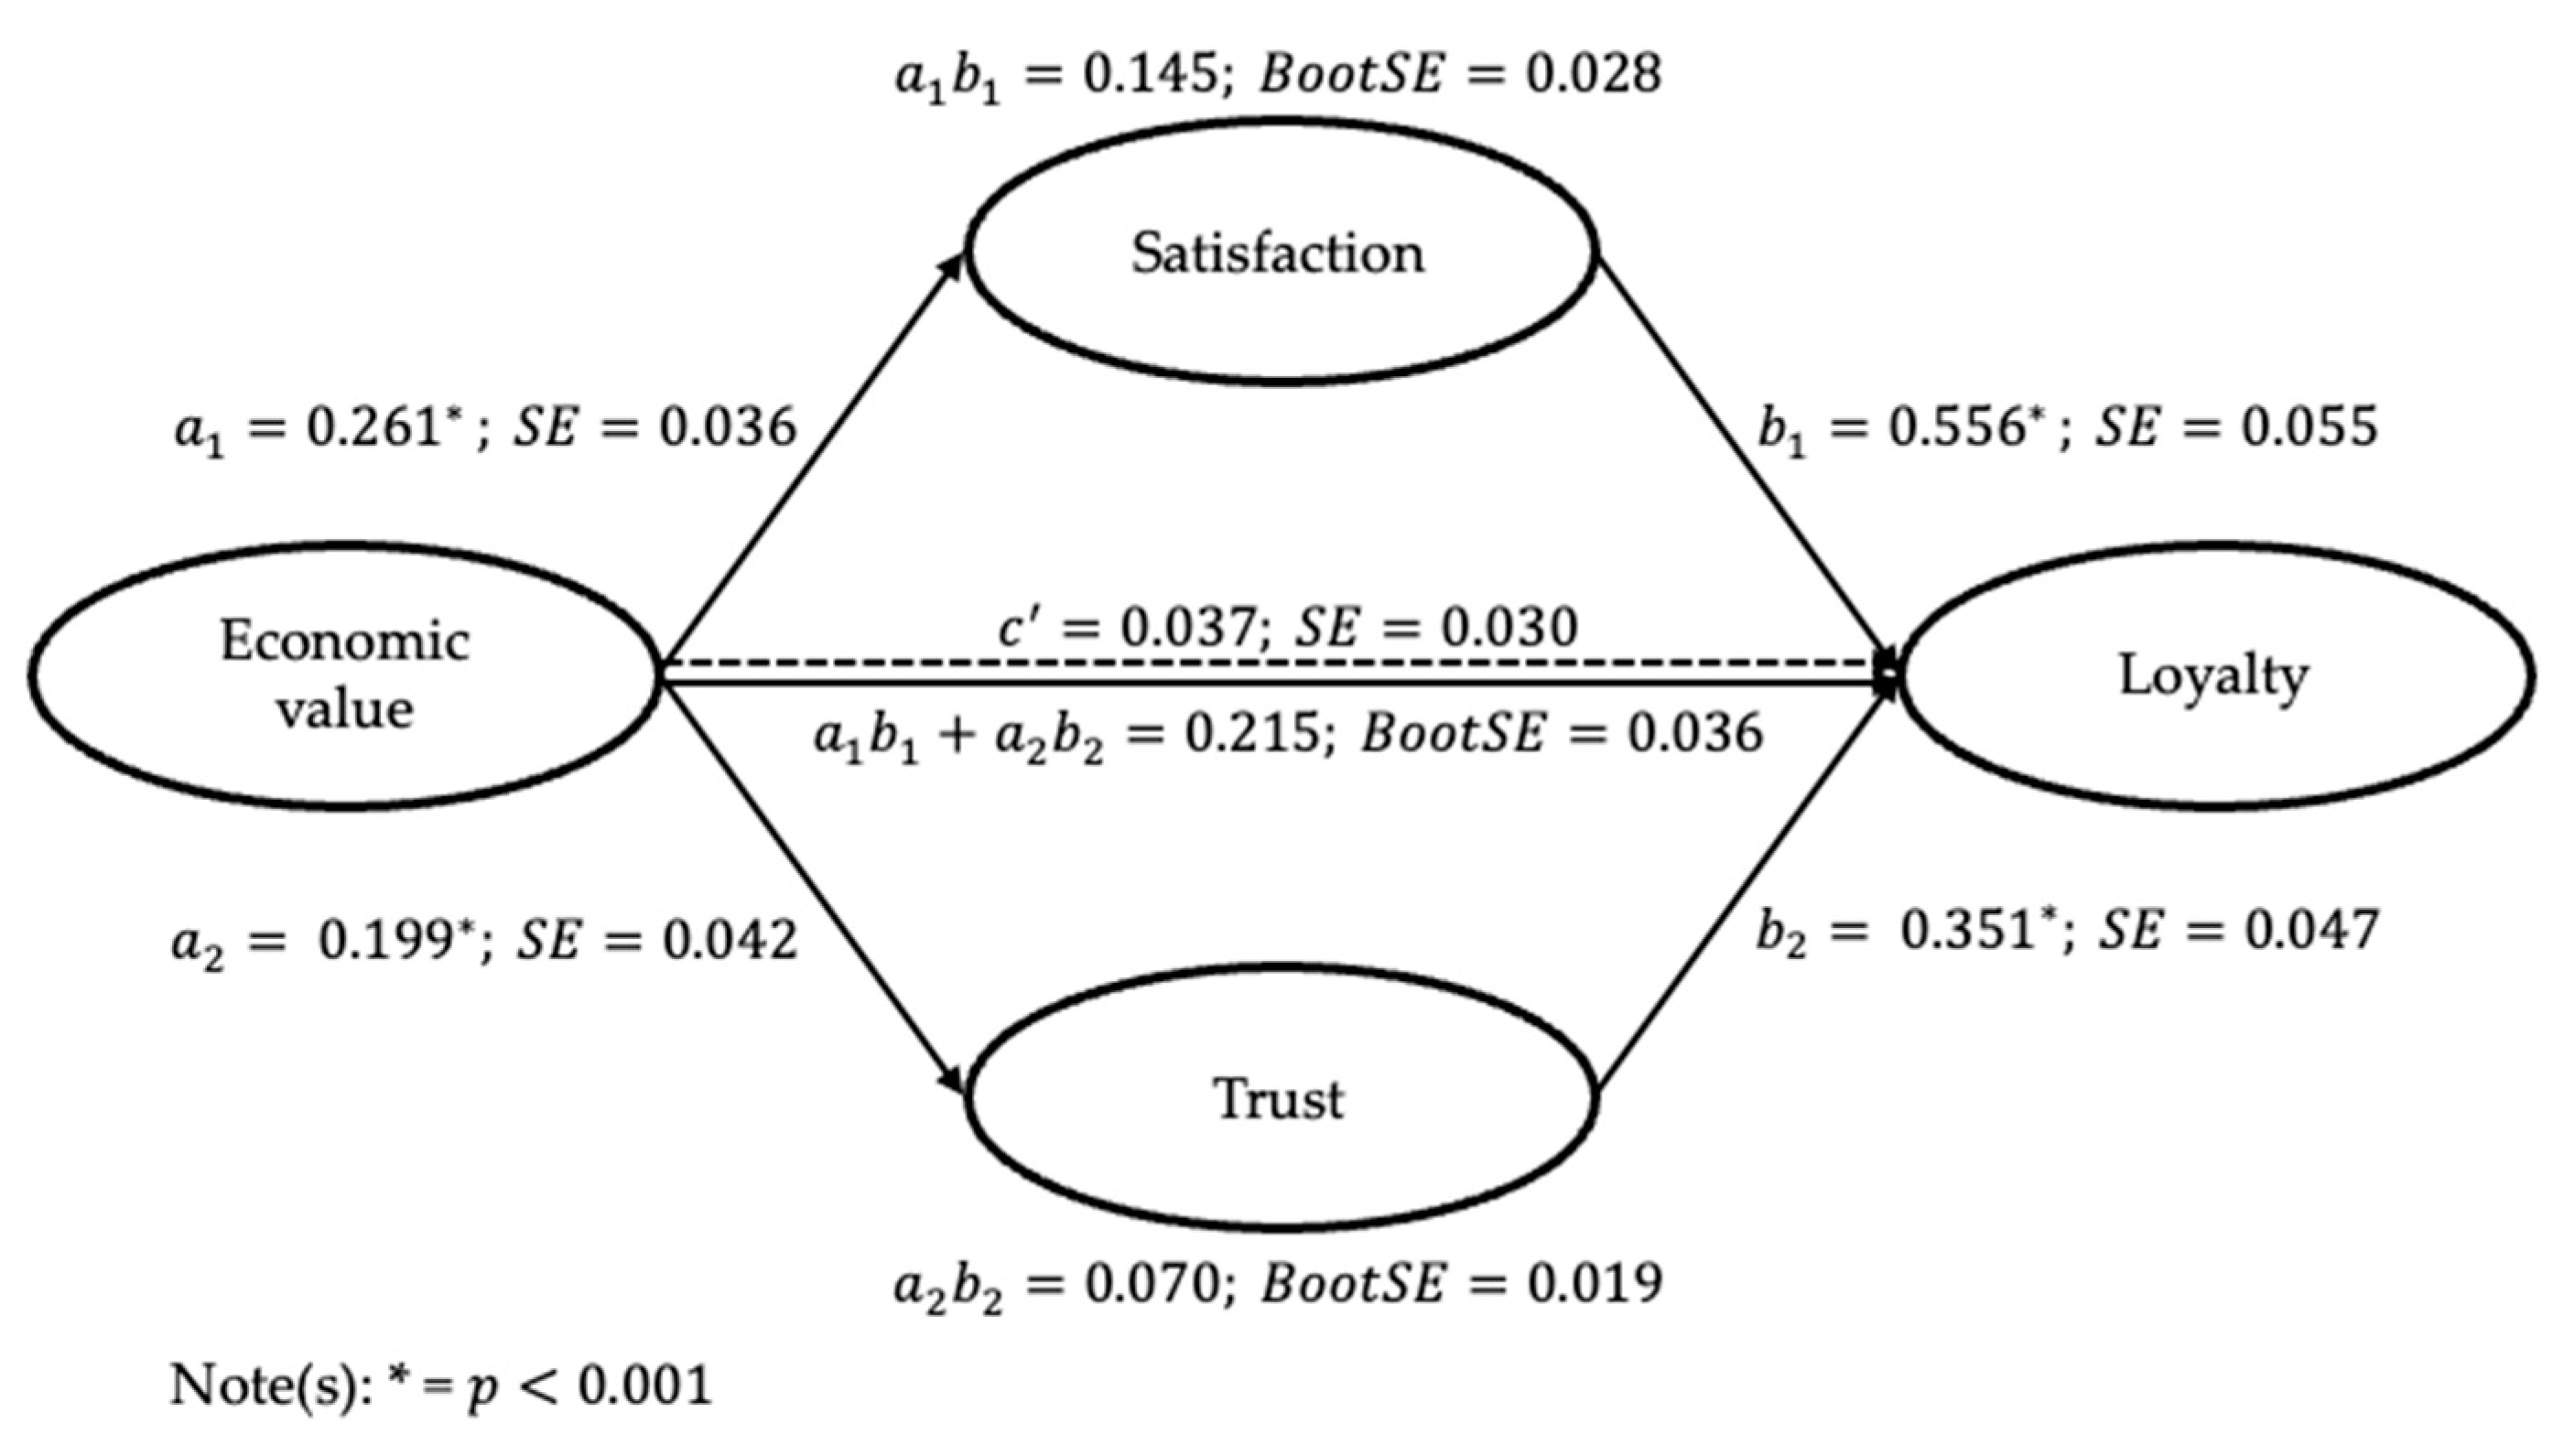
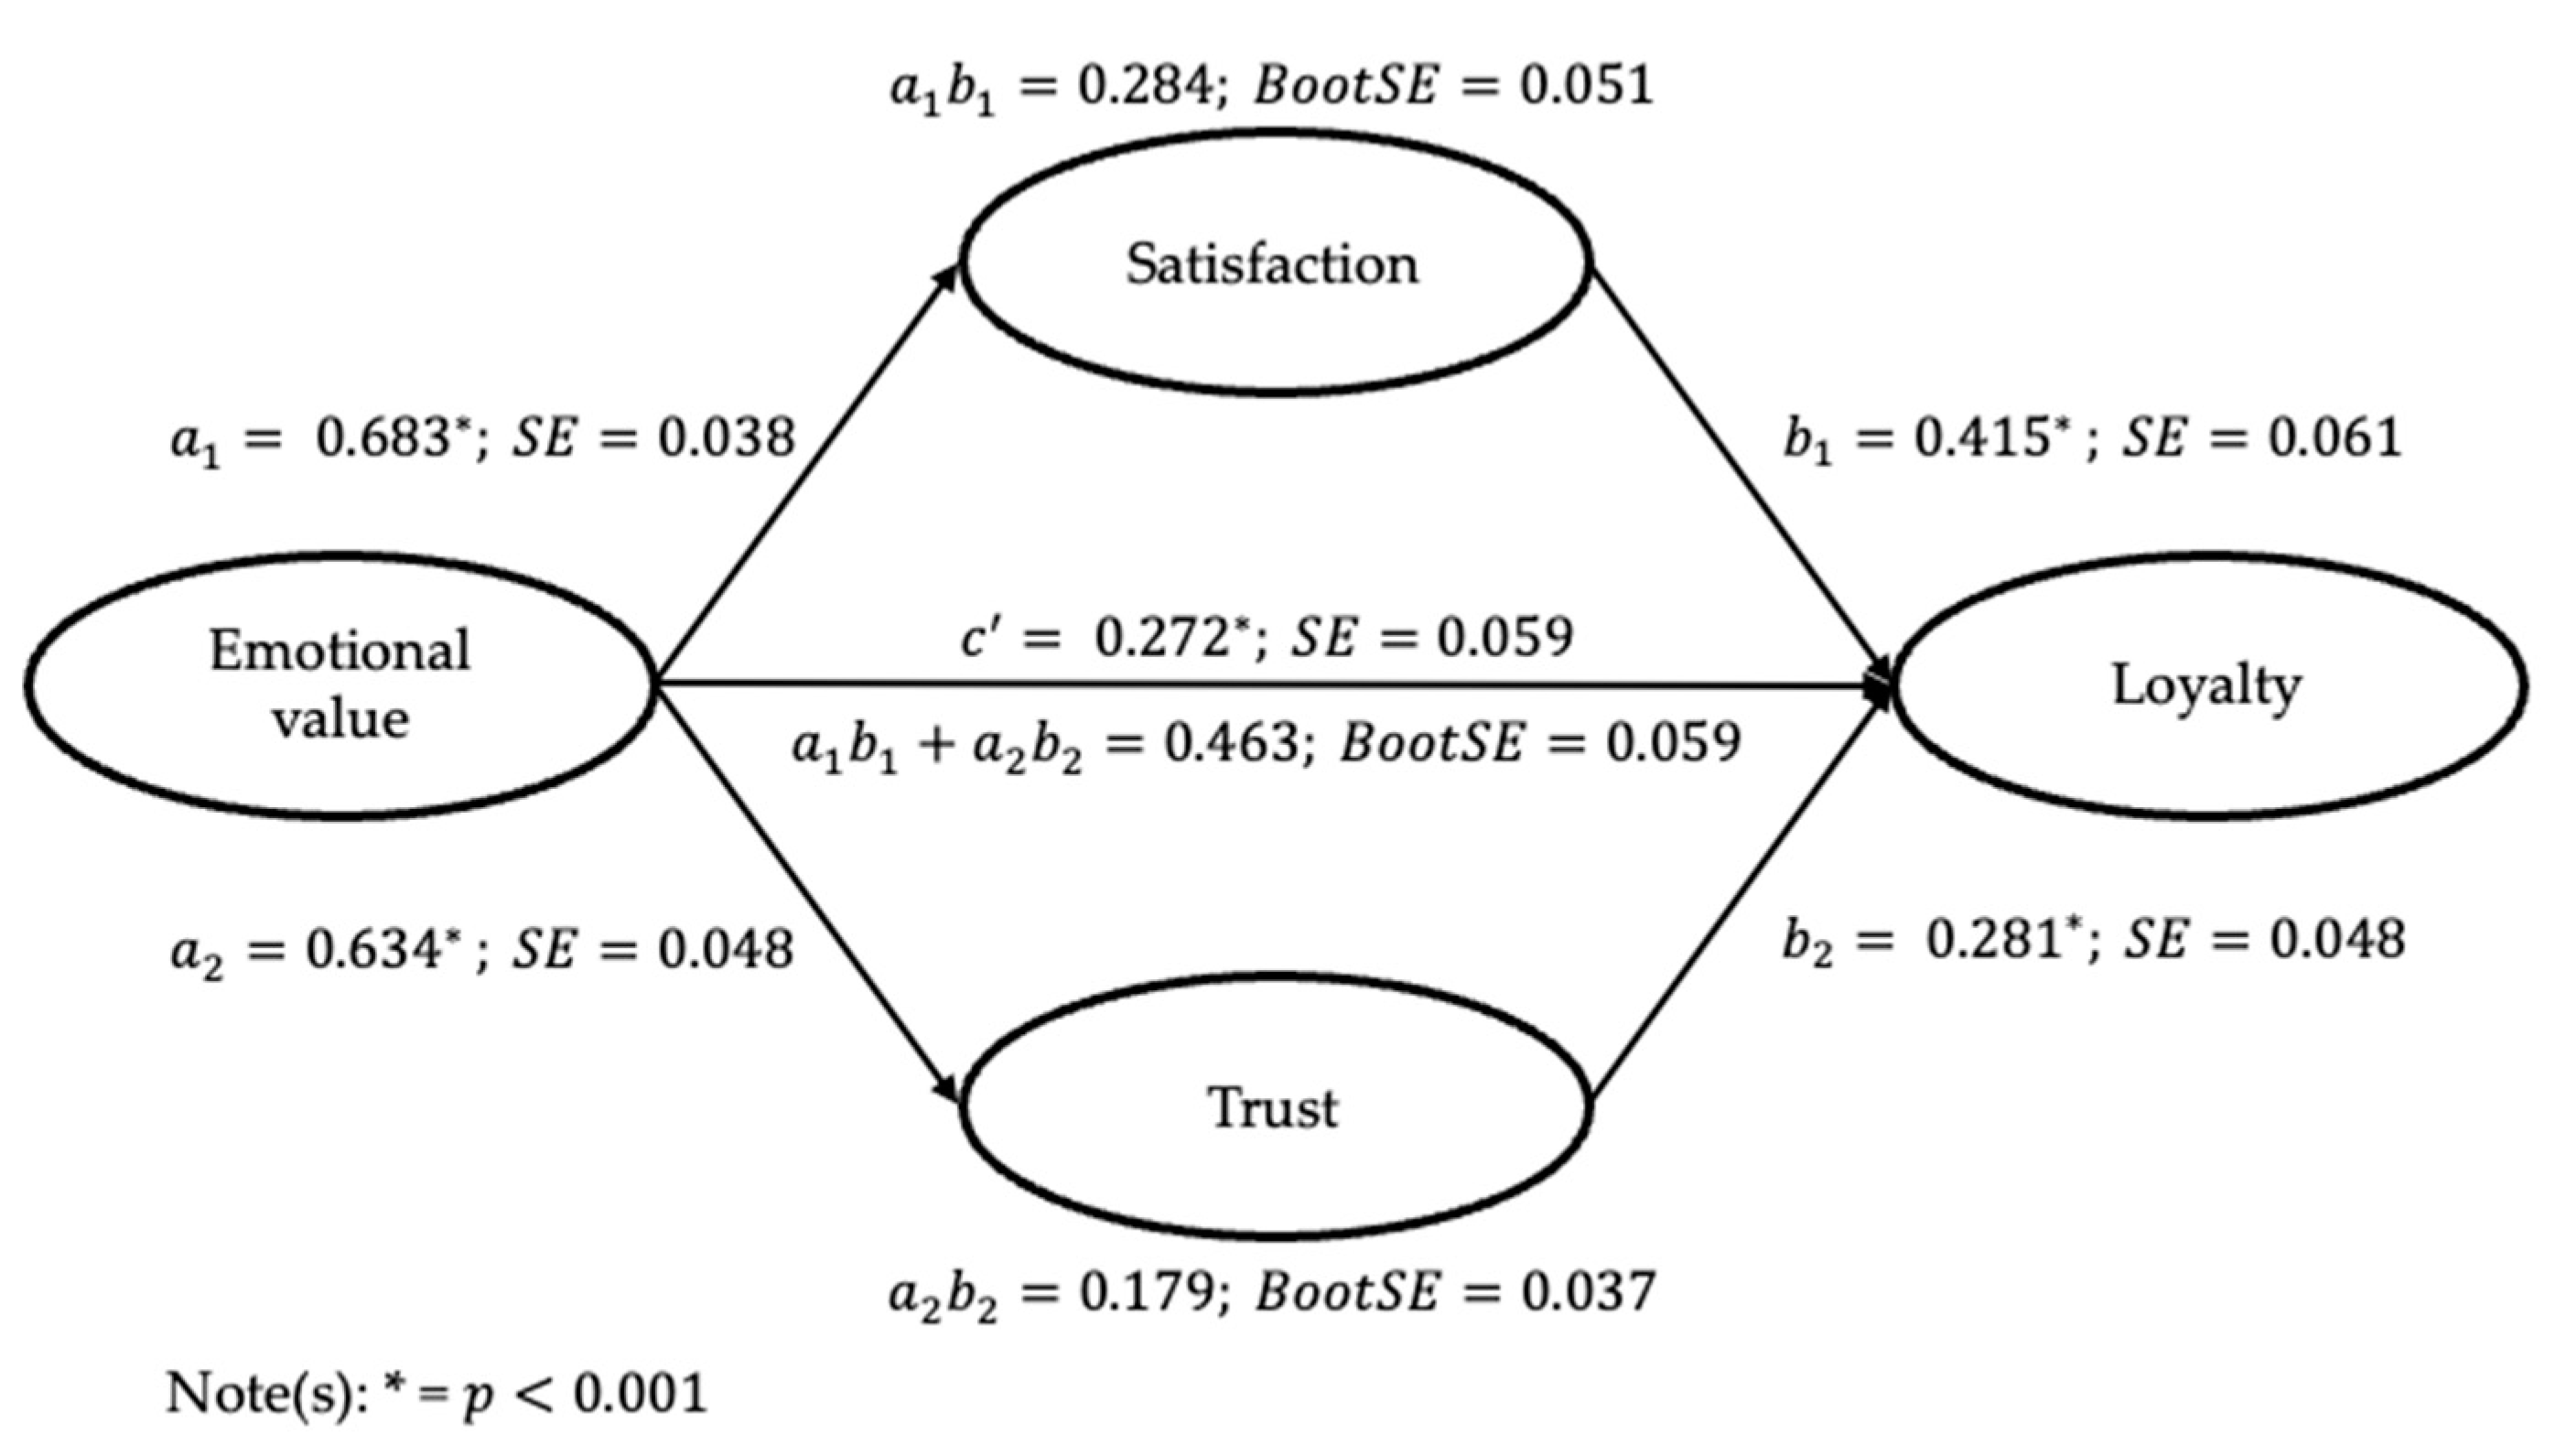
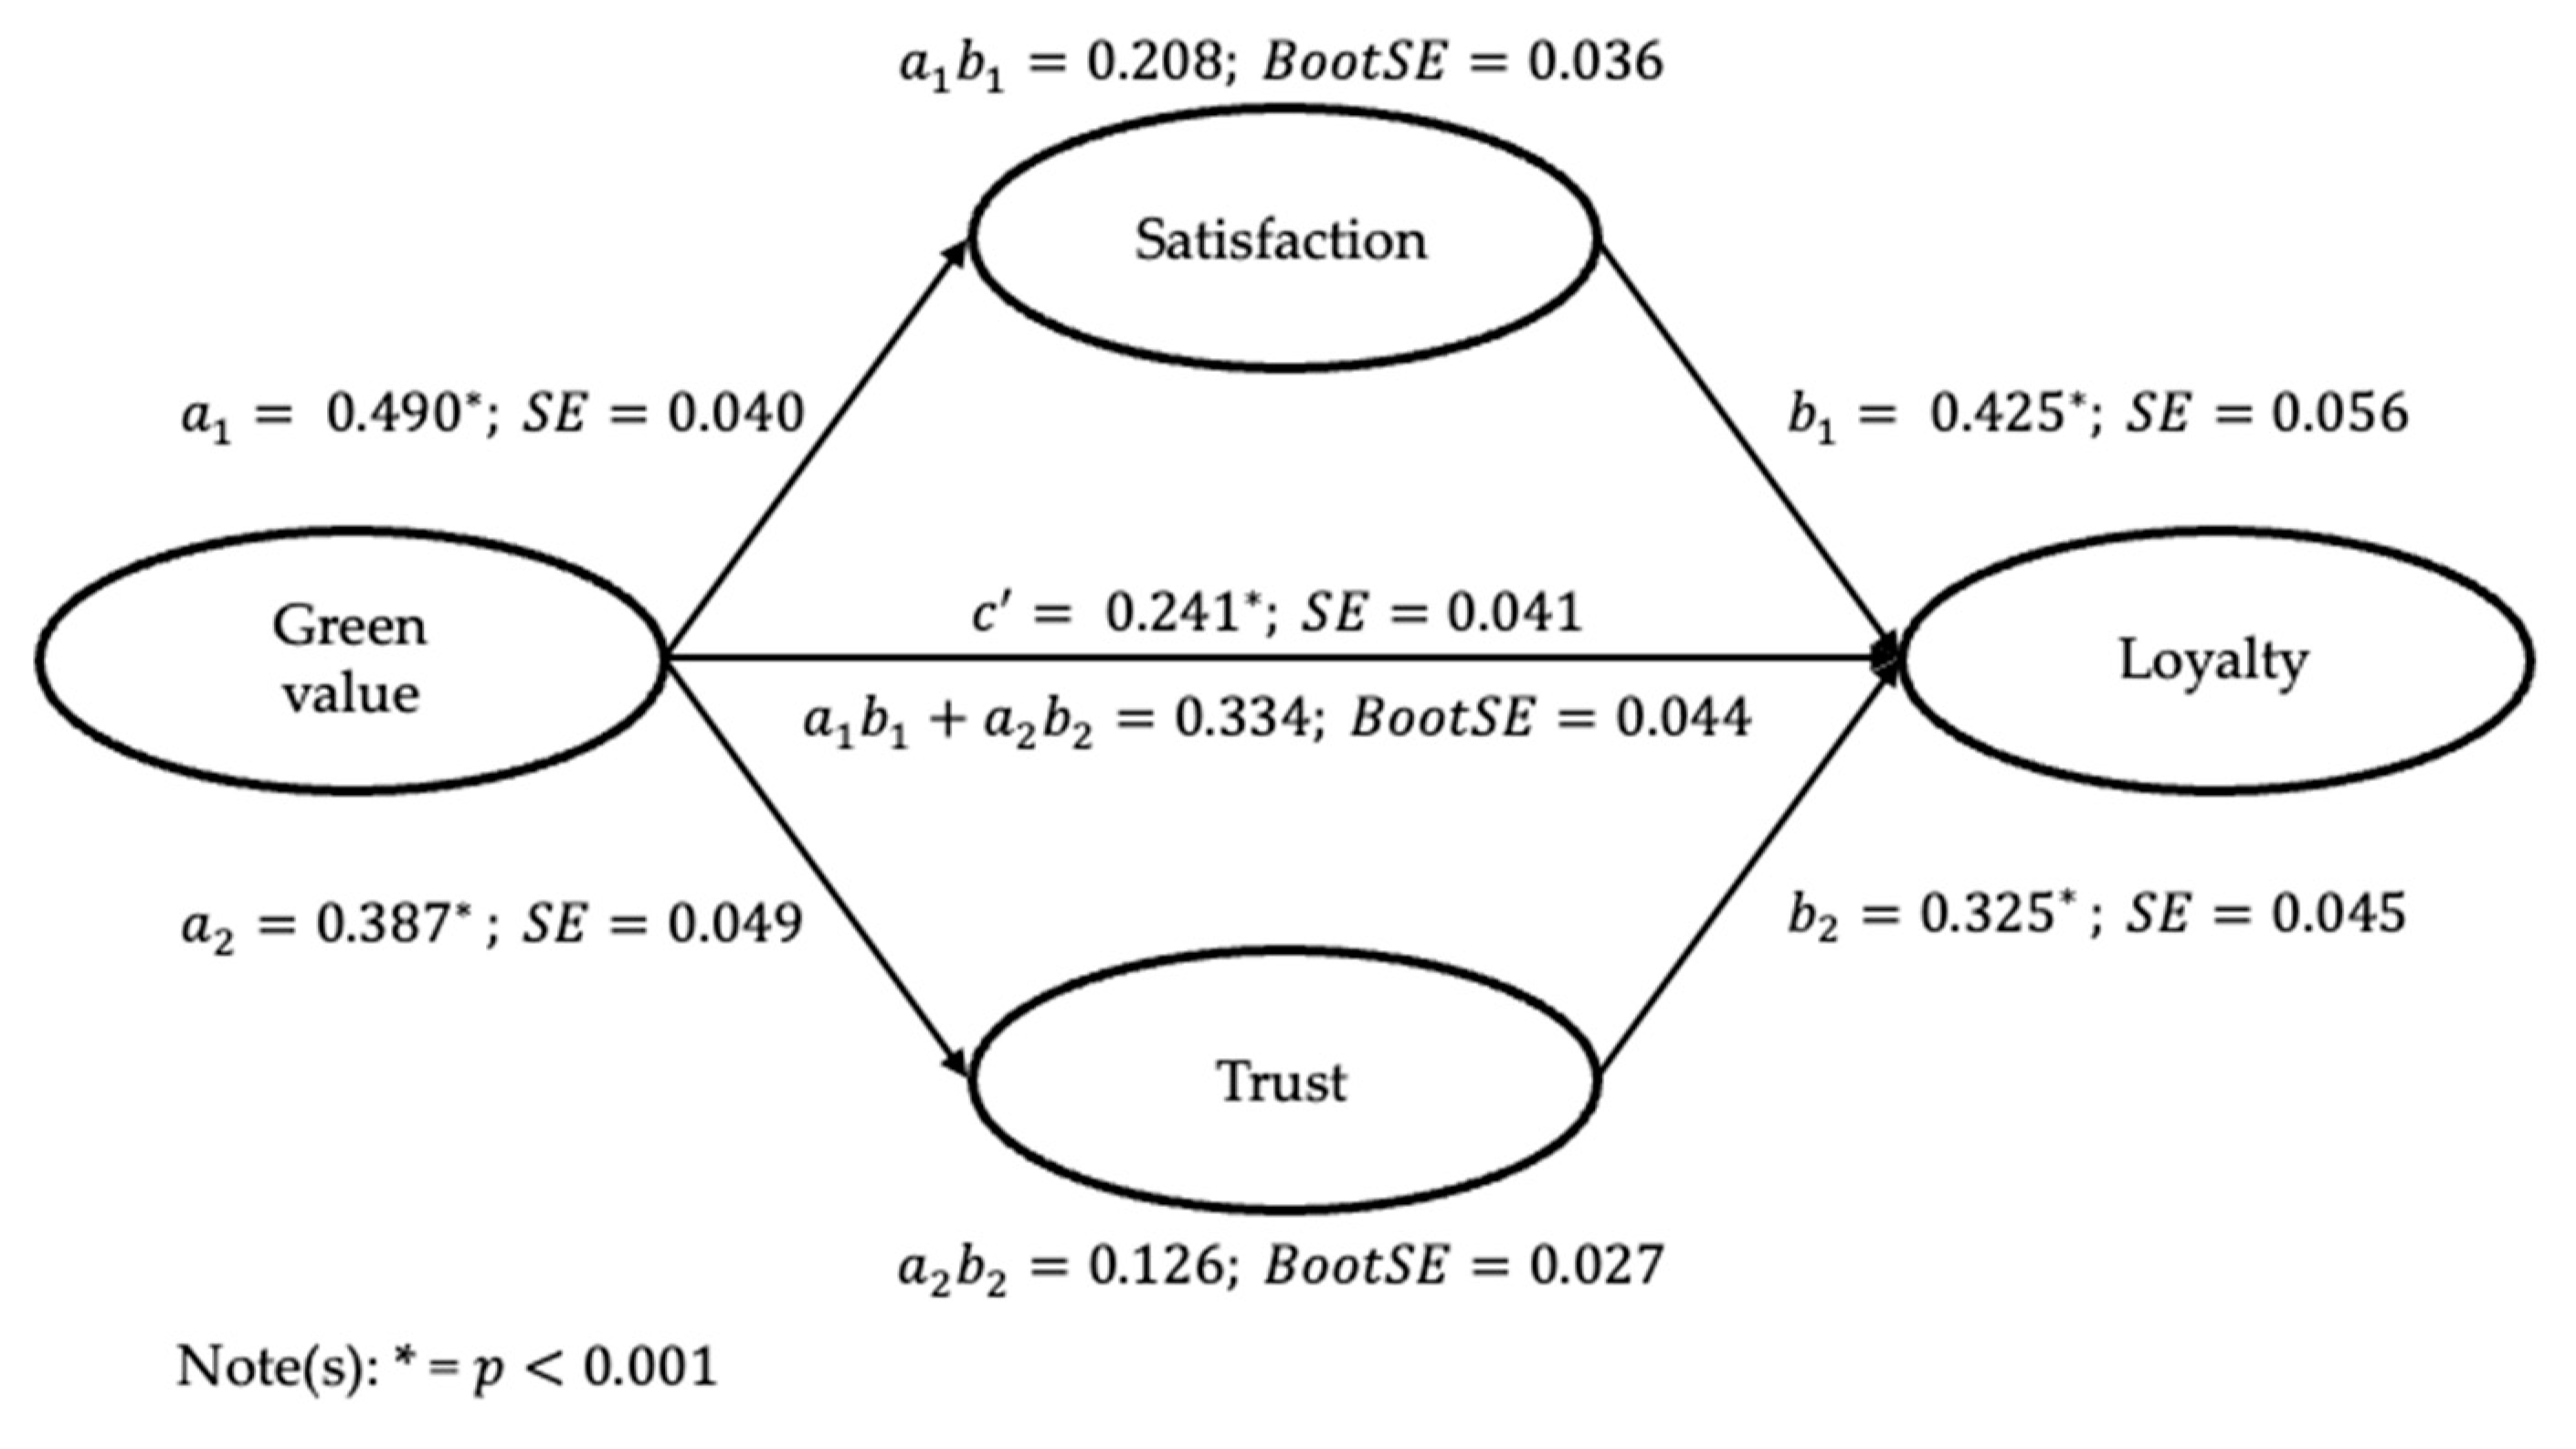
5.4. Parallel Multiple Mediator Model Analysis
5.4.1. Direct Effect
5.4.2. Indirect Effect of SAT and TR
5.4.3. Results of Statistical Analysis
6. Discussions
7. Conclusions
Author Contributions
Funding
Institutional Review Board Statement
Informed Consent Statement
Data Availability Statement
Conflicts of Interest
Appendix A

| Variables | Questionnaire Items | Source |
|---|---|---|
| Functional Value (FV) | Sustainable apparel has consistent quality. | Sweeney and Soutar (2001) [22] Forsythe et al. (1996) [71] Oh (2010) [72] Lin and Huang (2012) [73] Wang et al. (2013) [74] |
| Sustainable apparel can be used for a long time. | ||
| Sustainable apparel has attractive designs. | ||
| Sustainable apparel is easy to manage. | ||
| Sustainable apparel has excellent finishing (cutting, sewing, etc.). | ||
| Economic Value (ECV) | Sustainable apparel is reasonably priced. | Sweeney and Soutar (2001) [22] Lin and Huang (2012) [73] Na and Suh (2008) [75] |
| Sustainable apparel offers value for money. | ||
| Sustainable apparel would be economical. | ||
| Sustainable apparel is price competitive. | ||
| Emotional Value (EMV) | Sustainable apparel gives me pleasure. | Sweeney and Soutar (2001) [22] Oh (2010) [72] Lin and Huang (2012) [73] Wang et al. (2013) [74] |
| Sustainable apparel makes me feel good. | ||
| Sustainable apparel represents the image I pursue well. | ||
| Purchasing Sustainable apparel makes me feel like I am contributing to environmental protection. | ||
| Purchasing Sustainable apparel feels morally right because of its environmental performance. | ||
| Green Value (GV) | It is important to me that the products I use do not harm the environment. | Lin and Huang (2012) [73] Haws et al. (2014) [76] Vlastelica et al. (2023) [77] |
| I consider the potential environmental impact of my actions when making many of my decisions. | ||
| I consider the potential environmental impact of my actions when making my purchase decisions. | ||
| I would describe myself as environmentally responsible. | ||
| I am willing to be inconvenienced in order to take actions that are more environmentally friendly. | ||
| Satisfaction (SAT) | My overall satisfaction with sustainable apparel can be attributed to its environmental performance. | Lam et al. (2004) [30] Chen (2013) [78] Lutfie and Marcelino (2020) [79] Hashish et al. (2022) [80] |
| Sustainable apparel makes me happy. | ||
| Overall, sustainable apparel comes up to my expectations. | ||
| Sustainable apparel is good products. | ||
| Overall, I am very satisfied with sustainable apparel. | ||
| Trust (TR) | I know the sources of our raw materials. | Resmawati (2023) [51] Chen (2013) [78] Hashish et al. (2022) [80] Chen (2016) [81] Pang et al. (2022) [82] Cousins et al. (2019) [83] |
| I track the processes involved in producing product throughout our complete supply chain. | ||
| I trace the origin of our purchases through the entire supply chain. | ||
| I track the environmental performance of our complete supply chain. | ||
| I know what chemicals or elements are in our purchased components. | ||
| Loyalty (LY) | I will continue to use environmentally friendly apparel. | Lam et al. (2004) [30] Resmawati (2023) [51] Chen (2013) [78] Aslam et al. (2018) [84] Tan et al. (2023) [85] |
| If possible, I will repurchase environmentally friendly apparel. | ||
| I will speak positively about environmentally friendly apparel to those around me. | ||
| I will recommend environmentally friendly apparel to those around me. |
References
- Chu, K.M. Mediating influences of attitude on internal and external factors influencing consumers’ intention to purchase organic foods in China. Sustainability 2018, 10, 4690. [Google Scholar] [CrossRef]
- Caro, F.; Martínez-de-Albéniz, V. Fast fashion: Business model overview and research opportunities. In Retail Supply Chain Management: Quantitative Models and Empirical Studies, 2nd ed.; Narendra, A., Smith, S.A., Eds.; Springer: New York, NY, USA, 2015; pp. 237–264. [Google Scholar]
- Achabou, M.A.; Dekhili, S. Luxury and sustainable development: Is there a match? J. Bus. Res. 2013, 66, 1896–1903. [Google Scholar] [CrossRef]
- Remy, N.; Speelman, E.; Swartz, S. Style That’s Sustainable: A New Fast-Fashion Formula; McKinsey Global Institute: Chicago, IL, USA, 2016. [Google Scholar]
- Resta, B.; Gaiardelli, P.; Pinto, R.; Dotti, S. Enhancing environmental management in the textile sector: An organisational-life cycle assessment approach. J. Clean. Prod. 2016, 135, 620–632. [Google Scholar] [CrossRef]
- Yu, S.; Lee, J. The effects of consumers’ perceived values on intention to purchase upcycled products. Sustainability 2019, 11, 1034. [Google Scholar] [CrossRef]
- Lehtinen, A. Upcycling: An Analysis of Opinions within the Fashion Industry. Bachelor Thesis, Arcada University of Applied Sciences, Helsinki, Finland, 2021. [Google Scholar]
- Sdrolia, E.; Zarotiadis, G. Green way-out from depression: Insights from the EU. South-East. Eur. J. Econ. 2012, 10, 99–111. [Google Scholar]
- Durif, F.; Boivin, C.; Julien, C. In search of a green product definition. Innov. Mark. 2010, 6, 25–33. [Google Scholar]
- Saha, M.; Darnton, G. Green companies or green con-panies: Are companies really green, or are they pretending to be? Bus. Soc. Rev. 2005, 110, 117–157. [Google Scholar] [CrossRef]
- Ahn, Y.; Lee, J. Upcycling vs. Recycling: The Impact of Eco-Friendly Product Type, Self-Construal, Self-Expressive Cues on Consumers’ Purchase Intention. Int. J. Consum. Stud. 2020, 31, 117–143. [Google Scholar] [CrossRef]
- King, A.M.; Burgess, S.C.; Ijomah, W.; McMahon, C.A. Reducing waste: Repair, recondition, remanufacture or recycle? J. Sustain. Dev. 2006, 14, 257–267. [Google Scholar] [CrossRef]
- Payne, A. Open-and closed-loop recycling of textile and apparel products. In Handbook of Life Cycle Assessment (LCA) of Textiles and Clothing, 1st ed.; Muthu, S.S., Ed.; Woodhead Publishing: New Delhi, India, 2015; pp. 103–123. [Google Scholar]
- Braungart, M.; McDonough, W.; Bollinger, A. Cradle-to-cradle design: Creating healthy emissions–a strategy for eco-effective product and system design. J. Clean. Prod. 2007, 15, 1337–1348. [Google Scholar] [CrossRef]
- Sung, K.; Cooper, T.; Oehlmann, J.; Singh, J.; Mont, O. Multi-stakeholder perspectives on scaling up UK fashion upcycling businesses. Fash. Pract. 2020, 12, 331–350. [Google Scholar] [CrossRef]
- Pandit, P.; Ahmed, S.; Singha, K.; Shrivastava, S. Recycling from Waste in Fashion and Textiles: A Sustainable and Circular Economic Approach, 1st ed.; John Wiley & Sons: Hoboken, NJ, USA, 2020. [Google Scholar]
- Dodds, W.B.; Monroe, K.B.; Grewal, D. Effects of price, brand, and store information on buyers’ product evaluations. J. Mark. Res. 1991, 28, 307–319. [Google Scholar]
- Zeithaml, V.A. Consumer perceptions of price, quality, and value: A means-end model and synthesis of evidence. J. Mark. 1988, 52, 2–22. [Google Scholar] [CrossRef]
- Monroe, K.B. Pricing: Making Profitable Decisions, Subsequent ed.; McGraw-Hill College: Chicago, IL, USA, 1990. [Google Scholar]
- Krystallis, A.; Vassallo, M.; Chryssohoidis, G. The usefulness of Schwartz’s ‘Values Theory’ in understanding consumer behaviour towards differentiated products. J. Mark. Manag. 2012, 28, 1438–1463. [Google Scholar] [CrossRef]
- Sheth, J.N.; Newman, B.I.; Gross, B.L. Why we buy what we buy: A theory of consumption values. research J. Bus. Res. 1991, 22, 159–170. [Google Scholar] [CrossRef]
- Sweeney, J.C.; Soutar, G.N. Consumer perceived value: The development of a multiple item scale. J. Retail. 2001, 77, 203–220. [Google Scholar] [CrossRef]
- Pandey, M.; Yadav, P.S. Understanding the role of individual concerns, attitude, and perceived value in green apparel purchase intention; the mediating effect of consumer involvement and moderating role of generation Z&Y. Clean. Responsible Consum. 2023, 9, 100120. [Google Scholar]
- Jiang, Y.; Hong, F. Examining the relationship between customer-perceived value of night-time tourism and destination attachment among Generation Z tourists in China. Tour. Recreat. Res. 2023, 48, 220–233. [Google Scholar] [CrossRef]
- Yasir, N.; Babar, M.; Mehmood, H.S.; Xie, R.; Guo, G. The environmental values play a role in the development of green entrepreneurship to achieve sustainable entrepreneurial intention. Sustainability 2023, 15, 6451. [Google Scholar] [CrossRef]
- Katz, A. An industrial dynamic approach to the management of research and development. IEEE Trans. Eng. Manag. 1959, 3, 75–80. [Google Scholar] [CrossRef]
- Oliver, R.L. A cognitive model of the antecedents and consequences of satisfaction decisions. J. Mark. Res. 1980, 17, 460–469. [Google Scholar] [CrossRef]
- González-Viralta, D.; Veas-González, I.; Egaña-Bruna, F.; Vidal-Silva, C.; Delgado-Bello, C.; Pezoa-Fuentes, C. Positive effects of green practices on the consumers’ satisfaction, loyalty, word-of-mouth, and willingness to pay. Heliyon 2023, 9, e20353. [Google Scholar] [CrossRef] [PubMed]
- Chaturvedi, P.; Kulshreshtha, K.; Tripathi, V.; Agnihotri, D. Investigating the impact of restaurants’ sustainable practices on consumers’ satisfaction and revisit intentions: A study on leading green restaurants. Asia-Pac. J. Bus. Adm. 2024, 16, 41–62. [Google Scholar] [CrossRef]
- Lam, S.Y.; Shankar, V.; Erramilli, M.K.; Murthy, B. Customer value, satisfaction, loyalty, and switching costs: An illustration from a business-to-business service context. J. Acad. Mark. Sci. 2004, 32, 293–311. [Google Scholar] [CrossRef]
- Lee, R.T.; Ashforth, B.E. On the meaning of Maslach’s three dimensions of burnout. J. Appl. Psychol. 1990, 75, 743. [Google Scholar] [CrossRef] [PubMed]
- Wu, Y.; Huang, H. Influence of perceived value on consumers’ continuous purchase intention in live-streaming e-commerce—Mediated by consumer trust. Sustainability 2023, 15, 4432. [Google Scholar] [CrossRef]
- Garbarino, E.; Johnson, M.S. The different roles of satisfaction, trust, and commitment in customer relationships. J. Mark. 1999, 63, 70–87. [Google Scholar] [CrossRef]
- McKnight, D.H.; Chervany, N.L. What trust means in e-commerce customer relationships: An interdisciplinary conceptual typology. Int. J. Electron. Commer. 2001, 6, 35–59. [Google Scholar] [CrossRef]
- Venkatakrishnan, J.; Alagiriswamy, R.; Parayitam, S. Web design and trust as moderators in the relationship between e-service quality, customer satisfaction and customer loyalty. TQM J. 2023, 35, 2455–2484. [Google Scholar] [CrossRef]
- Sahay, B.S. Understanding trust in supply chain relationships. Ind. Manag. Data Syst. 2003, 103, 553–563. [Google Scholar] [CrossRef]
- Sharfman, M.P.; Shaft, T.M.; Anex, R.P., Jr. The road to cooperative supply-chain environmental management: Trust and uncertainty among pro-active firms. Bus. Strateg. Environ. 2009, 18, 1–13. [Google Scholar] [CrossRef]
- Moodaley, W.; Telukdarie, A. Greenwashing, sustainability reporting, and artificial intelligence: A systematic literature review. Sustainability 2023, 15, 1481. [Google Scholar] [CrossRef]
- Sodhi, M.S.; Tang, C.S. Research opportunities in supply chain transparency. Prod. Oper. Manag. 2019, 28, 2946–2959. [Google Scholar] [CrossRef]
- Kraft, T.; Valdés, L.; Zheng, Y. Consumer trust in social responsibility communications: The role of supply chain visibility. Prod. Oper. Manag. 2022, 31, 4113–4130. [Google Scholar] [CrossRef]
- Bechini, A.; Cimino, M.G.; Marcelloni, F.; Tomasi, A. Patterns and technologies for enabling supply chain traceability through collaborative e-business. Inf. Softw. Technol. 2008, 50, 342–359. [Google Scholar] [CrossRef]
- Skilton, P.F.; Robinson, J.L. Traceability and normal accident theory: How does supply network complexity influence the traceability of adverse events? J. Supply Chain Manag. 2009, 45, 40–53. [Google Scholar] [CrossRef]
- Oliver, R.L. Whence consumer loyalty? J. Mark. 1999, 63, 33–44. [Google Scholar] [CrossRef]
- Naqvi, M.H.A.; Hongyu, Z.; Naqvi, M.H.; Kun, L. Impact of service agents on customer satisfaction and loyalty: Mediating role of Chatbots. J. Model. Manag. 2024, 19, 470–491. [Google Scholar] [CrossRef]
- Al Karim, R.; Alam, M.M.D.; Al Balushi, M.K. The nexus between CRM and competitive advantage: The mediating role of customer loyalty. Nankai Bus. Rev. Int. 2024, 15, 248–268. [Google Scholar] [CrossRef]
- Jung, J.; Kim, S.J.; Kim, K.H. Sustainable marketing activities of traditional fashion market and brand loyalty. J. Bus. Res. 2020, 120, 294–301. [Google Scholar] [CrossRef]
- Sirdeshmukh, D.; Singh, J.; Sabol, B. Consumer trust, value, and loyalty in relational exchanges. J. Mark. 2002, 66, 15–37. [Google Scholar] [CrossRef]
- Nadeem, W.; Khani, A.H.; Schultz, C.D.; Adam, N.A.; Attar, R.W.; Hajli, N. How social presence drives commitment and loyalty with online brand communities? the role of social commerce trust. J. Retail. Consum. Serv. 2020, 55, 102136. [Google Scholar] [CrossRef]
- Fishbein, M.; Ajzen, I. Belief, attitude, intention, and behavior: An introduction to theory and research. Philos. Rhetor. 1977, 10, 130–132. [Google Scholar]
- Morwitz, V.G.; Steckel, J.H.; Gupta, A. When do purchase intentions predict sales? Int. J. Forecast. 2007, 23, 347–364. [Google Scholar] [CrossRef]
- Resmawati, R. The effect of brand image, price, trust, and value on repurchase intention of lifebuoy antibacterial soap. In Sustainable Future: Trends, Strategies and Development, 1st ed.; Noviaristanti, S., Ong, H.B., Eds.; Routledge: New York, NY, USA, 2023; pp. 22–25. [Google Scholar]
- Shang, B.; Bao, Z. How repurchase intention is affected in social commerce? An empirical study. J. Comput. Inf. Syst. 2022, 62, 326–336. [Google Scholar] [CrossRef]
- Reichheld, F.F. The one number you need to grow. Harv. Bus. Rev. 2003, 81, 46–55. [Google Scholar]
- Verma, S.; Yadav, N. Past, present, and future of electronic word of mouth (EWOM). J. Interact. Mark. 2021, 53, 111–128. [Google Scholar] [CrossRef]
- Ghosh, A.K.; Swaminatha, T.M. Software security and privacy risks in mobile e-commerce. Commun. ACM. 2001, 44, 51–57. [Google Scholar] [CrossRef]
- Woo, E.; Kim, Y.G. Consumer attitudes and buying behavior for green food products: From the aspect of green perceived value (GPV). Br. Food J. 2019, 121, 320–332. [Google Scholar] [CrossRef]
- Roh, T.; Seok, J.; Kim, Y. Unveiling ways to reach organic purchase: Green perceived value, perceived knowledge, attitude, subjective norm, and trust. J. Retail. Consum. Serv. 2022, 67, 102988. [Google Scholar] [CrossRef]
- Chakraborty, D.; Paul, J. Healthcare apps’ purchase intention: A consumption values perspective. Technovation 2023, 120, 102481. [Google Scholar] [CrossRef]
- Chen, P.T.; Hu, H.H. How determinant attributes of service quality influence customer-perceived value: An empirical investigation of the Australian coffee outlet industry. Int. J. Contemp. Hosp. Manag. 2010, 22, 535–551. [Google Scholar] [CrossRef]
- Matsuoka, K. Effects of revenue management on perceived value, customer satisfaction, and customer loyalty. J. Bus. Res. 2022, 148, 131–148. [Google Scholar] [CrossRef]
- Marcos, A.M.B.D.F.; Coelho, A.F.D.M. Service quality, customer satisfaction and customer value: Holistic determinants of loyalty and word-of-mouth in services. TQM J. 2022, 34, 957–978. [Google Scholar] [CrossRef]
- Yuen, K.F.; Koh, L.Y.; Wong, Y.Q.; Wang, X. Sustainable crowdsourced delivery: A study of technological, health, value, and trust antecedents of consumer loyalty. J. Clean. Prod. 2023, 405, 137010. [Google Scholar] [CrossRef]
- Cardozo, R.N. An experimental study of customer effort, expectation, and satisfaction. J. Mark. Res. 1965, 2, 244–249. [Google Scholar] [CrossRef]
- Pereira, H.G.; de Fátima Salgueiro, M.; Rita, P. Online purchase determinants of loyalty: The mediating effect of satisfaction in tourism. J. Retail. Consum. Serv. 2016, 30, 279–291. [Google Scholar] [CrossRef]
- Gil, M.T.; Jacob, J. The relationship between green perceived quality and green purchase intention: A three-path mediation approach using green satisfaction and green trust. Int. J. Bus. Innov. Res. 2018, 15, 301–319. [Google Scholar] [CrossRef]
- Mohd Suki, N. Customer environmental satisfaction and loyalty in the consumption of green products. Int. J. Sustain. Dev. World Ecol. 2015, 22, 292–301. [Google Scholar] [CrossRef]
- Zhang, R.; Jun, M.; Palacios, S. M-shopping service quality dimensions and their effects on customer trust and loyalty: An empirical study. Int. J. Qual. Reliab. Manag. 2023, 40, 169–191. [Google Scholar] [CrossRef]
- Na, M.; Rong, L.; Ali, M.H.; Alam, S.S.; Masukujjaman, M.; Ali, K.A.M. The mediating role of brand trust and brand love between brand experience and loyalty: A study on smartphones in China. Behav. Sci. 2023, 13, 502. [Google Scholar] [CrossRef] [PubMed]
- Yuen, K.F.; Wang, X.; Wong, Y.D.; Zhou, Q. The effect of sustainable shipping practices on shippers’ loyalty: The mediating role of perceived value, trust and transaction cost. Transp. Res. E Logist. Transp. Rev. 2018, 116, 123–135. [Google Scholar] [CrossRef]
- Amin, S.; Tarun, M.T. Effect of consumption values on customers’ green purchase intention: A mediating role of green trust. Soc. Responsib. J. 2021, 17, 1320–1336. [Google Scholar] [CrossRef]
- Forsythe, S.; Presley, A.B.; Caton, K.W. Dimensions of apparel quality influencing consumers’ perceptions. Percept. Mot. Skills. 1996, 83, 299–305. [Google Scholar] [CrossRef]
- Oh, H.J. Examining the Relationship between Shopping Style and Consumption Value of Apparel Products. Hum. Ecol. Res. 2010, 48, 27–40. [Google Scholar]
- Lin, P.C.; Huang, Y.H. The influence factors on choice behavior regarding green products based on the theory of consumption values. J. Clean. Prod. 2012, 22, 11–18. [Google Scholar] [CrossRef]
- Wang, H.Y.; Liao, C.; Yang, L.H. What affects mobile application use? The roles of consumption values. Int. J. Mark. Stud. 2013, 5, 11. [Google Scholar] [CrossRef]
- Na, Y.K.; Suh, H.S. A Study on On-line Consumer’s Shopping Propensity and Satisfaction based on Apparel Product Attributes and Price Attributes. Korean Fash. Text. Res. J. 2008, 10, 164–172. [Google Scholar]
- Haws, K.L.; Winterich, K.P.; Naylor, R.W. Seeing the world through GREEN-tinted glasses: Green consumption values and responses to environmentally friendly products. J. Consum. Psychol. 2014, 24, 336–354. [Google Scholar] [CrossRef]
- Vlastelica, T.; Kostić-Stanković, M.; Rajić, T.; Krstić, J.; Obradović, T. Determinants of Young Adult Consumers’ Environmentally and Socially Responsible Apparel Consumption. Sustainability 2023, 15, 1057. [Google Scholar] [CrossRef]
- Chen, Y.S. Towards green loyalty: Driving from green perceived value, green satisfaction, and green trust. J. Sustain. Dev. 2013, 21, 294–308. [Google Scholar] [CrossRef]
- Lutfie, H.; Marcelino, D. Consumer Trust to Buy Green Product: Investigation of Green Perceived Value with Green Satisfaction Mediation. In Proceedings of the 2020 8th International Conference on Cyber and IT Service Management (CITSM), Pangkal, Indonesia, 23–24 October 2020. [Google Scholar]
- Hashish, M.E.S.; Abdou, A.H.; Mohamed, S.A.K.; Elenain, A.S.A.; Salama, W. The Nexus between Green Perceived Quality, Green Satisfaction, Green Trust, and Customers’ Green Behavioral Intentions in Eco-Friendly Hotels: A Structural Equation Modeling Approach. Int. J. Environ. Res. Public Health 2022, 19, 16195. [Google Scholar] [CrossRef] [PubMed]
- Chen, S.Y. Using the sustainable modified TAM and TPB to analyze the effects of perceived green value on loyalty to a public bike system. Transp. Res. A Policy Pract. 2016, 88, 58–72. [Google Scholar] [CrossRef]
- Pang, C.; Zhou, J.; Ji, X. The Effects of Chinese Consumers’ Brand Green Stereotypes on Purchasing Intention toward Upcycled Clothing. Sustainability 2022, 14, 16826. [Google Scholar] [CrossRef]
- Cousins, P.D.; Lawson, B.; Petersen, K.J.; Fugate, B. Investigating green supply chain management practices and performance: The moderating roles of supply chain ecocentricity and traceability. Int. J. Oper. Prod. Manag. 2019, 39, 767–786. [Google Scholar] [CrossRef]
- Aslam, W.; Ham, M.; Farhat, K. Influencing factors of brand perception on consumers’ repurchase intention: An examination of online apparel shopping. Manag. J. Contemp. Manag. Issues 2018, 23, 87–102. [Google Scholar] [CrossRef]
- Tan, L.; Li, H.; Chang, Y.W.; Chen, J.; Liou, J.W. How to motivate consumers’ impulse buying and repeat buying? The role of marketing stimuli, situational factors and personality. Curr. Psychol. 2023, 42, 32524–32539. [Google Scholar] [CrossRef]
- Hayes, A.F. Introduction to Mediation, Moderation, and Conditional Process Analysis: A Regression-Based Approach, 2nd ed.; The Guilford Press: New York, NY, USA, 2018. [Google Scholar]
- Shrout, P.E.; Bolger, N. Mediation in experimental and nonexperimental studies: New procedures and recommendations. Psychol. Methods 2002, 7, 422–445. [Google Scholar] [CrossRef]
- Mackinnon, D.P. Introduction to Statistical Mediation Analysis, 1st ed.; Routledge: New York, NY, USA, 2008. [Google Scholar]
- Preacher, K.J.; Hayes, A.F. Asymptotic and resampling strategies for assessing and comparing indirect effects in multiple mediator models. Behav. Res. Methods 2008, 40, 879–891. [Google Scholar] [CrossRef]
- Wang, J.; Hsu, Y. Does sustainable perceived value play a key role in the purchase intention driven by product aesthetics? Taking smartwatch as an example. Sustainability 2019, 11, 6806. [Google Scholar] [CrossRef]
- Zhang, L.; Li, D.; Cao, C.; Huang, S. The influence of greenwashing perception on green purchasing intentions: The mediating role of green word-of-mouth and moderating role of green concern. J. Clean. Prod. 2018, 187, 740–750. [Google Scholar] [CrossRef]
- Hertz, N. Think Millennials have it tough? For “Generation K”, life is even harsher. The Guardian, 19 March 2016. [Google Scholar]
- Alqahtani, A.Y.; Gupta, S.M. Warranty and preventive maintenance analysis for sustainable reverse supply chains. J. Manag. Sci. Eng. 2017, 2, 69–94. [Google Scholar] [CrossRef]

| Category and Items | Sample Size (n = 291) | Ratio (%) | |
|---|---|---|---|
| Gender | Male | 130 | 51.5 |
| Female | 141 | 48.5 | |
| Age | 20s | 198 | 68.0 |
| 30s | 44 | 15.1 | |
| 40s | 32 | 11.0 | |
| More than 50s | 17 | 5.8 | |
| Monthly Income (KRW) | Under 1 million | 138 | 47.4 |
| 1 million–2 million | 37 | 12.7 | |
| 2 million–3 million | 41 | 14.1 | |
| 3 million–4 million | 33 | 11.3 | |
| Over 4 million | 42 | 14.4 | |
| Manufacture Type | Recycling | 189 | 64.9 |
| Upcycling | 53 | 18.2 | |
| Both | 49 | 16.8 | |
| Monthly Purchase Frequency | 2 times or less | 225 | 77.3 |
| 3–4 times | 55 | 18.9 | |
| 5 times or more | 11 | 3.8 | |
| Construct | Component | Crb. α | ||||||||
|---|---|---|---|---|---|---|---|---|---|---|
| 1 | 2 | 3 | 4 | 5 | 6 | 7 | If Deleted | α | ||
| Trust | TR 4 | 0.828 | 0.091 | 0.089 | 0.042 | 0.033 | 0.005 | 0.322 | 0.834 | 0.869 |
| TR 1 | 0.728 | 0.166 | 0.233 | 0.249 | 0.101 | 0.072 | −0.086 | 0.842 | ||
| TR 3 | 0.727 | 0.136 | 0.071 | 0.182 | 0.167 | 0.271 | 0.182 | 0.832 | ||
| TR 5 | 0.705 | 0.249 | −0.016 | 0.183 | 0.103 | 0.260 | 0.195 | 0.836 | ||
| TR 2 | 0.620 | 0.239 | 0.134 | 0.284 | −0.012 | 0.125 | −0.040 | 0.864 | ||
| Functional Value | FV4 | 0.179 | 0.768 | 0.267 | 0.122 | 0.123 | 0.084 | 0.071 | 0.816 | 0.862 |
| FV 2 | 0.199 | 0.758 | 0.117 | 0.102 | 0.101 | −0.013 | 0.122 | 0.832 | ||
| FV 5 | 0.113 | 0.727 | 0.272 | 0.150 | 0.117 | 0.155 | 0.072 | 0.822 | ||
| FV 1 | 0.215 | 0.715 | 0.172 | 0.094 | 0.078 | 0.090 | 0.154 | 0.840 | ||
| FV 3 | 0.040 | 0.674 | 0.068 | 0.204 | 0.069 | 0.247 | 0.058 | 0.854 | ||
| Green Value | GV 2 | 0.081 | 0.274 | 0.756 | 0.193 | 0.099 | 0.035 | 0.231 | 0.822 | 0.871 |
| GV 4 | 0.114 | 0.347 | 0.721 | 0.291 | 0.055 | −0.059 | 0.140 | 0.829 | ||
| GV 1 | 0.190 | 0.093 | 0.720 | 0.120 | 0.113 | 0.313 | 0.026 | 0.856 | ||
| GV 5 | −0.031 | 0.281 | 0.703 | 0.313 | −0.016 | 0.131 | 0.116 | 0.838 | ||
| GV 3 | 0.254 | 0.126 | 0.681 | −0.021 | 0.116 | 0.222 | 0.146 | 0.866 | ||
| Loyalty | LY 4 | 0.323 | 0.190 | 0.210 | 0.710 | 0.085 | 0.185 | 0.174 | 0.870 | 0.906 |
| LY 3 | 0.362 | 0.229 | 0.202 | 0.679 | 0.149 | 0.169 | 0.179 | 0.870 | ||
| LY 1 | 0.274 | 0.278 | 0.328 | 0.577 | 0.199 | 0.307 | 0.085 | 0.884 | ||
| LY 2 | 0.447 | 0.238 | 0.276 | 0.559 | 0.075 | 0.237 | 0.110 | 0.886 | ||
| Economic Value | ECV 3 | 0.083 | −0.038 | 0.089 | 0.052 | 0.855 | 0.109 | 0.011 | 0.794 | 0.848 |
| ECV 4 | −0.015 | 0.111 | 0.166 | 0.069 | 0.836 | 0.130 | 0.011 | 0.792 | ||
| ECV 1 | 0.097 | 0.190 | 0.004 | 0.174 | 0.798 | −0.033 | 0.056 | 0.812 | ||
| ECV 2 | 0.150 | 0.174 | 0.013 | −0.002 | 0.705 | 0.226 | 0.230 | 0.829 | ||
| Satisfaction | SAT 4 | 0.163 | 0.185 | 0.045 | 0.177 | 0.170 | 0.756 | 0.188 | 0.850 | 0.868 |
| SAT 3 | 0.140 | 0.277 | 0.276 | 0.445 | 0.096 | 0.621 | 0.143 | 0.815 | ||
| SAT 5 | 0.340 | 0.221 | 0.189 | 0.096 | 0.236 | 0.561 | 0.063 | 0.858 | ||
| SAT 2 | 0.126 | 0.186 | 0.267 | 0.482 | 0.118 | 0.556 | 0.250 | 0.824 | ||
| SAT 1 | 0.379 | −0.063 | 0.391 | 0.251 | 0.095 | 0.525 | 0.154 | 0.848 | ||
| Emotional Value | EMV 2 | 0.210 | 0.269 | 0.239 | 0.350 | 0.123 | 0.163 | 0.665 | 0.789 | 0.854 |
| EMV 1 | 0.097 | 0.350 | 0.241 | 0.443 | 0.155 | 0.106 | 0.584 | 0.813 | ||
| EMV 4 | 0.496 | 0.021 | 0.261 | 0.006 | 0.064 | 0.329 | 0.547 | 0.839 | ||
| EMV 3 | 0.118 | 0.395 | 0.169 | 0.358 | 0.133 | 0.217 | 0.529 | 0.829 | ||
| EMV 5 | 0.370 | 0.041 | 0.248 | −0.032 | 0.114 | 0.423 | 0.525 | 0.846 | ||
| Eigenvalue | 4.200 | 3.985 | 3.761 | 3.174 | 2.968 | 2.954 | 2.268 | |||
| Distributed Description (%) | 12.728 | 12.077 | 11.397 | 9.617 | 8.994 | 8.952 | 6.871 | |||
| KMO = 0.921, Bartlett’s sphericity test (Significance level) = 0.000 | ||||||||||
| Construct | Mean | Standard Deviation | Inter-Construct Correlations | |||||||
|---|---|---|---|---|---|---|---|---|---|---|
| 1 | 2 | 3 | 4 | 5 | 6 | 7 | ||||
| 1 | FV | 4.8756 | 0.9678 | 1 | ||||||
| 2 | ECV | 4.0782 | 1.2211 | 0.312 * | 1 | |||||
| 3 | EMV | 5.3134 | 0.8639 | 0.571 * | 0.360 * | 1 | ||||
| 4 | GV | 5.0900 | 0.9785 | 0.562 * | 0.264 * | 0.611 * | 1 | |||
| 5 | SAT | 5.1746 | 0.8139 | 0.508 * | 0.391 * | 0.725 * | 0.589 * | 1 | ||
| 6 | TR | 5.3471 | 0.8972 | 0.473 * | 0.271 * | 0.614 * | 0.423 * | 0.594 * | 1 | |
| 7 | LY | 5.1357 | 0.9126 | 0.580 * | 0.337 * | 0.695 * | 0.617 * | 0.721 * | 0.654 * | 1 |
| Effect | SE | ) | LLCI | ULCI | |
|---|---|---|---|---|---|
| FV | 0.209 | 0.040 | 5.172 * | 0.129 | 0.289 |
| ECV | 0.037 | 0.030 | 1.226 | −0.023 | 0.097 |
| EMV | 0.272 | 0.059 | 4.635 * | 0.156 | 0.387 |
| GV | 0.241 | 0.041 | 5.875 * | 0.160 | 0.322 |
| Antecedent | Consequent | |||||||||||
|---|---|---|---|---|---|---|---|---|---|---|---|---|
| (SAT) | (TR) | (LY) | ||||||||||
| Coeff. | Coeff. | Coeff. | ||||||||||
| (FV) | 0.427 | 0.043 | <0.001 | 0.438 | 0.048 | <0.001 | 0.209 | 0.040 | <0.001 | |||
| (SAT) | – | – | – | – | – | – | 0.489 | 0.053 | <0.001 | |||
| (TR) | – | – | – | – | – | – | 0.295 | 0.047 | <0.001 | |||
| Constant | 3.092 | 0.212 | <0.001 | 3.210 | 0.239 | <0.001 | 0.009 | 0.233 | <0.001 | |||
| R2 = 0.258 F(1, 289) = 100.434 < 0.001 | R2 = 0.224 F(1, 289) = 83.173 < 0.001 | R2 = 0.633 F(3, 287) = 164.858 < 0.001 | ||||||||||
| Effect | BootSE | BootLLCI | BootULCI | ||
|---|---|---|---|---|---|
| Total | 0.338 | 0.043 | 0.256 | 0.427 | |
| (SAT) | 0.209 | 0.035 | 0.146 | 0.284 | |
| (TR) | 0.129 | 0.029 | 0.077 | 0.189 | |
| (C1) | 0.080 | 0.047 | −0.012 | 0.178 | |
| Antecedent | Consequent | |||||||||||
|---|---|---|---|---|---|---|---|---|---|---|---|---|
| (SAT) | (TR) | (LY) | ||||||||||
| Coeff. | Coeff. | Coeff. | ||||||||||
| (ECV) | 0.261 | 0.036 | <0.001 | 0.199 | 0.042 | <0.001 | 0.037 | 0.030 | <0.001 | |||
| (SAT) | – | – | – | – | – | – | 0.556 | 0.055 | <0.001 | |||
| (TR) | – | – | – | – | – | – | 0.351 | 0.047 | <0.001 | |||
| Constant | 40.111 | 0.154 | <0.001 | 40.536 | 0.177 | <0.001 | 0.225 | 0.024 | <0.001 | |||
| R2 = 0.153 F(1, 289) = 52.200 < 0.001 | R2 = 0.073 F(1, 289) = 22.849 < 0.001 | R2 = 0.601 F(3, 287) = 143.895 < 0.001 | ||||||||||
| Effect | BootSE | BootLLCI | BootULCI | ||
|---|---|---|---|---|---|
| Total | 0.215 | 0.036 | 0.147 | 0.286 | |
| (SAT) | 0.145 | 0.028 | 0.094 | 0.204 | |
| (TR) | 0.070 | 0.019 | 0.034 | 0.111 | |
| (C1) | 0.075 | 0.032 | 0.013 | 0.140 | |
| Antecedent | Consequent | |||||||||||
|---|---|---|---|---|---|---|---|---|---|---|---|---|
| (SAT) | (TR) | (LY) | ||||||||||
| Coeff. | Coeff. | Coeff. | ||||||||||
| (EMV) | 0.683 | 0.038 | <0.001 | 0.634 | 0.048 | <0.001 | 0.272 | 0.059 | <0.001 | |||
| (SAT) | – | – | – | – | – | – | 0.415 | 0.061 | <0.001 | |||
| (TR) | – | – | – | – | – | – | 0.281 | 0.048 | <0.001 | |||
| Constant | 1.544 | 0.205 | <0.001 | 10.959 | 0.260 | <0.001 | 0.042 | 0.235 | <0.001 | |||
| R2 = 0.526 F(1, 289) = 320.987 < 0.001 | R2 = 0.377 F(1, 289) = 174.877 < 0.001 | R2 = 0.627 F(3, 287) = 160.490 < 0.001 | ||||||||||
| Effect | BootSE | BootLLCI | BootULCI | ||
|---|---|---|---|---|---|
| Total | 0.463 | 0.059 | 0.352 | 0.579 | |
| (SAT) | 0.284 | 0.051 | 0.191 | 0.388 | |
| (TR) | 0.179 | 0.037 | 0.107 | 0.255 | |
| (C1) | 0.105 | 0.067 | −0.025 | 0.242 | |
| Antecedent | Consequent | |||||||||||
|---|---|---|---|---|---|---|---|---|---|---|---|---|
| (SAT) | (TR) | (LY) | ||||||||||
| Coeff. | Coeff. | Coeff. | ||||||||||
| (GV) | 0.490 | 0.040 | <0.001 | 0.387 | 0.049 | <0.001 | 0.241 | 0.041 | <0.001 | |||
| (SAT) | – | – | – | – | – | – | 0.425 | 0.056 | <0.001 | |||
| (TR) | – | – | – | – | – | – | 0.325 | 0.045 | <0.001 | |||
| Constant | 2.680 | 0.205 | <0.001 | 3.375 | 0.253 | <0.001 | −0.028 | 0.230 | <0.001 | |||
| R2 = 0.347 F(1, 289) = 153.774 < 0.001 | R2 = 0.178 F(1, 289) = 62.815 < 0.001 | R2 = 0.642 F(3, 287) = 171.308 < 0.001 | ||||||||||
| Effect | BootSE | BootLLCI | BootULCI | ||
|---|---|---|---|---|---|
| Total | 0.334 | 0.044 | 0.255 | 0.425 | |
| (SAT) | 0.208 | 0.036 | 0.145 | 0.284 | |
| (TR) | 0.126 | 0.027 | 0.075 | 0.183 | |
| (C1) | 0.082 | 0.046 | −0.004 | 0.177 | |
| Hypothesis | Variables | Confidence Interval | Results | |||
|---|---|---|---|---|---|---|
| M | Low Level | Upper Level | ||||
| H1a | FV | - | LY | 0.129 | 0.289 | Supported |
| H1b | ECV | - | LY | −0.023 | 0.097 | Not Supported |
| H1c | EMV | - | LY | 0.156 | 0.387 | Supported |
| H1d | GV | - | LY | 0.160 | 0.322 | Supported |
| H2a | FV | SAT | LY | 0.146 | 0.284 | Supported |
| H2b | ECV | SAT | LY | 0.094 | 0.204 | Supported |
| H2c | EMV | SAT | LY | 0.191 | 0.388 | Supported |
| H2d | GV | SAT | LY | 0.145 | 0.284 | Supported |
| H3a | FV | TR | LY | 0.077 | 0.189 | Supported |
| H3b | ECV | TR | LY | 0.034 | 0.111 | Supported |
| H3c | EMV | TR | LY | 0.107 | 0.255 | Supported |
| H3d | GV | TR | LY | 0.075 | 0.183 | Supported |
Disclaimer/Publisher’s Note: The statements, opinions and data contained in all publications are solely those of the individual author(s) and contributor(s) and not of MDPI and/or the editor(s). MDPI and/or the editor(s) disclaim responsibility for any injury to people or property resulting from any ideas, methods, instructions or products referred to in the content. |
© 2024 by the authors. Licensee MDPI, Basel, Switzerland. This article is an open access article distributed under the terms and conditions of the Creative Commons Attribution (CC BY) license (https://creativecommons.org/licenses/by/4.0/).
Share and Cite
Cho, H.; Jo, D.; Kim, H. Understanding Consumer Perception towards Sustainable Apparel: A Parallel Mediation Analysis on Satisfaction and Trust. Sustainability 2024, 16, 6835. https://doi.org/10.3390/su16166835
Cho H, Jo D, Kim H. Understanding Consumer Perception towards Sustainable Apparel: A Parallel Mediation Analysis on Satisfaction and Trust. Sustainability. 2024; 16(16):6835. https://doi.org/10.3390/su16166835
Chicago/Turabian StyleCho, Heejun, Donghyuk Jo, and Hyojung Kim. 2024. "Understanding Consumer Perception towards Sustainable Apparel: A Parallel Mediation Analysis on Satisfaction and Trust" Sustainability 16, no. 16: 6835. https://doi.org/10.3390/su16166835
APA StyleCho, H., Jo, D., & Kim, H. (2024). Understanding Consumer Perception towards Sustainable Apparel: A Parallel Mediation Analysis on Satisfaction and Trust. Sustainability, 16(16), 6835. https://doi.org/10.3390/su16166835