Article

Linking Diversity–Productivity Conditions of Farming Systems with the Well-Being of Agricultural Communities

by
Jean R. Francois
1,
Katherine S. Nelson
1,2,* and
Emily K. Burchfield
3
1
Department of Geography and Geospatial Sciences, Kansas State University, Manhattan, KS 66506, USA
2
School of Natural Resources, University of Missouri, Columbia, MO 65211, USA
3
Department of Environmental Sciences, Emory University, Atlanta, GA 30322, USA
*
Author to whom correspondence should be addressed.
Sustainability 2024, 16(16), 6826; https://doi.org/10.3390/su16166826
Submission received: 15 July 2024 / Revised: 3 August 2024 / Accepted: 7 August 2024 / Published: 9 August 2024
(This article belongs to the Collection Sustainability in Agricultural Systems and Ecosystem Services)

Abstract

:
Agricultural diversity, productivity, and human well-being have been popular topics in recent decades, partly fueled by our quest for sustainability. However, the exact nature of the interconnections among these global priorities remains an area yet to be fully understood and explored. We contribute to this literature by examining how community well-being interacts with distinct levels of diversity and productivity in cropping systems across multiple U.S. communities. Using data at the county-level from 2010 to 2019, we first analyze how well-being varies across communities that differ in their levels of crop diversity and productivity. Then, we investigate how well-being varies across both diversity–productivity characteristics and farming intensity levels. We employ mapping techniques in conjunction with descriptive statistics to uncover and visualize patterns in well-being across contexts. Study findings show a consistent pattern of high levels of well-being across most diversity–productivity categories, with the notable exception of areas that are both highly diverse and highly productive. In addition, places with substantial commercial operations, and where agriculture contributes greatly to overall GDP and employment generally appears to have higher well-being scores compared to other places. Our analysis also reveals that there is more variability in the index of community well-being within each group than across groups of counties. Overall, the results suggest that the differences in community well-being are not solely determined by agricultural indicators, such as diversity–productivity characteristics and farming intensity levels, but also depend on contextual factors, such as social infrastructure, non-agricultural job opportunities, or local economic diversification.

1. Introduction

Individual and community well-being has been featured among the critical outcomes of sustainability and sustainable development by academics and action institutions across the globe [1,2,3,4]. For example, reviewing rural sustainability studies, Nelson et al. [2] highlight that well-being exploration constitutes a central focus within rural sustainability outcomes. Addressing the long-term goals of sustainable agricultural systems through the 1990 farm bill, the U.S. Congress contended that agriculture should improve both farmer and community well-being alongside achieving agronomic and ecological goals [5]. However, implementing these objectives is a complex task.
The U.S. agricultural sector can be proud of its productivity and operational efficiency in its production systems, but its social contribution remains questionable. Findings from a significant number of social science research studies have reported harmful links between industrialized farming systems and socioeconomic well-being (e.g., income levels, unemployment, and poverty), the social fabric (e.g., increases in hired labor and population change), and environment quality (e.g., depletion of water and air quality issues) of surrounding communities [6,7,8]. These research results suggest that managing agricultural systems to support the well-being of local communities appears to be one of the greatest challenges at the intersection of agriculture and sustainability. This challenge is rooted in specific agricultural processes, linked primarily to the dominance of the productivist paradigm, such as the widespread adoption of intensive farming practices with a heavy reliance on chemicals [9], the trend towards monoculture over crop diversity [10], the trend towards fewer but larger farms [11], and increasing mechanization, which impacts rural economies and social structures [12].
Despite the extensive body of knowledge addressing the well-being of agricultural communities [7,13,14,15], there remain significant gaps in our understanding of the connections between diversity–productivity conditions of farming systems and community well-being (CWB). Existing studies in the main line of social science research on this issue, which can be traced back to Goldschmidt’s (1946) comparative case study [16], have primarily focused on exploring the connections between CWB indicators and structural changes in farming systems in terms of scale, organization, and market integration [7,13,17], neglecting the examination of potential linkages with other essential aspects of farming activities, including the interactions between diversity and productivity. Related to this, agricultural management research has been criticized for its unbalanced approach to understanding the interactions between agricultural management practices and ecological outcomes, compared to social consequences [18]. While there is a better understanding of environmental and production variables (e.g., productivity, profitability, and ecosystem health), the consequences for people and communities who live and work across these agriculture-modified landscapes remain out of focus in much agricultural management research [18,19]. Addressing these research gaps is critical to generating knowledge capable of tackling the sustainability concerns of current food production systems comprehensively [20].
Since the release of the Millennium Ecosystem Assessment Report [21] in the early 2000s, there has been a growing interest in linking ecosystem services with the social, physical, and mental well-being of individuals and communities, as it was established that ecosystem services are important driving forces of human well-being. While some studies have predominantly focused on the theoretical relationships between ecosystem functions and services and aspects of human well-being [4,22,23,24,25,26], others have been attempts to empirically link some specific ecosystem components (e.g., diversity) to some specific well-being indicators [27,28,29]. Crop diversity serves as one of the principal agricultural ecosystem indicators employed to explore these connections. For instance, in 2019, Garibaldi and Pérez-Méndez [28] conducted an analysis of agricultural and socio-economic data from 44 nations, revealing that countries experiencing an augmentation in crop diversity also witness a rise in agricultural employment opportunities. Acknowledging the importance of this association, the authors call for more research assessing the impacts of crop diversity on the multiple dimensions of human well-being. Other studies indirectly associate the adoption of certain farming practices or systems (e.g., organic agriculture), which promote higher levels of diversity, with some specific well-being issues (e.g., labor conditions, farmers’ health, local populations) [27,29].
Moreover, the emergence of the United Nations’ sustainable development initiatives has broadened the scope of research examining the relationship between crop diversity and the achievement of sustainable development objectives [30]. Feliciano (2019) [30] highlighted a growing body of research examining the role of crop diversification in achieving various developmental goals, including environmental protection, climate change mitigation and adaptation, crop productivity enhancement, income generation, employment opportunities, nutrition and food security, and gender equality. However, the majority of studies have concentrated on crop diversification strategies within developing countries. Despite these efforts, there is room for more research connecting the following global priorities: diversity, productivity, and CWB.
This paper aims to address the gap in knowledge through the lens of U.S. farming systems. More specifically, we examine the interaction of CWB with distinct levels of diversity and productivity in agricultural systems and production systems with different farming intensity levels. This study recognizes the potentiality and responsibility of every farm, regardless of scale, organization, and marketing strategies, to contribute to various dimensions of CWB [31]. We address two specific research questions in this study: (1) How does community well-being vary across the intersection of agricultural diversification and levels of crop production? (2) How does the variation in community well-being change across both diversity–productivity characteristics and farming intensity levels?
In the following sections, we first clarify key concepts used in this study, provide a brief overview of the literature on CWB, and describe the framework that guided the construction of our CWB index. We then detail our methods, report the findings, and discuss them in line with the existing literature.

2. Definition of Terms, Conceptualization, and Operationalization of Community Well-Being

Before delving deeper into our exploration, we clarify some key terms that we use, acknowledging multiple pathways exist to understanding and interpreting them. We refer to the term ‘community’ as a place with defined geographic boundaries and where individuals share common concerns of life [32,33]. We use county administrative units to operationalize community.
With respect to ‘community well-being’, the literature offers a wealth of definitions, interpretations, conceptual discussions, and methodologies for operationalizing it [3,34,35], depending upon the perspective of who is using the term and for what purpose. We view CWB as an outcome influenced by multiple conditions interacting to fulfill the community residents’ needs [3,36]. Many authors recognize CWB as a multi-dimensional and context-dependent concept [3,4,35,37]. Treating CWB as a construct with multiple dimensions permits a comprehensive assessment of various facets within a community. Assessments can be subjective (e.g., capturing residents’ perceived community satisfaction) or objective, focusing on material and social characteristics that either contribute to or hinder the overall well-being of communities [4]. One of the challenges noted in the literature is related to the selection of community-level indicators that best evaluate the well-being of communities [35]. No consensus has yet been reached regarding the most crucial variables that accurately reflect CWB. Certain indicators have been recurrently featured in many studies, highlighting their importance in assessing CWB [35].
Matson et al., in 2016, ref. [37], presented a sustainability analysis framework that links sustainability objectives with their root causes within complex and dynamic social-environmental systems through the production of goods and services and related consumption processes. The authors define sustainable development as concentrating on individual and social well-being and thus suggest the inclusive social well-being concept to evaluate sustainable development, focusing on improving the well-being of humankind. In addition, Matson and colleagues emphasized the importance of linking well-being to its foundational drivers, conceptualized as social, natural, manufactured, human, and knowledge capital assets. These resources serve as the basis for sustainability and interact in complex systems to impact human life. The role of actors, or agency, is crucial in deciding how capital assets are utilized to achieve common, sometimes conflicting goals. For instance, farming systems illustrate these complex interactions by converting capital assets into the production of goods and services for consumption through human management. However, the industrialization of agriculture over the past several decades, marked by intensive production approaches and widespread use of biochemicals, has faced criticism for its adverse economic, social, and environmental impacts [7,9,38].
In this study, we employ the sustainability analysis framework proposed by Matson et al. [37] and leverage the existing literature on objective CWB to guide our investigation of the interaction between CWB and some key agricultural indicators, such as diversity–productivity characteristics and farming intensity levels. The framework focuses on six critical constituents of CWB: material needs, education, health, community, security, and opportunity. Recognizing and meeting people’s material needs is foundational to enhancing human well-being. The survival of humans hinges on having access to essential requisites such as food, water, energy, and shelter [39,40]. Research shows that access to these necessities and CWB are linked positively [3,37]. Health and education are widely acknowledged as key constituents of well-being [41,42]. Economic growth and well-being are positively related to community health and education outcomes [4,43]. Furthermore, access to schools, recreation, and equality [44,45], social cohesion and a sense of community belonging [37,46], as well as feelings of safety and security [37,41], are all important factors that influence CWB. By examining CWB across these dimensions, we can enhance our comprehension of the factors essential for fostering thriving conditions among community residents.

3. Materials and Methods

This paper explores variations in an objective measure of community well-being across agricultural systems with distinct diversity and productivity characteristics and different intensity levels. We first describe our measurement of CWB, then detail the county typology conditional on the diversity and productivity of farming systems. We present other agricultural performance measures to examine the variations in CWB and explain our analytical approach.

3.1. Spatial and Temporal Scales

We implement this study at the county scale to accommodate both the characteristics of communities and farming systems within a manageable spatial framework. County boundaries might not accurately represent these systems that maintain complex and dynamic interactions with other broader systems. However, as an administrative unit, the county provides pragmatic ground to gather information that allows us to capture differences regarding those settings. We focus on the aggregate socioeconomic features at the county level during the period 2010 and 2019. The ten-year average is used to capture a more stable and typical picture of the well-being of places over the time period. This method helps mitigate the influence of yearly fluctuations, potential data errors, or missing information, ensuring more robust findings on CWB. While CWB can change over time, significant fluctuations within a short period might reflect localized, temporary shocks rather than sustained transformations in well-being. We limit our analysis to the 2010–2019 period to exclude the immediate effects of major events such as the 2008–2009 global financial crisis and the recent global health crisis caused by the COVID-19 disease. These events can have significant, short-term impacts on communities, which might not accurately reflect their typical well-being.

3.2. Measuring Community Well-Being

We collected community-level indicators that reflect the dimensions of well-being, as defined by Matson et al. [37], from publicly available data sources (Table S1). Matson et al.’s framework helps objectively capture some of the most important constituents of CWB with its six broad-based dimensions, such as material needs, health, education, opportunity, community, and security. We consider the dimension of community in the framework to refer to social groupings/interactions. We purposefully rename this dimension as ‘social community’ to avoid confusion with community defined earlier as territory-based. We obtain a snapshot of a community’s material needs through food security, clean water, housing pressure, and affordability. We gain insights into a community’s health by including health insurance, life expectancy, infant mortality, and teenage fertility. We picture a community’s education through school enrollment, educational attainment, and student–teacher ratio. We have multiple variables to examine the ability of people to make choices about how they want to live and what they want to do. These opportunity indicators include unemployment rate, income inequality (the Gini coefficient), female market participation, housing ownership, population movement, and housing vacancy rate. For the dimension of social community, we add election turnout, age-dependency ratio, establishment rate, and census rate. Crime rate is used to picture the idea of security in a community. Our current analysis is limited to four indicators that tap into community-level material needs, four variables that represent health, three variables assessing education, seven indicators to gauge the dimension of opportunity, four variables to tap into the dimension of social community, and one variable for security (Table 1 and Table S1). Because we obtained only one indicator for security, we added it to the dimension of opportunity. Based on the framework, an unsafe neighborhood is exemplified as an indicator of a lack of opportunity.
We used the Tidycensus package in R [47] to retrieve most of the data from the U.S. Census Bureau (Table S1). We collected annual data for the conterminous United States at the county level (n = 3107 counties). Whenever possible, we collected data for the 2010–2019 period and calculated the decadal mean of each variable for each county. We pre-processed the data [48] by transforming the raw data into percentages or rates and normalizing using min–max techniques across all the counties. This processing simplifies comparisons between counties with differing sizes and socioeconomic attributes and reduces skewness and outliers in the data distributions [48,49]. Prior to the computation of the index, we adjusted the scale of certain variables to ensure consistent theoretical orientation. We treated each dimension of the conceptual framework separately. We took the average of the indicators under each of the dimensions to obtain a score for each dimension before summing the five dimensions’ scores to compute the index of CWB. We gave identical weight to each variable within the dimension as we did not assume any particular importance of variable in the overall index [49]. Kyne and Aldrich [50], in 2020, have used a similar approach to compute sub-index scores and the final score of a social capital index (i.e., averaging sub-index variables and summing sub-index scores). We employed Cronbach’s alpha to evaluate the internal consistency of the overall index [51], and it showed that the items are reasonably well-related and consistently measure the same underlying construct (Table 1). In all cases, we used custom R scripts to curate the data [52]. Maps for each dimension can be visualized in the supplementary information (Figures S1–S5).

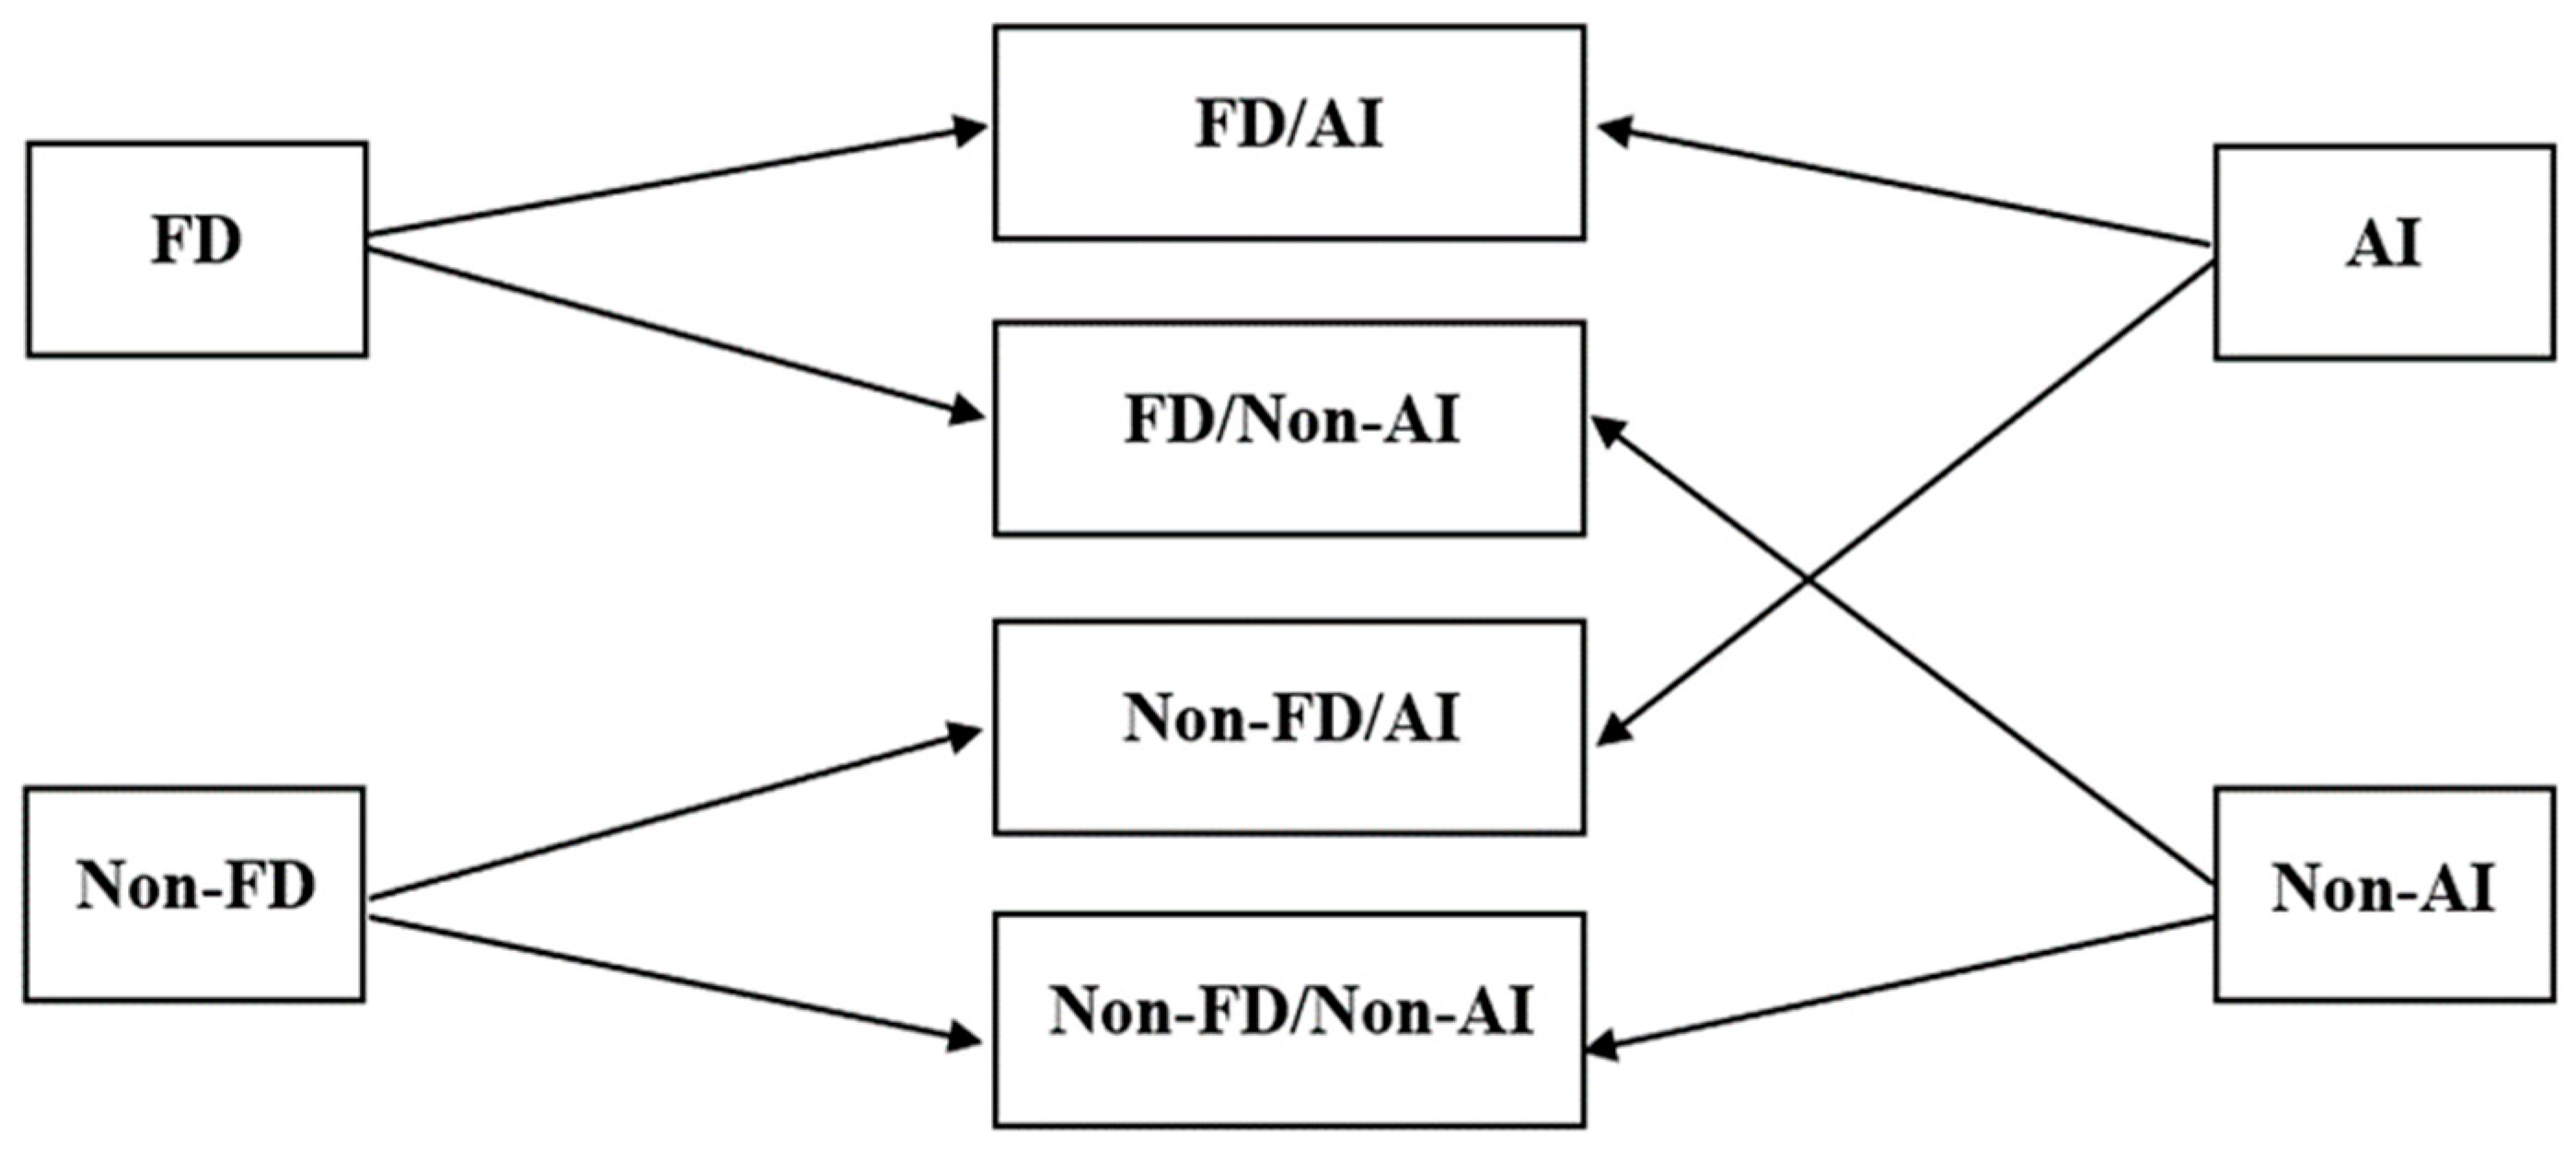
3.3. Characterizing Farming Systems through Diversity–Productivity Conditions and Farming Intensity Indicators

In 2023, Nelson and Burchfield [53] studied county-scale factors that condition agricultural systems that are both highly diverse and productive in the U.S. They developed a diversity–productivity typology, using indicators of land use and yields of major commodity crops to contrast these high diversity–productivity systems to those with alternate agricultural and ecological performances. The authors calculated a county’s average Shannon Diversity Index from 2008–2018 to account for diversity. For productivity, the authors computed the crop planted area-weighted average of corn, soy, wheat, hay, and alfalfa yields in excess of regional averages after accounting for temperature, soil, and water (precipitation and irrigation) over the same period. These two indicators were used in a K-means clustering analysis to generate the diversity–productivity typology. After removing the counties that were not distinctly identified within a specific cluster, the typology condensed 2575 counties into five frequently encountered scenarios where crop diversity intersects with crop productivity within the U.S., such as high diversity and productivity (HD/HP, n = 310), low diversity and productivity (LD/LP, n = 368), high diversity and low productivity (HD/LP, n = 442), low diversity and high productivity (LD/HP, n = 743), and average diversity and productivity (AVERAGE, n = 712). This typology constitutes the basis of our sample for this study. For additional details on typology construction, please refer to Nelson and Burchfield (2019) [53].
In addition to differences in diversity–productivity conditions, the types defined represent distinct regimes of production with unique biophysical, social, economic, and regulatory attributes that fundamentally shape their structure and function [53]. Along this line, we study community well-being as a potential performance outcome of these regimes and its variations across distinctive features of these classes. Our initial analysis suggests significant variations in well-being across regimes, warranting a more comprehensive and deeper exploration to understand the underlying factors and the potential implications for the sustainability of our communities and agricultural systems (Table S2a).
To obtain a more comprehensive picture of the well-being of agricultural communities, we developed a measure of farming intensity inspired by Jackson-Smith and Jensen’s 2009 discussions [54]. The authors developed a measure to identify agriculturally important (AI) counties where farming is commercially and materially important in the U.S. with three pieces of data, such as the total agricultural sales combined with either farm sales per acre of total farmland or cropland. The authors present the AI group as counties in the top quartile of total agricultural sales and counties in the second quartile, with either sales per acre of farmland or sales per cropland in the top quartile. This farming indicator complements the farm-dependency (FD) typology developed by the United States Department of Agriculture Economic Research Service (USDA/ERS) in identifying places with high agricultural production levels. ERS employed two farming variables in their definition of FD (i.e., shares of agricultural jobs and GDP) and classifies counties as FD when agriculture contributes to at least 25% of the county’s GDP or accounts for at least 16% of the county’s total employment. The two indicators—AI and FD—are integrated to form the farming intensity measure, resulting in four mutually exclusive classes: the pure AI (i.e., counties that are AI but not FD), the pure FD (i.e., counties that are FD but not AI), FD/AI (i.e., counties that are both AI and FD), and non-FD/non-AI (i.e., counties that are neither FD nor AI) (Figure 1). To construct this farming intensity indicator, we used employment and GDP data from the U.S. Bureau of Economic Analysis (BEA) and survey data from the USDA National Agricultural Statistics Service (NASS) (i.e., total sales and sales per acre of farmland or cropland). Figure 2 shows the spatial distribution of counties included in the diversity–productivity typology and their corresponding classification in terms of farming intensity. Table 2 offers descriptive summaries for a range of agricultural indicators across these farming intensity classes.

3.4. Analysis

We established five categories for the community well-being index (CWBI) based on standard deviations (sd) from the mean to facilitate comparisons across counties. We named these CWBI levels as very low (less than one sd below the mean), low (between 1 and 0.5 sd below the mean), moderate (between 0.5 sd below and 0.5 sd above the mean), high (between 0.5 and 1 sd above the mean), and very high (more than one sd above the mean). We combined spatial analysis with descriptive statistics to visualize and identify patterns in the index. We first mapped the index to show how it varies across U.S. counties. We used the Kruskal–Wallis test to compare CWBI scores across diversity–productivity types, agricultural intensity categories, and their interactions, following the indication from the Shapiro–Wilk tests that non-parametric analyses were relevant for our statistical comparisons.

4. Results

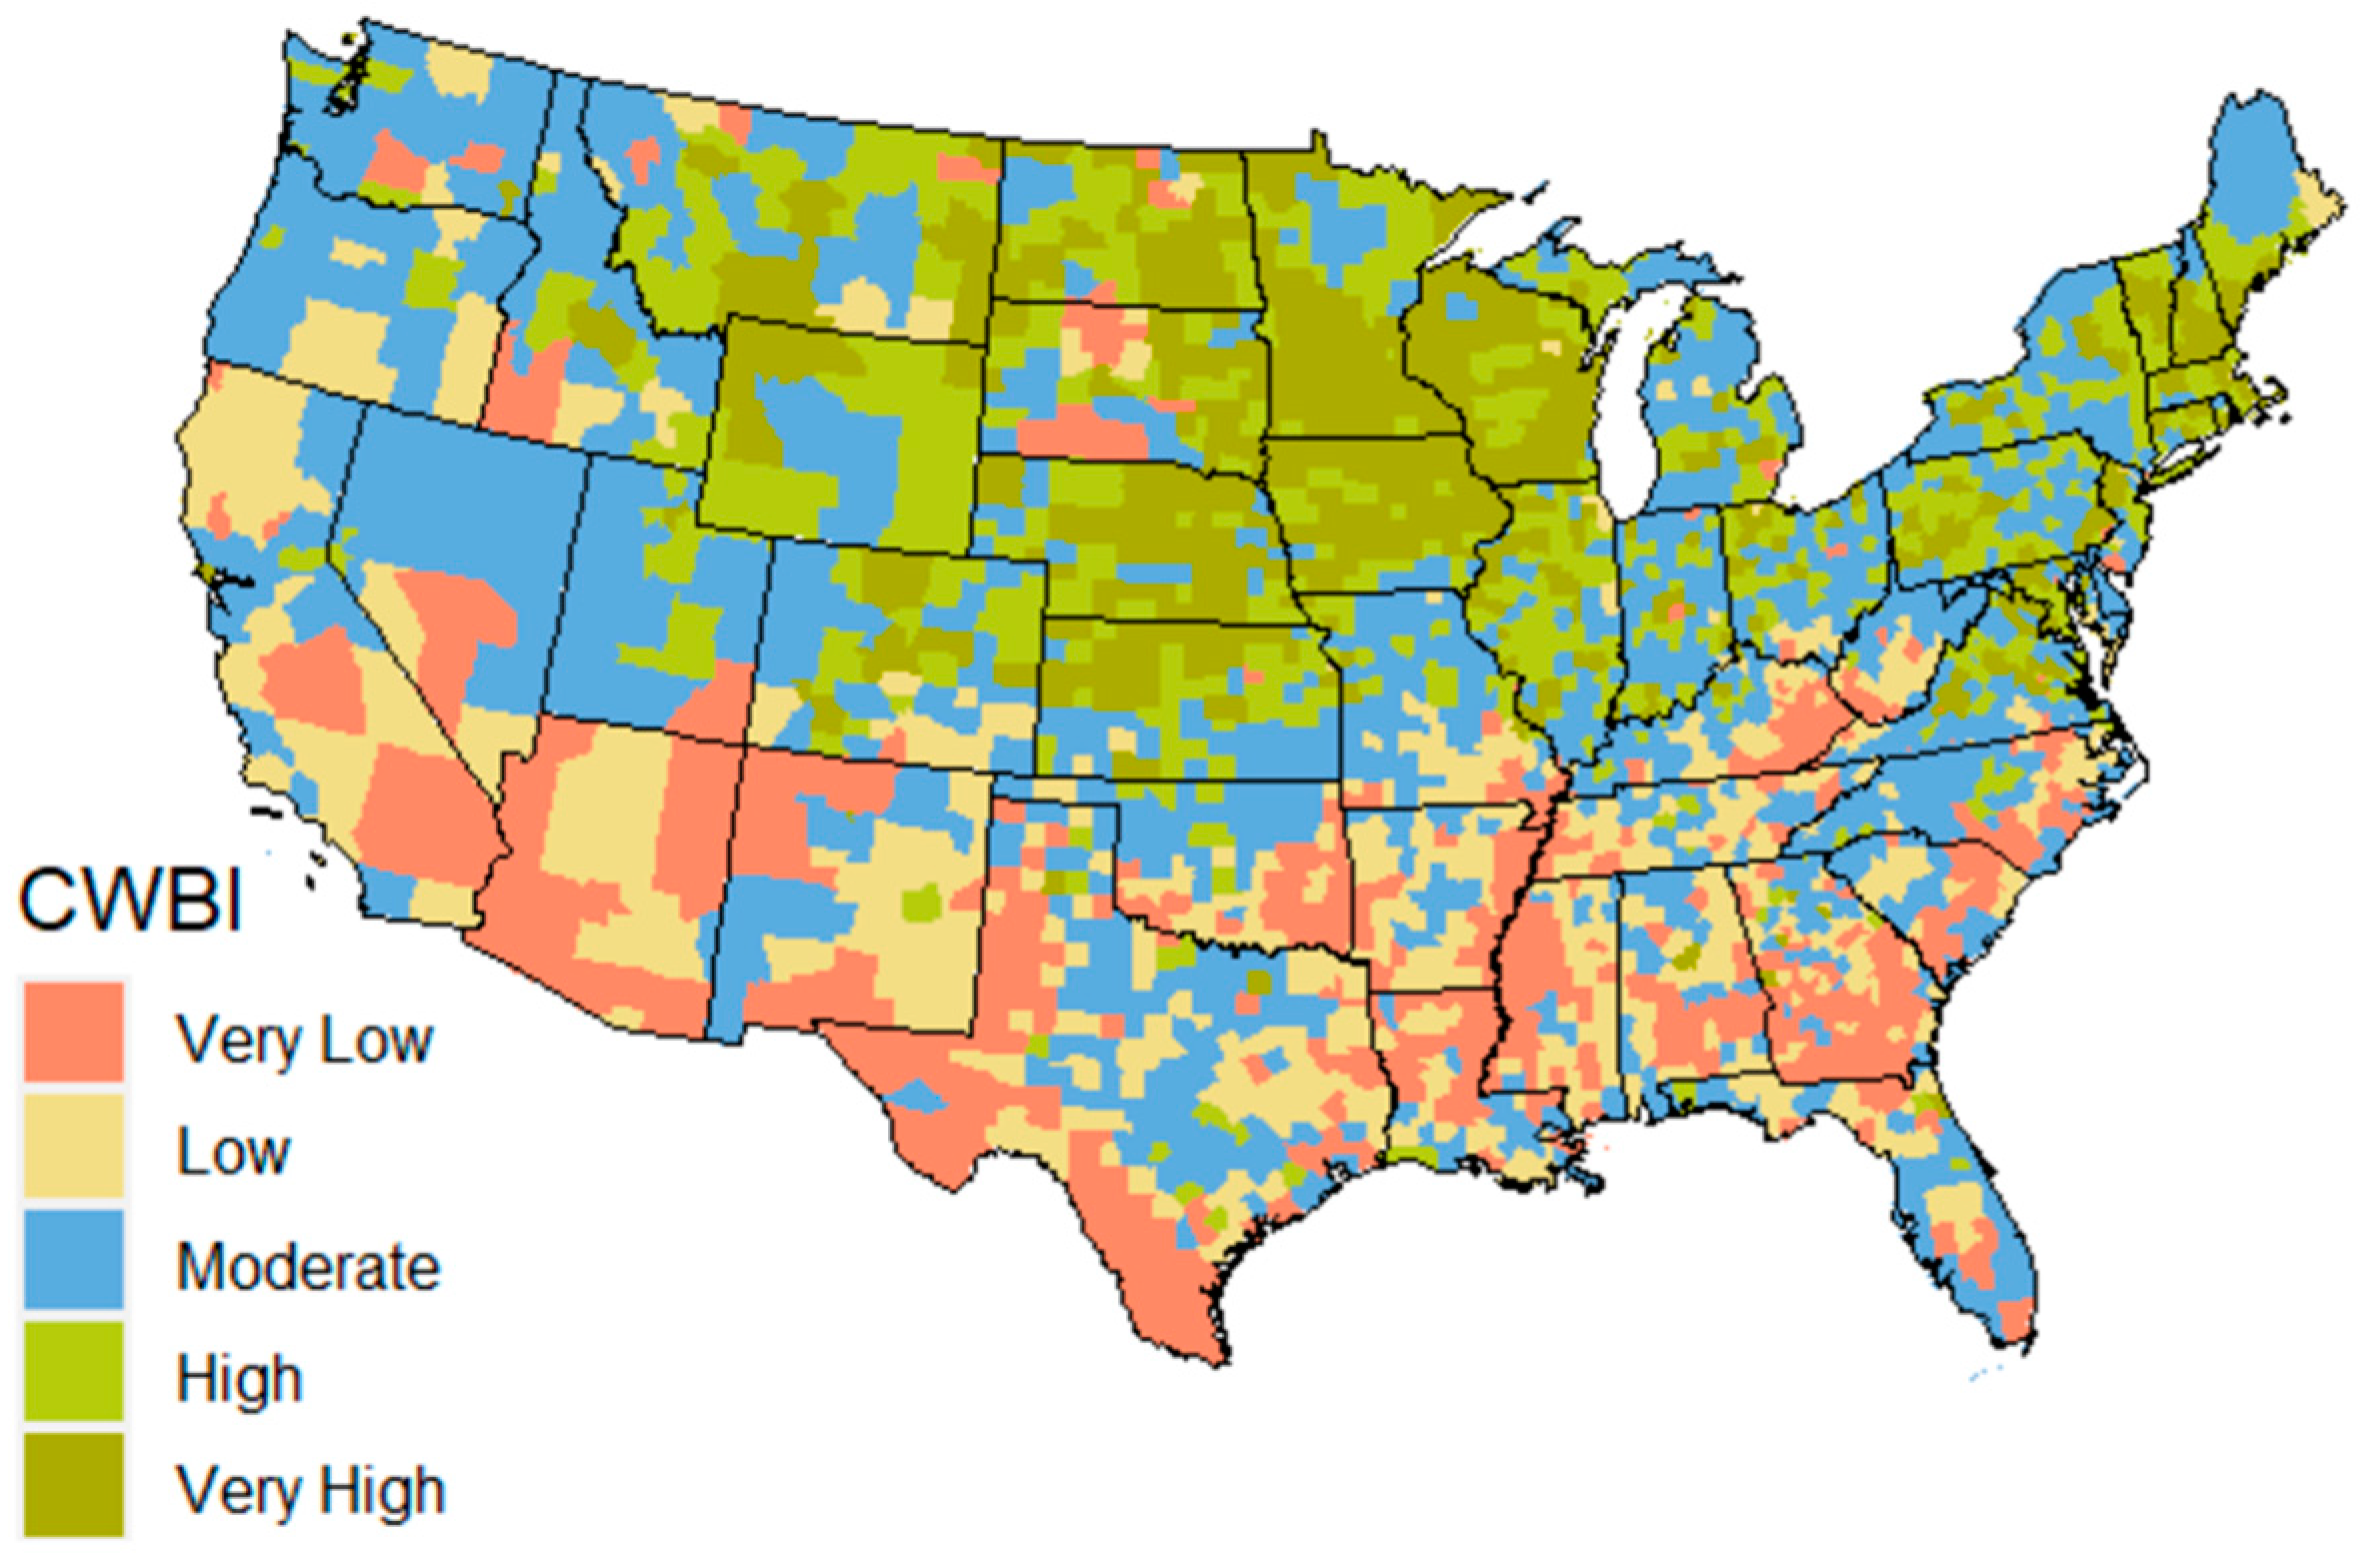
4.1. Community Well-Being across Counties

The computed community well-being index score ranges between 2.25 and 4.10, with the highest scores indicating counties with presumably higher levels of CWB relative to other counties in the U.S. during the same time period. (Table 1, Figure 3). Accordingly, the CWBI levels are all relative, i.e., the score assigned to each county is compared to the national county average within the U.S. This does not definitively indicate whether the quality of life or well-being is good or bad in certain places; rather, it suggests that it is relatively better or worse compared to other counties.
We observed a gradient of CWBI from north to south, with northern states exhibiting a higher prevalence of counties in the categories of moderate to very high well-being. As one moves toward the southern regions, including states such as New Mexico, Arkansas, and Oklahoma, there are more counties showing lower scores of CWBI. We observed some regional variations, with the Midwest and Northeastern states displaying predominantly moderate to high levels of CWBI. However, within the Midwest, we observed some areas with very low levels of CWBI scores.
Within states that generally score high on the CWBI, there are distinct counties where CWBI is markedly lower. South Dakota, for instance, stands out with the widest variability in CWBI scores across its communities, with a score range of 1.72 (Table S3). Other states showing a score range above one, indicating significant variability in community well-being across counties, include New Mexico (1.66), Texas (1.30), Georgia (1.25), Florida (1.10), and Virginia (1.07). Conversely, the five states with the lowest variability across counties are Delaware (0.17), Vermont (0.29), New Hampshire (0.35), Oregon (0.36), and Connecticut (0.37). In general, Mississippi (3.08) and Arizona (3.11) exhibit the lowest averages of CWBI scores for their respective counties, while Wisconsin (3.75) and Minnesota (3.75) show the highest CWBI score averages (Table S3).

4.2. Variation in Community Well-Being Based on Distinct Diversity–Productivity Characteristics

The above section considered all the contiguous U.S. counties. We now examine variations in CWBI scores for the 2575 counties included in the diversity–productivity typology. The bar charts in Figure 4 highlight the consistency in the distribution of CWBI across most diversity–productivity types, with a significant proportion of counties showing CWBI scores in the middle category. Except in the highly diverse and productive systems, places with higher levels of CWBI scores outweigh areas with lower scores across diversity–productivity types. The findings raise concerns regarding the well-being of agricultural communities characterized by high levels of diversity and productivity. The results show the predominance—in relative terms and absolute numbers—of counties with very low levels of CWBI within the HD/HP type (Figure 4, Table S4). There appears to be a pronounced challenge in CWB within the HD/HP type because around two-thirds of counties are situated in the two lowest levels of CWBI.
A closer look at Figure 4’s configuration indicates the emergence of other clear patterns. For instance, the very high CWBI level is prominently represented in the LD/HP type, comprising 26% of counties within this type. Two contrasting types of farming systems—LD/HP and HD/LP—show similar CWBI scores. Despite their inherent differences, both have above 40% of their counties in the two highest levels of CWBI compared to less than 25% in the two lowest CWBI levels.

4.3. Interactions of Farming Intensity and Diversity–Productivity Conditions with Community Well-Being

Figure 5 illustrates a comparison of CWBI variations across diversity–productivity types and distinct intensity classes of agricultural systems, offering a nuanced understanding of relationships between these factors and CWB. The findings show that the high diversity–low productivity group exhibits, in general, the largest index variability, while the low diversity areas, regardless of productivity levels, demonstrate the smallest variability in CWBI (Figure 5a, Table S5).
The CWBI index appears to follow a decreasing pattern from the areas classified as FD with high levels of agricultural importance to non-FD counties with lower levels of agricultural importance (Figure 5b). FD/AI counties, characterized by substantial commercial operations and the highest mean sales per operation or per acre of cropland, where agriculture substantially contributes to the overall GDP and employment, appear to generally hold a more favorable position than other places. Counties that are neither FD nor AI show a lower median value of CWBI. In essence, if we were to establish a control group to explore the association between farming and CWB, the latter would be in pole position with its low levels of agricultural indicators (Table 2). Jackson-Smith and Jensen [54] contended that this particular group is predominantly characterized by a leisure- or lifestyle-oriented approach to agriculture, lacking a substantial level of agricultural production in both relative and absolute terms.
Figure 5c presents a consistent pattern of low CWBI scores in areas where farming systems demonstrate a combination of high diversity and productivity. Those counties are mostly located in the southern regions, where we observed a concentration of low levels of CWBI (Figure 2 and Figure 3). Regarding the counties that are neither FD nor AI (our control group), with the exception of the HD/HP group of counties, we observed little differences within this class regardless of farming systems’ variations in diversity and productivity. Counties in this farming intensity class are characterized by a relatively modest sales volume and a limited agricultural contribution to the overall GDP and employment measures (Table 2). Despite the generally low CWBI scores in the HD/HP areas, we observed that the CWBI levels for this type approach the average when the agricultural system is FD/non-AI (i.e., places with the highest share of agricultural employment and the second highest share of agricultural GDP), whereas they are lower in AI regions or areas with limited agricultural involvement. This suggests that, in HD/HP areas, agricultural employment, rather than profitability, may be more closely associated with well-being and that high agricultural sales alone may not enhance well-being without the corresponding employment benefits. Meanwhile, we observed some notable deviations for counties categorized as LD/HP types within FD/AI and non-FD/AI classes. The index scores of counties within LD/HP types are significantly higher in areas where agricultural production is commercially and materially important (i.e., highest agricultural sales and highest sales per acre), whether the place is farming-dependent or not. More than 80% of counties in these agricultural intensity classes are in the Heartland region, with the highest value of production dominated by cash grain and cattle farms.
We conducted Kruskal–Wallis tests to compare the mean CWBI scores among diversity–productivity types (χ2(4) = 287.47, p < 0.001), agricultural intensity categories (χ2(3) = 110.66, p < 0.001), and their interactions. Although the boxplots displayed some overlap between certain groups (e.g., average-LD/HP), the statistically significant differences observed in the post-hoc tests indicate notable variability in the means across different diversity–productivity types and agricultural intensity categories (see detailed results of post-hoc tests in Table S2a,b). This implies that CWBI scores vary significantly between different farming system types and categories.
We repeated these tests to compare diversity–productivity types within each farming intensity category to account for interactions. The results confirmed that, in many cases, the interaction between these factors is significantly associated with CWBI scores, suggesting that the specific characteristics and practices of agricultural systems, including their diversity and intensity, play an important role in determining the well-being of agricultural communities. Although not our primary analysis technique, we also examined these interactions using a linear regression model. The predictive plots from this regression analysis revealed that farm dependence has a positive association with CWBI in HD-HP and HD-LP places, whereas agricultural intensity has a negative association with CWBI in these same places (Figure S6). However, the large variability observed within each group (Figure 5c) implies that localized factors extending beyond agricultural dynamics, such as social infrastructure, non-agricultural job opportunities, or local economic diversification, may play a critical role in influencing CWB.

5. Discussion

Since there has been no detailed description in the literature of potential connections between the interactions of diversity and agricultural productivity with community well-being at a macro-social-accounting level, this research study directly linked these global sustainability priorities through the lens of U.S. farming systems. In this paper, we examined CWB across farming systems with distinct diversity and productivity characteristics. To achieve this goal, we built a CWB index with a range of social and economic factors that contribute to a community’s overall quality of life and sustainability. We noted a concentration of low levels of index scores in the southern regions and a clustering of high index scores in the northern parts of the country. This observed geographic divide is not new and corroborates previous investigations on CWB, quality of life, and related topics, which highlighted similar patterns of deprivation resulting from the dynamic interplay among multiple social, economic, and political forces [20,55,56,57].
The examination of variations in the index across farming systems with distinct diversity and productivity characteristics shows some notable patterns of high levels of well-being across most diversity–productivity types. Analyses that combined farming intensity classification with the diversity–productivity typology reveal patterns of high levels of CWBI in areas characterized as low diversity–high productivity and where farming is commercially and materially important. Nelson and Burchfield [53] noted this type as the most dominant cropping regime, characterized by significant commercial operations and entrenched within a productivist framework, with all the consequences that entails. In general, low diversity areas, regardless of their productivity levels, tend to have more counties with high CWBI scores compared to those with low CWBI scores, whereas high diversity areas have more counties with low CWBI scores compared to high CWBI scores. Of note, both the farming dependence indicator and the agricultural importance indicator used to compute the agricultural intensity categories have a higher proportion of low-diversity places compared to high-diversity areas.
Moreover, the results raise concerns for areas of highly diverse and productive farming systems, as demonstrated by the relative dominance of low levels of CWBI. Overlaying the CWBI with the maps of diversity–productivity types and farming intensity classes, the observed patterns in the HD/HP type may be primarily attributed to the geographic context in which these counties are located. Despite some studies that have touted the advantages of diversification for agricultural communities in terms of strategies to address income challenges [58], improving agroecosystem health and resilience to climate events [59,60] and employment [28], it is important to acknowledge that these benefits may not effectively counteract the enduring impacts of historical and structural legacies that (re)produce disparities across regions. Gaskin et al. [61] unveiled in 2014 how historical policies and practices, including discriminatory housing policies and racial segregation, have significantly played a role in perpetuating racial disparities in health and overall well-being in the United States. In 2010, Cutler and Lleras-Muney [62] pointed out that factors such as poverty, inadequate education levels, and restricted healthcare access may be critical contributors to the disparities observed in CWB indicators across diverse regions (Figures S1–S5). Burchfield et al. [63], in 2022, underscored important racial disparities within the U.S. farming sector, particularly regarding federal program enrollment, farm size, and losses in farm income. More unfortunate trends in the livelihoods of U.S. farm operators are noticeably concentrated in areas with a higher presence of non-White farmers.
The present study has its limitations with respect to the construction of the index, the diversity–productivity typology used, and the farming intensity classification employed. First, we are constrained to data availability. Our primary goal was to use a ten-year average of each indicator included within the index. However, for certain variables, the data were only accessible for shorter time frames (Table S1). The decision to include these variables was made to ensure the inclusion of as many relevant indicators of CWB as possible while being mindful of data availability constraints. Second, due mostly to data availability, Nelson and Burchfield [53] noted some limitations in the development of the diversity–productivity typology with their metrics of crop productivity and crop diversity. The authors used productivity data for only five major commodity crops (corn, soy, wheat, hay, and alfalfa), and they expressed concerns about the accuracy of the information captured with the Shannon Diversity Index, such as its sensitivity to larger areas and its potential to misrepresent ecological health. This implies that our findings primarily relate to counties dominated by major commodity production, potentially overlooking areas with different agricultural focuses, such as high-value specialty crops. Finally, the two concepts at the basis of the farming intensity classification each have their own limitations [54]. The AI scheme favors higher-valued commodities (e.g., livestock and specialized vegetables) and excludes the aesthetic components (e.g., wildlife and open space) of agricultural landscapes. The FD scheme catches some relatively isolated rural places through the agricultural employment indicator at the expense of some more fertile and high-rainfall communities with higher yields. However, combining the two measures provides a pathway to capture the diversity of agricultural production intensity across the United States.

6. Conclusions

Our study findings highlight both positive and concerning trends in the connections between the diversity–productivity of farming systems and community well-being. Differences in CWB are not solely determined by the diversity–productivity typology and farming intensity categorization but also depend on contextual factors, such as rural–urban distinctions, regional variations, and potentially local circumstances. For example, while most LD/HP counties exhibit higher CWBI scores compared to HD/HP counties, there are instances where LD/HP counties have lower CWBI scores, while HD/HP areas have higher CWBI scores. This suggests that studies linking agriculture with its social consequences should account for local contexts, including the specific social processes and historical backgrounds. Just as we need to understand where, when, and how to diversify for a chance to sustainably increase agricultural productivity [64], approaches to enhancing CWB in the context of agricultural diversification might benefit from adopting a geographic perspective [65].
The findings from this study indicate that low-diversity and high-diversity areas have distinct needs for maintaining or enhancing CWBI. High-diversity places may benefit significantly more from agricultural employment compared to low-diversity regions, which benefit significantly more from agricultural activities, both in terms of employment and profitability. Therefore, agricultural policies and programs should be tailored to reflect these differences, considering historical and socio-economic contexts to effectively address local challenges and leverage local strengths for improved community well-being.
Being among the current trending agricultural topics of the 21st century, it is clear that interactions of diversity and productivity matter for both ecosystem health and individual and community well-being. To ensure that the advantages of farming systems are translated into improved well-being for both farmers and the surrounding communities, further research is needed to examine the challenges that counteract the benefits of agricultural diversity and productivity or whether community well-being concerns are taken into account in agricultural decision-making. In addition, while this study provides a valuable baseline understanding of the links between these global priorities at a national level, a more regional or context-specific approach is needed to understand better how different diversity–productivity or agricultural system types support CWB.

Supplementary Materials

The following supporting information can be downloaded at: https://www.mdpi.com/article/10.3390/su16166826/s1, Figure S1: Map of the score for the dimension of Material Needs; Figure S2: Map of the score for the dimension of Health; Figure S3: Map of the score for the dimension of Education; Figure S4: Map of the score for the dimension of Opportunity; Figure S5: Map of the score for the dimension of Social Community; Figure S6: Predicted values of CWBI from the linear regression model; Table S1: Variables used in the construction of the community well-being index; Table S2a: Kruskal-Wallis multiple comparisons of CWBI scores between diversity-productivity types with post-hoc pairwise comparisons; Table S2b: Kruskal-Wallis multiple comparisons of CWBI scores between agricultural intensity categories with post-hoc pairwise comparisons; Table S3: State variability in CWBI scores; Table S4: Distribution of counties by CWBI level and diversity–productivity types; Table S5: Variability in diversity–productivity types. References [66,67,68,69,70,71,72] are cited in the supplementary materials.

Author Contributions

Conceptualization, J.R.F., K.S.N., and E.K.B.; methodology, J.R.F. and K.S.N.; software, J.R.F.; validation, J.R.F., K.S.N., and E.K.B.; formal analysis, J.R.F.; investigation, J.R.F.; resources, J.R.F., K.S.N., and E.K.B.; data curation, J.R.F.; writing—original draft preparation, J.R.F.; writing—review and editing, J.R.F., K.S.N., and E.K.B.; visualization, J.R.F. and K.S.N.; supervision, K.S.N. and E.K.B.; project administration, J.R.F.; funding acquisition, J.R.F., K.S.N., and E.K.B. All authors have read and agreed to the published version of the manuscript.

Funding

This research was funded by USDA National Institute of Food and Agriculture, grant number 2020-67019-31157” and “The North Central Region Sustainable Agriculture Research and Education Graduate Student Grant, Agreement No. 2021-38640-34714, grant number GNC22-348. Any opinions, findings, conclusions, or recommendations expressed in this publication are those of the authors and do not necessarily reflect the view of the U.S. Department of Agriculture.

Institutional Review Board Statement

Not applicable.

Informed Consent Statement

Not applicable.

Data Availability Statement

The data presented in this study are available on GitHub at https://github.com/jeanribert/diversity-productivity-cwb (accessed on 6 August 2024).

Acknowledgments

The authors would like to acknowledge the assistance of Zak Ratajczak for his comments on the initial draft.

Conflicts of Interest

The authors declare no conflicts of interest. The funders had no role in the design of the study; in the collection, analyses, or interpretation of data; in the writing of the manuscript; or in the decision to publish the results.

References

  1. Burton, J.; World Health Organization. WHO Healthy Workplace Framework and Model: Background and Supporting Literature and Practices. 2010. Available online: https://apps.who.int/iris/bitstream/handle/10665/113144/9789241500241_eng.pdf?sequence=1&isAllowed=y (accessed on 26 June 2022).
  2. Nelson, K.S.; Nguyen, T.D.; Francois, J.R.; Ojha, S. Rural sustainability methods, drivers, and outcomes: A systematic review. Sustain. Dev. 2023, 31, 1226–1249. [Google Scholar] [CrossRef]
  3. Wiseman, J.; Brasher, K. Community wellbeing in an unwell world: Trends, challenges, and possibilities. Public Health Policy 2008, 29, 353–366. [Google Scholar] [CrossRef] [PubMed]
  4. Summers, J.K.; Smith, L.M.; Case, J.L.; Linthurst, R.A. A review of the elements of human well-being with an emphasis on the contribution of ecosystem services. AMBIO 2012, 41, 327–340. [Google Scholar] [CrossRef] [PubMed]
  5. Congress.gov. S.2830—101st Congress (1989–1990): Food, Agriculture, Conservation, and Trade Act of 1990. 1990. Available online: https://www.congress.gov/bill/101st-congress/senate-bill/2830 (accessed on 13 December 2023).
  6. Bailey, C.; Gopaul, A.; Thomson, R.; Gunnoe, A. Taking Goldschmidt to the woods: Timberland ownership and quality of life in Alabama. Rural Sociol. 2021, 86, 50–80. [Google Scholar] [CrossRef]
  7. Lobao, L.; Stofferahn, C.W. The community effects of industrialized farming: Social science research and challenges to corporate farming laws. Agric. Hum. Values 2008, 25, 219–240. [Google Scholar] [CrossRef]
  8. Lyson, T.A.; Welsh, R. Agricultural industrialization, anticorporate farming laws, and rural community welfare. Environ. Plan A 2005, 37, 1479–1491. [Google Scholar] [CrossRef]
  9. Wilson, G.A. From productivism to post-productivism… and back again? Exploring the (un)changed natural and mental landscapes of European agriculture. Trans. Inst. Br. Geogr. 2001, 26, 77–102. [Google Scholar] [CrossRef]
  10. Leitschuh, B.; Stewart, W.P.; van Riper, C.J. Place-making in the Corn Belt: The productivist landscapes of the “good farmer”. J. Rural Stud. 2022, 92, 415–424. [Google Scholar] [CrossRef]
  11. MacDonald, J.M. Tracking the consolidation of U.S. agriculture. Appl. Econ. Perspect. Policy 2020, 42, 361–379. [Google Scholar] [CrossRef]
  12. Harrison, J.L.; Getz, C. Farm size and job quality: Mixed-methods studies of hired farm work in California and Wisconsin. Agric. Hum. Values 2015, 32, 617–634. [Google Scholar] [CrossRef]
  13. Park, S.J.; Deller, S. Effect of farm structure on rural community well-being. J. Rural Stud. 2021, 87, 300–313. [Google Scholar] [CrossRef]
  14. Lobao, L. Locality and Inequality: Farm and Industry Structure and Socioeconomic Conditions; SUNY Press: Albany, NY, USA, 1990. [Google Scholar]
  15. Goldschmidt, W. Large-scale farming and the rural social structure. Rural Sociol. 1978, 43, 362–366. [Google Scholar]
  16. Goldschmidt, W. As You Sow: Three Studies into the Social Consequences of Agribusiness; Allanheld, Osmun and Company: Montclair, NJ, USA, 1946. [Google Scholar]
  17. Wing, S.; Horton, R.A.; Marshall, S.W.; Thu, K.; Tajik, M.; Schinasi, L.; Schiffman, S.S. Air pollution and odor in communities near industrial swine operations. Environ. Health Perspect. 2008, 116, 1362–1368. [Google Scholar] [CrossRef] [PubMed]
  18. Meredith, B.G.; Bean, A.; Brymer, A.B.; Friedrichsen, C.; Hurst, Z. Integrating human dimensions within the LTAR Network to achieve agroecological system transformation. Rangelands 2022, 44, 368–376. [Google Scholar] [CrossRef]
  19. Bentley Brymer, A.L.; Toledo, D.; Spiegal, S.; Pierson, F.; Clark, P.E.; Wulfhorst, J.D. Social-ecological processes and impacts affect individual and social well-being in a rural Western U.S. landscape. Front. Sustain. Food Syst. 2020, 21, 38. [Google Scholar] [CrossRef]
  20. Francois, J.R.; Nelson, K.S. Examining the state of community well-being at the intersection of rurality and agricultural engagement in the contiguous United States. Int. J. Community Well-Being 2024, 7, 315–343. [Google Scholar] [CrossRef]
  21. Millennium Ecosystem Assessment. Ecosystems and Human Well-Being: Synthesis; Island Press: Washington, DC, USA, 2005. [Google Scholar]
  22. Cardinale, B.J.; Duffy, J.E.; Gonzalez, A.; Hooper, D.U.; Perrings, C.; Venail, P.; Narwani, A.; Mace, G.M.; Tilman, D.; Wardle, D.A.; et al. Biodiversity loss and its impact on humanity. Nature 2012, 486, 59–67. [Google Scholar] [CrossRef] [PubMed]
  23. Díaz, S.; Fargione, J.; Chapin, F.S.; Tilman, D. Biodiversity loss threatens human well-being. PLoS Biol. 2006, 4, e277. [Google Scholar] [CrossRef] [PubMed]
  24. Frison, E.A.; Cherfas, J.; Hodgkin, T. Agricultural biodiversity is essential for a sustainable improvement in food and nutrition security. Sustainability 2011, 3, 238–253. [Google Scholar] [CrossRef]
  25. Garibaldi, L.A.; Gemmill-Herren, B.; D’Annolfo, R.; Graeub, B.E.; Cunningham, S.A.; Breeze, T.D. Farming approaches for greater biodiversity, livelihoods, and food security. Trends Ecol. Evol. 2017, 32, 68–80. [Google Scholar] [CrossRef]
  26. Keesing, F.; Belden, L.K.; Daszak, P.; Dobson, A.; Harvell, C.D.; Holt, R.D.; Hudson, P.; Jolles, A.; Jones, K.E.; Mitchell, C.E.; et al. Impacts of biodiversity on the emergence and transmission of infectious diseases. Nature 2010, 468, 647–652. [Google Scholar] [CrossRef] [PubMed]
  27. Bacon, C.M.; Getz, C.; Kraus, S.; Montenegro, M.; Holland, K. The social dimensions of sustainability and change in diversified farming systems. Ecol. Soc. 2012, 17, 41. [Google Scholar] [CrossRef]
  28. Garibaldi, L.A.; Pérez-Méndez, N. Positive outcomes between crop diversity and agricultural employment worldwide. Ecol. Econ. 2019, 164, 106358. [Google Scholar] [CrossRef]
  29. Shreck, A.; Getz, C.; Feenstra, G. Social sustainability, farm labor, and organic agriculture: Findings from an exploratory analysis. Agric. Hum. Values 2006, 23, 439–449. [Google Scholar] [CrossRef]
  30. Feliciano, D. A review on the contribution of crop diversification to Sustainable Development Goal 1 “No poverty” in different world regions. Sustain. Dev. 2019, 27, 795–808. [Google Scholar] [CrossRef]
  31. National Research Council. Toward Sustainable Agricultural Systems in the 21st Century; The National Academies Press: Washington, DC, USA, 2010; pp. 1–598.
  32. Gillespie-Marthaler, L.; Nelson, K.; Baroud, H.; Abkowitz, M. Selecting indicators for assessing community sustainable resilience. Risk Anal. 2019, 39, 2479–2498. [Google Scholar] [CrossRef]
  33. Theodori, G.L. Community and community development in resource-based areas: Operational definitions rooted in an interactional perspective. Soc. Nat. Resour. 2005, 18, 661–669. [Google Scholar] [CrossRef]
  34. Lee, S.J.; Kim, Y. Searching for the meaning of community well-being. In Community Well-Being and Community Development; Lee, S.J., Kim, Y., Phillips, R., Eds.; Springer: Cham, Switzerland, 2015; pp. 9–23. [Google Scholar]
  35. Sung, H.; Phillips, R.G. Indicators and community well-being: Exploring a relational framework. Int. J. Community Well-Being 2018, 1, 63–79. [Google Scholar] [CrossRef]
  36. Kee, Y.; Kim, Y.; Phillips, R. Modeling community well-being: A multi-dimensional approach. In Learning and Community Approaches for Promoting Well-Being; Kee, Y., Kim, Y., Phillips, R., Eds.; Springer International: Cham, Switzerland, 2015. [Google Scholar]
  37. Matson, P.A.; Clark, W.C.; Andersson, K.P. Pursunig Sustainability: A Guide to the Science and Practice; Princeton University Press: Princeton, NJ, USA, 2016. [Google Scholar]
  38. Burton, R.J.F. Seeing through the ‘good farmer’s’ eyes: Towards developing an understanding of the social symbolic value of ‘productivist’ behaviour. Sociol. Rural. 2004, 44, 195–215. [Google Scholar] [CrossRef]
  39. Buck, K.D.; Kevin Summers, J.; Smith, L.M.; Harwell, L.C. Application of the human well-being index to sensitive population divisions: A Children’s well-being index development. Child Indic. Res. 2018, 11, 1249–1280. [Google Scholar] [CrossRef]
  40. Richardson, E.; Hughes, E.; McLennan, S.; Meo-Sewabu, L. Indigenous well-being and development: Connections to large-scale mining and tourism in the Pacific. Contemp. Pac. 2019, 31, 1–34. [Google Scholar] [CrossRef]
  41. Hardi, P.; Pintér, L. City of Winnipeg quality-of-life indicators. In Community Quality-of-Life Indicators; Sirgy, M.J., Rahtz, D., Swain, D., Eds.; Springer: Dordrecht, The Netherlands, 2006; pp. 127–176. [Google Scholar]
  42. Kim, S.; Koh, K. Health insurance and subjective well-being: Evidence from two healthcare reforms in the United States. Health Econ. 2022, 31, 233–249. [Google Scholar] [CrossRef] [PubMed]
  43. Callaghan, E.G.; Colton, J. Building sustainable and resilient communities: A balancing of community capital. Environ. Dev. Sustain. 2008, 10, 931–942. [Google Scholar] [CrossRef]
  44. Deller, S.C.; Tsai, T.; Marcouiller, D.W.; English, D.B.K. The role of amenities and quality of life in rural economic growth. Am. J. Agric. Econ. 2001, 83, 352–365. [Google Scholar] [CrossRef]
  45. Rural School and Community Trust. Building Strong Rural Schools—In South Carolina: The Foundations We Need; Rural School and Community Trust: Washington, DC, USA, 2003. [Google Scholar]
  46. VanderWeele, T.J. Measures of community well-being: A template. Int. J. Community Well-Being 2019, 3–4, 253–275. [Google Scholar] [CrossRef]
  47. Walker, K.; Herman, M. Tidycensus: Load US Census Boundary and Attribute Data as “tidyverse” and ‘sf’-Ready Data Frames_. R Package Version 1.5. 2023. Available online: https://walker-data.com/tidycensus/ (accessed on 30 November 2023).
  48. Cutter, S.L.; Ash, K.D.; Emrich, C.T. The geographies of community disaster resilience. Glob. Environ. Chang. 2014, 29, 65–77. [Google Scholar] [CrossRef]
  49. Tate, E. Uncertainty analysis for a social vulnerability index. Ann. Assoc. Am. Geogr. 2013, 103, 526–543. [Google Scholar] [CrossRef]
  50. Kyne, D.; Aldrich, D.P. Capturing bonding, bridging, and linking social capital through publicly available data. Risk Hazards Crisis Public Policy 2020, 11, 61–86. [Google Scholar] [CrossRef]
  51. Cronbach, L.J. Coefficient alpha and the internal structure of tests. Psychometrika 1951, 16, 297–334. [Google Scholar] [CrossRef]
  52. R Core Team. R: A Language and Environment for Statistical Computing; R Foundation for Statistical Computing: Vienna, Austria, 2022; Available online: https://www.r-project.org/ (accessed on 8 July 2022).
  53. Nelson, K.S.; Burchfield, E.K. Defining features of diverse and productive agricultural systems: An archetype analysis of U.S. agricultural counties. Front. Sustain. Food Syst. 2023, 7, 1081079. [Google Scholar] [CrossRef]
  54. Jackson-Smith, D.B.; Jensen, E. Finding farms: Comparing indicators of farming dependence and agricultural importance in the United States. Rural Sociol. 2009, 74, 37–55. [Google Scholar] [CrossRef]
  55. Amin, R.W.; Rivera-Muñiz, B.; Guttmann, R.P. A spatial study of quality of life in the USA. SN Soc. Sci. 2021, 1, 110. [Google Scholar] [CrossRef]
  56. Dwivedi, P.; Huang, D.; Yu, W.; Nguyen, Q. Predicting geographical variation in health-related quality of life. Prev. Med. 2019, 126, 105742. [Google Scholar] [CrossRef] [PubMed]
  57. Kodras, J.E. The changing map of American poverty in an era of economic restructuring and political realignment. Econ. Geogr. 1997, 73, 67. [Google Scholar]
  58. Meert, H.; Van Huylenbroeck, G.; Vernimmen, T.; Bourgeois, M.; van Hecke, E. Farm household survival strategies and diversification on marginal farms. J. Rural Stud. 2005, 21, 81–97. [Google Scholar] [CrossRef]
  59. Liebman, M.; Helmers, M.J.; Schulte, L.A.; Chase, C.A. Using biodiversity to link agricultural productivity with environmental quality: Results from three field experiments in Iowa. Renew. Agric. Food Syst. 2013, 28, 115–128. [Google Scholar] [CrossRef]
  60. Nelson, K.S.; Patalee, B.; Yao, B. Higher landscape diversity associated with improved crop production resilience in Kansas-USA. Environ. Res. Lett. 2022, 17, 084011. [Google Scholar] [CrossRef]
  61. Gaskin, D.J.; Thorpe, R.J.; McGinty, E.E.; Bower, K.; Rohde, C.; Young, J.H.; LaVeist, T.A.; Dubay, L. Disparities in diabetes: The nexus of race, poverty, and place. Am. J. Public Health 2014, 104, 2147–2155. [Google Scholar] [CrossRef] [PubMed]
  62. Cutler, D.M.; Lleras-Muney, A. Understanding differences in health behaviors by education. J. Health Econ. 2010, 29, 1–28. [Google Scholar] [CrossRef]
  63. Burchfield, E.K.; Schumacher, B.L.; Spangler, K.; Rissing, A. The state of US farm operator livelihoods. Front. Sustain. Food Syst. 2022, 5, 795901. [Google Scholar] [CrossRef]
  64. Burchfield, E.K.; Nelson, K.S.; Spangler, K. The impact of agricultural landscape diversification on U.S. crop production. Agric. Ecosyst. Environ. 2019, 285, 106615. [Google Scholar] [CrossRef]
  65. Winterton, R.; Hulme Chambers, A.; Farmer, J.; Munoz, S.A. Considering the implications of place-based approaches for improving rural community wellbeing: The value of a relational lens. Rural Soc. 2014, 23, 283–295. [Google Scholar] [CrossRef]
  66. National Center for Health Statistics. U.S. Small-Area Life Expectancy Estimates Project (USALEEP). Life Expectancy Estimates File for {Jurisdiction}, 2010–2015. National Center for Health Statistics. 2018. Available online: https://www.cdc.gov/nchs/nvss/usaleep/usaleep.html (accessed on 5 June 2023).
  67. Institute for Health Metrics and Evaluation (IHME). United States Mortality Rates and Life Expectancy by County, Race, and Ethnicity 2000–2019; Institute for Health Metrics and Evaluation (IHME): Seattle, WA, USA, 2022. [Google Scholar]
  68. Khan, D.; Hamilton, B.; Rossen, L.M.; He, Y.; Wei, R.; Dienes, E. Teen Birth Rates for Age Group 15–19 in the United States by County, 2003–2020. In National Center for Health Statistics; 2022. Available online: https://www.cdc.gov/nchs/data-visualization/county-teen-births/ (accessed on 8 October 2023).
  69. Dhillon, D. US Education—Student Teacher Ratios [Data file]. 2019. Available online: https://odn.data.socrata.com/Education/US-Education-Student-Teacher-Ratios/xngt-jpn3 (accessed on 5 June 2023).
  70. Kaplan, J. Jacob Kaplan’s Concatenated Files: Uniform Crime Reporting Program Data: Offenses Known and Clearances by Arrest (Return A), 1960–2020. 2021. Available online: https://www.openicpsr.org/openicpsr/project/100707/version/V17/view?path=/openicpsr/100707/fcr:versions/V17/ucr_offenses_known_yearly_1960_2020_dta.zip&type=file (accessed on 3 August 2022).
  71. MIT Election Data and Science Lab. County Presidential Election Returns 2000–2020, Harvard Dataverse, V11, UNF:6:HaZ8GWG8D2abLleXN3uEig== [fileUNF]. 2018. Available online: https://dataverse.harvard.edu/dataset.xhtml?persistentId=doi:10.7910/DVN/VOQCHQ (accessed on 3 August 2022).
  72. Rupasingha, A.; Goetz, S.J.; Freshwater, D. The production of social capital in US counties. J. Socio-Econ. 2006, 35, 83–101. [Google Scholar] [CrossRef]
Figure 1. Farming intensity classes derived from farm dependency and agricultural importance.
Sustainability 16 06826 g001
Figure 2. Spatial distribution of sample counties: (a) based on diversity–productivity conditions of farming systems; (b) based on their intensity of farming activities (right).
Sustainability 16 06826 g002
Figure 3. Map of CWBI across counties.
Sustainability 16 06826 g003
Figure 4. Distribution of community well-being levels across diversity–productivity types. Y-axis indicates the percentage of observations that are in a specific level of CWBI relative to each diversity–productivity type.
Sustainability 16 06826 g004
Figure 5. Comparison of CWBI scores across the following: (a) diversity–productivity types; (b) farming intensity classes; (c) combinations of diversity–productivity types and farming intensity classes. The dark grey line represents the average CWBI. Boxplots display the median value as a thick black line, the interquartile range within the box, and the 95% confidence interval as thin lines. Outliers are represented by individual points.
Sustainability 16 06826 g005
Table 1. Number of variables used by CWB dimensions, minimum and maximum scores of dimensions, and the overall index, and the internal consistency of combined variables.
CWB DimensionNumber of
Variables
Cronbach’s
Alpha
Minimum ScoreMaximum Score
Material needs4 0.350.96
Health4 0.240.98
Education 3 0.390.92
Opportunity7 0.330.80
Social community4 0.260.75
All variables combined220.802.254.10
Table 2. Descriptive summary (mean and standard deviation in parenthesis) of variables used in the development of farming intensity indicator.
VariablesFD/AIFD/Non-AINon-FD/AINon-FD/Non-AI
Total agricultural sales (in $ millions)372.4364.51270.0541.96
(320.45)(39.86)(380.57)(36.48)
Sales per acre of farmland (in $)948.00178.051148.65631.70
(835.03)(140.92)(948.36)(8902.05)
Sales per acre of cropland (in $)525.90188.83982.86511.87
(448.91)(120.05)(1619.73)(1059.33)
Share of agricultural GDP (%)36.7219.908.042.87
(14.54)(16.38)(6.82)(4.04)
Share of agricultural jobs (%)18.0823.155.675.05
(6.26)(6.88)(4.02)(4.21)
Acres per operation374.08716.16116.28120.78
(321.77)(2350.61)(117.40)(233.28)
Sales per operation (in $1000)726.74169.61327.4886.77
(783.47)(132.28)(261.37)(85.55)
Disclaimer/Publisher’s Note: The statements, opinions and data contained in all publications are solely those of the individual author(s) and contributor(s) and not of MDPI and/or the editor(s). MDPI and/or the editor(s) disclaim responsibility for any injury to people or property resulting from any ideas, methods, instructions or products referred to in the content.

