
Analysis of the Decoupling between Urban Economic Development and Transportation Carbon Emissions in China: Empirical Evidence from 284 Cities

Abstract
1. Introduction
- (1)
- Using the Environment Kuznets Curve (EKC) model, the fluctuation relationship between transportation carbon emissions with economic growth is studied to verifying the existence of EKC theory. For example, based on data in the period of 1971–2011, Alshebry et al. [9] used Autoregressive Distributed Lag and the Granger causality test to verify the EKC hypothesis of transportation CO2 and economic growth in Saudi Arabia, which found that there is no inverse “U” type nonlinear relationship between them. Kharbach et al. [10] analyzed the relationship between road transportation CO2 and economic growth in Morocco, confirming the existence of the EKC curve. Amin et al. [11] analyzed the EKC model and found that renewable energy, economic growth and urbanization have a one-way causal relationship with the carbon emissions of the transportation sector in Europe. On the other hand, based on data from 30 provinces in China, Guo et al. [12] confirmed that there is an inverted U-shaped EKC curve relationship between provincial economic growth and transportation carbon emissions. In addition, some scholars also combined the EKC model with other methods to predict the carbon emissions of the transportation sector. For example, Huang et al. [13] proposed a nonlinear multivariate gray prediction model based on EKC in view of the realistic characteristics of incomplete statistics of carbon emissions data of the transportation sector, considering factors such as economy, population and energy.
- (2)
- The relationship between transportation carbon emissions and economic growth was discussed with the help of decoupling models, including the Tapio decoupling model, Kaya identity and log-mean variance index (LMDI) decomposition model. Jiang et al. [14] combined the decomposition technology with decoupling analysis and decomposed the traffic decoupling index into five different aspects to analyze the key driving factors of the decoupling of CO2 emissions related to different transportation modes and transportation turnover. Liu et al. [8] adopted the Tapio decoupling model and LMDI decomposition model to conduct decoupling research on energy-related carbon emissions for transportation and gross domestic product (GDP) from the national and provincial levels. Similar to the study by Liu et al. [8], Zhang et al. [15] explored the decoupling relationship between provincial transportation carbon emissions and economic development in the Yellow River Basin, and believed that there were significant differences in the influencing factors between the “upstream region” and the “downstream region”. Based on the Tapio decoupling model, Foster et al. [16] discussed the differences between the decoupling state of transport carbon emissions and economic growth in low-, middle- and high-income countries. On the whole, it is generally believed that with the technological progress, the adjustment of energy structure and the guidance of government policies, the carbon emissions of the transportation sector are expected to achieve decoupling from economic growth [17]. In addition, some scholars analyze the decoupling relationship between negative externalities of cargo transport and economic growth from the perspective of sustainable development of the transportation system [18]. For instance, Loo and Banister [19] explored the potential and reality of transport decoupling in 15 major countries since 1990 by measuring changes in all three elements of sustainable development (economic, environmental and social).
2. Research Methods and Data Sources
2.1. Velocity Decoupling: Tapio Decoupling Model
2.2. Quantitative Decoupling: EKC Model
3. Indicator Selection and Data Source
- (1)
- Urban population density (PDN). Many previous studies have confirmed that population density is a crucial factor affecting transportation carbon emissions [33,34]. The increase in urban population density can aggravate the demand for transportation, and then worsen the carbon emissions, showing an adverse impact. The ratio of population to urban area is adopted to measure PDN in this article.
- (2)
- Urban road density (RDN), which is evaluated by the ratio of urban road area to the population following the research of Aljoufie [35]. RDN not only reflects the urban form but also characterizes the development level of urban transport infrastructure. Some scholars believe that it has a positive impact on transportation carbon emissions [36], while some hold the opposite view [34]. The authors argue that RND will lead to greater transportation demand and further aggravate transportation carbon emissions in China, that is, a positive relationship is predicted.
- (3)
- Public transport operating efficiency (PTE), reflecting the operation quality of urban public transport, which is evaluated by the average passenger volume of public transport vehicles per unit. Public transport plays an important role in urban transportation. Since new energy vehicles have been promoted at a very early age in China, as an efficient and environmentally friendly mode of transportation, their operation quality certainly has a significant impact on urban transportation carbon emissions.
- (4)
- Per capita private car ownership (PRC). One of the main contributors of transport carbon emissions is private cars, since most of them use gasoline or diesel, which can produce a lot of CO2. Therefore, the more PRC, the more transport carbon emissions.
4. Results and Discussion
4.1. Velocity Decoupling State Analysis
4.1.1. Decoupling State Analysis in Time Dimension
- (1)
- Decoupling stable cities, whose decoupling characteristics are as follows: During the study period, although there are a few years of transient expansion coupling and even the expansion negative decoupling phenomenon, the time of strong or weak decoupling state of such cities is at least 10 years, and the decoupling state remains stable on the whole. In terms of spatial distribution, these cities are relatively dispersed. In terms of a weak or strong decoupling stage, there are 32 cities in the eastern region, 46 cities in the central region, and 43 cities in the western region. In terms of the decoupling between per capita transportation carbon emissions and per capita GDP, it is mainly concentrated in 23 provinces such as Beijing, Anhui and Fujian, including 30 cities in the eastern region, 47 cities in the central region and 44 cities in the western region for weak decoupling as well as strong decoupling.
- (2)
- Decoupling relatively stable cities: During the study period, some years show expansion coupling and even expansion negative decoupling, but over the past 7 years and less than 10 years, strong or weak decoupling states are shown, the decoupling state is relatively stable, and has the potential to further improve. According to the decoupling state of urban transportation carbon emissions and GDP, such cities are distributed in 17 provinces, including Guangdong, Jiangsu, Shanghai, Yunnan and Zhejiang. Among them are 66 cities in the eastern region, 50 cities in the central region and 40 cities in the western region, showing the characteristics of decreasing in number in the eastern central region and the western region. According to the decoupling between per capita transportation carbon emissions and per capita GDP, the spatial distribution of these cities also showed a descending gradient trend in the east, central and western regions. Among them are 69 cities in the eastern region, 49 cities in the central region and 39 cities in the western region.
- (3)
- Decoupling unstable cities: During the research period, the years for the cities to achieve strong decoupling and weak decoupling states are less than 7 years, and most years show expansion coupling and even expansion negative decoupling, and the decoupling state is relatively unstable. According to the decoupling index of transportation carbon emission and GDP and per capita transportation carbon emission and per capita GDP, these cities are mainly located in Heilongjiang, Hebei, Gansu and Jilin provinces, among which there is one city in the eastern region, four cities in the central region and one city in the western region, which are generally located in the central region.
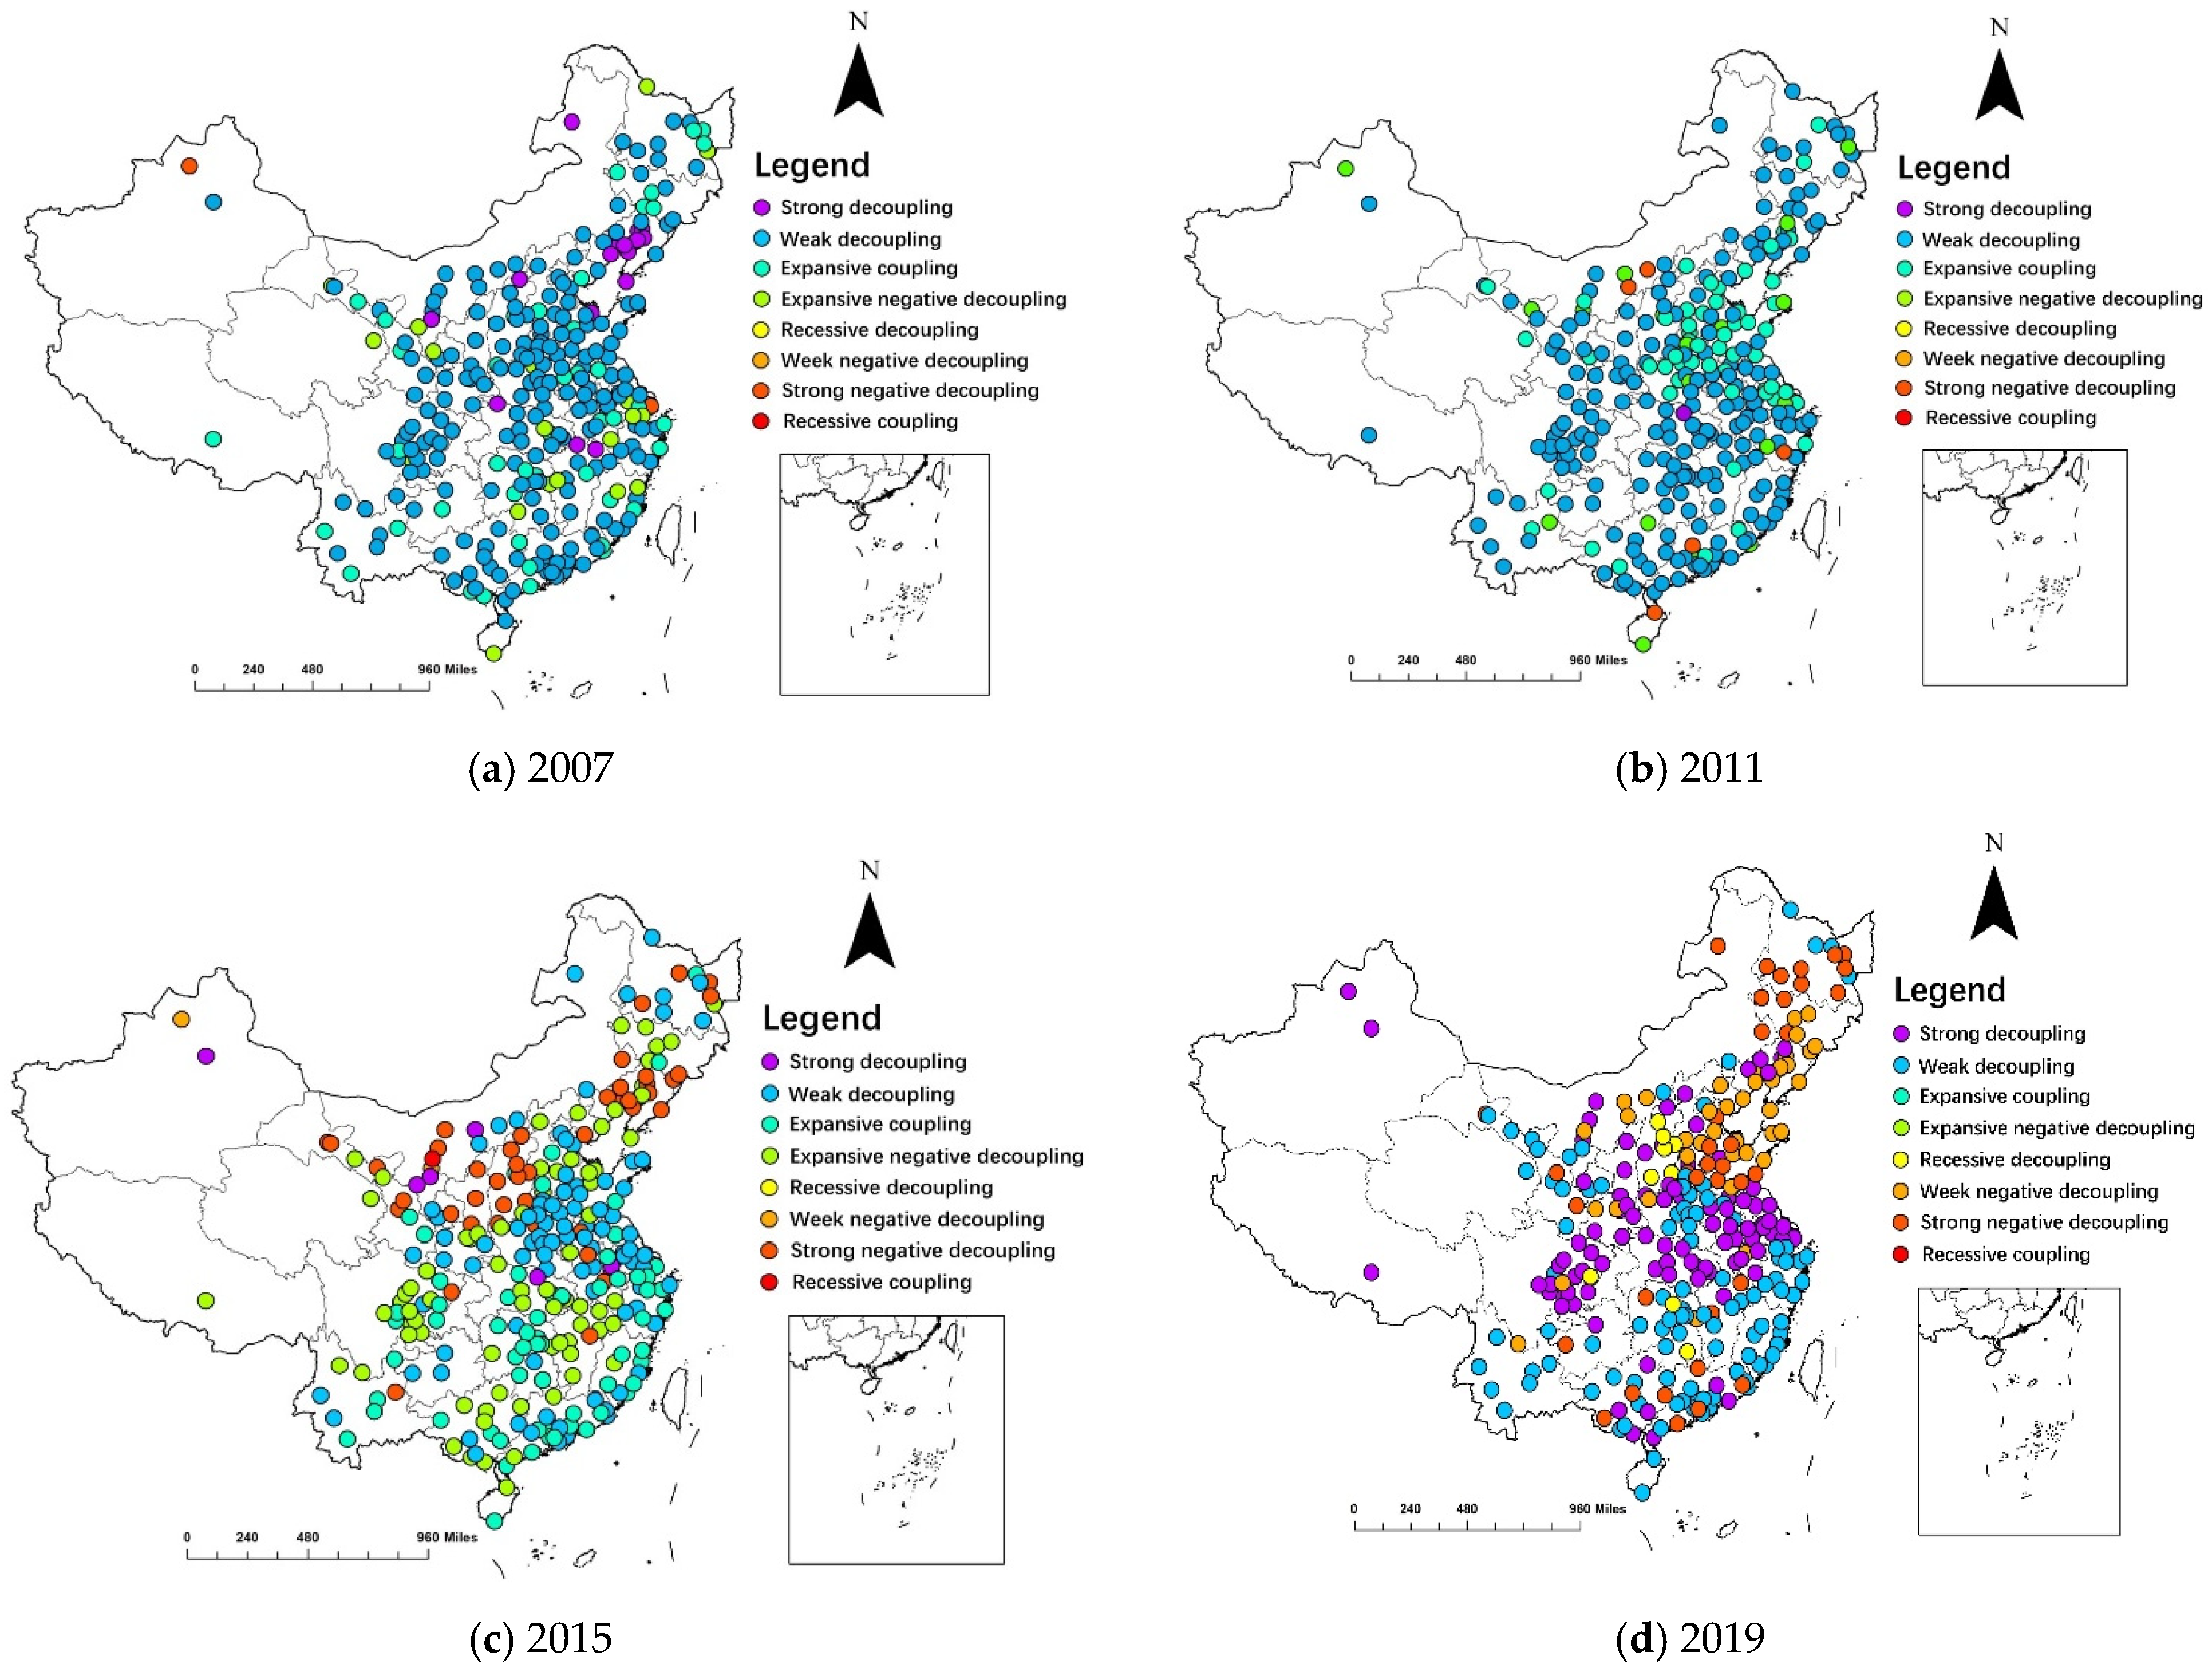
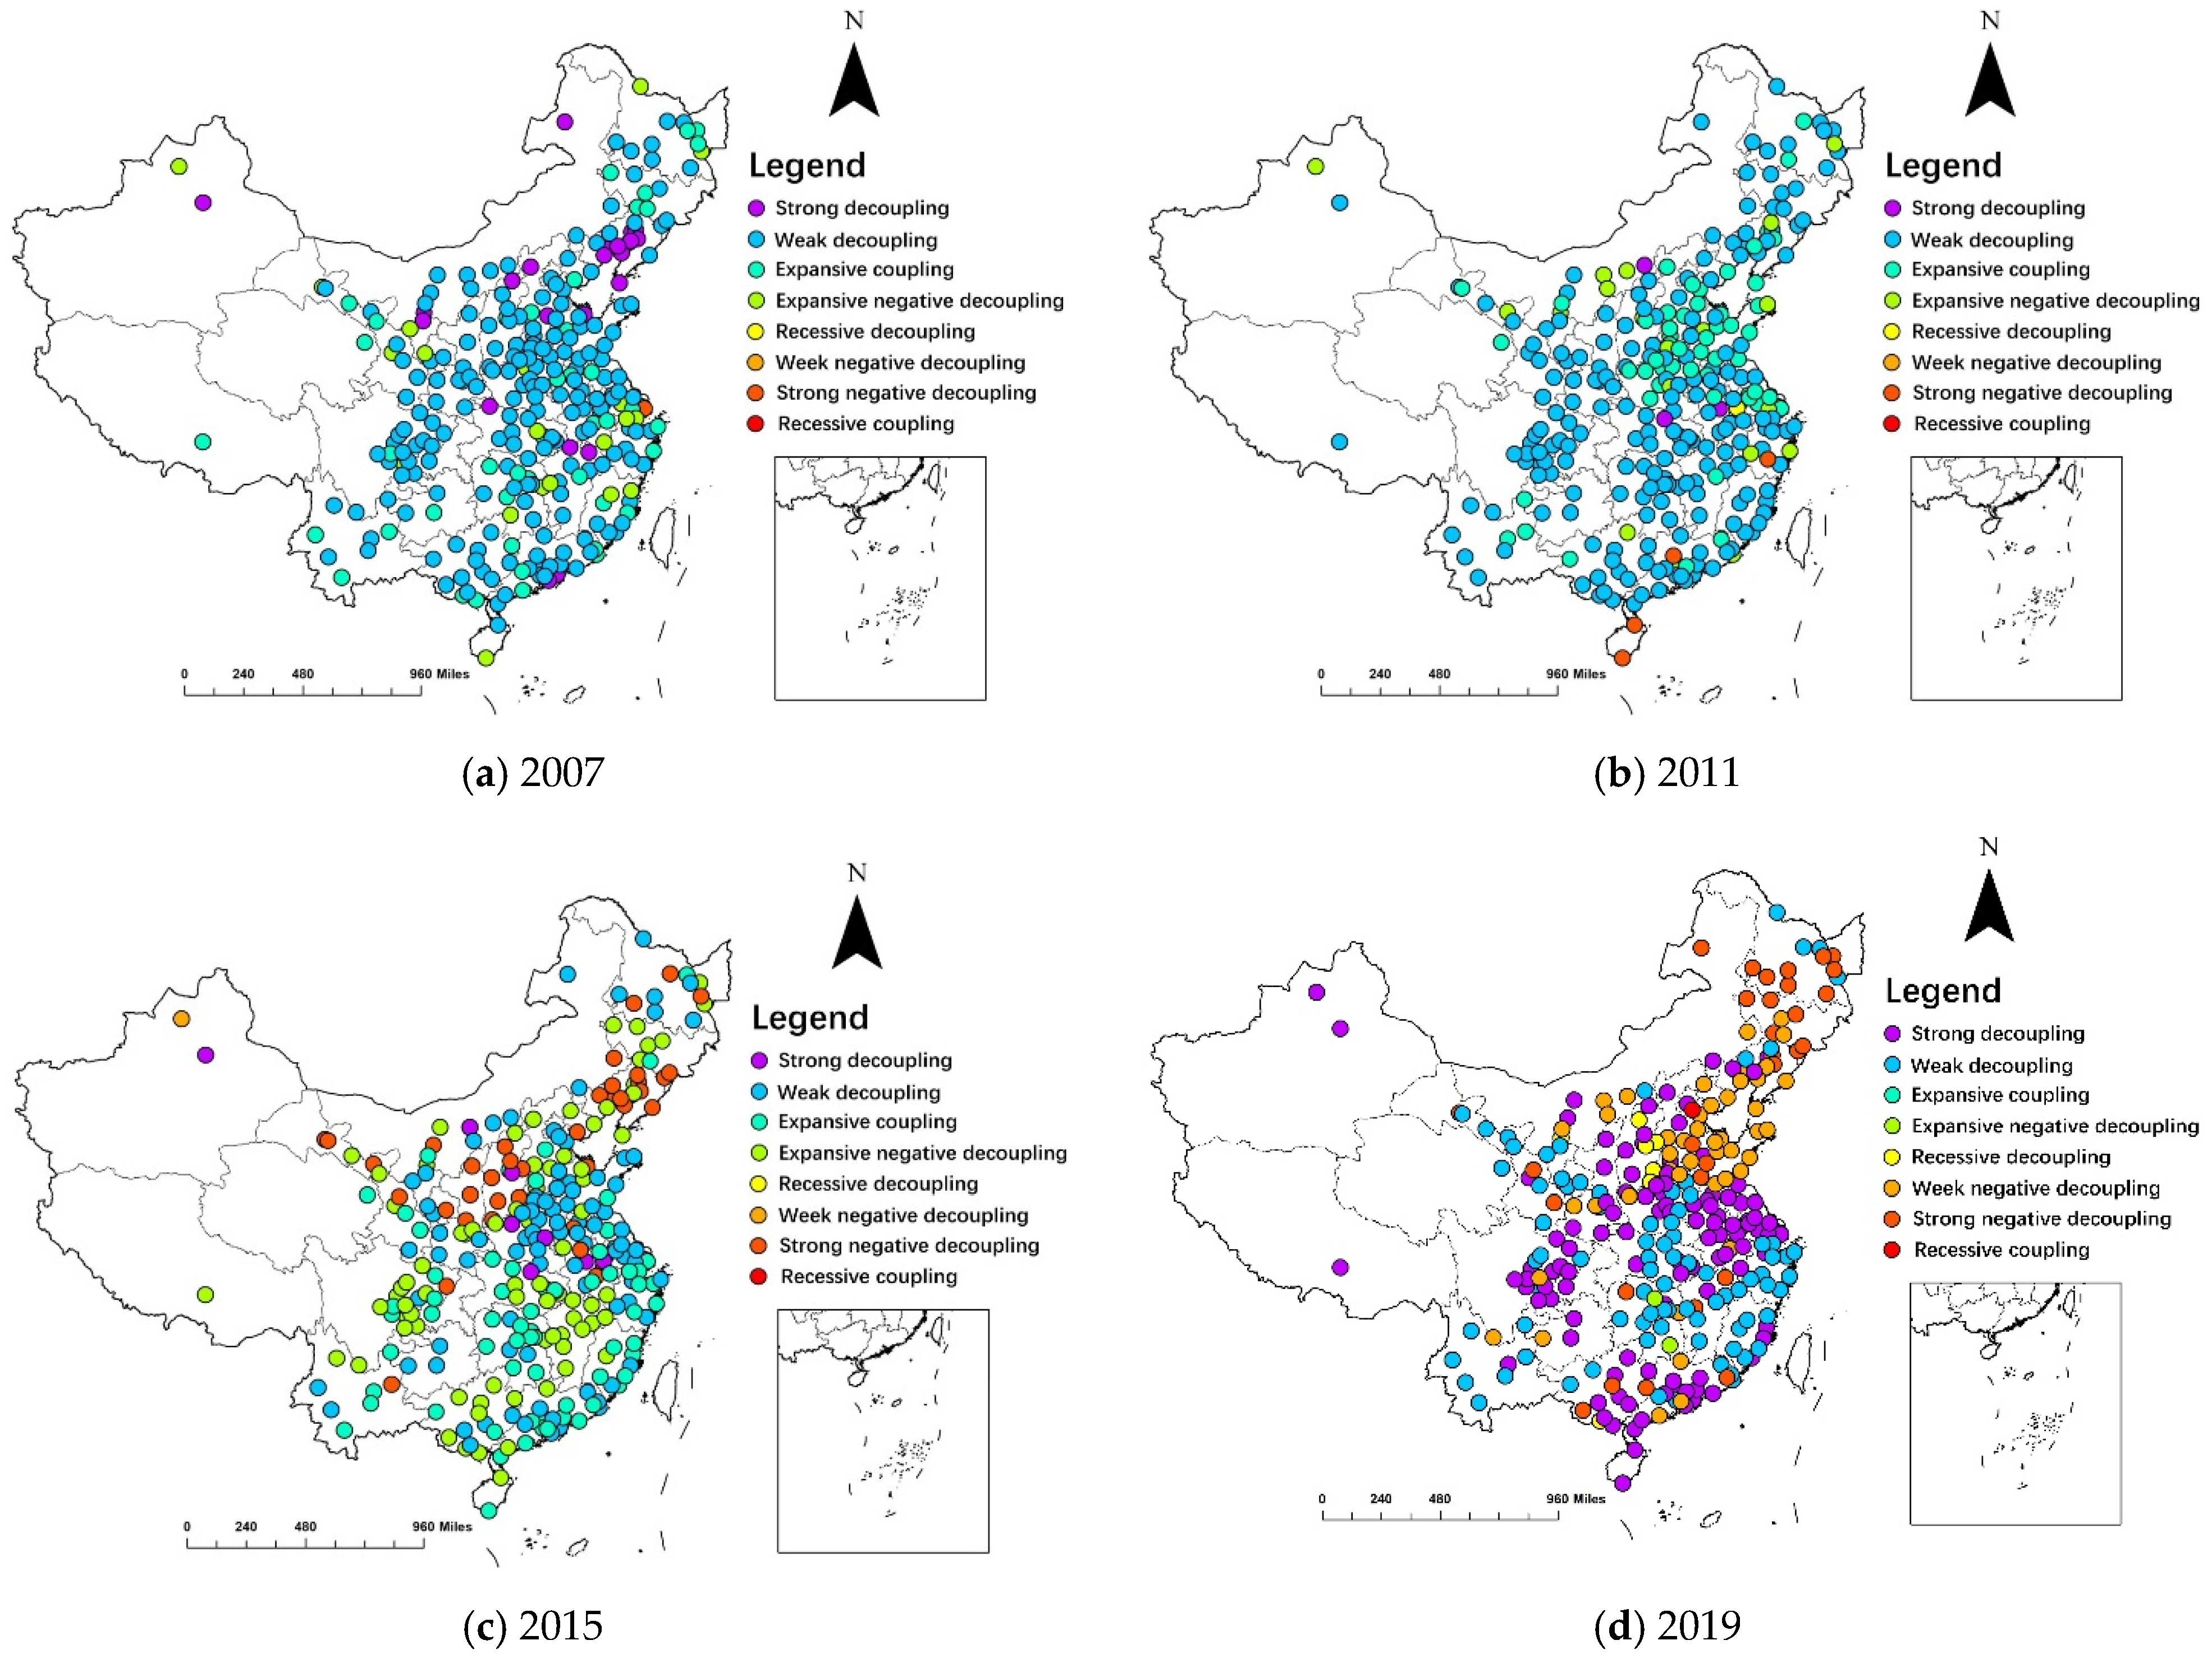
4.1.2. Decoupling State Analysis in Spatial Dimension
4.2. Quantitative Decoupling State Analysis
5. Conclusions and Policy Recommendations
Author Contributions
Funding
Institutional Review Board Statement
Informed Consent Statement
Data Availability Statement
Conflicts of Interest
References
- Song, Y.; Zhang, M.; Shan, C. Research on the decoupling trend and mitigation potential of CO2 emissions from China’s transport sector. Energy 2019, 183, 837–843. [Google Scholar] [CrossRef]
- Wang, Q.; Su, M. Drivers of decoupling economic growth from carbon emission–an empirical analysis of 192 countries using decoupling model and decomposition method. Environ. Impact Assess. Rev. 2020, 81, 106356. [Google Scholar] [CrossRef]
- Li, Y.; Du, Q.; Lu, X.; Wu, J.; Han, X. Relationship between the development and CO2 emissions of transport sector in China. Transp. Res. Part D Transp. Environ. 2019, 74, 1–14. [Google Scholar] [CrossRef]
- Wang, Q.; Su, M. The effects of urbanization and industrialization on decoupling economic growth from carbon emission—A case study of China. Sustain. Cities Soc. 2019, 51, 101758. [Google Scholar] [CrossRef]
- Leal, P.A.; Marques, A.C.; Fuinhas, J.A. Decoupling economic growth from GHG emissions: Decomposition analysis by sectoral factors for Australia. Econ. Anal. Policy 2019, 62, 12–26. [Google Scholar] [CrossRef]
- Jiang, J.J.; Ye, B.; Zhou, N.; Zhang, X.L. Decoupling analysis and environmental Kuznets curve modelling of provincial-level CO2 emissions and economic growth in China: A case study. J. Clean. Prod. 2019, 212, 1242–1255. [Google Scholar] [CrossRef]
- Yu, Y.; Zhou, L.; Zhou, W.; Ren, H.T.; Kharrazi, A.; Ma, T.J.; Zhu, B. Decoupling environmental pressure from economic growth on city level: The Case Study of Chongqing in China. Ecol. Indic. 2017, 75, 27–35. [Google Scholar] [CrossRef]
- Liu, Y.; Feng, C. Decouple transport CO2 emissions from China’s economic expansion: A temporal-spatial analysis. Transp. Res. Part D Transp. Environ. 2020, 79, 102225. [Google Scholar] [CrossRef]
- Alshehry, A.S.; Belloumi, M. Study of the environmental Kuznets curve for transport carbon dioxide emissions in Saudi Arabia. Renew. Sustain. Energy Rev. 2017, 75, 1339–1347. [Google Scholar] [CrossRef]
- Kharbach, M.; Chfadi, T. CO2 emissions in Moroccan road transport sector: Divisia, Cointegration, and EKC analyses. Sustain. Cities Soc. 2017, 35, 396–401. [Google Scholar] [CrossRef]
- Amin, A.; Altinoz, B.; Dogan, E. Analyzing the determinants of carbon emissions from transportation in European countries: The role of renewable energy and urbanization. Clean Technol. Environ. Policy 2020, 22, 1725–1734. [Google Scholar] [CrossRef]
- Guo, M.; Chen, S.; Zhang, J.; Meng, J. Environment Kuznets curve in transport sector’s carbon emission: Evidence from China. J. Clean. Prod. 2022, 371, 133504. [Google Scholar] [CrossRef]
- Huang, S.; Xiao, X.; Guo, H. A novel method for carbon emission forecasting based on EKC hypothesis and nonlinear multivariate grey model: Evidence from transportation sector. Environ. Sci. Pollut. Res. 2022, 29, 60687–60711. [Google Scholar] [CrossRef] [PubMed]
- Jiang, X.; Su, M.; Li, R. Investigating the factors influencing the decoupling of transport-related carbon emissions from turnover volume in China. Sustainability 2018, 10, 3034. [Google Scholar] [CrossRef]
- Zhang, S.; Li, Y.; Liu, Z.; Kou, X.; Zheng, W. Towards a decoupling between economic expansion and carbon dioxide emissions of the transport sector in the Yellow River Basin. Sustainability 2023, 15, 4152. [Google Scholar] [CrossRef]
- Foster, V.; Dim, J.U.; Vollmer, S.; Zhang, F. Understanding the challenge of decoupling transport-related CO2 emissions from economic growth in developing countries. World Dev. Sustain. 2023, 3, 100111. [Google Scholar] [CrossRef]
- Chen, F.; Zhao, T.; Liao, Z. The impact of technology-environmental innovation on CO2 emissions in China’s transportation sector. Environ. Sci. Pollut. Res. 2020, 27, 29485–29501. [Google Scholar] [CrossRef] [PubMed]
- Zhu, F.; Wu, X.; Gao, Y. Decomposition analysis of decoupling freight transport from economic growth in China. Transp. Res. Part D Transp. Environ. 2020, 78, 102201. [Google Scholar] [CrossRef]
- Loo, B.P.Y.; Banister, D. Decoupling transport from economic growth: Extending the debate to include environmental and social externalities. J. Transp. Geogr. 2016, 57, 134–144. [Google Scholar] [CrossRef]
- Wang, Q.; Zhao, M.; Li, R. Decoupling sectoral economic output from carbon emissions on city level: A comparative study of Beijing and Shanghai, China. J. Clean. Prod. 2019, 209, 126–133. [Google Scholar] [CrossRef]
- Wang, Z.; Kim, M.K. Decoupling of CO2 emissions and income in the US: A new look from EKC. Clim. Chang. 2024, 177, 52. [Google Scholar] [CrossRef]
- Tapio, P. Towards a theory of decoupling: Degrees of decoupling in the EU and the case of road traffic in Finland between 1970 and 2001. Transp. Policy 2005, 12, 137–151. [Google Scholar] [CrossRef]
- Cai, J.; Ma, S.; Ji, H.M.; Jiang, W.Y.; Bai, Z.R. Spatial–temporal characteristics and decoupling effects of China’s transportation CO2 emissions. Environ. Sci. Pollut. Res. 2023, 30, 32614–32627. [Google Scholar] [CrossRef] [PubMed]
- Wu, Y.; Tam, V.W.Y.; Chen, Y.S.; Shen, L.Y.; Zhang, Y.; Liao, S.J. Decoupling China’s economic growth from carbon emissions: Empirical studies from 30 Chinese provinces (2001–2015). Sci. Total Environ. 2019, 656, 576–588. [Google Scholar] [CrossRef]
- Lantz, V.; Feng, Q. Assessing income, population, and technology impacts on CO2 emissions in Canada: Where’s the EKC? Ecol. Econ. 2006, 57, 229–238. [Google Scholar] [CrossRef]
- Dogan, E.; Turkekul, B. CO2 emissions, real output, energy consumption, trade, urbanization and financial development: Testing the EKC hypothesis for the USA. Environ. Sci. Pollut. Res. 2016, 23, 1203–1213. [Google Scholar] [CrossRef] [PubMed]
- Vehmas, J.; Malaska, P.; Luukkanen, J.; Kaivo-oja, J.; Hietanen, O.; Vinnari, M.; Ilvonen, J. Europe in the Global Battle of Sustainability: Rebound Strikes Back?—Advanced Sustainability Analysis; Series Discussion and Working Papers 7: 2003; Turku School of Economics and Business Administration: Turku, Finland, 2003. [Google Scholar]
- Wang, X.; Wei, Y.; Shao, Q. Decomposing the decoupling of CO2 emissions and economic growth in China’s iron and steel industry. Resour. Conserv. Recycl. 2020, 152, 104509. [Google Scholar] [CrossRef]
- Chen, J.; Wang, P.; Cui, L.; Huang, S.; Song, M. Decomposition and decoupling analysis of CO2 emissions in OECD. Appl. Energy 2018, 231, 937–950. [Google Scholar] [CrossRef]
- Hossain, M.A.; Chen, S. The decoupling study of agricultural energy-driven CO2 emissions from agricultural sector development. Int. J. Environ. Sci. Technol. 2022, 19, 4509–4524. [Google Scholar] [CrossRef]
- Panayotou, T. Empirical Tests and Policy Analysis of Environmental Degradation at Different Stages of Economic Development; Working Paper, No. Wp238; Technology and Employment Programme; International Labor Office: Geneva, Switzerland, 1993. [Google Scholar]
- Grossman, G.M.; Krueger, A.B. Economic growth and the environment. Q. J. Econ. 1995, 110, 353–377. [Google Scholar] [CrossRef]
- Din, A.U.; Ming, J.; Vega-Muñoz, A.; Salazar Sepúlveda, G.; Contreras-Barraza, N. Population density: An underlying mechanism between road transportation and environmental quality. Front. Environ. Sci. 2022, 10, 940911. [Google Scholar] [CrossRef]
- Wang, S.; Liu, X.; Zhou, C.; Hu, J.; Ou, J. Examining the impacts of socioeconomic factors, urban form, and transportation networks on CO2 emissions in China’s megacities. Appl. Energy 2017, 185, 189–200. [Google Scholar] [CrossRef]
- Aljoufie, M.; Zuidgeest, M.; Brussel, M.; Van Maarseveen, M. Spatial–temporal analysis of urban growth and transportation in Jeddah City, Saudi Arabia. Cities 2013, 31, 57–68. [Google Scholar] [CrossRef]
- Sun, H.; Li, M.; Xue, Y. Examining the factors influencing transport sector CO2 emissions and their efficiency in central China. Sustainability 2019, 11, 4712. [Google Scholar] [CrossRef]
- Pesaran, M.H. General diagnostic tests for cross section dependence in panels. CESifo Working Paper No. 1229. Economics 2004, 1240, 1. [Google Scholar]
- Pesaran, M.H. Testing weak cross-sectional dependence in large panels. Econom. Rev. 2015, 34, 1089–1117. [Google Scholar] [CrossRef]
- Phillips, P.C.B.; Sul, D. Dynamic panel estimation and homogeneity testing under cross section dependence. Econom. J. 2003, 6, 217–259. [Google Scholar] [CrossRef]
- Pesaran, M.H. A simple panel unit root test in the presence of cross-section dependence. J. Appl. Econom. 2007, 22, 265–312. [Google Scholar] [CrossRef]
- Kao, C. Spurious regression and residual-based tests for cointegration in panel data. J. Econom. 1999, 90, 1–44. [Google Scholar] [CrossRef]
- Pedroni, P. Critical values for cointegration tests in heterogeneous panels with multiple regressors. Oxf. Bull. Econ. Stat. 1999, 61, 653–670. [Google Scholar] [CrossRef]
- Pedroni, P. Panel cointegration: Asymptotic and finite sample properties of pooled time series tests with an application to the PPP hypothesis. Econ. Theory 2004, 20, 597–625. [Google Scholar] [CrossRef]
- Westerlund, J. New simple tests for panel cointegration. Econom. Rev. 2005, 24, 297–316. [Google Scholar] [CrossRef]
- Hoechle, D.; Ruenzi, S.; Schaub, N.; Schmid, M. The impact of financial advice on trade performance and behavioral biases. Rev. Financ. 2017, 21, 871–910. [Google Scholar] [CrossRef]
- Pablo-Romero, M.P.; Sánchez-Braza, A.; Gil-Pérez, J. Is deforestation needed for growth? Testing the EKC hypothesis for Latin America. For. Policy Econ. 2023, 148, 102915. [Google Scholar] [CrossRef]
- Frodyma, K.; Papież, M.; Śmiech, S. Revisiting the environmental Kuznets curve in the European Union countries. Energy 2022, 241, 122899. [Google Scholar] [CrossRef]
- Din, A.U.; Ming, J.; Rahman, I.U.; Han, H.; Yoo, S.; Alhrahsheh, R.R. Green road transportation management and environmental sustainability: The impact of population density. Heliyon 2023, 9, e19771. [Google Scholar] [CrossRef]


| Decoupling Stage | ||||
|---|---|---|---|---|
| Negative decoupling | Expansion negative decoupling | ≥1.2 | + | + |
| Weak negative decoupling | (0, 0.8) | − | − | |
| Strong negative decoupling | (−∞, 0) | + | − | |
| Decoupling | Strong decoupling | (−∞, 0) | − | + |
| Weak decoupling | (0, 0.8) | + | + | |
| Recessive decoupling | ≥1.2 | − | − | |
| Coupling | Expansion coupling | (0.8, 1.2) | + | + |
| Recessive coupling | (0.8, 1.2) | + | + | |
| Weak Decoupling | Expansion Coupling | Expansion Negative Decoupling | Strong Decoupling | |
|---|---|---|---|---|
| China | 273 | 2 | 3 | 6 |
| Eastern China | 99 | 0 | 0 | 1 |
| Middle China | 94 | 2 | 2 | 2 |
| Western China | 80 | 0 | 1 | 3 |
| Weak Decoupling | Expansion Coupling | Expansion Negative Decoupling | Strong Decoupling | |
|---|---|---|---|---|
| China | 259 | 3 | 3 | 19 |
| Eastern China | 91 | 0 | 0 | 9 |
| Middle China | 91 | 3 | 2 | 4 |
| Western China | 77 | 0 | 1 | 6 |
| CD-Test | p-Value | Mean | Mean Abs () | |
|---|---|---|---|---|
| LNCE | 673.3090 | 0.0000 | 0.8700 | 0.8800 |
| LNPCE | 598.4370 | 0.0000 | 0.7700 | 0.8000 |
| LNGDP | 738.7990 | 0.0000 | 0.9500 | 0.9500 |
| LNGDP2 | 737.0730 | 0.0000 | 0.9500 | 0.9500 |
| LNPGDP | 725.8420 | 0.0000 | 0.9300 | 0.9400 |
| LNPGDP2 | 578.1600 | 0.0000 | 0.7400 | 0.8200 |
| LNPDN | 487.2650 | 0.0000 | 0.6300 | 0.6900 |
| LNRDN | 495.3950 | 0.0000 | 0.6400 | 0.6900 |
| LNPTE | 264.7170 | 0.0000 | 0.3400 | 0.4500 |
| LNPRC | 700.4590 | 0.0000 | 0.9000 | 0.9300 |
| Level | First Difference | |||
|---|---|---|---|---|
| Constant | Constant and Trend | Constant | Constant and Trend | |
| LNCE | −3.0750 *** | −2.9030 *** | −3.1360 *** | −3.0970 *** |
| LNPCE | −2.7690 *** | −2.7390 *** | −2.9920 *** | −2.9020 *** |
| LNGDP | −1.9610 *** | −2.6250 *** | −2.6990 *** | −2.9720 *** |
| LNGDP2 | −1.9100 *** | −2.5860 *** | −2.6680 *** | −2.8100 *** |
| LNPGDP | −1.7910 | −2.2420 | −2.3150 *** | −2.5400 *** |
| LNPGDP2 | −1.5800 | −1.7080 | −2.8790 *** | −3.3050 *** |
| LNPDN | −2.1940 *** | −2.4130 *** | −2.5470 *** | −2.7890 *** |
| LNRDN | −1.7740 | −1.9990 | −2.1960 *** | −2.3510 * |
| LNPTE | −2.3960 *** | −2.6180 *** | −2.7860 *** | −2.5980 *** |
| LNPRC | −2.4820 *** | −2.5340 *** | −2.9270 *** | −2.6890 *** |
| Test | Model (1) | Model (2) | |
|---|---|---|---|
| Statistic | Statistic | ||
| Kao (1999) [41] | Modified Dickey–Fuller t | −11.0674 *** | −8.4141 *** |
| Dickey–Fuller t | −22.9048 *** | −18.9287 *** | |
| Augmented Dickey–Fuller t | −13.1649 *** | −11.0119 *** | |
| Unadjusted modified Dickey–Fuller t | −13.7588 *** | −13.9590 *** | |
| Pedroni (1999, 2004) [42,43] | Unadjusted Dickey–Fuller t | −23.9335 *** | −21.3800 *** |
| Modified Phillips–Perron t | 25.5316 *** | 25.6745 *** | |
| Phillips–Perron t | −34.0027 *** | −33.1854 *** | |
| Augmented Dickey–Fuller t | −32.0745 *** | −30.7439 *** | |
| Westerlund (2005) [44] | Variance ratio | 6.8264 *** | 7.3494 *** |
| LNCE [Model (1)] | LNPCE [Model (2)] | |||
|---|---|---|---|---|
| (1) | (2) | (3) | (4) | |
| DKOLS RE | DKOLS FE | DKOLS RE | DKOLS FE | |
| LNGDP | 0.2860 ** | 0.4088 *** | ||
| (0.1156) | (0.0785) | |||
| LNGDP2 | 0.0340 *** | −0.0174 *** | ||
| (0.0077) | (0.0062) | |||
| LNPGDP | 0.2791 *** | 0.3187 *** | ||
| (0.0305) | (0.0240) | |||
| LNPGDP2 | −0.0181 *** | −0.0508 *** | ||
| (0.0052) | (0.0047) | |||
| LNPDN | −0.2593 *** | 0.0366 ** | 0.0172 | 0.0597 *** |
| (0.0314) | (0.0175) | (0.0158) | (0.0125) | |
| LNRDN | 0.0371 | 0.0181 *** | 0.1353 *** | 0.0376 *** |
| (0.0246) | (0.0050) | (0.0171) | (0.0071) | |
| LNPTE | −0.0273 *** | −0.0153 *** | −0.0421 *** | −0.0015 |
| (0.0094) | (0.0045) | (0.0082) | (0.0056) | |
| LNPRC | 0.1942 *** | 0.0700 *** | 0.3315 *** | 0.0774 *** |
| (0.0170) | (0.0114) | (0.0137) | (0.0151) | |
| Constant | 11.1977 *** | 12.4322 *** | 9.4025 *** | 8.4023 *** |
| (0.3173) | (0.2112) | (0.0677) | (0.0702) | |
| F test | 5383.4500 *** | 64.4400 *** | 2469.4300 *** | 157.1200 *** |
| Hausman test | 27.3600 *** | 3335.1500 *** | ||
| R-squared | 0.7693 | 0.8429 | 0.6686 | 0.7979 |
| Observations | 4260 | 4260 | 4260 | 4260 |
Disclaimer/Publisher’s Note: The statements, opinions and data contained in all publications are solely those of the individual author(s) and contributor(s) and not of MDPI and/or the editor(s). MDPI and/or the editor(s) disclaim responsibility for any injury to people or property resulting from any ideas, methods, instructions or products referred to in the content. |
© 2024 by the authors. Licensee MDPI, Basel, Switzerland. This article is an open access article distributed under the terms and conditions of the Creative Commons Attribution (CC BY) license (https://creativecommons.org/licenses/by/4.0/).
Share and Cite
Zhao, P.; Zhao, J.; Yang, Q.; Zhang, S.; Tian, B. Analysis of the Decoupling between Urban Economic Development and Transportation Carbon Emissions in China: Empirical Evidence from 284 Cities. Sustainability 2024, 16, 6809. https://doi.org/10.3390/su16166809
Zhao P, Zhao J, Yang Q, Zhang S, Tian B. Analysis of the Decoupling between Urban Economic Development and Transportation Carbon Emissions in China: Empirical Evidence from 284 Cities. Sustainability. 2024; 16(16):6809. https://doi.org/10.3390/su16166809
Chicago/Turabian StyleZhao, Peng, Jiannan Zhao, Qi Yang, Shuai Zhang, and Beisi Tian. 2024. "Analysis of the Decoupling between Urban Economic Development and Transportation Carbon Emissions in China: Empirical Evidence from 284 Cities" Sustainability 16, no. 16: 6809. https://doi.org/10.3390/su16166809
APA StyleZhao, P., Zhao, J., Yang, Q., Zhang, S., & Tian, B. (2024). Analysis of the Decoupling between Urban Economic Development and Transportation Carbon Emissions in China: Empirical Evidence from 284 Cities. Sustainability, 16(16), 6809. https://doi.org/10.3390/su16166809