Article

Urbanization and Cultural Industry Correlation: An Empirical Analysis from China

by
Wen Zhang
1,
Rong Zhang
2 and
Yuntao Zou
2,3,*
1
School of Design and Art, Communication University of Zhejiang, Hangzhou 310018, China
2
Future Front Interdisciplinary Research Institute, Huazhong University of Science and Technology, Wuhan 430074, China
3
School of Computer of Science and Technology, Huazhong University of Science and Technology, Wuhan 430074, China
*
Author to whom correspondence should be addressed.
Sustainability 2024, 16(16), 6807; https://doi.org/10.3390/su16166807
Submission received: 23 May 2024 / Revised: 21 July 2024 / Accepted: 6 August 2024 / Published: 8 August 2024

Abstract

:
The cultural industry has been recognized as an indispensable component of sustainable economic development. Urbanization often represents a country’s level of economic development. While China is advancing its new urbanization strategy, it is also vigorously promoting cultural revitalization plans. This study employs a global Data Envelopment Analysis (DEA) model and Tobit regression analysis to examine the correlation between China’s cultural industry and urbanization. The results indicate that although the overall economic efficiency of China’s cultural industry is continuously improving, the returns to scale in many provinces are declining. Changes brought about by new urbanization, such as increases in per capita GDP, per capita income, and enterprise scale, have significant positive impacts on the cultural industry. However, the rising urban population ratio has a significant negative impact on the cultural industry. This study suggests that the current new urbanization in China faces issues of oversimplification and excessive advancement. It recommends adjusting relevant policies to allow sufficient time and space for the cultural industry to absorb the benefits brought by urbanization. Given China’s specific national conditions, the conclusions of this study may not necessarily apply to other regions. However, the global DEA-Tobit combination method used in this study aligns more closely with reality and achieves a higher degree of fit, thus possessing a certain level of universality.

1. Introduction

1.1. A New Dimension of Sustainable Development: The Cultural Industry

Sustainable development traditionally considers three core dimensions: environmental, social, and economic. Recently, there has been increasing advocacy for including “culture” as a fourth dimension, particularly in discussions about globalization and multiculturalism. Brocchi and others [1] argue that the cultural dimension is crucial for discussing sustainability and key to addressing the crises of globalization. Duxbury et al. [2] suggest four roles that cultural policies can play in sustainability: first, the preservation and maintenance of cultural customs and rights; second, the operation and impact of green cultural organizations and industries; third, enhancing public awareness of sustainable development and climate change and encouraging action; and fourth, fostering ecological citizens. Research by Nurse [3] posits culture as the fourth pillar of sustainability with the cultural industry being a focal point. Klein and colleagues [4] found in their study of the Baltic economy that cultural creativity not only drives but also propels human sustainable development, enabling individuals to take responsibility for their development and promoting innovation and creativity, driving inclusive as well as sustainable development.
As a convergence of cultural and economic dimensions, the cultural industry is often regarded as a crucial part of a sustainable, green economy. Its reliance on creativity, knowledge, and skills—rather than traditional natural resources or large-scale material production—offers several characteristics:
-
Low Carbon Emission: Compared to heavy industry and other material-intensive industries, the cultural industry generally has a lower carbon footprint, as activities such as design, programming, writing, music production, and filmmaking do not produce significant carbon emissions.
-
Non-Reliance on Finite Resources: Unlike mining or agriculture, the cultural industry does not directly depend on finite natural resources. Although the production of CDs, books, or film equipment may require material resources, the core value lies in creative content not the physical medium.
-
Promotion of Sustainable Development Concepts: The cultural industry, particularly the media and entertainment sectors, has a substantial influence and can convey messages about environmental protection and sustainable development to the public.
-
Driving Innovation: The cultural industry encourages innovative thinking and creative approaches that can be applied to broader fields, including green technologies and sustainable solutions.
-
Promoting a Circular Economy: Cultural products such as digital content, music, films, and books can be consumed repeatedly without depleting resources or generating waste.
-
Providing Green Jobs: The cultural industry offers many employment opportunities, which are generally more environmentally friendly and sustainable compared to traditional “blue-collar” jobs.
In summary, the cultural industry is characterized by high added value, low energy consumption, and low pollution. It boasts strong innovation, integration, and plasticity, aligning well with the principles of sustainable development. As a quintessential green and low-carbon economy, the high-quality development of the cultural industry not only aligns with humanity’s pursuit of a better life, catering to the growing demand for diversified and personalized services, but it also effectively promotes consumption, stimulates domestic demand, and drives industrial chain upgrades, fostering continuous and healthy economic growth.
Many scholars and government officials in China believe that the proportion of value added by the cultural industry in GDP is an important indicator of a country’s modernization level. For instance, Professor Liu Yuanchun, Vice President of Renmin University of China, mentioned in a speech [5] that although by the end of 2020, China’s GDP had reached 71% of the United States’ GDP, based on 2017 data, the cultural industry accounted for approximately 17% of GDP in the United States, 20% in Japan, and over 13% on average in the European Union. In all developed countries, without exception, the cultural industry’s share of GDP exceeds 13%. However, until 2019, China’s cultural and related industries only accounted for 4.5% of its GDP. Therefore, China must transition from being a consumer of cultural industry to a producer, becoming a global production center for the cultural industry, which is the true path to modernization.

1.2. A Focus of Modern Development: Urbanization

Urbanization refers to the process of population movement from rural to urban areas, which is accompanied by profound changes in economic, social, cultural, and environmental aspects. This process involves not only changes in population distribution but also the expansion of urban functions, growth in urban spaces, proliferation of urban lifestyles, and development and evolution of urban culture. Urbanization is a vital component of modernization, where the continuous congregation of populations in urban areas represents an inevitable historical phase in the industrialization processes of countries worldwide. Currently, over 50% of the world’s population lives in urban areas, highlighting the significant impact of urbanization on improving a nation’s or region’s economic development level, social organizational structure, and quality of resident life.
Key features of urbanization include the following:
-
Population Migration: The most direct manifestation of urbanization is the migration of rural populations to cities, leading to increased urban populations and urban area expansion.
-
Economic Structure Transformation: As urbanization progresses, the economic structure shifts from agriculture-dominated to industry and service-dominated, with cities becoming crucial engines of economic growth.
-
Social Structure Changes: During urbanization, social structures become more complex with more refined social divisions of labor and a growing middle class and intellectual community.
-
Lifestyle Changes: Urbanization brings about modernized lifestyles with urban residents adopting different patterns of consumption, leisure, and social activities.
-
Urban Space Expansion: Urbanization is accompanied by the enlargement of urban areas, including the expansion of city boundaries and construction of urban infrastructure.
-
Environmental and Sustainable Development Issues: Urbanization intensifies environmental pressures, such as air pollution, water scarcity, and waste management challenges, making sustainable development a critical issue in urbanization processes.
In summary, the level of urbanization is also considered an important indicator of modernization by many scholars. Banks and Carr’s study [6] provides evidence supporting the hypothesis that there is a threshold relationship between urbanization and components of modernization with historically higher urbanized societies reaching this threshold earlier. Rössel et al. [7] argue that modernization broadly encompasses a range of processes, including industrialization, urbanization, bureaucratization, expanded educational opportunities, increased literacy rates, and even democratization. Marsh [8] also highlights that the core processes of modernization are industrialization and urbanization. Research by Li et al. on China [9] indicates that the combined effects of any three developments among new urbanization, industrialization, informatization, and agricultural modernization are causally related to the fourth development, with new urbanization being at the core of the interactive model of the new and old kinetic energy conversion, serving as the main driver of the other three modernization processes.
However, the urbanization process is often accompanied by various differing viewpoints. Henderson’s study [10] suggests that a certain degree of urban concentration may initially be desirable to reduce infrastructure expenditures both within and between regions, but excessive concentration can lead to increased costs due to factors such as traffic accidents, health costs from exposure to high levels of air and water pollution, and the time wasted on long commutes. Ravallion et al. [11] found that between 1993 and 2002, the number of rural people living on “one dollar a day” decreased by 150 million, whereas in urban areas, it increased by 50 million, with urban poverty issues being most severe in Latin America, while urbanization in Africa did not lead to a reduction in the overall poverty rate. Humbal et al. [12] expressed concerns that uncontrolled urbanization has had many irreversible impacts on the global biosphere, including environmental degradation, land insecurity, slum growth, water and sanitation issues, and increased air pollution

1.3. Research Objectives

Overall, the cultural industry and urbanization complement and promote each other in many ways. First, the process of urbanization provides the material foundation and social demand for the development of the cultural industry. The population density and diverse demands brought by urbanization offer a broad market for the consumption of cultural products and services. Second, the cultural industry is also a focus during urbanization processes, with the cultural industry’s output as a significant portion of regional economic output becoming an important measure of urbanization in many areas. The products and services provided by the cultural industry contribute to changes in urban residents’ lifestyles, leisure activities, and social interactions. The media and creative industries lie within the cultural sector.
Despite extensive research on the cultural industry and urbanization, a comprehensive search across the internet reveals that studies combining both urbanization and cultural industry as keywords have been scarce since 2020, even in countries like China that are simultaneously advancing urbanization and revitalizing the cultural industry. The available research is typically limited to specific regions, such as Shanghai [13], or specific components of the cultural industry, such as the cultural and creative industries or tourism [14]. This study aims to address this gap by examining the correlation between urbanization policies and the overall cultural industry at the national level, providing more comprehensive and macro-level policy recommendations. China, actively promoting both the development of the cultural industry and new urbanization, serves as an ideal case for studying the impact of urbanization on the cultural industry.
The objective of this study is to investigate the impact of urbanization on the cultural industry. Over the past decade, the Chinese government has been vigorously promoting urbanization while simultaneously elevating the cultural industry to a significant position. The effects of these dual policies are likely to be complex and subtle. It is generally believed that urbanization should have a significant positive impact on the economy, including the cultural industry; however, unreasonable urbanization processes may result in counterexamples. Thus, this study uses China as a case study, employing empirical analysis to explore the relationship between urbanization and the cultural industry in China. Based on the findings, the paper proposes targeted constructive suggestions, aiming to contribute to the development of future urbanization and cultural industry policies.

2. Literature Review

2.1. Research on the Cultural Industry

The cultural industry is recognized as a crucial driver of economic growth, fostering creativity and innovation, which in turn can stimulate sustainable development across other sectors like technology and manufacturing. Research by Vila et al. [15] illustrates the close link between sustainable development and the EU’s cultural policies, highlighting the intersection of culture within eight of the United Nations’ seventeen Sustainable Development Goals. D’Orville et al. [16] argue that creativity, a special renewable resource and human talent, is central to sustainability. The cultural industry, pivotal in fostering and enhancing creativity, represents the most modern phase of economic development. Cultural and creative industries generate and distribute cultural goods, services, or activities, conveying ideas, symbols, and lifestyles. The increasing focus on knowledge, culture, and creativity aligns with the rise of knowledge societies and is crucial for understanding rapid urban transformations.
China places significant emphasis on the development of its cultural Industry. On 22 July 2009, China’s first specialized cultural industry plan, the “Cultural Industry Revitalization Plan”, was approved in a State Council executive meeting [17], marking the cultural industry as a strategic national sector. This plan highlights the cultural industry as an essential part of the national economy and a key industry for enhancing national soft power and cultural influence. It supports the cultural industry financially, encourages financial institutions to provide loans and credit services to cultural enterprises, and offers subsidies or tax relief for certain projects. It also promotes the integration of the cultural industry with other sectors like technology and education to foster cross-sector innovation.
In 2017, China issued the “13th Five-Year Plan for Cultural Development” [18], emphasizing the cultural industry’s critical role and advocating for a modern cultural industry system that encourages innovation and internationalization of cultural products and services. The more recent “14th Five-Year Plan for Cultural Development” in 2022 places even greater emphasis on cultural development within the national agenda, highlighting the importance of promoting Chinese culture globally and opposing cultural hegemony.
Moreover, in 2018, China’s Ministry of Culture and the National Tourism Administration merged to form the Ministry of Culture and Tourism, managing the vast cultural and tourism industries under one umbrella. This ministry categorizes the cultural industry into three main sectors:
  • Cultural Services Industry: This primarily includes sectors such as photography, entertainment services, sports, education, arts, publishing, library services, public cultural services, cultural heritage services, cultural brokerage and agency services, broadcasting, film, television, and other cultural services not classified under the aforementioned categories.
  • Cultural Manufacturing Industry: Comprises companies involved in manufacturing musical instruments, amusement devices, entertainment goods, toys, cultural products, printing, and other cultural manufacturing activities.
  • Cultural Wholesale and Retail Industry: Involves the sale and trade of cultural products, including art dealing, cultural assets management, audiovisual products, and gift sales.
It is important to note that these three categories are delineated based on different business activities and are statistically separated to avoid any overlap. If a company is involved in both the manufacturing of cultural-related products and the wholesale or provision of services, it will be classified under one of the three categories based on its primary business activity, preventing any duplication in statistical reporting.
As previously mentioned, some Chinese scholars and government institutions have already recognized the significant importance of the cultural industry for China’s modernization. Further research by scholars has substantiated this understanding. Studies like those by Shan [19] show that as Western countries increasingly view cultural development as a new source of economic growth, China is also expanding its cultural industry, which is becoming more integrated with technology—creating new industries, establishing investment and financing systems, and increasing cultural exports and trade. Vlassis’s study [20] on Chinese film production and the market indicates that China’s cultural industry is gaining global competitiveness. Ju et al. [21] suggest that it is necessary to encourage, support, and guide social capital to invest more in the cultural sector based on a Data Envelopment Analysis (DEA) efficiency measurement of China’s cultural manufacturing industry.

2.2. Research on Urbanization

Urbanization profoundly influences the modernization of human society as it is not only a significant driver of economic development but also involves transformations in social, cultural, and environmental domains. Initially, urbanization promotes industrial agglomeration, which drives the development of industrialization and the service sector. This economic agglomeration not only enhances production efficiency but also fosters technological innovation and optimizes economic structures. Research by Williamson [22] demonstrates that urbanization effectively mitigates issues arising from population migration with higher urban activity rates correlating with higher per capita incomes. Henderson [23] views urbanization as a spatial transformation of the economy, where populations migrate from an agricultural and rural livelihood to production within endogenously large and scaled cities, concentrating significant economic activities geographically within urban areas. Data studies by Ritchie and Roser [24] indicate that as of 2007, over half of the world’s population resides in urban areas, with per capita income positively correlated with the proportion of urbanized population, accelerating urbanization through job transition and industrial structure upgrades.
Furthermore, urbanization brings about social changes and improvements in quality of life, significantly altering lifestyles and social structures. Cities offer more employment opportunities, better educational resources, and medical facilities, greatly enhancing the quality of life and social welfare of residents. Additional data research by Ritchie and Roser [24] shows higher electrification rates, improved sanitation facilities, better access to clean drinking water, more availability of clean fuel for cooking and heating, and lower rates of child malnutrition in urban areas compared to rural areas. Research by Phillips [25] suggests that despite the rise in communicable diseases and chronic illnesses in some urban environments, the advent of modern healthcare is making urban populations healthier compared to rural ones with higher levels of urbanization equating to better health conditions.
Urbanization is an exceedingly complex process, and its impacts on industrial economics and human welfare require careful policy adjustments. Sovani (1964) has expressed concerns about “over-urbanization”, suggesting that mass rural migration into cities could lead to concurrent urban misery and rural destitution. Research by Smart and Smart [26] indicates that the role of urbanization under late capitalism and globalization has significantly shifted due to new transport, communication, and organizational technologies, aiding in addressing issues within the urbanization process. Seto et al. [27] argue that under a sustainable development framework, contemporary characteristics of urbanization, along with urban planning, governance, agglomeration, and global forces, play distinct roles in driving and shaping the relationships between urbanization and the environment compared to traditional urbanization patterns.
China’s new urbanization primarily emerged after 2000 with exploratory phases lasting until before 2012. In 2014, the Chinese government issued the “National New Urbanization Plan (2014–2020)” [28], which formally advocated for urbanization as a “natural historical process where non-agricultural industries agglomerate in urban areas and rural populations concentrate in towns”, marking it as a crucial indicator of national modernization. The new urbanization, characterized by integrated urban–rural planning, industry–city interaction, eco-friendliness, and harmonious development, emphasizes the coordinated growth of large, medium, and small cities, towns, and new rural communities, directly linking to cultural industry features like eco-friendly living, industry–city interaction, and harmonious development.
In 2019, China issued the “Key Tasks for New Urbanization Construction in 2019” [29], which explicitly called for “promoting high-quality development by accelerating the implementation of a new urbanization strategy centered around human-centered urbanization, quality-focused development, fostering modern metropolitan areas, advancing precise management of large cities, supporting the orderly development of characteristic towns, and accelerating the integrated development of urban and rural areas”.
However, as previously mentioned, many scholars have expressed concerns about urbanization. Even in China, which is vigorously promoting urbanization, numerous studies have presented various opinions on China’s urbanization process. Chan et al. [30] conducted a study on China’s urbanization policy, describing the previous urbanization as “incomplete urbanization”. Tan et al. [31] provided a comprehensive review of China’s rapid urbanization, discussing the sustainability of the urbanization process from the perspective of sustainable development. Li et al. [32] expressed concerns that the urbanization process might affect the simultaneous implementation of the rural revitalization strategy, suggesting that both should be mutually adaptive. Chaolin et al. [33] pointed out issues in China’s urbanization research, such as a vague understanding of the urbanization concept, lack of basic statistics, focus on practical phenomenon studies over theoretical exploration, and emphasis on regional aspects. Guan et al. [34] indicated that China’s traditional urbanization process is becoming increasingly unsustainable, and there is an urgent need to accelerate the transition process. They advocate for a new type of people-centered urbanization that is intensive, efficient, integrated, harmonious, and sustainable. These studies form the basis of this study’s empirical analysis of the impact of urbanization on the cultural industry. Although Ying and Wu [35] argue that urbanization is an inevitable trend for China’s development, they still highlight significant issues such as the widening urban–rural income gap and the disconnection between urban and rural socio-economic systems during the urbanization process, which require serious attention.

3. Materials and Methods

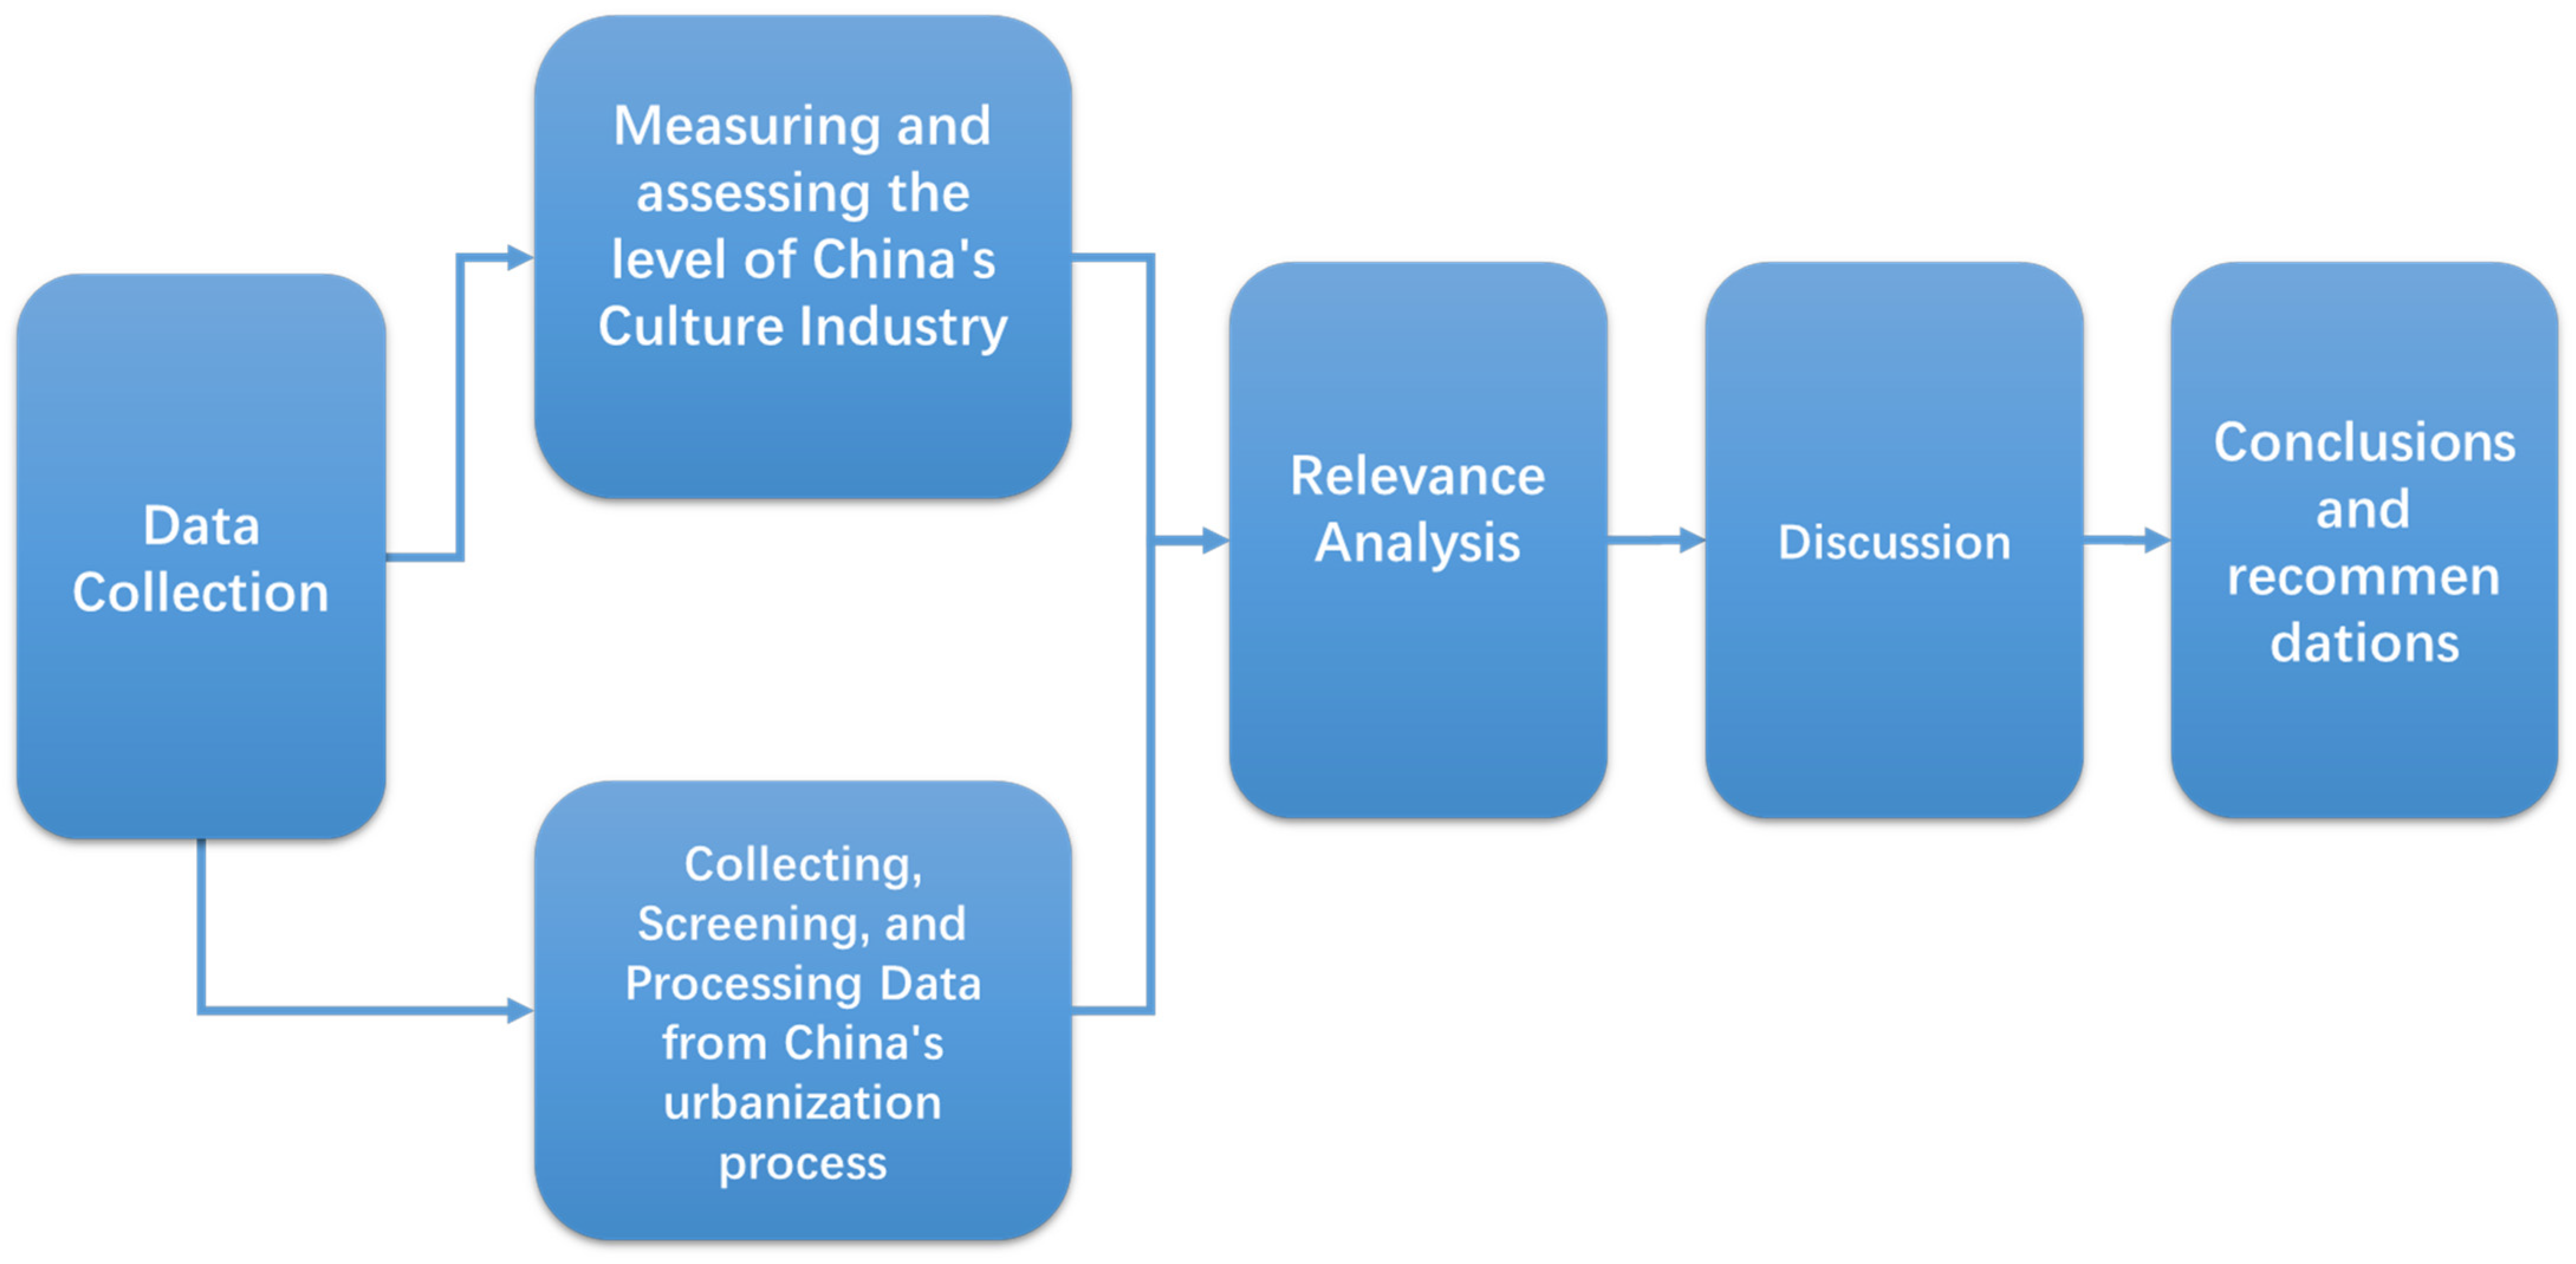
3.1. Research Procedure

To address the research objectives, the following research procedure is proposed in this study, as illustrated in Figure 1:
-
Measure and evaluate the Chinese cultural industry and conduct research analysis.
-
Collect, select, and analyze relevant data representing China’s new urbanization.
-
Investigate the correlation between the two.
-
Discuss and draw conclusions and recommendations.

3.2. Methods

This study evaluates and assesses the cultural industry in China by measuring the efficiency of the cultural industry across 31 provinces and municipalities. For the cultural industry, higher efficiency signifies more output with fewer resource inputs, indicating more advanced technological levels, more efficient management, more rationalized resource allocation, lower carbon emissions and pollutant discharges, and better sustainability. Efficiency measurement can effectively eliminate heterogeneity among provinces and municipalities, enabling comparisons between different regions. The efficiency measurement method employed in this study is Data Envelopment Analysis (DEA).
Efficiency evaluation is widely used in economic assessments. Schmookler et al. [36] used efficiency to evaluate the U.S. economy. Mundaca et al. [37] employed efficiency evaluations in their study of energy economics. Bukarica and Tomšić [38] used efficiency evaluations to study energy policy and sustainability levels. In the field of agricultural economics, Paul et al. [39] conducted efficiency evaluations to study U.S. farms and agricultural economies of scale. Reza Anik et al. [40] reflected on the changes in agricultural productivity worldwide over five years through efficiency studies.
DEA was first proposed by Charnes, Cooper, and Rhodes in 1978 [41]. The core idea is to construct a convex polygon called the Envelope Surface to evaluate the efficiency of Decision-Making Units (DMUs), which are objects with the same set of input and output variables to be evaluated. This convex polygon fully encloses all DMUs. DMUs located on the Envelope Surface are considered DEA efficient with an efficiency score of 1, while the efficiency scores of other DMUs are determined based on their distances to the Envelope Surface, indicating their relative efficiency. Due to its non-parametric nature and the absence of weight-setting requirements, DEA has gained increasing attention and has been applied in various fields and industries.
The foundational DEA models include the CCR model (named after A. Charnes, W. W. Cooper, and E. Rhodes) [41], which assumes constant returns to scale (CRSs) and is also known as Technical Efficiency (TE). In 1984, the BCC model (named after RD Banker, A Charnes, and WW Cooper) [42] was introduced, allowing for variable returns to scale (VRSs). The Pure Technical Efficiency (PTE) calculated by the BCC model can be viewed as the efficiency score derived from the TE component after separating the Scale Efficiency (SE) component. Therefore, TE can be regarded as the product of PTE and SE, providing significant interpretative flexibility for the model.
However, both the CCR and BCC models only consider radial improvements without accounting for variable slacks, resulting in Envelope Surfaces that are convex polygons and may not be optimized. In reality, more optimized Envelope Surfaces may exist, which could be non-convex and non-smooth. Hence, in 2001, Tone et al. proposed the slacks-based measure (SBM) model [43], which introduces “slack variables” to measure the degree of slackness of each DMU on each input–output variable, aiming to construct more optimized Envelope Surfaces without input or output orientation constraints. The SBM model exhibits advantages in handling practical problems and offers decomposed efficiency scores into pure technical efficiency and scale efficiency, as well as providing slack values for each variable, enhancing interpretative potential and gaining widespread application.
Ohsato and Takahashi applied the DEA-SBM model to measure the management efficiency of banks in Japan and further extended it to the Network SBM model [44]. Cecchini et al. evaluated the green production efficiency of Italian dairy farms using the SBM model with undesirable outputs [45]. Shang et al. also employed the SBM model with undesirable outputs to assess the green efficiency of energy in China [46]. In the cultural industry domain, Su et al. utilized the SBM model to evaluate the cultural and tourism industries in China [47]. Similarly, Gao et al. applied the SBM model to study the tourism efficiency of Chinese provinces [48].
In this study, the SBM model was adopted to measure the economic efficiency of China’s cultural industry. The SBM model has two orientations: input-oriented and output-oriented. Given the research objective of analyzing the impact of urbanization on China’s cultural industry, with a focus on the effects of input changes in the urbanization process on the cultural industry, the input-oriented SBM model was selected. The formula of the model is as follows:
In the input-oriented Slacks-Based Measure (SBM) model [49], the objective is to minimize slack variables or equivalently maximize efficiency subject to constraints on inputs and outputs. To assess the relative efficiency of D M U o = ( x o , y o ) , the following linear programming formulation can be solved. This process is repeated n times for o = ( 1 , , n ) .
[SBM-I-C] (Input-oriented SBM under constant returns to scale assumption) Formally, the input-oriented SBM model can be articulated as the following linear programming problem:
Objective Function:
ρ i * = m i n λ , s , s +   1 1 m i = 1 m s i x i o
Subject to:
x i o = j = 1 n x i j λ j + s i   ( i = 1 , , m )
y r o = j = 1 n y r j λ j s r +   ( r = 1 , , s )
λ j 0 j ,   s i 0 i ,   s r + 0 ( r )
  ρ i * : The minimized value of the objective function, representing the efficiency score.
λ j : Weight variables used for the linear combination of DMUs.
s i : Input slack variables, indicating the excess amount of inputs.
s r + : Output slack variables, indicating the shortfall amount of outputs.
x i o : Actual value of the i -th input variable.
x i j : Value of the i -th input variable for the j -th DMU.
y r o : Actual value of the r -th output variable.
y r j : Value of the r -th output variable for the r -th DMU.
m : Number of input variables.
n : Number of DMUs.
s : Number of output variables.
Standard SBM models, built on cross-sectional data from a single period, produce relative efficiency scores that are incomparable across different periods due to distinct reference sets and envelopment surfaces used at each time point. This discrepancy prevents a direct comparison of a DMU’s efficiency scores over time, making SBM models unsuitable for analyzing trends and changes. Many studies incorrectly use SBM scores from different periods as dependent variables in regression analyses with other time-series independent variables, failing to reflect real-world dynamics accurately.
The DEA research commonly incorporates the Malmquist index to depict efficiency changes over time. However, the Malmquist index often encounters feasibility issues. In 1989, Golany and Roll introduced the Global DEA model [50], treating DMUs from all periods as a single reference set, thus considering different periods of the same DMU as distinct units. This approach allows for a direct comparison of efficiency scores across periods, facilitating trend analysis and making regression analyses more reasonable while avoiding some of the issues associated with the Malmquist index. Streimikis et al. [51] used the Global DEA model to assess energy efficiency in EU agriculture, while Zhao et al. [52] employed a global frontier SBM super-efficiency model to study the impact of China’s environmental regulations on green economic growth. Ben Lahouel et al. [53] further applied the Global Malmquist index to address feasibility issues in studying inclusive green growth among OECD countries.
This study adopts the Global SBM model for evaluating the economic efficiency of China’s cultural industry and explores the correlation between urbanization and cultural industry dynamics. Correlation studies typically use regression analysis with the cultural industry’s efficiency scores as dependent variables and concurrent urbanization data as independent variables. Given that SBM scores range between 0 and 1, traditional linear regression models, which allow dependent variables to take any real value, can lead to significant estimation errors when dealing with truncated data. Hence, this study opts for the Tobit regression model proposed by James Tobin in 1958 [54], which is better suited for handling truncated data.
Tobit regression is based on a latent linear model with an error term to account for truncated or censored observations. By employing the maximum likelihood estimation method, Tobit regression effectively manages truncated or censored dependent variables, enhancing the accuracy of model parameter estimates and allowing for a more comprehensive utilization of incomplete data. The Tobit model formula is as follows:
First, define a latent variable y * , representing the true but unobserved value of the observed variable y . It is postulated that y * adheres to a linear regression model as follows:
y * = x β + ε
y * is a continuous latent variable, x represents a matrix of independent variables, β denotes the regression coefficients, and ε is the error term. Now, the observed variable y is defined as follows:
y = m a x ( 0 ,   y * )
This equation implies that if   y * ≤ 0, the observed value of y is 0; otherwise, it is equal to   y * . Subsequently, to account for the truncation effect, we introduce a truncation variable c . If   y * is less than the truncation point c , the observed value of y is c ; otherwise, it is equal to   y * . Hence, it can be represented as
y = m a x ( c ,   y * )
In this study, the DEA model was constructed using the DEARUN software version 3.2.0.2 Trail edition, while the Tobit model was built using the SPSSAU24.0 online analysis software. Both software tools feature user-friendly graphical interfaces with full-menu options and incorporate commonly used models. Users are not required to input code manually. The output results are presented clearly and standardized, and they are accompanied by explanatory notes and analytical suggestions.

3.3. Materials

This study is based on panel data of China’s cultural industry across 31 provinces and autonomous regions from 2018 to 2021. Among China’s 34 provincial-level administrative units, three—Taiwan, Hong Kong, and Macau—were excluded due to significant discrepancies in political systems, statistical data collection, and policy implementation, which could skew comparative analyses within the mainland context.
This study selects panel data from 2018 to 2021 for several reasons. Firstly, as mentioned earlier, in 2018, the former Ministry of Culture and the National Tourism Administration of China were officially merged into the Ministry of Culture and Tourism, resulting in changes in management and statistical methods. Secondly, before 2018, the city of Horgos in Xinjiang offered significant tax incentives for cultural and technology enterprises, leading to an abnormal concentration of cultural enterprises. In 2017 alone, 14,472 new market entities were registered with a total registered capital of 201.5 billion yuan [55]. This situation was halted at the beginning of 2018, and many enterprises began to leave Horgos, as noted by Wang et al. [56]. Such abnormal data would severely impact the construction of models related to the cultural industry.
Therefore, this study selects panel data starting from 2018, comprising a total of 122 samples from 31 provinces over four years, to represent the outcomes of the relevant policies on China’s cultural industry and urbanization during this period. Data sources included the China Statistical Yearbook, China Cultural Industry Statistical Yearbook, and China Taxation Statistical Yearbook.

4. Results

4.1. Construction of a Global SBM Model for Assessing the Economic Efficiency of China’s Cultural Industry, 2018–2021

For the sake of data integrity, we selected “Number of Enterprises at Year-end”, “Total assets at Year-end”, and “Engaged Persons at Year-end” as input variables with “Total Revenue” as the output variable. We refrained from including additional variables due to the potential presence of multicollinearity among them. Moreover, excessive variables could introduce more statistical noise, impacting the accuracy of the model. The input–output variables of the model are presented in Table 1.
This study utilized DEARUN software to construct an input-oriented global SBM model to measure the economic efficiency of the cultural industry across 31 provinces and municipalities in China from 2018 to 2021. The summarized results are presented in Table 2.
-
“Mean value of TE” represents the average efficiency score under the assumption of constant returns to scale for the 31 provinces and municipalities.
-
“Mean value of PTE” represents the average efficiency score under the assumption of variable returns to scale for the 31 provinces and municipalities.
-
“Mean value of SE” represents the average scale efficiency score for the 31 provinces and municipalities.
-
“Number of CRS” indicates the number of provinces and municipalities with constant returns to scale.
-
“Number of IRS” indicates the number of provinces and municipalities with increasing returns to scale.
-
“Number of DRS” indicates the number of provinces and municipalities with decreasing returns to scale.

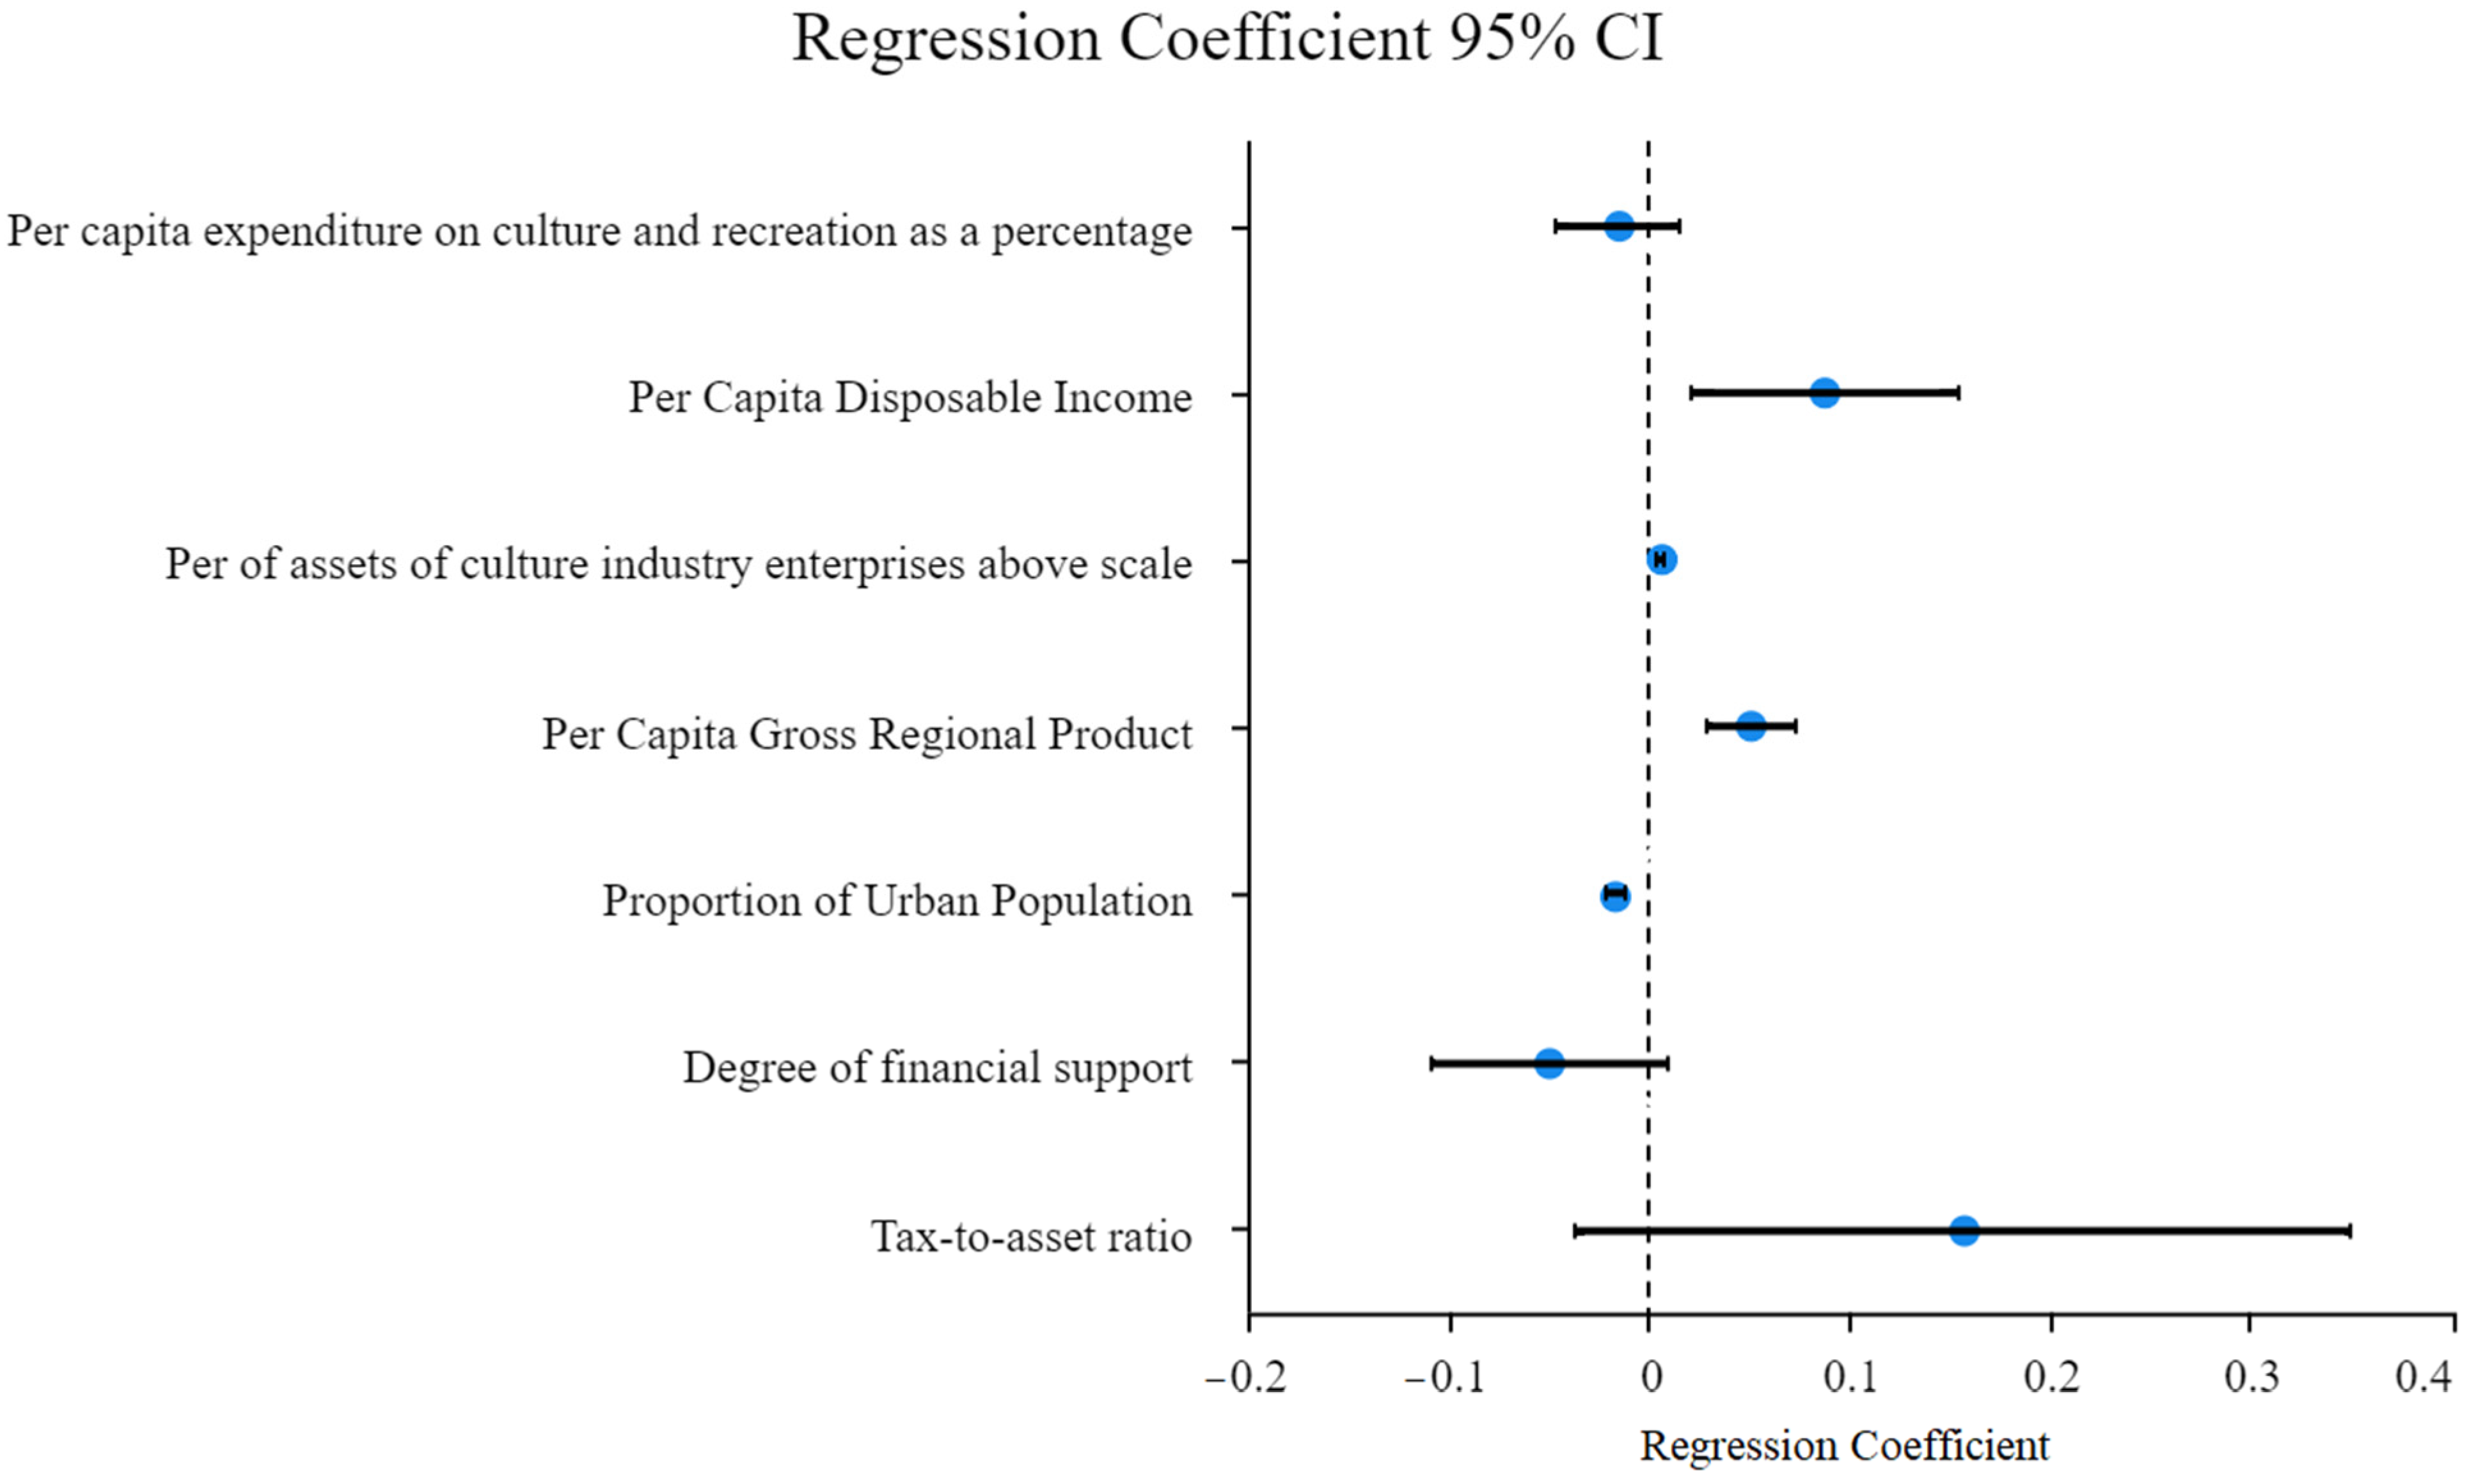
4.2. Construction of a Tobit Regression Model for China’s Cultural Industry Economic Efficiency

This study examines the variables used to evaluate the degree of urbanization, which vary across studies without a consensus. Given the research objective to analyze the impact of urbanization on the cultural industry, six independent variables were selected:
-
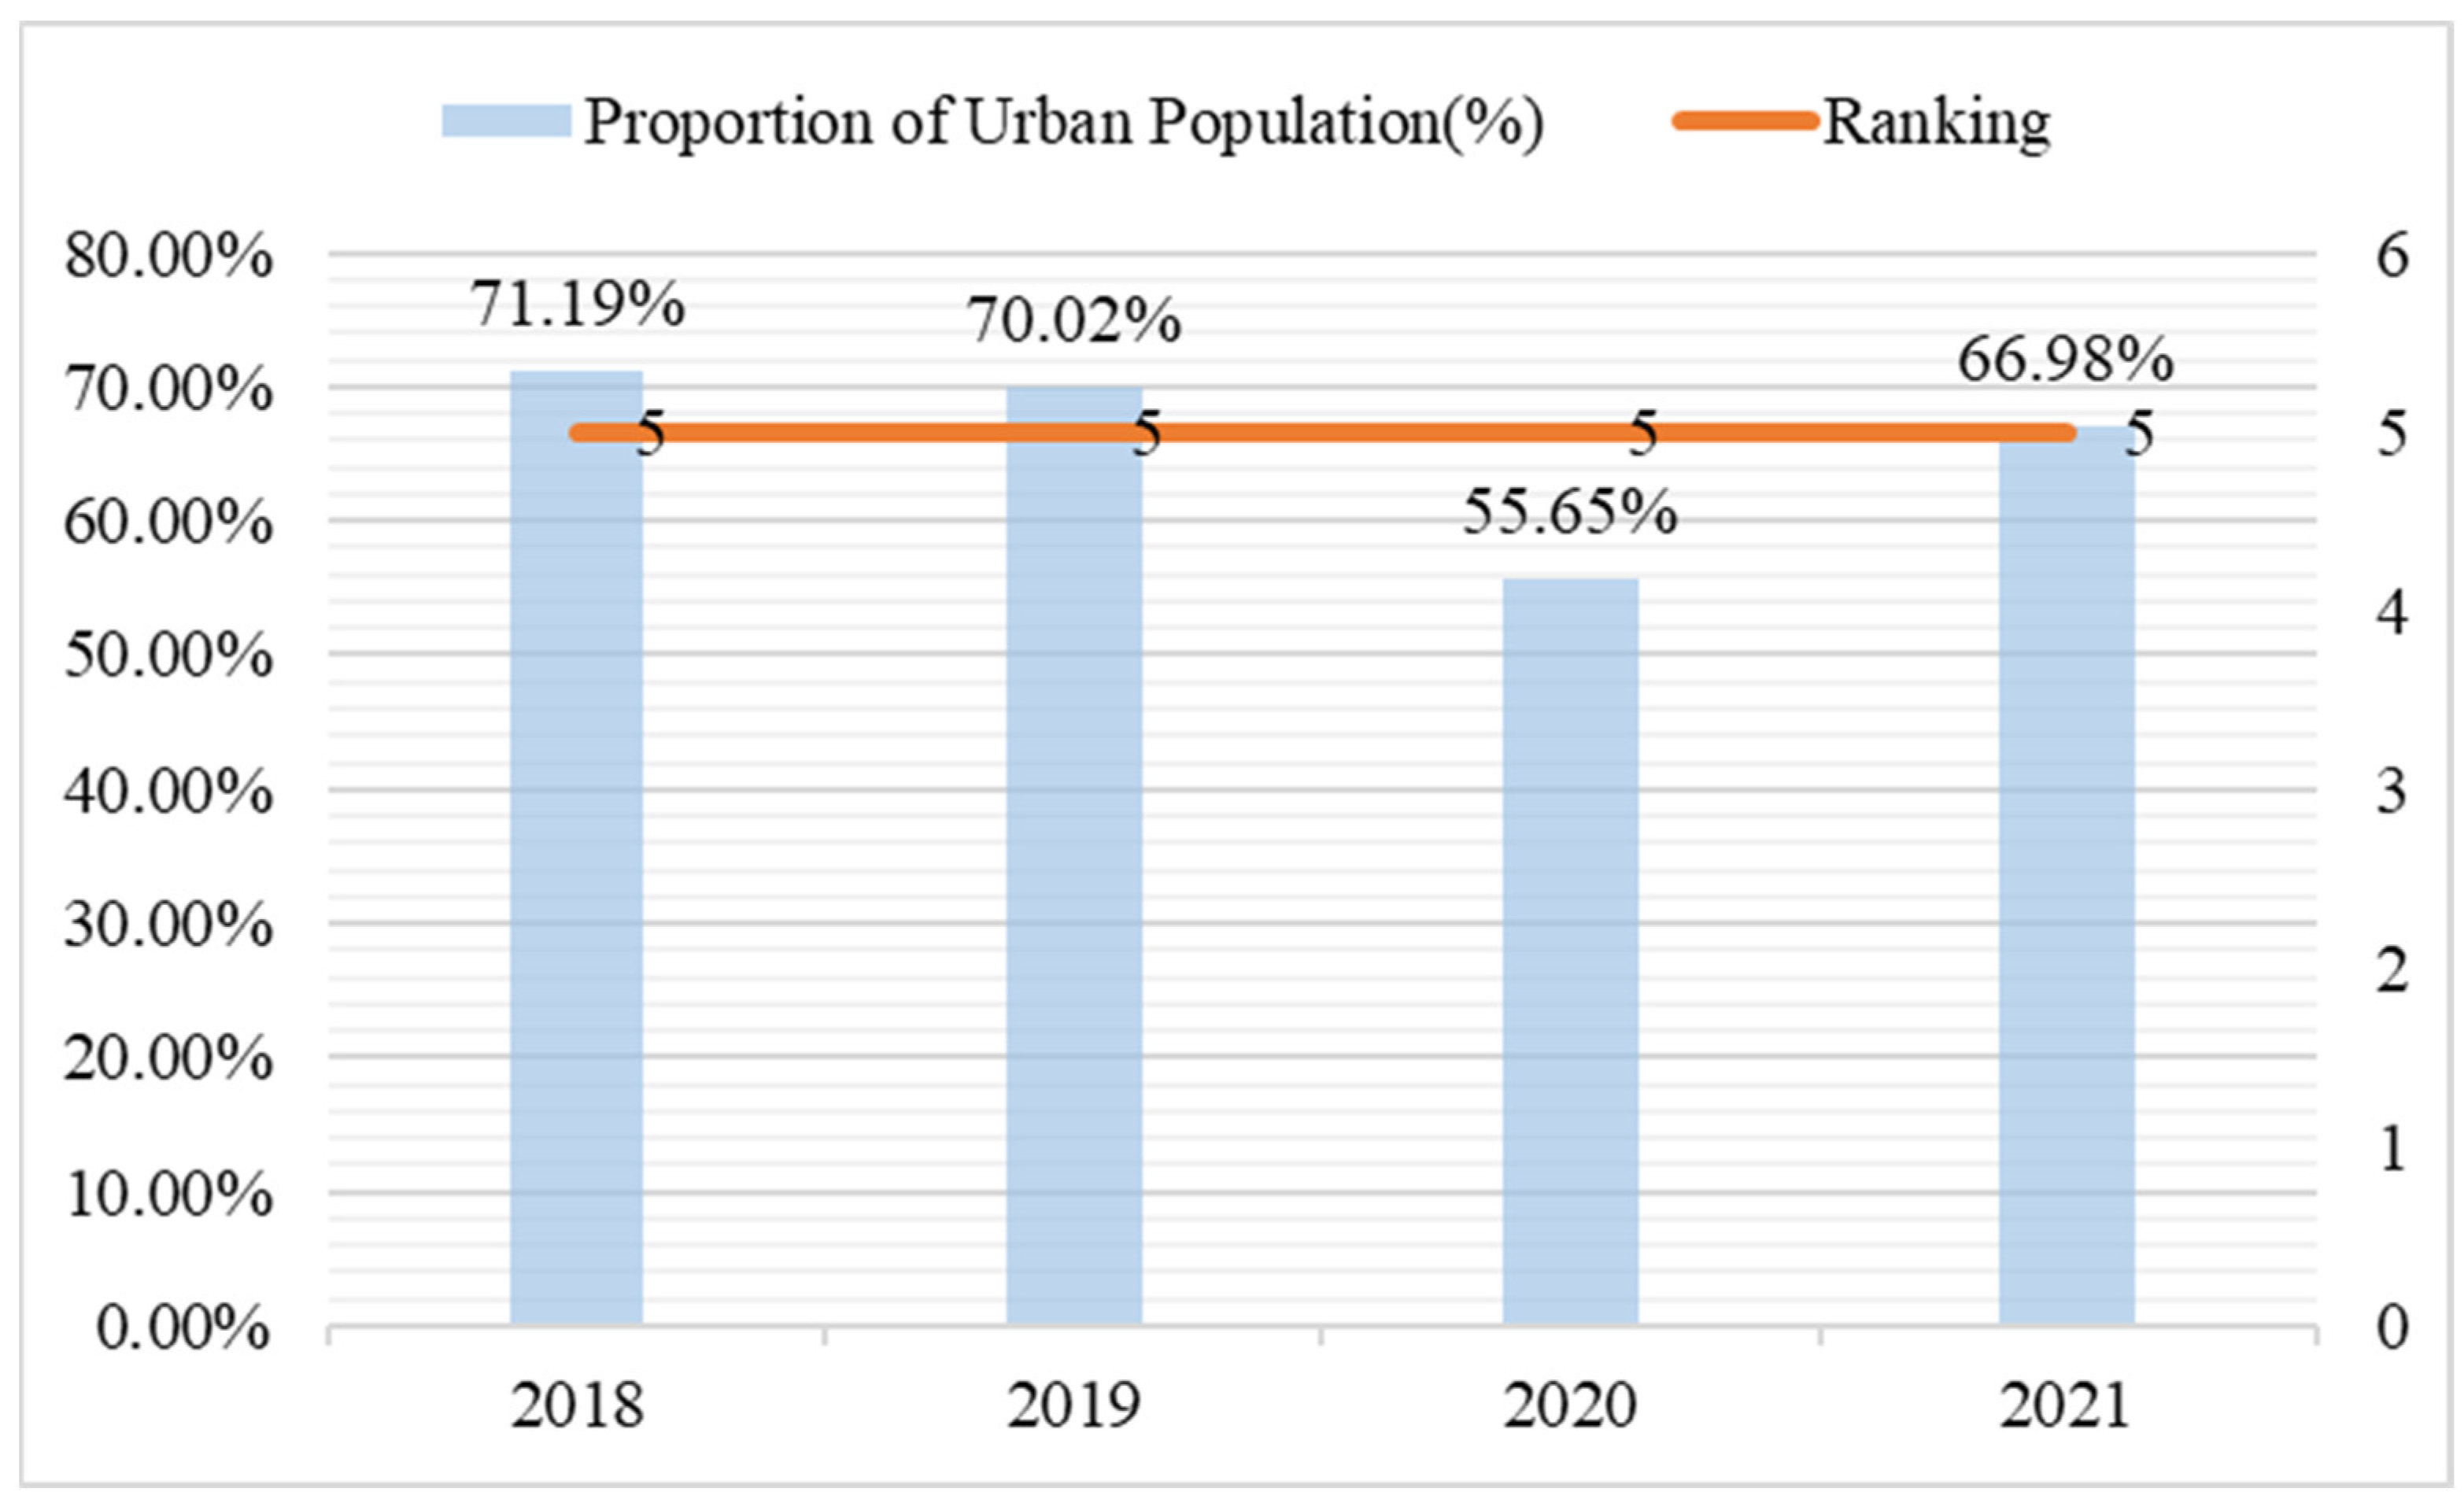
Proportion of urban population (%): This variable is generally considered the most representative of urbanization levels in various provinces and cities with data sourced from the China Statistical Yearbook.
-
Percentage of assets of cultural industry enterprises above scale (%): This represents the degree of scale of cultural industry-related enterprises in each province and city. Typically, provinces and cities with higher degrees of urbanization have a higher proportion of total assets represented by large-scale enterprises. This is calculated as the total assets of large-scale cultural and related industry enterprises divided by the total assets of all cultural industry enterprises in the province or city. Large-scale enterprises are defined as industrial enterprises with an annual main business income of 20,000,000 yuan or more, wholesale enterprises with an annual main business income of 20,000,000 yuan or more, retail enterprises with an annual main business income of 5,000,000 yuan or more, and service enterprises with an annual business income of 10,000,000 yuan or more, with data from the China Cultural Statistics Yearbook.
-
Per capita expenditure on culture and recreation as a percentage (%): This is calculated as the annual per capita expenditure on culture and entertainment as a percentage of total per capita expenditure. Numerous studies indicate that urbanization promotes cultural and recreational spending, which constitutes a higher percentage of total spending [57]. Data are sourced from the China Statistical Yearbook and the China Cultural Statistics Yearbook.
-
Per capita gross regional product (10,000 CNY): This represents the economic level of each province and city. Studies have shown that urbanization contributes to an increase in per capita gross regional product [24,58]. Data are directly sourced from the China Statistical Yearbook.
-
Per capita disposable income (10,000 CNY): This represents the affluence level of each province and city, which is also a positive impact of urbanization. Data are sourced from the China Statistical Yearbook.
-
Tax-to-asset ratio (%): This represents the tax burden of the cultural industry in each province and city, which is calculated as the total cultural industry-related tax revenue divided by the total assets of cultural industry enterprises in the province or city. Data are sourced from the China Statistical Yearbook and the China Tax Statistics Yearbook.
-
Degree of financial support (%): This represents the level of provincial and city government support for the cultural industry, which is calculated as the expenditure for Culture, Sport, and Media divided by the general public budget expenditure of the province or city. Data are sourced directly from the yearbook. Note that these data include expenditures for sports, and since specific data for sports expenditure are unavailable and cannot be separated, using expenditure for Culture, Sport, and Media directly impacts the precision of the Tobit model. However, since the data from all 31 provinces and cities include sports expenditures, it does not significantly impact the conclusions regarding the existence of significant correlations, although it reduces the precision of the Tobit model.
This study employed the SPSSAU software to build a Tobit model, using the TE scores from the global SBM model of the cultural industry across 31 provinces in China from 2018 to 2021 as the dependent variable with truncation limits set at 0 and 1.1. The model incorporated seven independent variables: per capita expenditure on culture and recreation, per capita disposable income, percentage of assets of cultural industry enterprises above scale, per capita gross regional product, proportion of urban population, expenditure for culture, sport, and media, and total tax. The details of the Tobit model samples are presented in Table 3.
The likelihood ratio test results for the Tobit model are presented in Table 4. A model p-value less than 0.05 indicates rejection of the null hypothesis, suggesting that at least one independent variable significantly influences the dependent variable, confirming the model’s validity. The Akaike Information Criterion (AIC), named after the Japanese statistician Hirotugu Akaike [59], is employed to assess the fit and complexity of different models with lower values indicating better model fit. The Bayesian Information Criterion (BIC), proposed by Schwarz [60], is used to prevent overfitting due to excessive model complexity. In this model’s likelihood ratio test, both AIC and BIC values are relatively low, indicating the good relative effectiveness of the model. The results of the Tobit model are presented in Table 5.
The equation for the Tobit model of China’s cultural industry economic efficiency can be expressed as
T E = 0.761   0.017 × P e r   c a p i t a   e x p e n d i t u r e   o n   c u l t u r e   a n d   r e c r e a t i o n   a s   a   p e r c e n t a g e       + 0.086 × P e r   C a p i t a   D i s p o s a b l e   I n c o m e       + 0.004 × P e r   o f   a s s e t s   o f   c u l t u r e   i n d u s t r y   e n t e r p r i s e s   a b o v e   s c a l e       + 0.050 × P e r   C a p i t a   G r o s s   R e g i o n a l   P r o d u c t       0.017 × P r o p o r t i o n   o f   U r b a n   P o p u l a t i o n 0.051 × D e g r e e   o f   f i n a n c i a l   s u p p o r t       + 0.156 × T a x t o a s s e t   r a t i o

5. Discussion

5.1. Positive Trends in the Economic Efficiency of China’s Cultural Industry across 31 Provinces

The global SBM model constructed in Section 4.1 of this study enables cross-regional comparisons. The averages of TE, PTE, and SE for the 31 provinces are summarized and presented in Figure 2. As illustrated in Figure 2, the efficiency of the cultural industry across China’s 31 provinces showed an overall upward trend from 2018 to 2021. Although there was a slight decline between 2019 and 2020—a likely consequence of the COVID-19 pandemic—the efficiency of the cultural industry rebounded in 2020–2021, recovering from the previous year’s drop.
Figure 2 also reveals that the Scale Efficiency (SE) is relatively high across the 31 provinces, while the Pure Technical Efficiency (PTE) is lower. This indicates that the cultural industry in China has achieved a relatively good level in terms of production scale. The primary constraints on enhancing the economic efficiency of the cultural industry lie beyond the scope of scale, potentially including factors such as management quality, technological level, and financing capabilities.

5.2. Analysis of Determinants Affecting the Economic Efficiency of China’s Cultural Industry

The Tobit model from Table 5 can be represented as a forest plot, as depicted in Figure 3.
Among the independent variables, the regression coefficient for “per capita expenditure on culture and recreation as a percentage” is −0.017, with a z-value of −1.053 and a p-value of 0.292, which is greater than 0.05, indicating no significant impact on TE.
“Per capita disposable income” has a regression coefficient of 0.086, with a z-value of 2.534 and a p-value of 0.011, showing a significant positive impact on TE at the 0.05 level. Similarly, “Per capita gross regional product” has a regression coefficient of 0.050, with a z-value of 4.353 and a p-value of less than 0.01, showing a significant positive impact on TE at the 0.01 level. These two variables represent the economic level of each province and the affluence of residents, implying greater consumer demand, higher management levels, better financing environments, and higher workforce quality, all of which positively impact the economic efficiency of the cultural industry. The research by Zeng et al. [61] also confirmed this, showing that the economic level of regions and residents has a significant positive impact on the efficiency of China’s cultural industry. Xie et al. [62] found similar results.
The regression coefficient for “Percentage of assets of cultural industry enterprises above scale” is 0.004, with a z-value of 3.624 and a p-value of less than 0.01, showing a significant positive impact on TE at the 0.01 level. The Chinese government classifies enterprises with an annual main business income of over 20 million yuan as large-scale enterprises. This variable indicates the proportion of the assets of large-scale enterprises in the total assets of the cultural industry, reflecting the degree of industrialization of cultural enterprises in each province. Ju and Liu [63] found that the size of Chinese port-listed companies is positively correlated with efficiency. Tho et al. [64] found that economic benefits increase significantly when Vietnamese agricultural aquaculture enterprises exceed a certain scale. Hassen et al. [65] found that larger enterprises are more likely to adopt energy-saving and emission-reducing measures when studying green economic efficiency. These studies indicate that the positive impact of scale on production efficiency covers almost all sectors, including cultural manufacturing enterprises.
The regression coefficient for “Degree of financial support” is −0.051, with a z-value of −1.666 and a p-value of 0.096, showing no significant impact on TE. The regression coefficient for “Tax-to-asset ratio” is 0.156, with a z-value of 1.578 and a p-value of 0.115, also showing no significant impact on TE.
The regression coefficient for “Proportion of urban population” is −0.017, with a z-value of −7.310 and a p-value of less than 0.01, showing a significant negative impact on TE at the 0.01 level. Notably, the “Proportion of urban population” represents the increase in labor population brought by urbanization, which typically fills the need for additional human resources required for industrial concentration and scale expansion, aiding economic development. The results from the Tobit model seem to contradict this, but larger cities often mean higher public service expenditures and higher tax burdens, leading to decreasing returns to scale. Mera [66] found that if the goal of developing countries is to maximize GDP growth, urbanization should be concentrated. If the goal is more equitable income distribution across regions, underdeveloped areas should be prioritized and decentralized, although this does not help the overall economic efficiency.
In the 21st century, with the rise of sustainable development, scholars have debated the impact of urbanization on economic efficiency, as cities are more polluting than rural areas. Chang and Chen [67] showed that China’s rapid urbanization has created some risks, and even in the economically developed eastern region, coordinated development between land economic benefits and the environment has not been achieved. Wang and Salman [68] divided urbanization rates into different thresholds and found that market-oriented environmental regulations stimulate green economic efficiency when urbanization rates are below the first threshold and above the second threshold, while they inhibit green economic efficiency when urbanization is above the first threshold. These studies indicate the potential negative impacts of urbanization on economic efficiency.
In summary, “Per capita disposable income”, “Percentage of assets of cultural industry enterprises above scale”, and “Per capita gross regional product” significantly positively influence TE, while “Proportion of urban population” significantly negatively influences TE. “Per capita expenditure on culture and recreation as a percentage”, “Degree of financial support”, and “Tax-to-asset ratio” do not significantly influence TE.

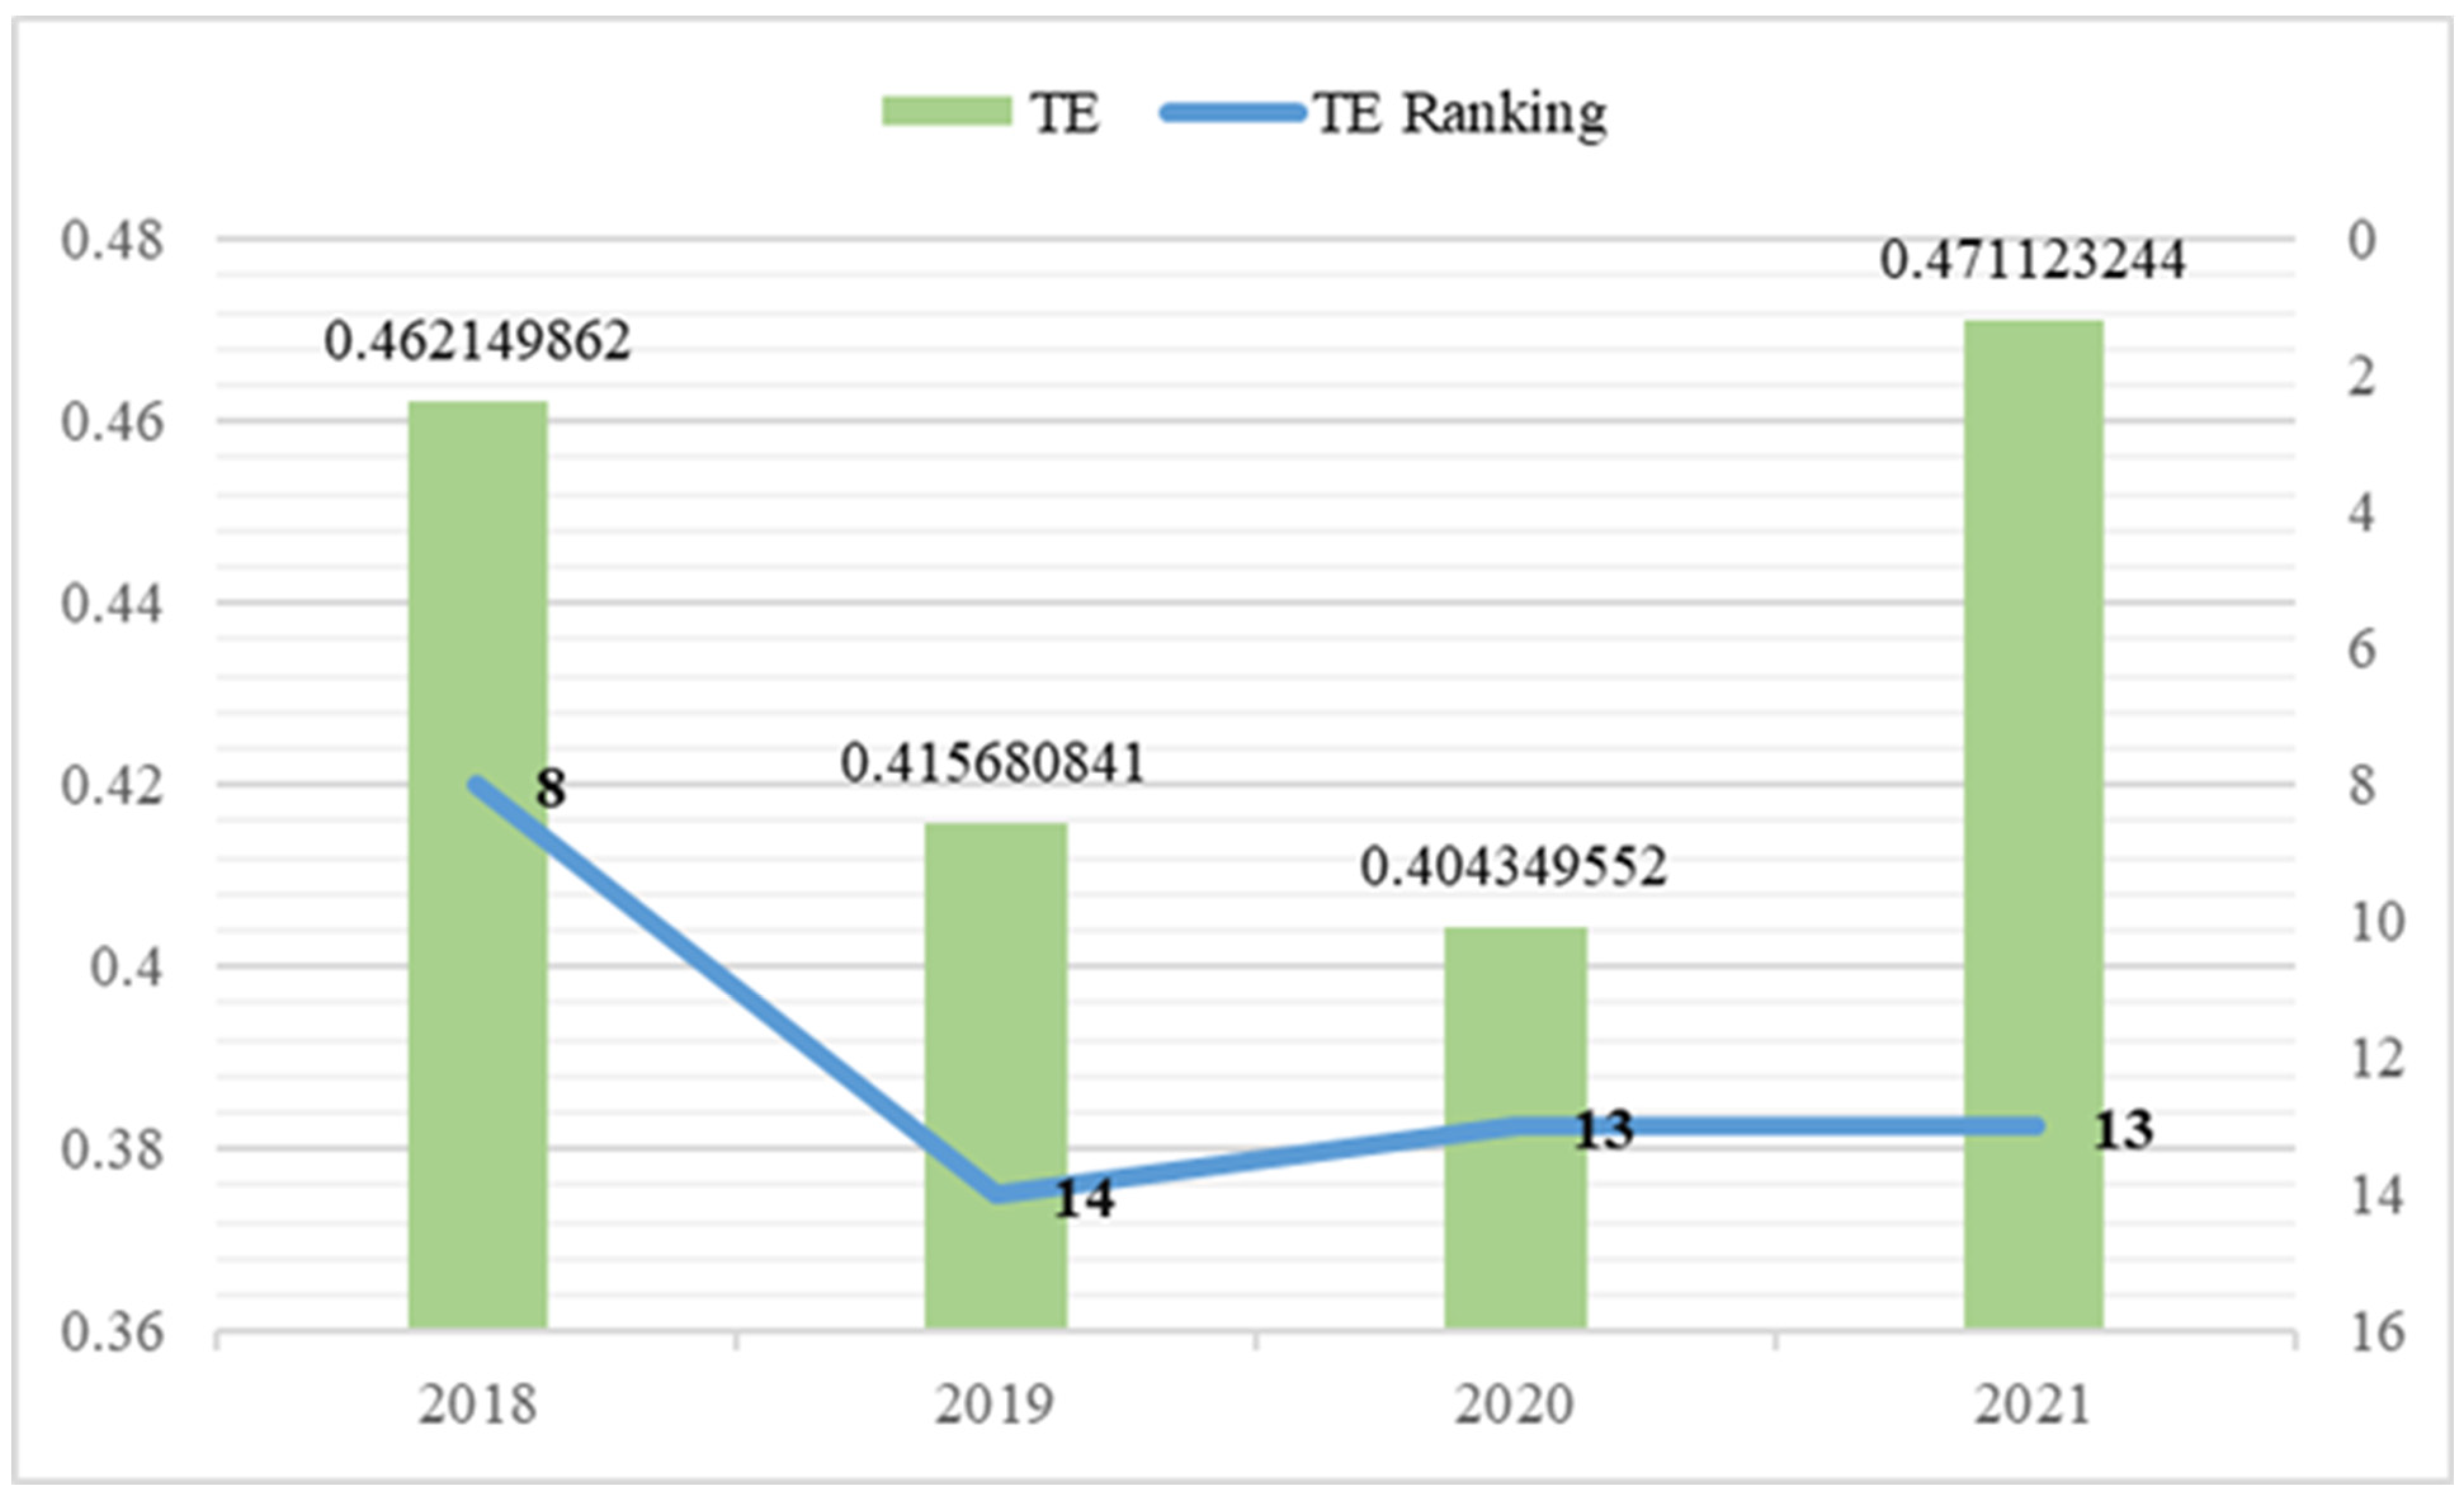
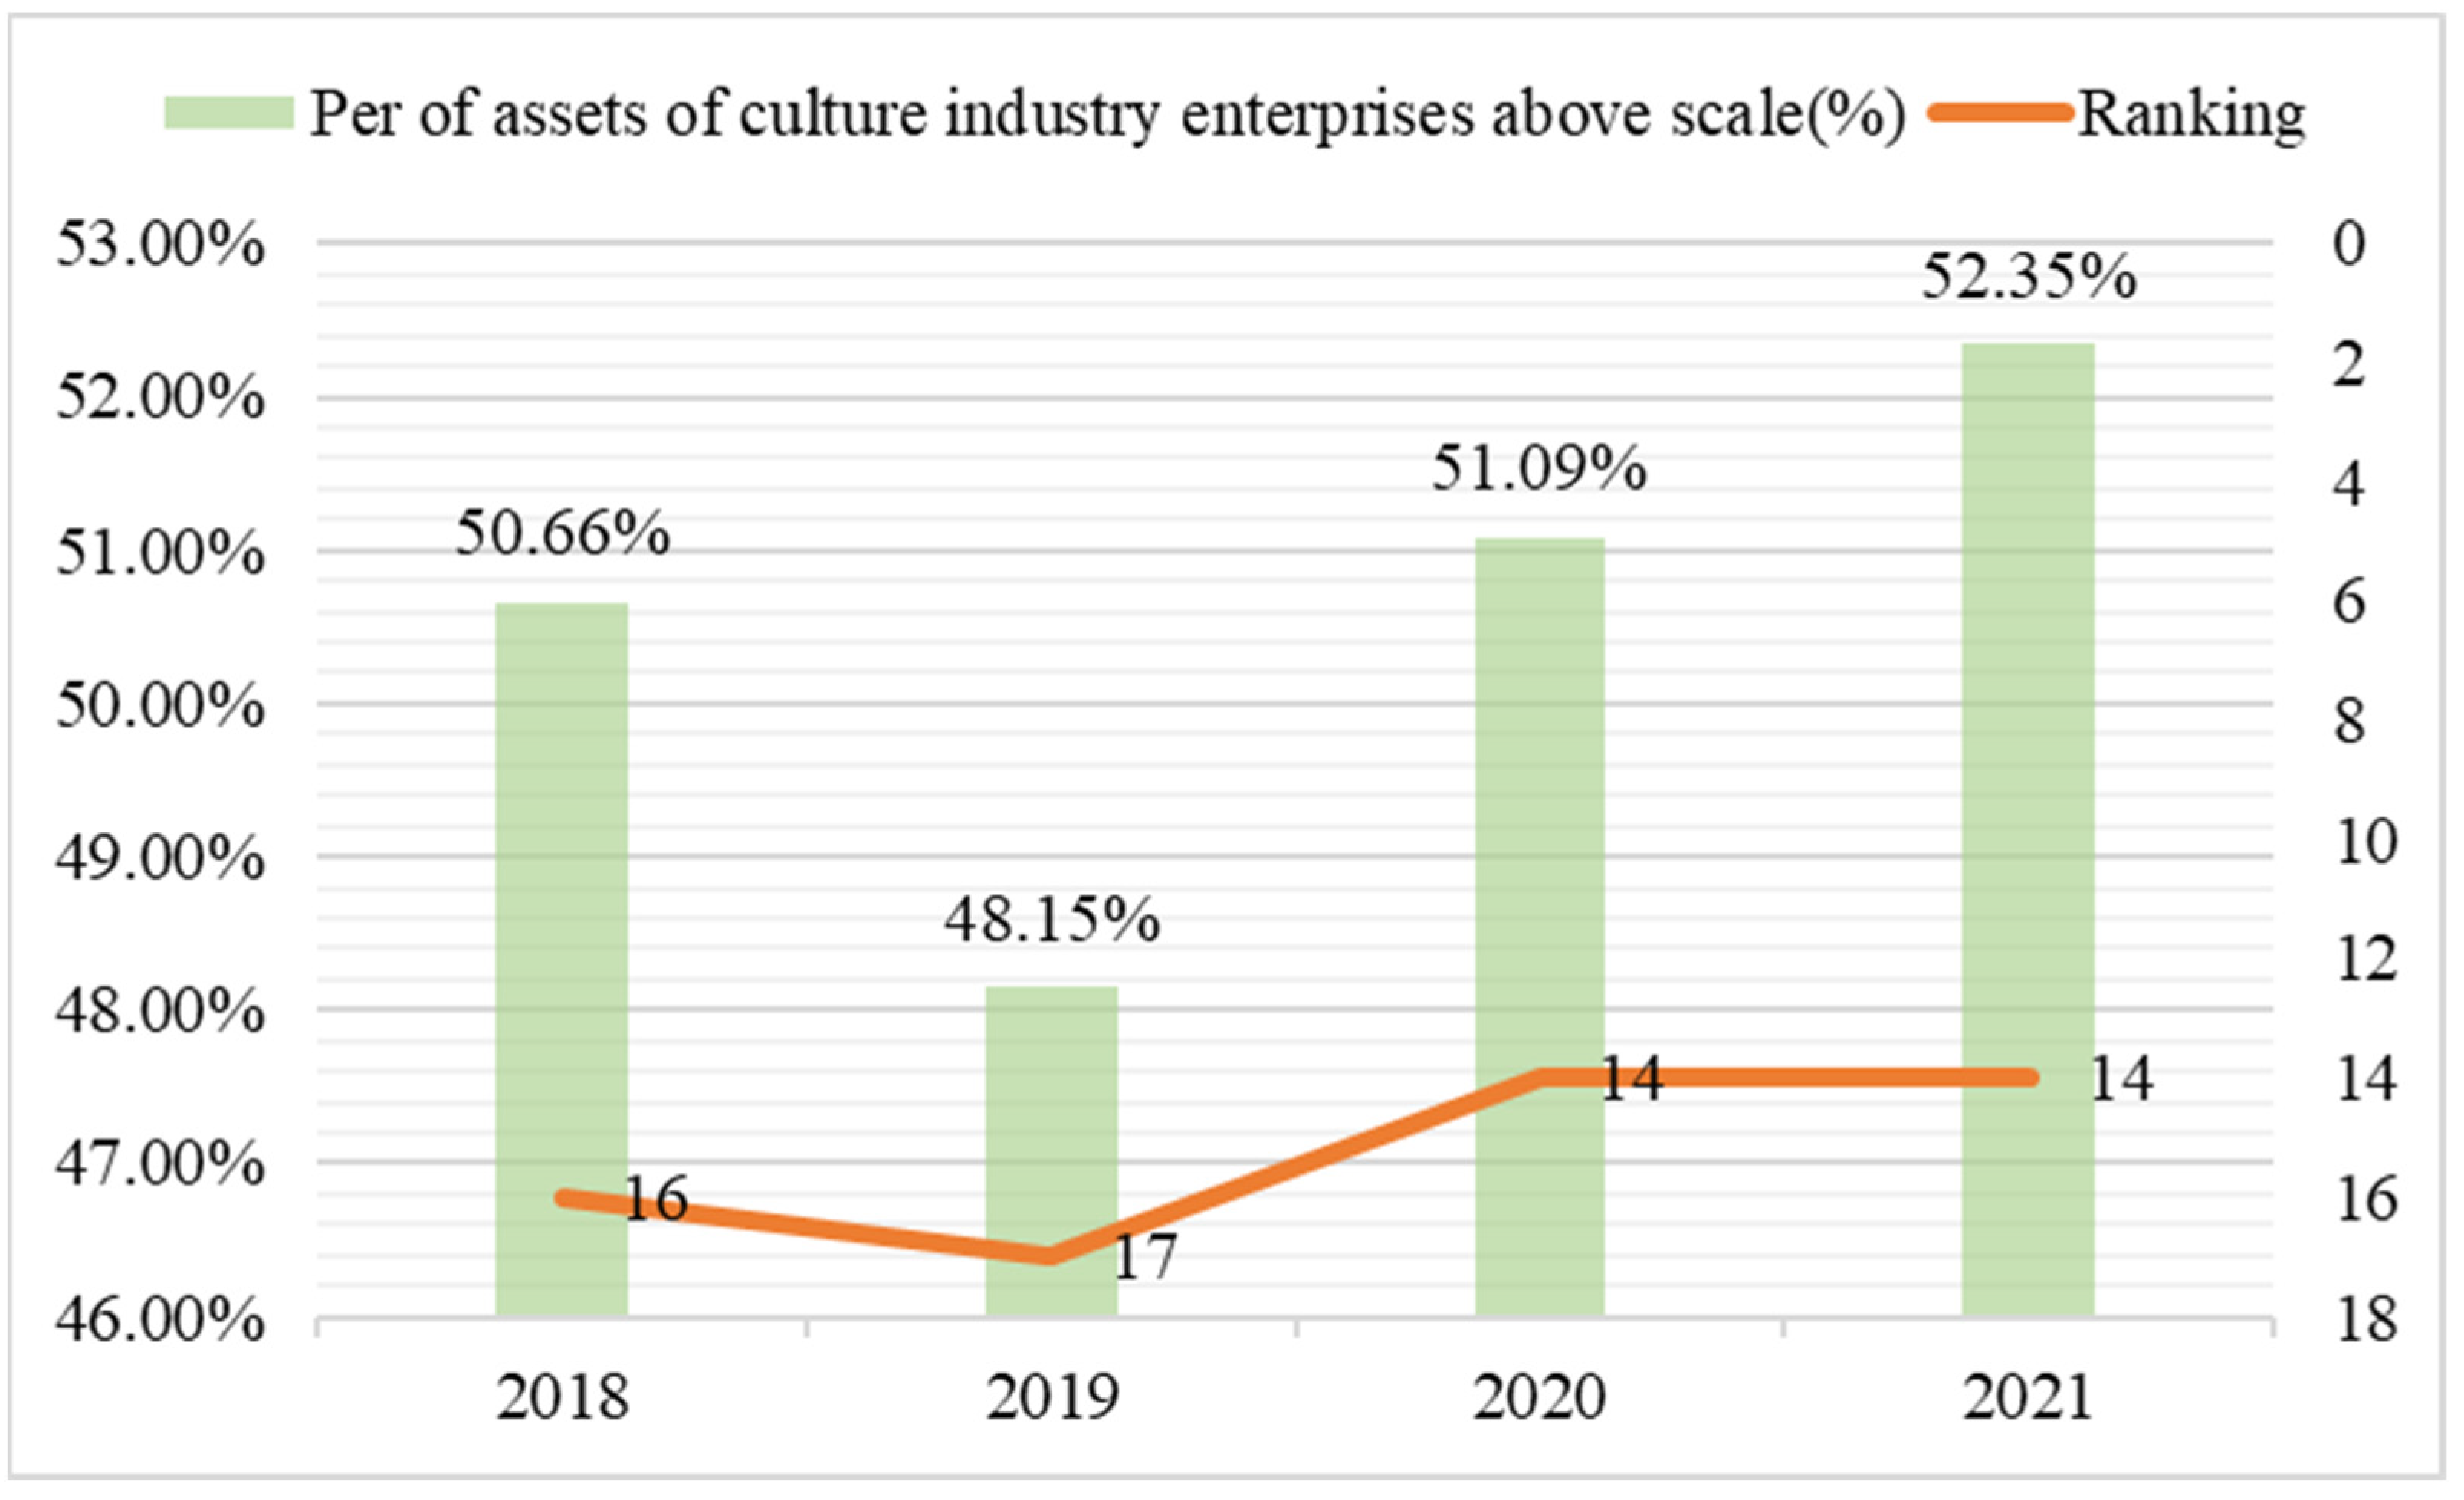
5.3. Analysis of Scale and Efficiency in China’s Cultural Industry: A Case Study of Jiangsu Province

From the aforementioned discussion, it is evident that urbanization has a complex impact on the efficiency of the cultural industry. Urbanization typically leads to industrial aggregation and the overall expansion of the cultural industry. The following section will further discuss the relationship between scale and efficiency in China’s cultural industry under the backdrop of urbanization, using Jiangsu Province as a case study. As one of China’s economically strongest provinces, Jiangsu has rapidly advanced in urbanization, and its cultural industry ranks among the top in terms of scale. This study arranges the rankings of various input indicators of Jiangsu’s cultural industry from 2018 to 2021 among 31 provinces into a graphical format. As depicted in Figure 4, the total assets of Jiangsu’s cultural industry have consistently held the top position nationally for four consecutive years, and the absolute value of these assets continues to rise.
During the four-year period from 2018 to 2021, the number of cultural industry enterprises in Jiangsu Province ranked between second and third. In the last two years of this period, both the number and rankings of these enterprises declined, as illustrated in Figure 5.
In terms of the number of employees in the cultural industry, Jiangsu consistently ranks second nationally, with a considerable gap between it and the third position, as shown in Figure 6.
The above represents the ranking of input variables for the cultural industry in Jiangsu. In fact, in terms of output variables, Jiangsu also ranks high among the 31 provinces, consistently maintaining second or third place over the four years, as illustrated in Figure 7.
This study assesses the cultural industry levels across 31 provinces using efficiency evaluation to account for substantial differences in area, geographic location, population, climate, and overall economic scale. Being top-ranked in terms of input and output sizes does not necessarily imply high efficiency. The study employs a global SBM model, wherein efficiency scores for different periods are calculated using data from all periods across the 31 provinces, allowing for direct intertemporal comparison. As shown in Figure 8, from 2018 to 2021, Jiangsu’s economic TE scores for the cultural industry were consistently below 0.5 with significant declines in 2019 and 2020 compared to 2018. The blue line in Figure 8 represents the trend of Jiangsu’s TE score ranking among the 31 provinces, starting at 8th place in 2018 and dropping out of the top 10 in subsequent years.
In summary, Jiangsu’s cultural industry ranks among the top in size across all 31 provinces in China. However, its TE scores only achieve a moderate national ranking. Compared to provinces with higher TE rankings, Jiangsu has not achieved the desired outputs. The high rankings in total revenue and asset size can often mask the underlying inefficiencies and may lead decision-makers to overlook existing issues within Jiangsu’s cultural industry.

5.4. Jiangsu’s Cultural Industry Is Experiencing Diminishing Returns to Scale

The decomposition results of the global SBM model for the economic efficiency of Jiangsu’s cultural industry are presented in Table 6. As shown in Table 6, throughout the four periods studied, the scale efficiency of Jiangsu’s cultural industry has been low, particularly in 2021 when pure technical efficiency reached a DEA efficiency of 1, yet the scale efficiency significantly declined. In conjunction with Figure 2, it is evident that Jiangsu’s scale efficiency is below the average of the 31 provinces and cities.
According to the return of scale, Jiangsu has been experiencing diminishing returns for four consecutive years, indicating that expanding production scales would further decrease the economic efficiency of its cultural industry. This phenomenon of diminishing marginal returns is often caused by the decrease in marginal benefits. As posited by the Austrian school economist Von Wieser [69], Jiangsu’s cultural industry has reached the highest scale nationally, which typically leads to diminishing marginal returns. For instance, data released by the Suzhou municipal government show that in 2019 alone, Suzhou in Jiangsu Province welcomed 136.09 million visitors [70]. Studies by Jin and Tu [71] indicate that despite the high profile of tourist attractions in Jiangsu, the overload in visitor numbers has led to decreased visitor satisfaction. Further research by Liu et al. [72] suggests that this overload also results in lower per capita spending, contributing to diminishing marginal returns. Consequently, such trends may result in reduced scale efficiency in Jiangsu’s tourism sector, ultimately dragging down the overall efficiency of the cultural industry.
The input-oriented global SBM model for 2018–2021 also details the slack in input–output variables across the 31 provinces. Slack in input variables represents excessive inefficiencies. In Jiangsu, all selected input variables exhibit high levels of slack. The ratio of slack in each input variable to the total amount of the input is organized into Figure 9, demonstrating these inefficiencies across different periods.
Figure 9 reveals that the highest proportion of input slack in Jiangsu’s cultural industry is found in the variable “Number of Enterprises at Year-end”, with over 50% slack across all periods, peaking at 70%. The next highest slack is in “Engaged Persons at Year-end”, which also exceeds 50% in all periods. The slack in “Total Assets at Year-end” surpasses 30%, reaching over 50% at its peak. The high proportions of slack in the number of enterprises and engaged persons, combined with the relatively lower slack in the total assets of cultural enterprises—which rank first nationally—suggest a crucial inference: compared to other provinces, excessive input redundancy and the small scale of cultural enterprises are significant reasons for the low efficiency of Jiangsu’s cultural industry.

5.5. Analyzing Jiangsu’s Cultural Industry through the Tobit Model

From the Tobit model, the variable “Proportion of assets of cultural industry enterprises above scale” significantly positively impacts the economic efficiency of the cultural industry across various provinces. Although Jiangsu ranks at the forefront in terms of the overall scale of the cultural industry, its cultural enterprises have not utilized urbanization to expand their scale and enhance efficiency. Consequently, its national ranking remains between 14th and 17th, as depicted in Figure 10. This ranking is closely aligned with the economic efficiency ranking of Jiangsu’s cultural industry shown in Figure 8. This suggests that despite the large overall scale of Jiangsu’s cultural industry, the individual enterprise size is generally small, and it has not benefited from the industry aggregation and scale expansion brought about by urbanization. The influence of the variable “Proportion of assets of cultural industry enterprises above scale” on the TE scores of Jiangsu’s cultural industry may be a significant factor contributing to the lower TE scores.
The Tobit model also indicates that the current economic efficiency of China’s cultural industry is significantly negatively impacted by the proportion of urban population. Figure 11 shows Jiangsu’s ranking in terms of urbanization level. The panel data on the cultural industry of the 31 provinces and municipalities in this study include the four municipalities directly under the central government: Beijing, Tianjin, Shanghai, and Chongqing. Typically, these municipalities have a higher urban area and urban population proportion compared to other provinces. Shanghai, Beijing, and Tianjin have the highest urban population proportions in China. Although Chongqing has been designated a municipality for a shorter period, it does not rank high in urban population proportion. As a province, Jiangsu ranks fifth nationally in urban population proportion, which means it ranks second among the provinces that do not include the municipalities, just behind Guangdong.
From the Tobit model and the case of Jiangsu, it appears that the increase in labor population brought about by urbanization in China has not been adequately absorbed. Specifically in the cultural sector, Jiangsu exhibits a severe redundancy in workforce, as illustrated in Figure 9. The independent variable “Proportion of Urban Population” likely contributes significantly to the drag on Jiangsu’s TE score. According to Ni et al. [73], a significant method of urbanization in Jiangsu, such as the conversion of counties to urban districts, has not been economically efficient despite fostering a perception of growth and facilitating state-centered governance. This method aligns with China’s urbanization and societal progress but may lead to decentralized governance and unutilized labor, affecting economic efficiency. Therefore, a continual and reflective examination of the trade-offs between political achievements and economic costs is necessary.
In summary, Jiangsu serves as a classic example where despite leading in the scale of cultural industry nationwide, its efficiency scores are only average. Further correlation studies reveal that Jiangsu’s cultural sector is likely affected by excessive and irrational urbanization processes. Given China’s centralized political system, the issues between urbanization and the cultural sector observed in Jiangsu might be widespread across other provinces and possibly other industries. Concerns regarding China’s new urbanization policies have been raised by Wang et al. [74], questioning the effectiveness of differentiated household registration systems and the rapid urbanization of rural land. Whether new urbanization will improve or reduce urban efficiency in China, plans for fiscal reforms at local government levels, and how issues with rural collective land are addressed remain unresolved. He et al. [75] highlighted the mismatches between migration and household registration in China, which aligns closely with the discussions in this study.
Recent studies, such as those by Guan et al. [34], describe China’s traditional land-centered urbanization as “incomplete” and “low-quality”, characterized by “high inputs, high consumption, high emissions, high expansion, and low levels of harmony, inclusiveness, and sustainability”. Improvement requires actively exploring new urbanization strategies that emphasize intensive, efficient, and sustainable models integrating urban and rural development. Cai et al. [76] show that the coupling of China’s new urbanization with the agricultural ecological environment is contentious, indicating that most provinces lag behind in developing new urbanization. Chen et al. [77] suggest that urbanization may degrade ecological quality, especially in higher-income areas, with higher urbanization rates exacerbating the negative impacts. Ge et al. [78] note that while guiding migrant workers to employment can enhance the efficiency of green agricultural development, the urbanization of the tertiary sector employment has a more pronounced effect. However, urbanization is projected to result in a surplus labor force of 20.64 million by 2020. Ip et al. [79] find that urbanization has a negligible impact on the tourism sector, which is a crucial component of China’s cultural industry.
The Tobit model also demonstrates that “Per capita gross regional product” and “Per capita disposable income” have a significant positive impact on the TE scores of the cultural industry. The national rankings of these two variables for Jiangsu over the four-year period are depicted in Figure 12.
As illustrated in Figure 12, Jiangsu’s “Per capita gross regional product” ranks highest among all provinces, only second to the most developed municipalities of Beijing and Shanghai. Similarly, “Per capita disposable income” is also among the top ranks nationally. Alongside the ranking of “Proportion of urban population”, it can be inferred that in the urbanization process of Jiangsu, both the total economic output and per capita income are growing concurrently. However, at least in the cultural industry, while “Per capita gross regional product” and “Per capita disposable income” have significant positive impacts on efficiency scores, these positive effects are not sufficient to offset the negative impact of “Proportion of urban population” and the inadequacies in “Per of assets of cultural industry enterprises above scale”.
This observation further corroborates previous discussions: Jiangsu’s urbanization is propelled through the re-designation of rural areas as urban, rapidly increasing per capita GDP and income through land transfers but not enhancing regional economic efficiency, including that of the cultural sector. This type of urbanization might even hinder industrial optimization, resulting in reduced efficiency relative to other provinces in China.

6. Conclusions, Contributions and Shortcomings

6.1. Conclusions

Based on previous discussions, the economic efficiency of China’s cultural industry exhibits an overall positive trend with notable recovery even after the impacts of COVID-19. Generally, the industry shows high scale efficiency but lower pure technical efficiency. Future development should cautiously approach the expansion of industry scale. Emphasis should be placed on improving technical levels, management, and financing within the cultural sector. Officially, China’s broad definition of the cultural industry encompasses news, publishing, film, creativity, entertainment services, tourism, related manufacturing, and wholesale and retail sectors, offering diverse directions for provinces to seek higher efficiency and returns in cultural industry development.
Urbanization, which has enhanced per capita GDP and income as well as the size of individual enterprises, significantly boosts the economic efficiency of the cultural industry. However, an increased urban population proportion has a marked negative impact on economic efficiency. For China’s cultural industry, which is experiencing high scale efficiency and diminishing returns, assimilating the workforce and land resources brought by urbanization requires time. The current approach in China, which crudely drives urbanization through changes in household registration and land status, is detrimental in the short term and hampers industrial development.
Prosperous provinces like Jiangsu, with excessively large inputs into the cultural industry, exhibit significant input redundancy. This suggests that the cultural industry in Jiangsu and across China is still in a phase of low levels and quality. The small scale of related enterprises leads to poor operational efficiency and diminishing returns. Future development should focus on fostering cooperation or even mergers among cultural enterprises to expand scale and enhance operational efficiency.
In advancing urbanization, it is crucial to ensure balanced development, not merely pursuing indicators like population and land status, or short-term growth in per capita GDP and income. Special attention should be paid to how to absorb and utilize the surplus labor and land brought by urbanization without reducing the economic efficiency of industries. This concern is relevant not only to the cultural sector but also to the future development of secondary and tertiary industries.
As previously mentioned, the official inclusion of news, publishing, film, creativity, entertainment services, tourism, related manufacturing, and wholesale and retail sectors under the umbrella of the cultural industry makes the sector extremely complex. Facing such complexity, entering more specialized domains could potentially eliminate regional disparities more effectively, offering more actionable insights and recommendations for policy making. This will be addressed in future research.

6.2. Contributions and Shortcomings

6.2.1. Methodological Contributions

Many studies employing the DEA-Tobit combined research methodology directly use the standard DEA model efficiency scores from single-period panel data as the dependent variable, which does not account for intertemporal effects. Consequently, while these studies also utilize time-series data as independent variables, this approach leads to an insufficient fit in the final results. In contrast, this study employs global SBM model scores that consider intertemporal effects as the dependent variable, enhancing the fit of the Tobit model with real-world scenarios. This optimization has broad applicability.

6.2.2. Content Contributions

This study empirically investigates the correlation between China’s new urbanization and the revitalization of the cultural industry, filling a research gap.
Currently, China’s new urbanization policy may be overly simplistic and ineffective in some regions. In certain developed areas of China, the cultural industry is experiencing diminishing returns to scale, which is partly due to unreasonable urbanization policies. To increase the cultural industry’s share of GDP, these regions need to optimize industrial structures and comprehensively elevate industry levels, enhancing the efficiency of the cultural industry through the outcomes of urbanization.

6.2.3. Methodological Contributions

Empirical Analysis Framework: Unlike many studies that directly use standard DEA model efficiency scores as the dependent variable and time-series data as the independent variable, this study employs a global DEA model score that considers intertemporal effects as the dependent variable. This enhances the fit of the Tobit model to real-world scenarios, offering a generally applicable optimization.

6.2.4. Limitations and Future Research Directions

As mentioned earlier, China’s official classification includes news, publishing, film and television, creative industries, entertainment services, tourism, related manufacturing, and related wholesale and retail industries under the cultural industry umbrella, resulting in a highly complex composition. Addressing this complexity requires more detailed subsector analysis to effectively eliminate differences between provinces and municipalities, yielding more actionable and instructive policy recommendations. This will be addressed in future research.
Another limitation of this study is its reliance on quantitative data, spanning the years 2018–2021, which may not capture all qualitative influences and long-term trends. This is mainly due to changes in statistical standards and local policies. However, the future research direction mentioned above, focusing on detailed subsector analysis, should partially mitigate the impact of these changes.
The global COVID-19 pandemic in 2019 undoubtedly introduced significant perturbations to quantitative data. However, considering that the research focuses on China’s 31 provinces and municipalities, where the impact of the pandemic was widespread, this influence can be partially mitigated. Nevertheless, the varying composition of the cultural industry across provinces means the pandemic’s impact differs, which future detailed subsector research can further address.
Another noteworthy limitation is that while the cultural industry significantly enhances residents’ happiness, this study evaluates it based on economic efficiency metrics, which contradicts the cultural industry’s primary purpose. The research team also considers the social benefits of the cultural industry, as referenced in [80]. Future research will focus on integrating economic and social benefits for comprehensive evaluation.
Additionally, the unique characteristics of the cultural industry arising from China’s political system significantly affect the generalizability of the findings. Future research will pay more attention to addressing this limitation.

Author Contributions

W.Z.: Conceptualization; Formal analysis; Funding acquisition; Resources; Writing—review and editing; Project administration, R.Z.: Conceptualization; Formal analysis; Software; Investigation; Data curation; Validation; Visualization; Writing—original draft preparation, Y.Z.: Methodology; Software; Supervision; Writing—review and editing. All authors have read and agreed to the published version of the manuscript.

Funding

This research was funded by the Education Ministry’s Youth Fund Project for Humanities and Social Sciences Research (No. 20YJC760133).The APC was funded by the Education Ministry’s Youth Fund Project for Humanities and Social Sciences Research (No. 20YJC760133).

Institutional Review Board Statement

Not applicable.

Informed Consent Statement

Not applicable.

Data Availability Statement

Data will be provided upon request.

Conflicts of Interest

The authors declare no conflicts of interest.

References

  1. Brocchi, D. The cultural dimension of sustainability. In Religion and Dangerous Environmental Change: Transdisciplinary Perspectives on the Ethics of Climate and Sustainability; LIT Verlag Münster: Münster, Germany, 2010; p. 145. [Google Scholar]
  2. Duxbury, N.; Kangas, A.; De Beukelaer, C. Cultural policies for sustainable development: Four strategic paths. Int. J. Cult. Policy 2017, 23, 214–230. [Google Scholar] [CrossRef]
  3. Nurse, K. Culture as the fourth pillar of sustainable development. Small States Econ. Rev. Basic Stat. 2006, 11, 28–40. [Google Scholar]
  4. Klein, M.; Gutowski, P.; Gerlitz, L.; Gutowska, E. Creative and Culture Industry in Baltic Sea Region Condition and Future. Sustainability 2021, 13, 4239. [Google Scholar] [CrossRef]
  5. Liu, Y. Three Considerations for the Development of the Cultural Industry under the Goal of Building a Strong Cultural Nation. 19 January 2021. Available online: http://icit.ruc.edu.cn/zxdt/c240785f1a444e16b74fe3ade55f5ff8.htm (accessed on 1 June 2024).
  6. Banks, A.S.; Carr, D.L. Urbanization and modernization: A longitudinal analysis. Stud. Comp. Int. Dev. 1974, 9, 26–45. [Google Scholar] [CrossRef] [PubMed]
  7. Rössel, J. Modernization. In Encyclopedia of Global Studies; Helmut, K.A., Mark, J., Victor, F., Eds.; Sage: Thousand Oaks, CA, USA, 2012; pp. 1178–1183. [Google Scholar]
  8. Marsh, R.M. Modernization theory, then and now. Comp. Sociol. 2014, 13, 261–283. [Google Scholar] [CrossRef]
  9. Li, Y.; Zhu, K.; Yu, R.; Li, X.; Xian, B.T.S. Synchronous Development Strategy of China’s New Four Modernizations: An Analysis Based on Interactive Mode. IEEE Access 2023, 11, 53344–53358. [Google Scholar] [CrossRef]
  10. Henderson, V. Urbanization in Developing Countries. World Bank Res. Obs. 2002, 17, 89–112. [Google Scholar] [CrossRef]
  11. Ravallion, M.; Chen, S.; Sangraula, P. New evidence on the urbanization of global poverty. Popul. Dev. Rev. 2007, 33, 667–701. [Google Scholar] [CrossRef]
  12. Humbal, A.; Chaudhary, N.; Pathak, B. Urbanization trends, climate change, and environmental sustainability. In Climate Change and Urban Environment Sustainability; Springer: Berlin/Heidelberg, Germany, 2023; pp. 151–166. [Google Scholar]
  13. Li, J. Culture and tourism-led peri-urban transformation in China–The case of Shanghai. Cities 2020, 99, 102628. [Google Scholar] [CrossRef]
  14. Liang, S.; Wang, Q. Cultural and creative industries and urban (re) development in China. J. Plan. Lit. 2020, 35, 54–70. [Google Scholar] [CrossRef]
  15. Vila, S.F.; Miotto, G.; Rodríguez, J.R. Cultural Sustainability and the SDGs: Strategies and Priorities in the European Union Countries. Eur. J. Sustain. Dev. 2021, 10, 73. [Google Scholar] [CrossRef]
  16. d’Orville, H. The relationship between sustainability and creativity. Cadmus 2019, 4, 65–73. [Google Scholar]
  17. State Council of China. The State Council Executive Meeting Discusses and Adopts the Revitalization Plan for the Cultural Industry. 2009. Available online: https://www.gov.cn/ldhd/2009-07/22/content_1371926.htm (accessed on 1 September 2023).
  18. State Council of China. Outline of the National Cultural Development and Reform Plan for the 13th Five-Year Plan Period. 2017. Available online: https://www.gov.cn/gongbao/content/2017/content_5194886.htm (accessed on 1 September 2023).
  19. Shan, S.-l. Chinese cultural policy and the cultural industries. City Cult. Soc. 2014, 5, 115–121. [Google Scholar] [CrossRef]
  20. Vlassis, A. Soft power, global governance of cultural industries and rising powers: The case of China. Int. J. Cult. Policy 2016, 22, 481–496. [Google Scholar] [CrossRef]
  21. Ju, H. Research on the efficiency measurement of Chinese cultural manufacturing industry based on DEA method. Int. J. Front. Sociol. 2019, 1, 32–42. [Google Scholar]
  22. Williamson, J.G. Chapter 11 Migration and urbanization. In Handbook of Development Economics; Elsevier: Amsterdam, The Netherlands, 1988; Volume 1, pp. 425–465. [Google Scholar]
  23. Henderson, J.V. Chapter 24—Urbanization and Growth. In Handbook of Economic Growth; Aghion, P., Durlauf, S.N., Eds.; Elsevier: Amsterdam, The Netherlands, 2005; Volume 1, pp. 1543–1591. [Google Scholar]
  24. Ritchie, H.; Roser, M. Urbanization. Our World in Data. 2018. Available online: https://ourworldindata.org/urbanization (accessed on 1 July 2024).
  25. Phillips, D.R. Urbanization and human health. Parasitology 1993, 106, S93–S107. [Google Scholar] [CrossRef] [PubMed]
  26. Smart, A.; Smart, J. Urbanization and the global perspective. Annu. Rev. Anthropol. 2003, 32, 263–285. [Google Scholar] [CrossRef]
  27. Seto, K.C.; Sánchez-Rodríguez, R.; Fragkias, M. The new geography of contemporary urbanization and the environment. Annu. Rev. Environ. Resour. 2010, 35, 167–194. [Google Scholar] [CrossRef]
  28. State Council of China. National New Urbanisation Plan (2014–2020). 2014. Available online: https://www.gov.cn/zhengce/2014-03/16/content_2640075.htm (accessed on 25 January 2024).
  29. State Council of China. Key Tasks for the Construction of New Urbanization in 2019. 2019. Available online: https://www.gov.cn/xinwen/2019-04/08/content_5380457.htm (accessed on 1 April 2024).
  30. Chan, K.W. Fundamentals of China’s urbanization and policy. China Rev. 2010, 10, 63–93. [Google Scholar]
  31. Tan, Y.; Xu, H.; Zhang, X. Sustainable urbanization in China: A comprehensive literature review. Cities 2016, 55, 82–93. [Google Scholar] [CrossRef]
  32. Li, Y.; Jia, L.; Wu, W.; Yan, J.; Liu, Y. Urbanization for rural sustainability–Rethinking China’s urbanization strategy. J. Clean. Prod. 2018, 178, 580–586. [Google Scholar] [CrossRef]
  33. Chaolin, G.U.; Liya, W.U.; Cook, I. Progress in research on Chinese urbanization. Front. Archit. Res. 2012, 1, 101–149. [Google Scholar] [CrossRef]
  34. Guan, X.; Wei, H.; Lu, S.; Dai, Q.; Su, H. Assessment on the urbanization strategy in China: Achievements, challenges and reflections. Habitat Int. 2018, 71, 97–109. [Google Scholar] [CrossRef]
  35. Ying, D.; Wu, W. Urbanization Is the Irresistible Trend of Development in China (Introduction). In A Study of China’s Urban-Rural Integration Development; Ying, D., Wu, W., Eds.; Springer Nature Singapore: Singapore, 2022; pp. 1–27. [Google Scholar]
  36. Schmookler, J. The changing efficiency of the American economy, 1869–1938. Rev. Econ. Stat. 1952, 34, 214–231. [Google Scholar] [CrossRef]
  37. Mundaca, L.; Neij, L.; Worrell, E.; McNeil, M. Evaluating energy efficiency policies with energy-economy models. Annu. Rev. Environ. Resour. 2010, 35, 305–344. [Google Scholar] [CrossRef]
  38. Bukarica, V.; Tomšić, Ž. Energy efficiency policy evaluation by moving from techno-economic towards whole society perspective on energy efficiency market. Renew. Sustain. Energy Rev. 2017, 70, 968–975. [Google Scholar] [CrossRef]
  39. Paul, C.; Nehring, R.; Banker, D.; Somwaru, A. Scale economies and efficiency in US agriculture: Are traditional farms history? J. Product. Anal. 2004, 22, 185–205. [Google Scholar] [CrossRef]
  40. Reza Anik, A.; Rahman, S.; Sarker, J.R. Five decades of productivity and efficiency changes in world agriculture (1969–2013). Agriculture 2020, 10, 200. [Google Scholar] [CrossRef]
  41. Charnes, A.; Cooper, W.W.; Rhodes, E. Measuring the efficiency of decision making units. Eur. J. Oper. Res. 1978, 2, 429–444. [Google Scholar] [CrossRef]
  42. Banker, R.D.; Charnes, A.; Cooper, W.W. Some models for estimating technical and scale inefficiencies in data envelopment analysis. Manag. Sci. 1984, 30, 1078–1092. [Google Scholar] [CrossRef]
  43. Tone, K. A slacks-based measure of efficiency in data envelopment analysis. Eur. J. Oper. Res. 2001, 130, 498–509. [Google Scholar] [CrossRef]
  44. Ohsato, S.; Takahashi, M. Management efficiency in Japanese regional banks: A network DEA. Procedia-Soc. Behav. Sci. 2015, 172, 511–518. [Google Scholar] [CrossRef]
  45. Cecchini, L.; Venanzi, S.; Pierri, A.; Chiorri, M. Environmental efficiency analysis and estimation of CO2 abatement costs in dairy cattle farms in Umbria (Italy): A SBM-DEA model with undesirable output. J. Clean. Prod. 2018, 197, 895–907. [Google Scholar] [CrossRef]
  46. Shang, Y.; Liu, H.; Lv, Y. Total factor energy efficiency in regions of China: An empirical analysis on SBM-DEA model with undesired generation. J. King Saud Univ.-Sci. 2020, 32, 1925–1931. [Google Scholar] [CrossRef]
  47. Su, Z.; Aaron, J.R.; McDowell, W.C.; Lu, D.D. Sustainable synergies between the cultural and tourism industries: An efficiency evaluation perspective. Sustainability 2019, 11, 6607. [Google Scholar] [CrossRef]
  48. Gao, J.; Shao, C.; Chen, S. Evolution and driving factors of the spatiotemporal pattern of tourism efficiency at the provincial level in China based on SBM–DEA model. Int. J. Environ. Res. Public Health 2022, 19, 10118. [Google Scholar] [CrossRef] [PubMed]
  49. Tone, K. Slacks-based measure of efficiency. In Handbook on Data Envelopment Analysis; Springer: Boston, MA, USA, 2011; pp. 195–209. [Google Scholar]
  50. Golany, B.; Roll, Y. An application procedure for DEA. Omega 1989, 17, 237–250. [Google Scholar] [CrossRef]
  51. Streimikis, J.; Miao, Z.; Balezentis, T. Creation of climate-smart and energy-efficient agriculture in the European Union: Pathways based on the frontier analysis. Bus. Strategy Environ. 2021, 30, 576–589. [Google Scholar] [CrossRef]
  52. Zhao, X.; Ma, X.; Shang, Y.; Yang, Z.; Shahzad, U. Green economic growth and its inherent driving factors in Chinese cities: Based on the Metafrontier-global-SBM super-efficiency DEA model. Gondwana Res. 2022, 106, 315–328. [Google Scholar] [CrossRef]
  53. Ben Lahouel, B.; Taleb, L.; Managi, S.; Abaoub, N. Inclusive green growth in OECD countries: What are the impacts of stringent environmental and employment regulations? Environ. Econ. Policy Stud. 2023. [Google Scholar] [CrossRef]
  54. Tobin, J. Estimation of relationships for limited dependent variables. Econom. J. Econom. Soc. 1958, 26, 24–36. [Google Scholar] [CrossRef]
  55. PingWest. Policy Change: Film and Culture Companies Flee from Horgos. 2018. Available online: https://tech.sina.com.cn/i/2018-07-04/doc-ihevauxk3621085.shtml (accessed on 2 August 2023).
  56. Wang, Y. Achievements, Dilemmas and Countermeasures of Business Environment Construction in Ethnic Areas. In Proceedings of the 2019 2nd International Conference on Education, Economics and Social Science (ICEESS 2019), Singapore, 30–31 October 2019; Atlantis Press: Amsterdam, The Netherlands; pp. 176–180. [Google Scholar]
  57. Jiang, C.; Li, J.; Liu, J. Does urbanization affect the gap between urban and rural areas? Evidence from China. Socio-Econ. Plan. Sci. 2022, 82, 101271. [Google Scholar] [CrossRef]
  58. Jiang, S.; Lin, X.; Qi, L.; Zhang, Y.; Sharp, B. The macro-economic and CO2 emissions impacts of COVID-19 and recovery policies in China. Econ. Anal. Policy 2022, 76, 981–996. [Google Scholar] [CrossRef] [PubMed]
  59. Akaike, H. A new look at the statistical identification model. IEEE Trans. Autom. Control 1974, 19, 716. [Google Scholar] [CrossRef]
  60. Schwarz, G. Estimating the dimensions of a model. Ann. Stat. 1978, 6, 461–464. [Google Scholar] [CrossRef]
  61. Zeng, S.; Hu, M.; Su, B. Research on investment efficiency and policy recommendations for the culture industry of China based on a three-stage DEA. Sustainability 2016, 8, 324. [Google Scholar] [CrossRef]
  62. Xie, Z.; Zhang, Y.; Fang, Z. The Space–Time Evolution of the Coupling and Coordinated Development of Public Cultural Services and Cultural Industries: A Case Study of 31 Regions in China. Sustainability 2022, 14, 15463. [Google Scholar] [CrossRef]
  63. Ju, S.-M.; Liu, N. Efficiency and its influencing factors in port enterprises: Empirical evidence from Chinese port-listed companies. Marit. Policy Manag. 2015, 42, 571–590. [Google Scholar] [CrossRef]
  64. Tho, H.H.; Tuyet, N.L.H.; Tojo, N. The effect of farm size on economic efficiency: A case study of Vietnamese pangasius farms. Fish. Sci. 2021, 87, 915–926. [Google Scholar] [CrossRef]
  65. Hassen, S.; Gebrehiwot, T.; Arega, T. Determinants of enterprises use of energy efficient technologies: Evidence from urban Ethiopia. Energy Policy 2018, 119, 388–395. [Google Scholar] [CrossRef]
  66. Mera, K. On the Concentration of Urbanization and Economic Efficiency. 1970. Available online: https://policycommons.net/artifacts/1471415/on-the-concentration-of-urbanization-and-economic-efficiency/2124554/ (accessed on 1 July 2024).
  67. Chang, B.; Chen, L. Land economic efficiency and improvement of environmental pollution in the process of sustainable urbanization: Case of eastern China. Land Use Policy 2021, 10, 845. [Google Scholar] [CrossRef]
  68. Wang, G.; Salman, M. The impacts of heterogeneous environmental regulations on green economic efficiency from the perspective of urbanization: A dynamic threshold analysis. Environ. Dev. Sustain. 2022, 25, 9485–9516. [Google Scholar] [CrossRef]
  69. Von Wieser, F. Social Economics; Routledge: London, UK, 2013. [Google Scholar]
  70. Suzhou Municipal People’s Government. Overview of Economic and Social Development in Suzhou in 2019. 3 June 2020. Available online: https://www.suzhou.gov.cn/szsrmzf/2020tjgb/202006/6b79cb2f32854d8890366e1454e1fc07.shtml (accessed on 1 August 2023).
  71. Jin, L.; Tu, W. Tourist satisfaction based marketing research for domestic tourist market of Jiangsu Province. In Proceedings of the 2014 International Conference on Social Science (ICSS-14), Bucharest, Romania, 19–20 September 2014; Atlantis Press: Amsterdam, The Netherlands; pp. 35–41. [Google Scholar]
  72. Liu, S.; Geng, Y.; Zhang, J.; Kang, X.; Shi, X.; Zhang, J. Ecological trap in tourism-urbanization: Simulating the stagnation and restoration of urbanization from the perspective of government incentives. Ecol. Econ. 2021, 185, 107054. [Google Scholar] [CrossRef]
  73. Ni, H. Regional Governance through Administrative Annexation: The Case of City–County Annexation in China. Ph.D. Thesis, University of Liverpool, Liverpool, UK, 2023. [Google Scholar]
  74. Wang, X.-R.; Hui, E.C.-M.; Choguill, C.; Jia, S.-H. The new urbanization policy in China: Which way forward? Habitat Int. 2015, 47, 279–284. [Google Scholar] [CrossRef]
  75. He, B. An Empirical Study on the Competitiveness of Jiangsu Province of China Cultural Industry. Open Access Libr. J. 2017, 4, 1–6. [Google Scholar] [CrossRef]
  76. Cai, J.; Li, X.; Liu, L.; Chen, Y.; Wang, X.; Lu, S. Coupling and coordinated development of new urbanization and agro-ecological environment in China. Sci. Total Environ. 2021, 776, 145837. [Google Scholar] [CrossRef] [PubMed]
  77. Chen, X.; Liu, C.; Yu, X. Urbanization, Economic Development, and Ecological Environment: Evidence from Provincial Panel Data in China. Sustainability 2022, 14, 1124. [Google Scholar] [CrossRef]
  78. Ge, P.; Liu, T.; Wu, X.; Huang, X. Heterogenous Urbanization and Agricultural Green Development Efficiency: Evidence from China. Sustainability 2023, 15, 5682. [Google Scholar] [CrossRef]
  79. Ip, Y.; Iqbal, W.; Du, L.; Akhtar, N. Assessing the impact of green finance and urbanization on the tourism industry—An empirical study in China. Environ. Sci. Pollut. Res. 2023, 30, 3576–3592. [Google Scholar] [CrossRef]
  80. Li, J.; Zhang, R.; Zou, Y. Analyzing the Shift in China’s Cultural Industries: From Economic Growth to Social Enrichment. Sustainability 2024, 16, 4194. [Google Scholar] [CrossRef]
Figure 1. Flowchart of the research procedure in this study.
Sustainability 16 06807 g001
Figure 2. Mean efficiency and development trend of China’s cultural industry global SBM model from 2018 to 2021.
Sustainability 16 06807 g002
Figure 3. 2018–2021 Tobit regression model of economic efficiency of China’s cultural industry.
Sustainability 16 06807 g003
Figure 4. Top 10 cultural industry total assets in 2018–2021. To facilitate the reader’s view, the primary research subject, Jiangsu, is highlighted in red for distinction.
Sustainability 16 06807 g004
Figure 5. Top 10 cultural industry enterprises by number in 2018–2021. To facilitate the reader’s view, the primary research subject, Jiangsu, is highlighted in red for distinction.
Sustainability 16 06807 g005
Figure 6. Top 10 cultural industry engaged persons in 2018–2021. To facilitate the reader’s view, the primary research subject, Jiangsu, is highlighted in red for distinction.
Sustainability 16 06807 g006
Figure 7. Top 10 cultural industry total revenue in 2018–2021. To facilitate the reader’s view, the primary research subject, Jiangsu, is highlighted in red for distinction.
Sustainability 16 06807 g007
Figure 8. Technical efficiency and ranking of Jiangsu cultural industry.
Sustainability 16 06807 g008
Figure 9. Proportion of slack in input variables for Jiangsu’s cultural industry, 2018–2021.
Sustainability 16 06807 g009
Figure 10. The 2018–2021 Jiangsu’s “Proportion of assets of cultural industry enterprises above scale” and its ranking among the 31 provinces.
Sustainability 16 06807 g010
Figure 11. National ranking of Jiangsu’s “Proportion of urban population” from 2018 to 2021.
Sustainability 16 06807 g011
Figure 12. Rankings of “Per capita gross regional product” and “Per capita disposable income” for Jiangsu, 2018–2019.
Sustainability 16 06807 g012
Table 1. List of inputs and outputs.
Indicator CategoriesIndicators
Input indicatorsNumber of Enterprises at Year-end
Total Assets at Year-end
Engaged Persons at Year-end
Output indicatorsTotal Revenue
Table 2. Summary of the global SBM model for the cultural industry across 31 provinces and municipalities in China, 2018–2021.
Mean Value of TEMean Value of PTEMean Value of SENumber of CRSNumber of DRSNumber of IRS
20180.363187250.4451180650.8868118746205
20190.393927560.4807490750.8962384447195
20200.3824035560.451105210.8969126327195
20210.4401098840.5515763740.8662560878185
Table 3. Summary table of Tobit model samples.
Censor Data Samples
Sample SizeUncensoredLeft-CensoredRight-Censored
Number12412400
Percentage100%100.00%0.00%0.00%
Table 4. Results of Tobit model likelihood ratio test.
Model−2× log-LikelihoodCardinalitydfpAICBIC
Intercept Distance−18.686 −18.686
Final Model−138.275119.58870.000−122.275−99.712
Table 5. Results of Tobit model.
Regression Coefficient
Distance0.761 ** (6.558)
Per capita expenditure on culture and recreation as a percentage (%)−0.017 (−1.053)
Per capita disposable income (10,000 CNY)0.086 * (2.534)
Per of assets of cultural industry enterprises above scale (%)0.004 ** (3.624)
Per capita gross regional product (10,000 CNY)0.050 ** (4.353)
Proportion of urban population (%)−0.017 ** (−7.310)
Degree of financial support (%)−0.051 (−1.666)
Tax-to-asset ratio (%)0.156 (1.578)
log (Sigma)−1.976 ** (−31.126)
likelihood ratio testχ2 (7) = 119.588, p = 0.000
McFadden R2−6.400
Implicit Variable: TE
* p < 0.05, ** p < 0.01, z-values in parentheses.
Table 6. Decomposition of economic efficiency scores for Jiangsu’s cultural industry, 2018–2021.
TEPTESEReturn of Scale
20180.462150.6453350.716139DRS
20190.4156810.55070.754823DRS
20200.404350.5660450.714342DRS
20210.47112310.471123DRS
Disclaimer/Publisher’s Note: The statements, opinions and data contained in all publications are solely those of the individual author(s) and contributor(s) and not of MDPI and/or the editor(s). MDPI and/or the editor(s) disclaim responsibility for any injury to people or property resulting from any ideas, methods, instructions or products referred to in the content.

