


Study on Landslide Susceptibility Based on Multi-Model Coupling: A Case Study of Sichuan Province, China


Abstract
1. Introduction
2. Study Area and Methodology
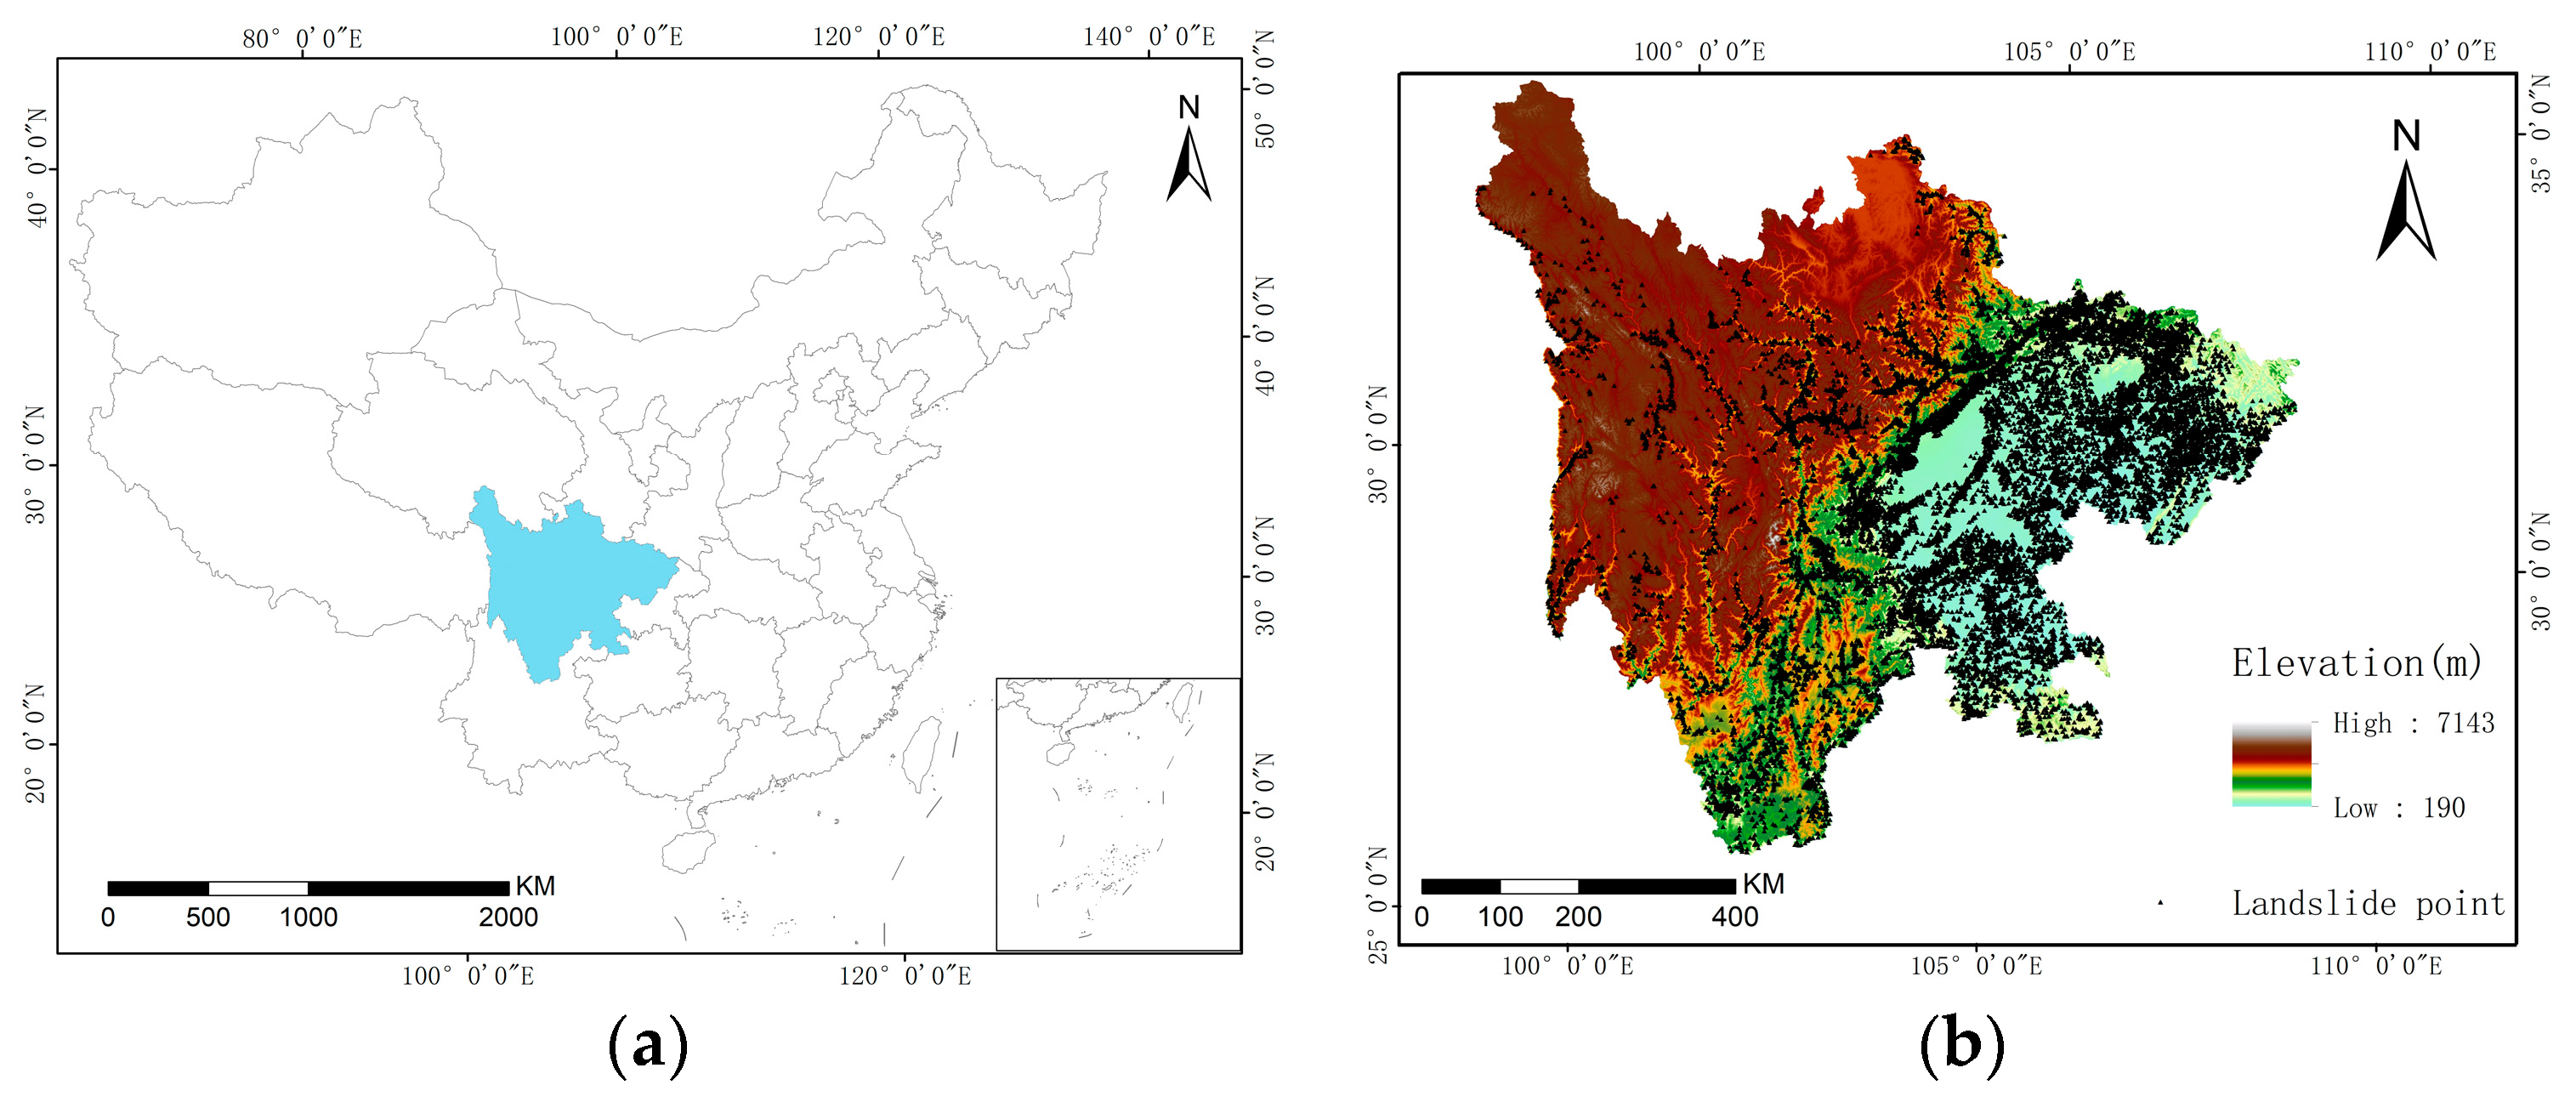
2.1. Study Area
2.2. Mathematical and Statistical Methods
- Information Value Method
- 2.
- Certainty Factor Model
2.3. Machine Learning Models
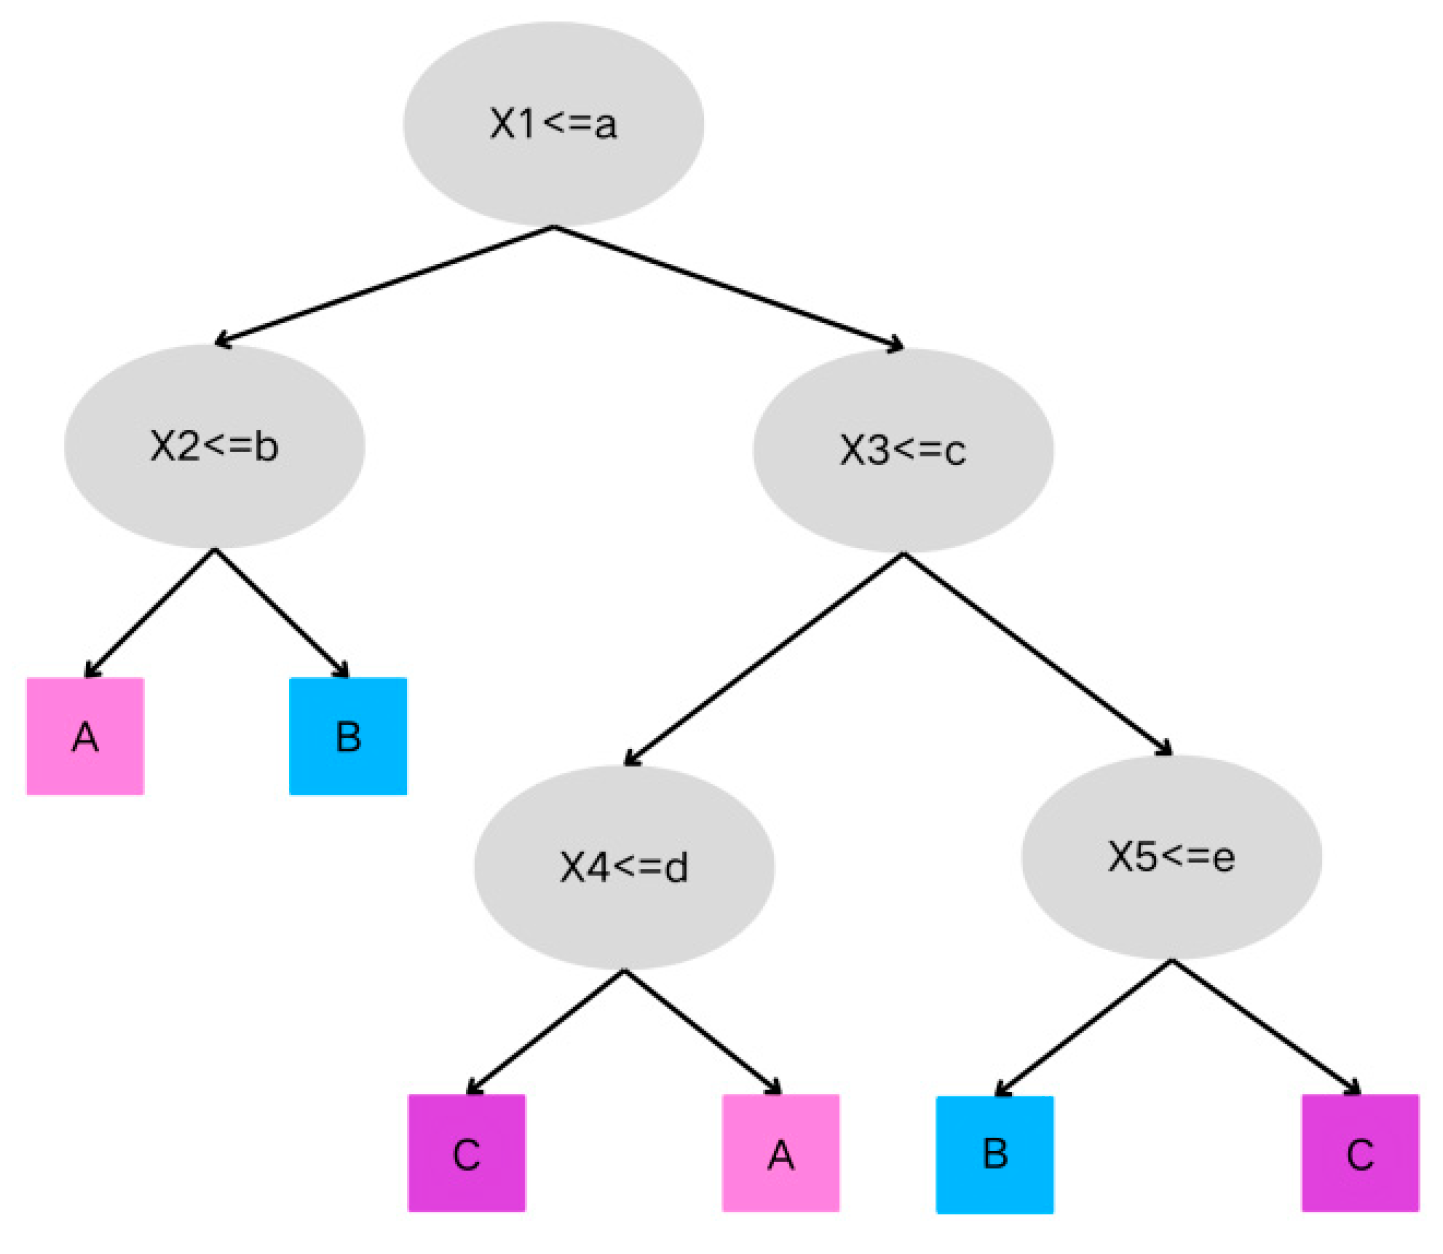
- Decision Tree C5.0 Model
- 2.
- Logistic regression model
3. Data and Impact Factors
3.1. Data Sources
3.2. Selection of Impact Factors
3.3. Covariance Diagnostics
- Elevation
- 2.
- Slope
- 3.
- Aspect
- 4.
- Plan and profile curves
- 5.
- Valley Depth (the elevation difference between valleys and upstream ridges)
- 6.
- Precipitation
- 7.
- SPI
- 8.
- TWI
- 9.
- TPI
- 10.
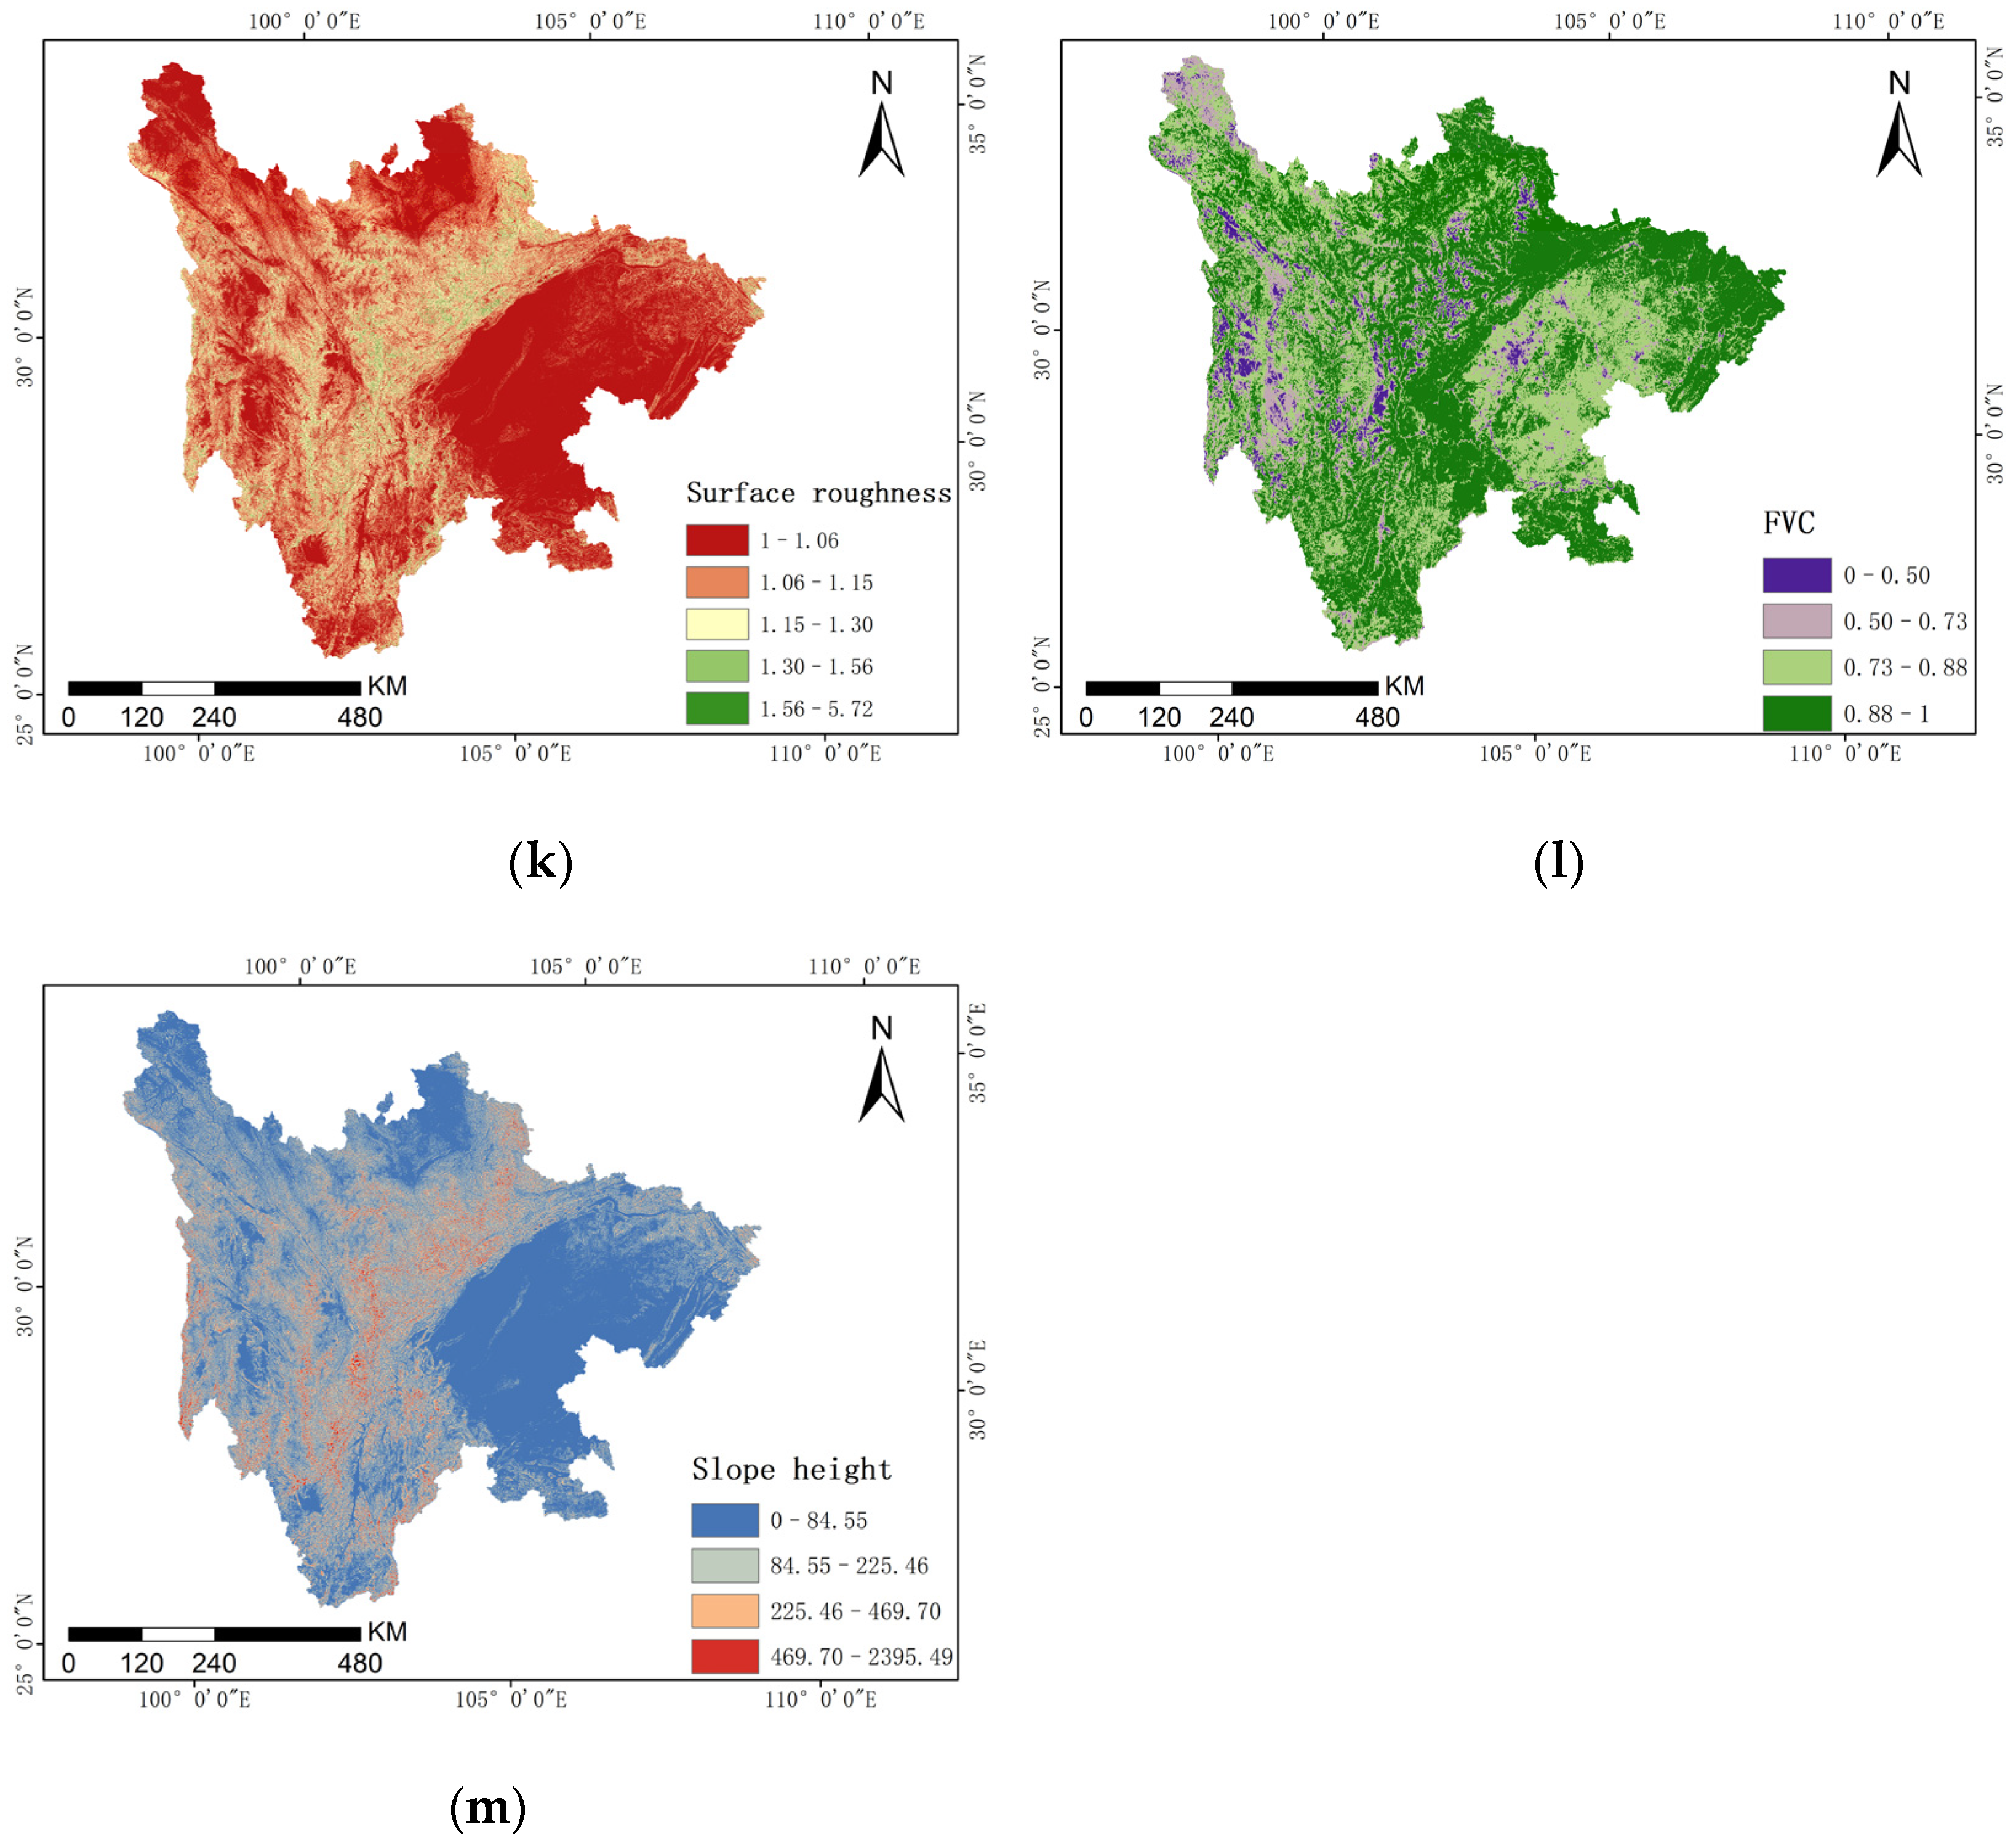
- Surface roughness
- 11.
- FVC
- 12.
- Slope Height
4. Results Analysis and Accuracy Validation
4.1. Mathematical Statistical Models
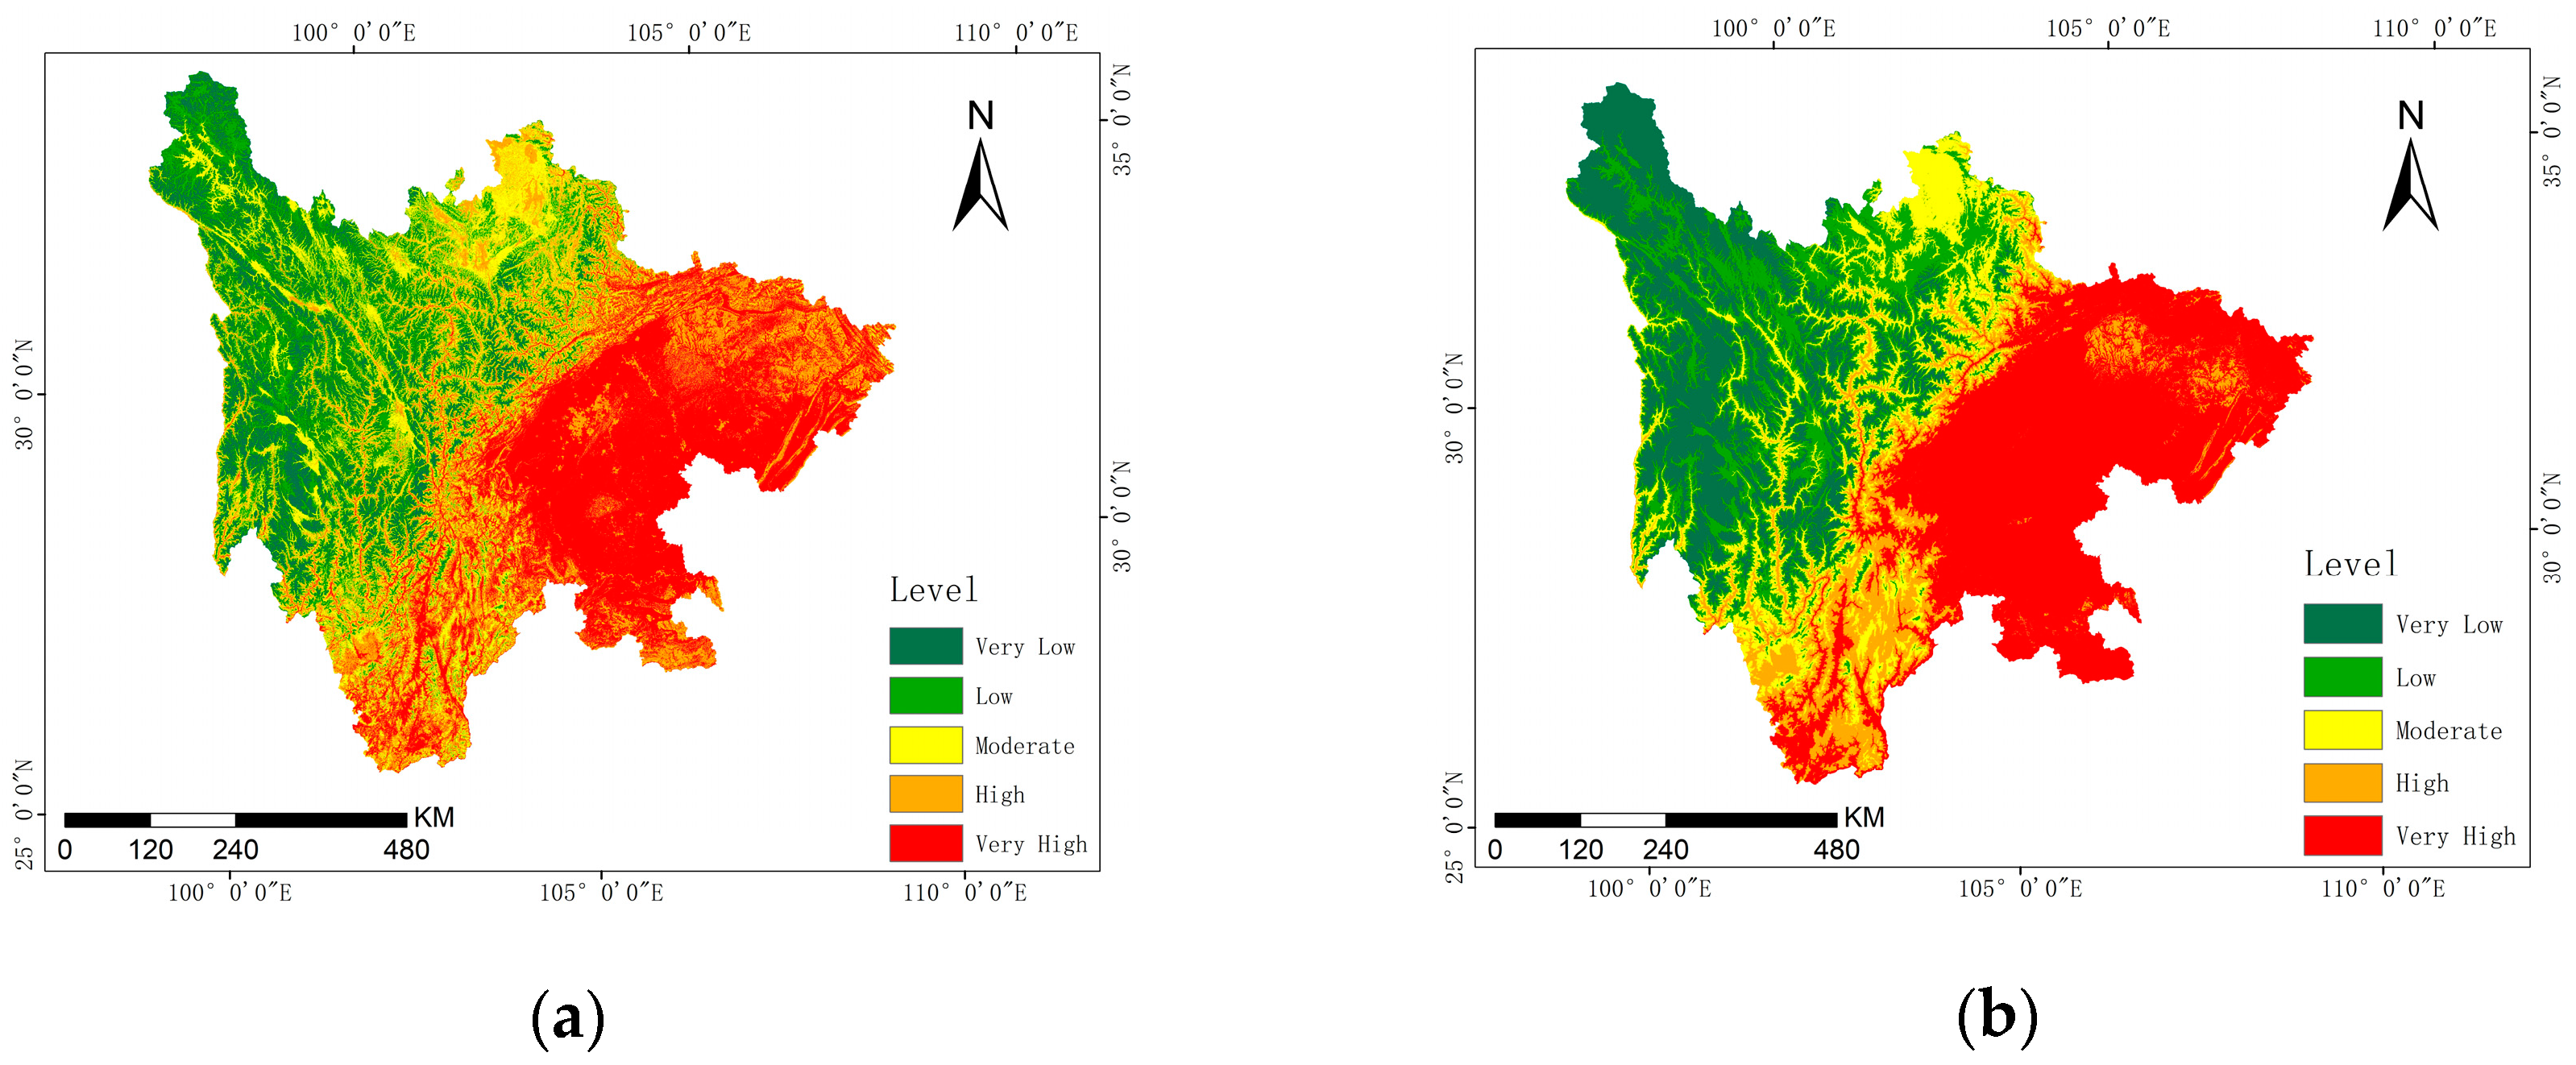
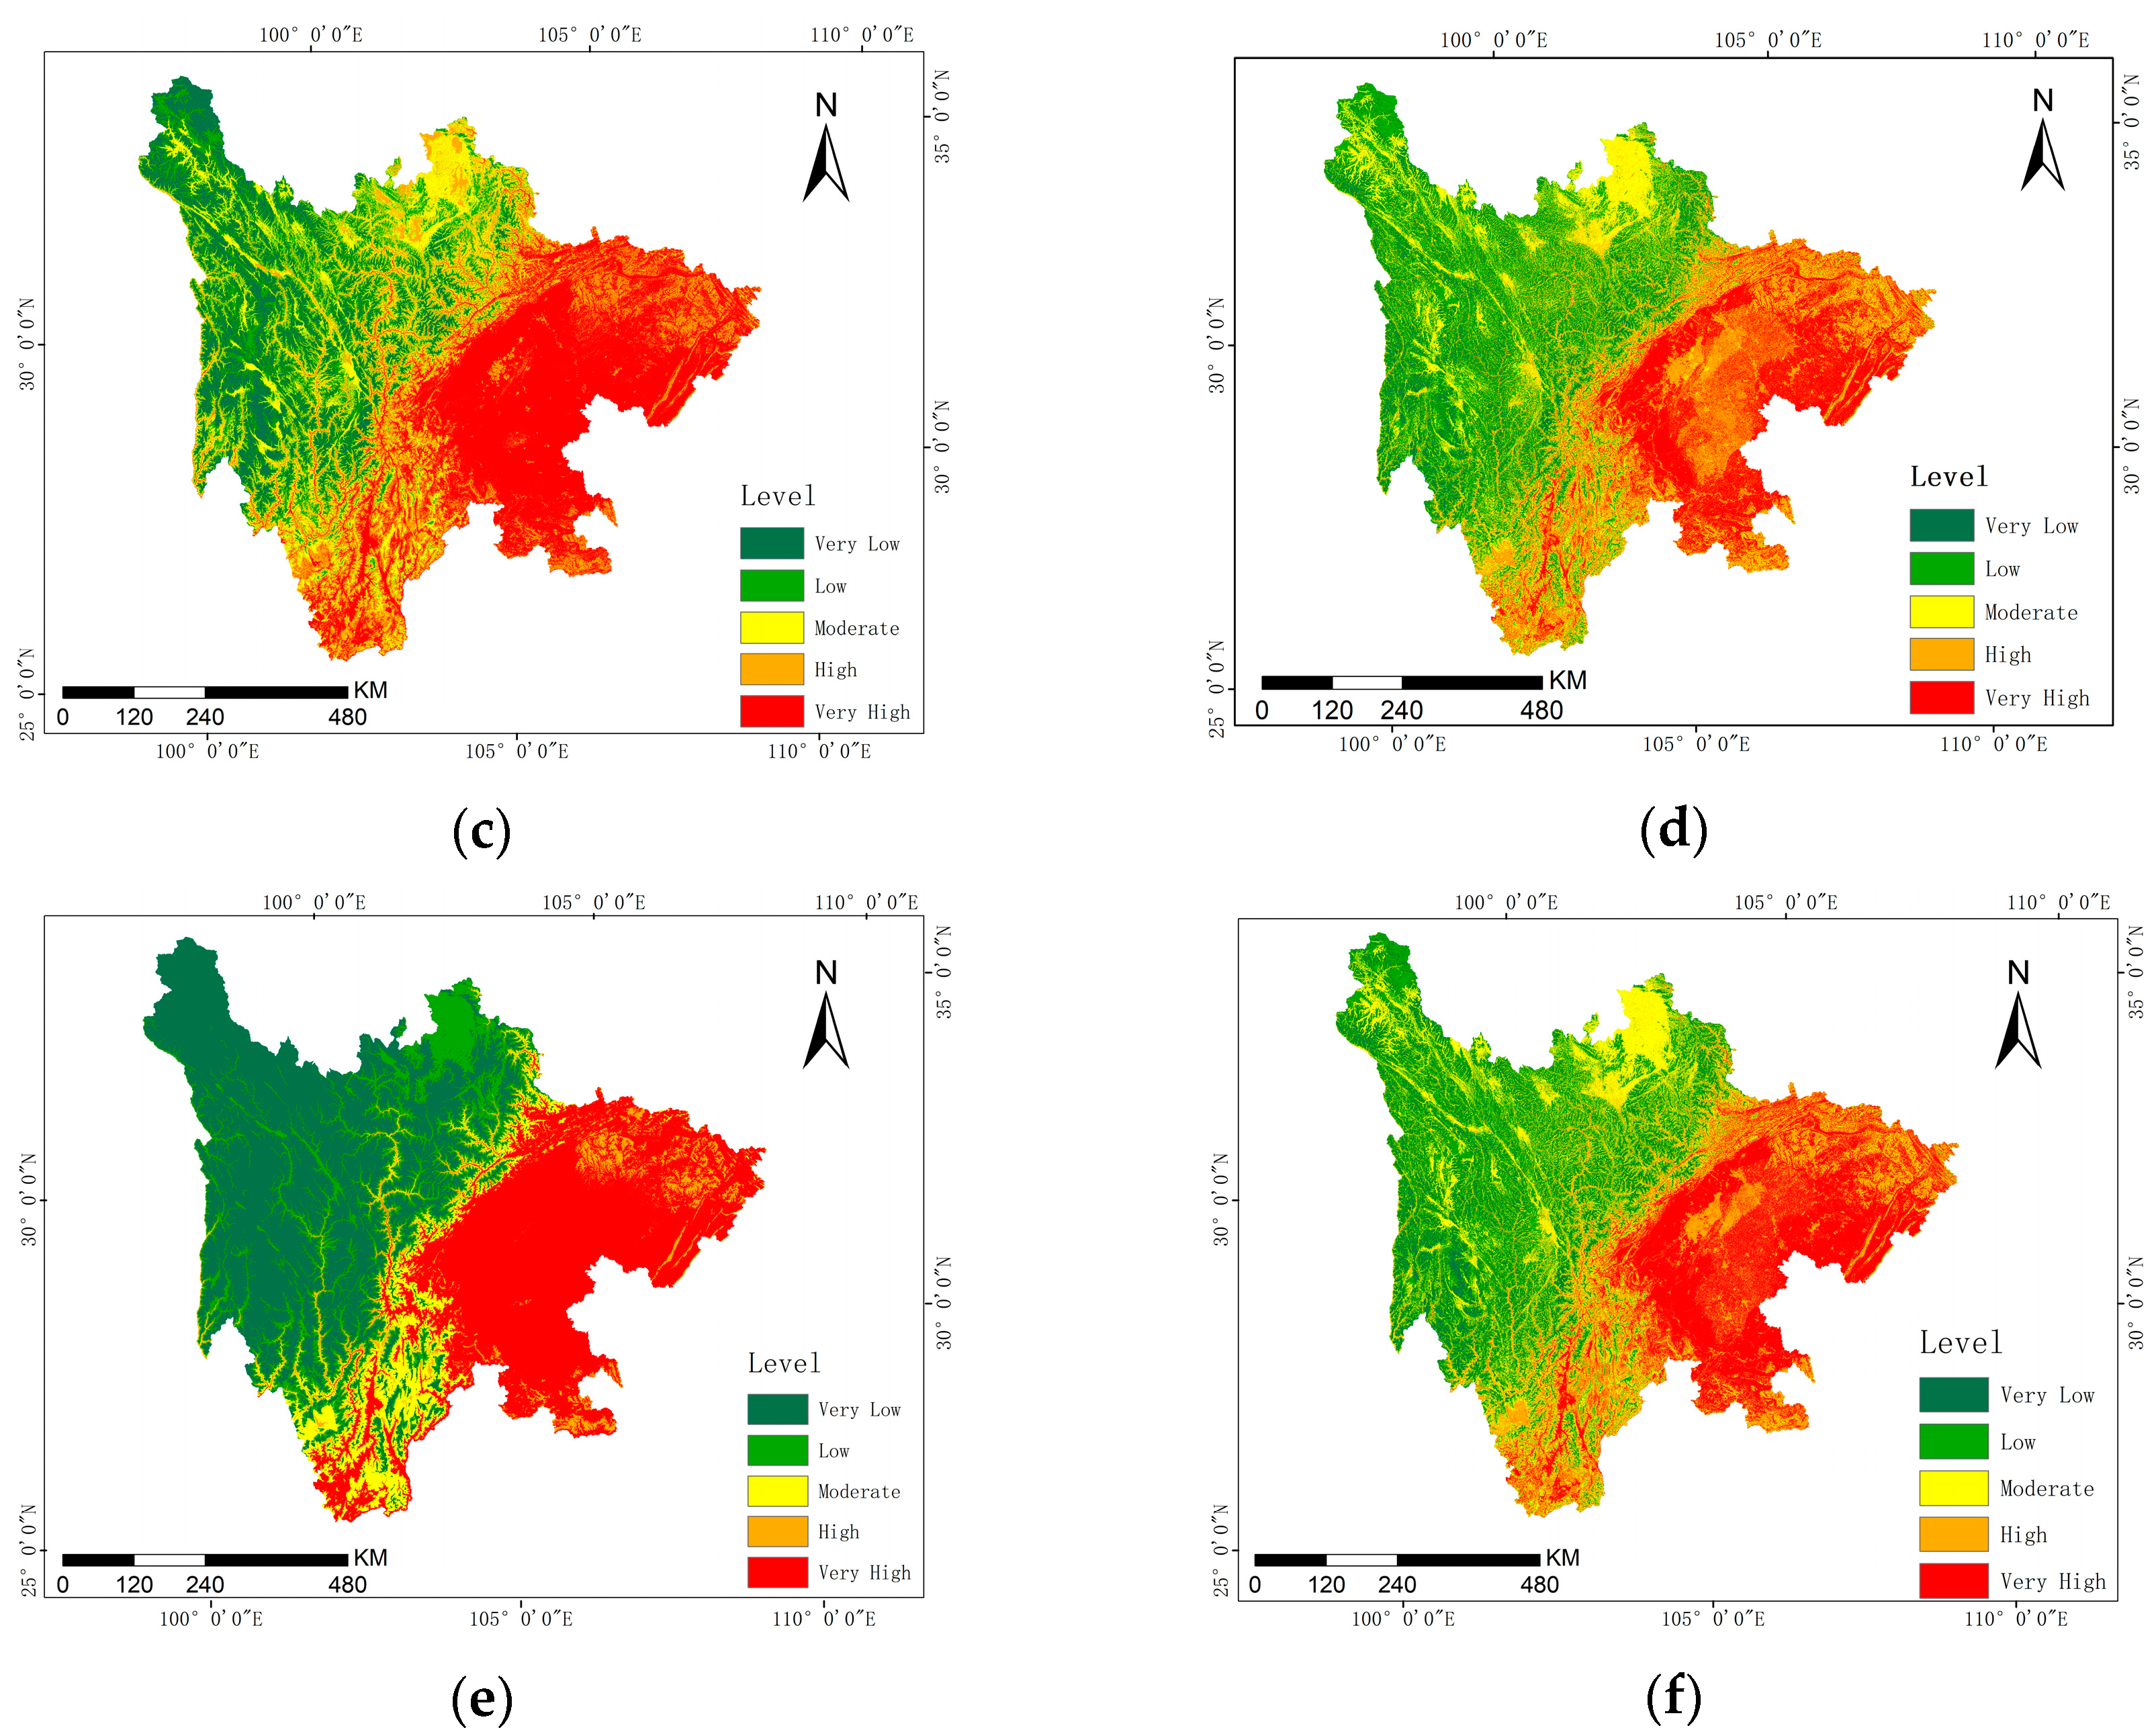
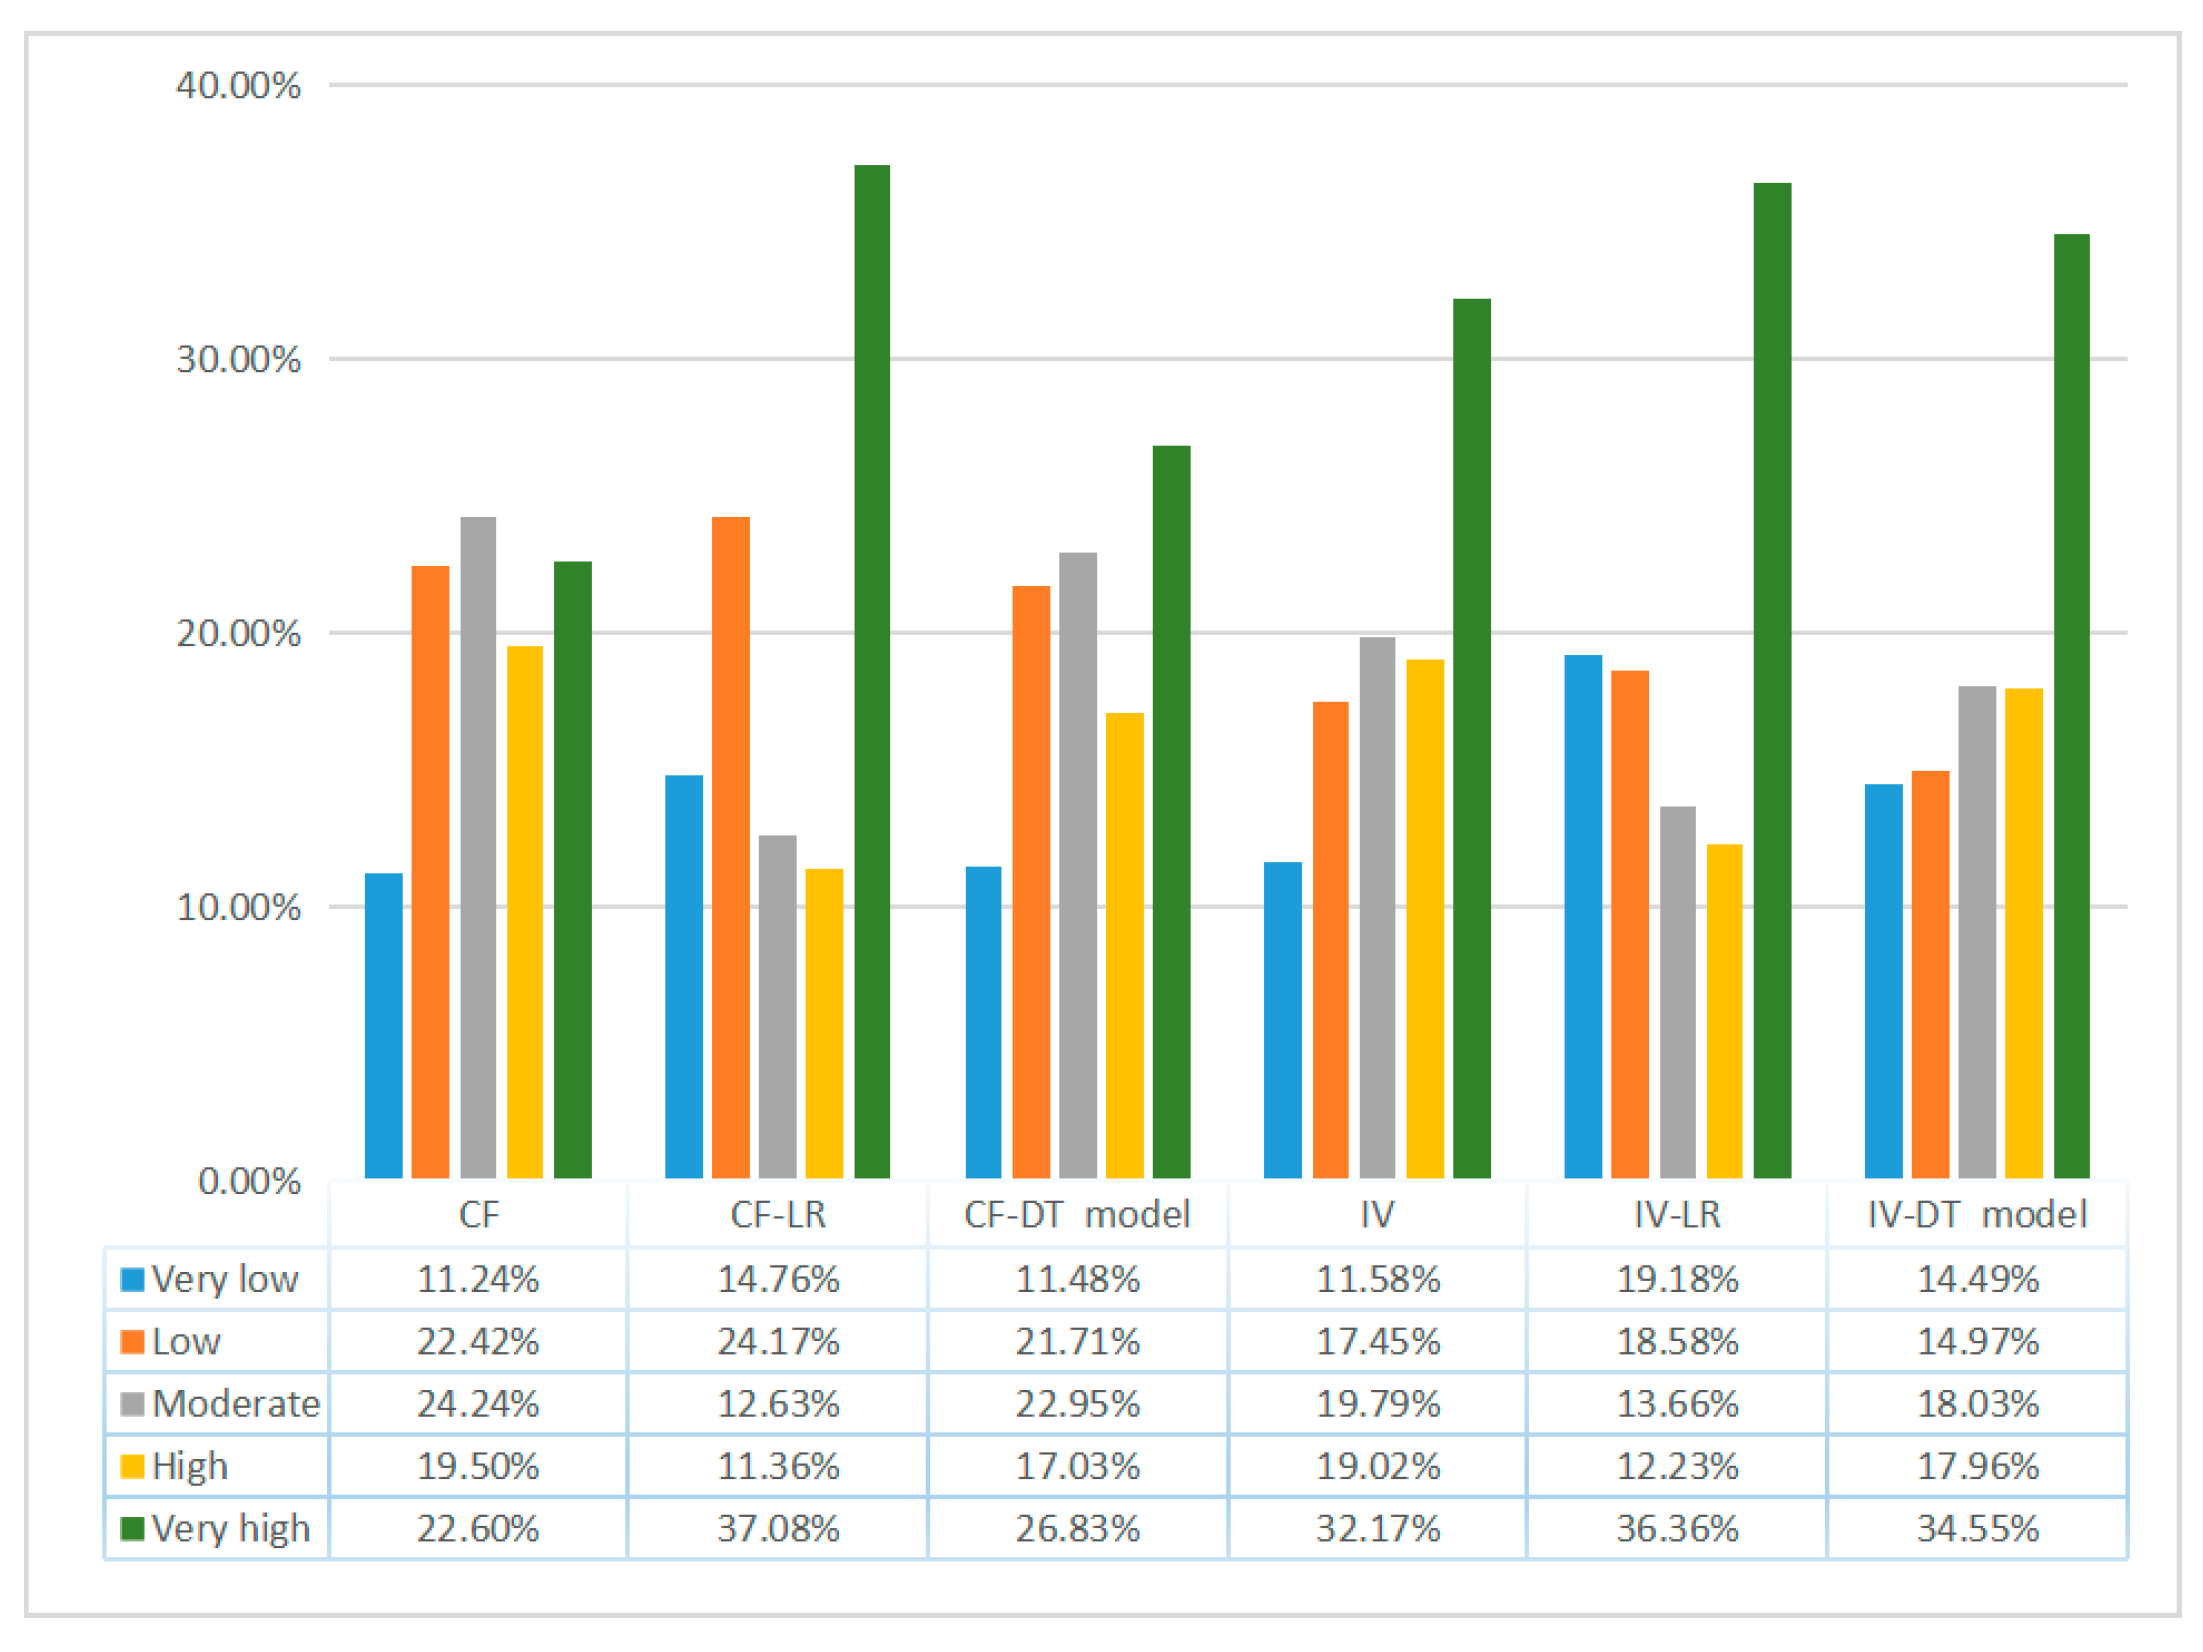
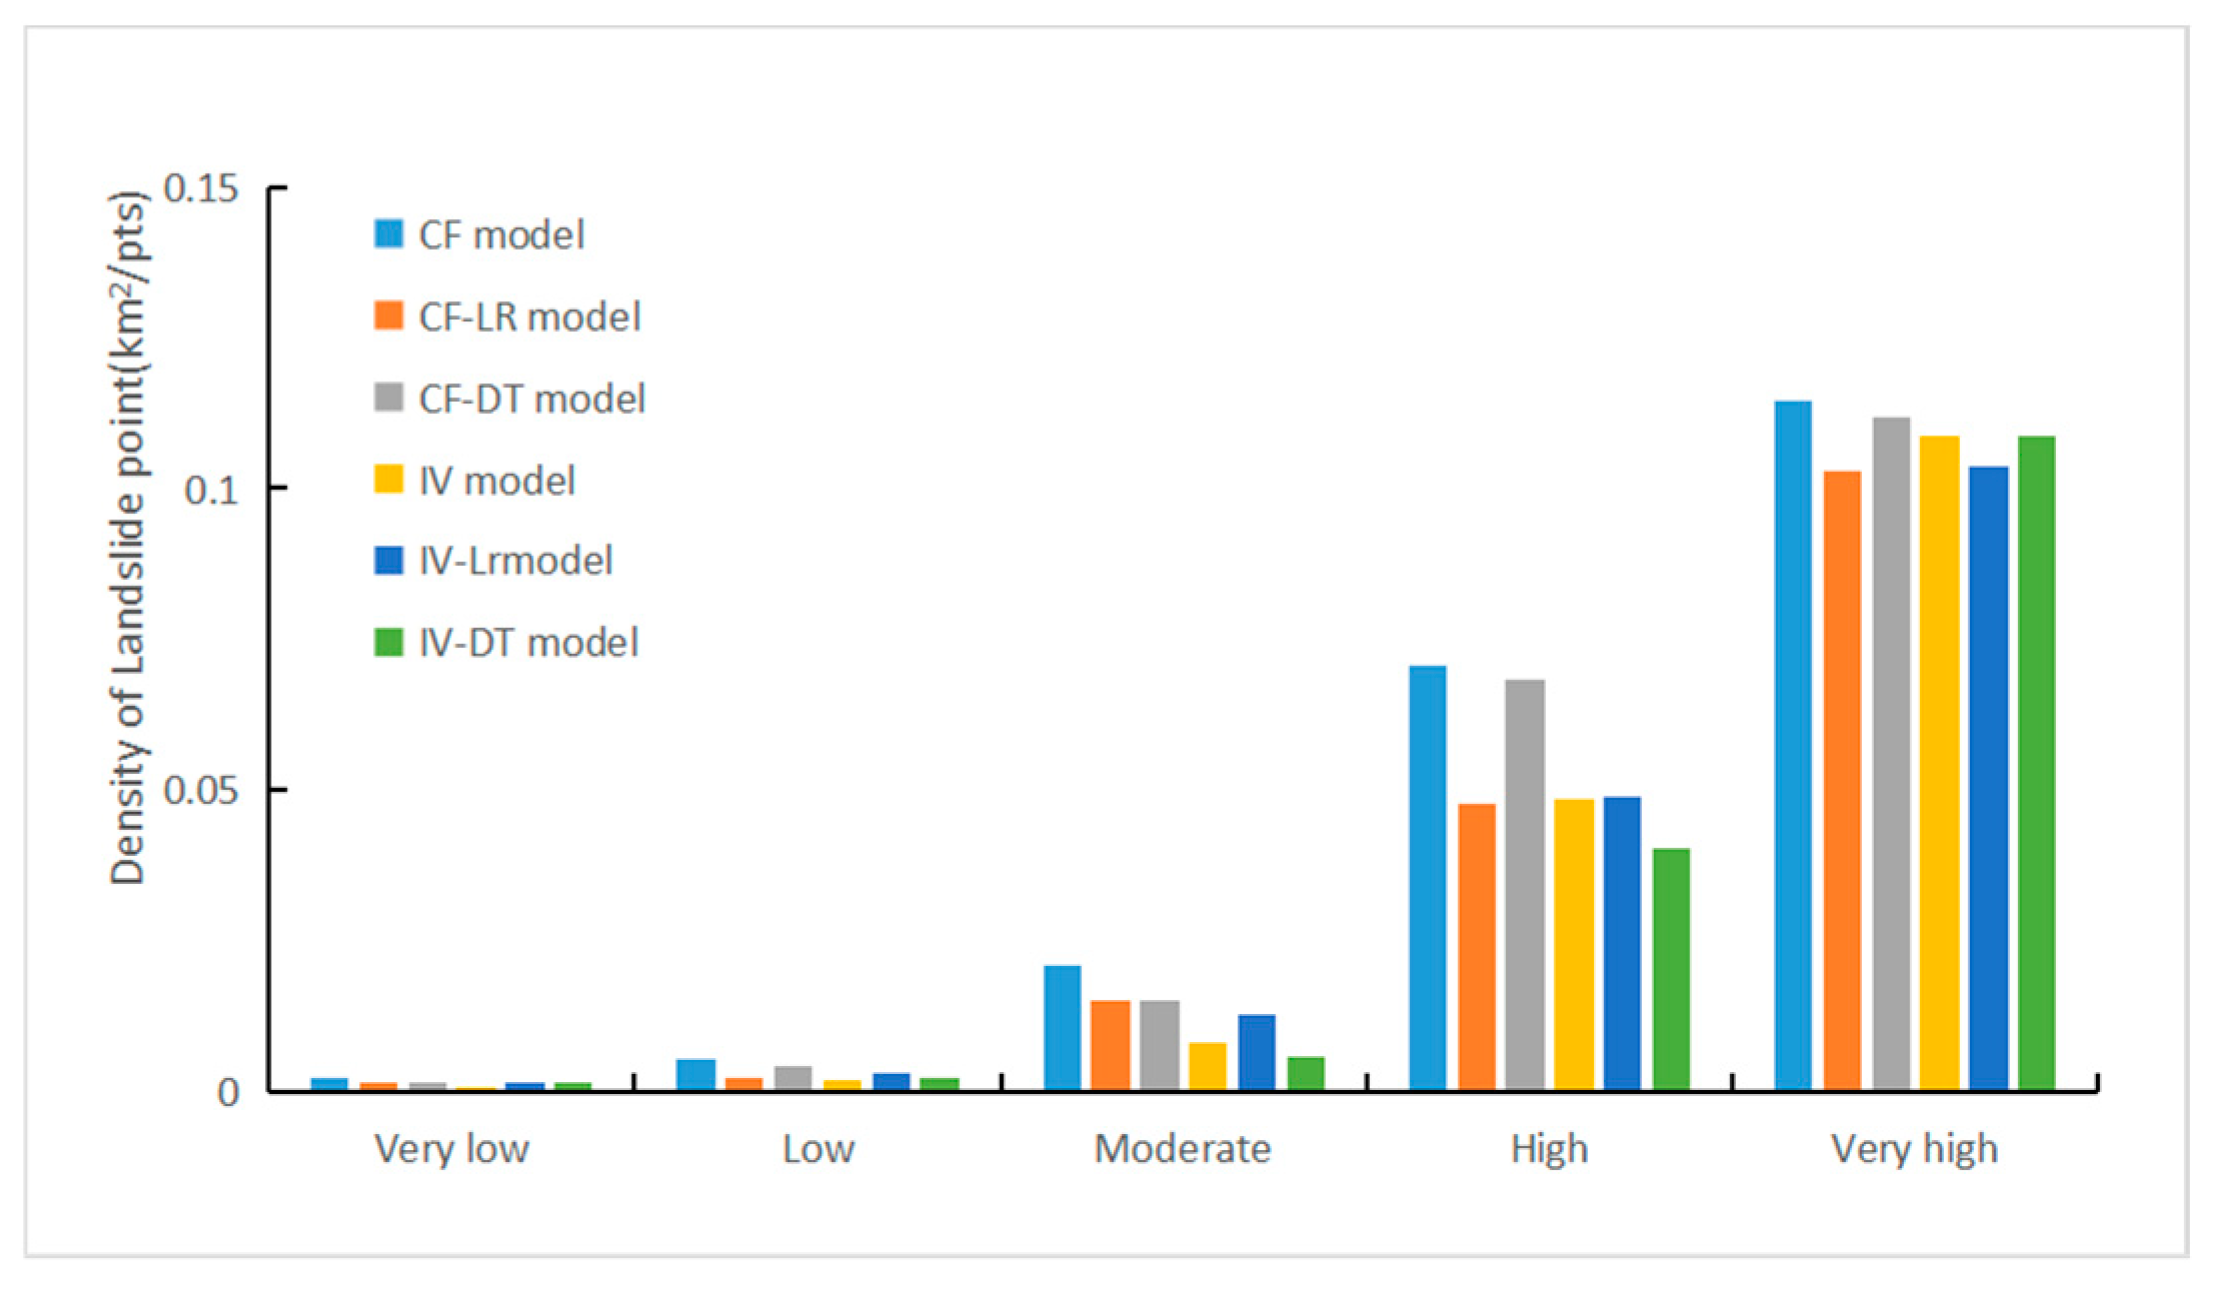
4.2. Coupled Models
4.3. Distribution of Landslide Conditions
4.4. ROC Curve Accuracy Validation
5. Conclusions
- (1)
- Risk Distribution: High- and very high-risk zones are mainly in the eastern and southeastern parts of Sichuan, covering nearly half of the province. Moderate-risk areas are distributed in a northeast–southwest linear pattern, while extremely low- and low-risk zones are concentrated in the western and northwestern regions. The models show a high consistency in risk prediction, indicating their reliability. Furthermore, the density of the landslide points increases with the elevation of the risk area.
- (2)
- Model Performance: The IV-LR model achieved the highest AUC value (0.848), while the CF model had the lowest (0.815). The coupling methods, compared to the individual models, demonstrated a superior accuracy, suggesting that combining methods improves the landslide susceptibility assessment.
- (3)
- Based on the results of this study, the landslide susceptibility analysis holds significant implications for disaster prevention and mitigation efforts. By identifying high-risk and very high-risk areas within Sichuan Province, the relevant authorities can prioritize the allocation of resources to these critical regions, thereby enhancing the monitoring of and early warning capabilities for landslides. Notably, the IV-LR model demonstrated a high predictive accuracy, providing robust support for developing scientifically grounded prevention strategies. Furthermore, the increase in the landslide point density with rising risk levels underscores the necessity of strengthening the control measures in high-risk areas. Integrating the model results, future efforts should focus on optimizing disaster prevention strategies according to specific geological and climatic conditions, thereby improving landslide risk management, reducing disaster losses, and safeguarding public safety and property.
Author Contributions
Funding
Institutional Review Board Statement
Informed Consent Statement
Data Availability Statement
Acknowledgments
Conflicts of Interest
Appendix A

| Year | Number of Geological Disasters (Incidents) | Landslides | Debris Flows | Ground Subsidence |
|---|---|---|---|---|
| 2005 | 973 | 670 | 60 | 24 |
| 2006 | 175 | 98 | 28 | 4 |
| 2007 | 295 | 156 | 46 | 6 |
| 2008 | 7707 | 4883 | 235 | 138 |
| 2009 | 6205 | 3395 | 445 | 25 |
| 2010 | 934 | 581 | 108 | 17 |
| 2011 | 2161 | 1482 | 345 | 18 |
| 2012 | 1997 | 1418 | 330 | 15 |
| 2013 | 3149 | 2267 | 466 | 11 |
| 2014 | 2758 | 442 | 442 | 9 |
| 2015 | 2758 | 1855 | 442 | 9 |
| 2016 | 349 | 153 | 121 | 0 |
| 2017 | 227 | 119 | 70 | 2 |
| 2018 | 175 | 64 | 76 | 0 |
| 2019 | 563 | 238 | 125 | 1 |
| 2020 | 725 | 302 | 287 | 0 |
| 2021 | 2513 | 1737 | 447 | 2 |
| 2022 | 403 | 239 | 85 | 3 |
| 2023 | 148 | 54 | 58 | 1 |
References
- Ali, S.A.; Parvin, F.; Vojteková, J.; Costache, J.; Linh, N.T.T.; Pham, Q.B.; Vojtek, M.; Gigović, L.; Ahmad, A.; Ghorbani, M.A. GIS-Based Landslide Susceptibility Modeling: A Comparison between Fuzzy Multi-Criteria and Machine Learning Algorithms. Geosci. Front. 2020, 12, 857–876. [Google Scholar] [CrossRef]
- Napoli, M.D.; Martire, D.D.; Bausilio, G.; Calcaterra, D.; Confuorto, P.; Firpo, M.; Pepe, G.; Cevasco, A. Rainfall-Induced Shallow Landslide Detachment, Transit and Runout Susceptibility Mapping by Integrating Machine Learning Techniques and GIS-Based Approaches. Water 2021, 13, 488. [Google Scholar] [CrossRef]
- Huang, Y.; Zhao, L. Review on landslide susceptibility mapping using support vector machines. Catena 2018, 165, 520–529. [Google Scholar] [CrossRef]
- Sun, D.; Gu, Q.; Wen, H.; Shi, S.; Mi, C.; Zhang, F. A Hybrid Landslide Warning Model Coupling Susceptibility Zoning and Precipitation. Forests 2022, 13, 827. [Google Scholar] [CrossRef]
- Wang, B.; Li, S.; Xu, W.; Yang, Y.; Li, Y. A Comparative Study of Landslide Susceptibility Evaluation Based on Three Different Machine Learning Algorithms. A Comparative Study of Landslide Susceptibility Evaluation Based on Three Different Machine Learning Algorithms. Northwestern Geol. 2024, 57, 34–43. [Google Scholar]
- Jia, J.; Mao, Y.; Meng, X.; Gao, B.; Gao, M.; Wu, W. Comparison of Landslide Susceptibility Evaluation by Deep Random Forest and Random Forest Model: A Case Study of Lueyang County, Hanzhong City. Northwestern Geol. 2023, 56, 239–249. [Google Scholar]
- Li, P.; Ye, H.; Tan, S. Evaluation of Geological Hazards in Yongde County Based on Analytic Hierarchy Process. Res. Soil Water Conserv. 2021, 28, 394–406. [Google Scholar]
- Yi, J.; Wang, F.; Cheng, Y.; Zhang, Y. Study on the risk assessment of geological disasters in alpine valley area: A case study in Aba County, Sichuan Province. Chin. J. Geol. Hazard Control 2022, 33, 134–142. [Google Scholar]
- Moragues, S.; Lenzano, M.G.; Lanfri, M.; Moreiras, S.; Lannutti, E.; Lenzano, L. Analytic hierarchy process applied to landslide susceptibility mapping of the North Branch of Argentino Lake, Argentina. Nat. Hazards 2021, 105, 915–941. [Google Scholar] [CrossRef]
- Chen, Y.; Yang, H.; Zhong, Y. Evaluation of landslide susceptibility based on IV-IOE-LR coupling model—A case study of Lushui city, Yunnan. Ind. Miner. Process. 2023, 52, 62–79. [Google Scholar]
- Fan, H.; Lu, Y.; Hu, Y.; Fang, J.; Lv, C.; Xu, C.; Feng, X.; Liu, Y. A Landslide Susceptibility Evaluation of Highway Disasters Based on the Frequency Ratio Coupling Model. Sustainability 2022, 14, 7740. [Google Scholar] [CrossRef]
- Zhang, S.; Tan, S.; Zhou, J.; Sun, Y.; Ding, D.; Li, J. Geological Disaster Susceptibility Evaluation of a Random-Forest-Weighted Deterministic Coefficient Model. Sustainability 2023, 15, 12691. [Google Scholar] [CrossRef]
- Shirani, K.; Pasandi, M.; Arabameri, A. Landslide susceptibility assessment by Dempster–Shafer and Index of Entropy models, Sarkhoun basin, Southwestern Iran. Nat. Hazards 2018, 93, 1379–1418. [Google Scholar] [CrossRef]
- Wen, H.; Wu, X.; Ling, S.; Sun, C.; Qiang, L.; Zhou, G. Characteristics and susceptibility assessment of the earthquake-triggered landslides in moderate-minor earthquake prone areas at southern margin of Sichuan Basin, China. Bull. Eng. Geol. Environ. 2022, 81, 346. [Google Scholar] [CrossRef]
- Bhandari, B.P.; Dhakal, S.; Tsou, C.-Y. Assessing the Prediction Accuracy of Frequency Ratio, Weight of Evidence, Shannon Entropy, and Information Value Methods for Landslide Susceptibility in the Siwalik Hills of Nepal. Sustainability 2024, 16, 2092. [Google Scholar] [CrossRef]
- Holloway, J.; Mengersen, K. Statistical Machine Learning Methods and Remote Sensing for Sustainable Development Goals: A Review. Remote Sens. 2018, 10, 1365. [Google Scholar] [CrossRef]
- Liu, X.; Shao, S.; Shao, S. Landslide susceptibility prediction and mapping in Loess Plateau based on different machine learning algorithms by hybrid factors screening: Case study of Xunyi County, Shaanxi Province, China. Adv. Space Res. 2024, 74, 192–210. [Google Scholar] [CrossRef]
- Agboola, G.; Beni, L.H.; Elbayoumi, T.; Thompson, G. Optimizing landslide susceptibility mapping using machine learning and geospatial techniques. Ecol. Inf. 2024, 81, 102583. [Google Scholar] [CrossRef]
- Huang, F.; Cao, Z.; Jiang, S.; Zhou, C.; Huang, J.; Guo, Z. Landslide susceptibility prediction based on a semi-supervised multiple-layer perceptron model. Landslides 2020, 17, 2919–2930. [Google Scholar] [CrossRef]
- Su, Y.; Chen, Y.; Lai, X.; Huang, S.; Lin, C.; Xie, X. Feature adaptation for landslide susceptibility assessment in ”no sample“ areas. Gondwana Res. 2024, 131, 1–17. [Google Scholar] [CrossRef]
- Li, Y.; Wang, X.; Mao, H. Influence of human activity on landslide susceptibility development in the Three Gorges area. Nat. Hazards 2020, 104, 2115–2151. [Google Scholar] [CrossRef]
- Orhan, O.; Bilgilioglu, S.S.; Kaya, Z.; Ozcan, A.K.; Bilgilioglu, H. Assessing and mapping landslide susceptibility using different machine learning methods. Geocarto Int. 2020, 37, 2795–2820. [Google Scholar] [CrossRef]
- Yang, C.; Liu, L.; Huang, F.; Huang, L.; Wang, X. Machine learning-based landslide susceptibility assessment with optimized ratio of landslide to non-landslide samples. Gondwana Res. 2023, 123, 198–216. [Google Scholar] [CrossRef]
- Fan, H.; Lu, Y.; Shao, S.; Li, L.; Wang, Y.; Lu, M.; Li, J.; Yao, K.; Sun, Y. Evaluation and analysis of statistical and coupling models for highway landslide susceptibility. Geomat. Nat. Hazards Risk 2023, 14, 2167612. [Google Scholar] [CrossRef]
- Wang, H.; Xu, J.; Tan, S.; Zhou, J. Landslide Susceptibility Evaluation Based on a Coupled Informative–Logistic Regression Model—Shuangbai County as an Example. Sustainability 2023, 15, 12449. [Google Scholar] [CrossRef]
- Chen, W.; Peng, J.; Hong, H.; Shahabi, H.; Pradhan, B.; Liu, J.; Zhu, A.; Pei, X.; Duan, Z. Landslide susceptibility modelling using GIS-based machine learning techniques for Chongren County, Jiangxi Province, China. Sci. Total Environ. 2018, 626, 1121–1135. [Google Scholar] [CrossRef]
- Ngo, P.T.T.; Panahi, M.; Khosravi, K.; Ghorbanzadeh, O.; Kariminejad, N.; Cerda, A.; Lee, S. Evaluation of deep learning algorithms for national scale landslide susceptibility mapping of Iran. Geosci. Front. 2021, 12, 505–519. [Google Scholar]
- Kavzoglu, T.; Teke, A. Predictive Performances of ensemble machine learning algorithms in landslide susceptibility mapping using random forest, extreme gradient boosting (XGBoost) and natural gradient boosting (NGBoost). Arab. J. Sci. Eng. 2022, 47, 7367–7385. [Google Scholar] [CrossRef]
- Xue, Y.; He, S.; Wu, S. Assessment of Social Vulnerability to Natural Disasters in Sichuan Province. North China Earthq. Sci. 2018, 36, 33–40. [Google Scholar]
- Wang, W.; He, Z.; Han, Z.; Li, Y.; Dou, J.; Huang, J. Mapping the susceptibility to landslides based on the deep belief network: A case study in Sichuan Province, China. Nat. Hazards 2020, 103, 3239–3261. [Google Scholar] [CrossRef]
- Hou, F.; Wu, G.; Zhang, S. Evaluation of landslide susceptibility in Jinsha River Gorge section based on information method. Sichuan Arch. 2019, 39, 147–150. [Google Scholar]
- Zhang, Q.; Ling, S.; Li, X.; Sun, C.; Xu, J.; Huang, T. Comparison of landslide susceptibility mapping rapid assessment models in Jiuzhaigou County, Sichuan province, China. Rock Mech. Rock Eng. 2020, 39, 1595–1610. [Google Scholar]
- Xu, C.; Dai, F.; Yao, X.; Zhao, Z.; Xiao, J. GIS platform and certainty factor analysis method based Wen Chuan earthquake-induced landslide susceptibility evaluation. Eng. Geol. 2010, 18, 15–25. [Google Scholar]
- Zhang, Z. A comparative study of landslide susceptibility in Wangmu County coupled with MaxEnt modeling. J. Chifeng Univ. 2022, 38, 108–113. [Google Scholar]
- Kadavi, P.R.; Lee, C.; Lee, S. Landslide-susceptibility mapping in Gangwon-do, South Korea, using logistic regression and decision tree models. Environ. Earth Sci. 2019, 78, 116. [Google Scholar] [CrossRef]
- Zhao, J.; Chen, H.; Yang, S.; Ma, Z. Landslide risk assessment based on decision tree arithmetic. J. Zhejiang Univ. 2004, 31, 465–470. [Google Scholar]
- Sun, D.; Wen, H.; Xu, J.; Zhang, Y.; Wang, D.; Zhang, J. Improving Geospatial Agreement by Hybrid Optimization in Logistic Regression-Based Landslide Susceptibility Modelling. Front. Earth Sci. 2021, 9, 713803. [Google Scholar] [CrossRef]
- Li, K.; Su, Q.; Zhang, X.; Fan, J.; Bai, D. Evaluation of Landslide Susceptibility in Xishan Coalfield Based on Information Value Method Coupled with Machine Learning Model. Radio Eng. 2024, 54, 390–401. [Google Scholar]
- Che, W.; Qin, S.; Miao, Q.; Su, G.; Chen, Y.; Yao, J. Study on Factor Classification Method in the Evaluation of landslide sensitivity. In Proceedings of the 11th National Engineering Geology Conference, Wuhan, China, 16–18 October 2020. [Google Scholar]
- Günther, A.; Reichenbach, P.; Malet, J.; Eeckhaut, M.V.D.; Hervás, J.; Dashwood, C.; Guzzetti, F. Tier-based approaches for landslide susceptibility assessment in Europe. Landslides 2013, 10, 529–546. [Google Scholar] [CrossRef]
- Wu, X.; Wang, L.; Ding, Z.; Zhang, X.; Zhou, Y.; Wang, Y. The susceptibility evaluation of township landslide in HengDuan mountain area of Yunnan. Geol. Hazards Environ. Preserv. 2023, 4, 13–19. [Google Scholar]
- Liu, M. Research on Sensitivity of Influence Factors on Soil Landslide Stability—Taking Qingchuan Earthquake-Stricken Areas as An Example. Master’s Thesis, Chengdu University of Technology, Chengdu, China, June 2011. [Google Scholar]
- Liu, M.; Chen, X.; Yang, S. Zonation of landslide risk with logistic regression model and certainty factor. Eng. Geol. 2014, 22, 1250–1256. [Google Scholar]
- Wang, J. Landslide Risk Assessment in Wanzhou Country, Three Gorges Reservoir. Ph.D. Thesis, China University of Geosciences, Wuhan, China, June 2015. [Google Scholar]
- Wang, G.; Lei, X.; Chen, W.; Shahabi, H.; Shirzadi, A. Hybrid Computational Intelligence Methods for Landslide Susceptibility Mapping. Symmetry 2020, 12, 325. [Google Scholar] [CrossRef]
- Kadirhodjaev, A.; Rezaie, F.; Lee, M.; Lee, S. Landslide Susceptibility Assessment Using an Optimized Group Method of Data Handling Mode. ISPRS Int. J. Geo-Inf. 2020, 9, 566. [Google Scholar] [CrossRef]
- Mai, J.; Xi, Y.; Liu, G. Predicting Potential Rainfall- Triggered Landslides Sites in Guangdong Province (China) using MaxEnt Model under Climate Changes Scenarios. Int. J. Geog. Inf. Sci. 2021, 23, 2042–2054. [Google Scholar]
- Moore, I.D.; Gearson, R.B.; Ladson, A.R. Digital terrain modelling: A review of hydrological, geomorphological, and biological applications. Hydrol. Proc. 1991, 5, 3–30. [Google Scholar] [CrossRef]
- He, Q.; Shahabi, H.; Ataollah, S.; Li, S.; Chen, W.; Wang, N.; Chai, H.; Bian, H.; Ma, J.; Chen, Y.; et al. Landslide spatial modelling using novel bivariate statistical based Naïve Bayes, RBF Classifier, and RBF Network machine learning algorithms. Sci. Total Environ. 2019, 663, 1–15. [Google Scholar] [CrossRef] [PubMed]
- Zeng, T.; Wang, L.; Zhang, Y.; Cheng, P.; Wu, F. Landslide susceptibility modeling and interpretability based on CatBoost-SHAP model. Chin. J. Geol. Hazard Control 2024, 35, 37–50. [Google Scholar]
- Zhao, Z. Landslide Susceptibility Evaluation Based on Spatial Database and Machine Learning: A Case Study of Xinyuan County. Master’s Thesis, Xinjiang University, Ürümqi, China, June 2020. [Google Scholar]
- Qiu, H.; Regmi, A.D.; Cui, P.; Cao, M.; Lee, J.; Zhu, X. Size distribution of loess slides in relation to local slope height within different slope morphologies. Catena 2016, 145, 155–163. [Google Scholar] [CrossRef]
- Cantarino, I.; Carrion, M.A.; Goerlich, F.; Ibañez, V.M. A ROC analysis-based classification method for landslide susceptibility maps. Landslides 2019, 16, 265–282. [Google Scholar] [CrossRef]


| Factor | Tolerance | VIF | Factor | Tolerance | VIF |
|---|---|---|---|---|---|
| Elevation | 0.583 | 1.717 | SPI | 0.312 | 3.205 |
| Slope | 0.220 | 4.545 | TWI | 0.326 | 3.066 |
| Aspect | 0.992 | 1.008 | TPI | 0.705 | 1.419 |
| Plan curve | 0.634 | 1.577 | Surface roughness | 0.304 | 3.291 |
| Profile curve | 0.601 | 1.663 | TWI | 0.838 | 1.193 |
| Valley depth | 0.607 | 1.646 | Slope height | 0.603 | 1.658 |
| Precipitation | 0.597 | 1.675 |
| Landslide Evaluation Factors | Classification | Number of Landslide Points/pts | Classified Area/km2 | IV | CF |
|---|---|---|---|---|---|
| Elevation (m) | 190~947 | 13,838 | 139,307.13 | 0.76731 | 0.56164 |
| 947~1894 | 5864 | 52,958.20 | 0.87591 | 0.61173 | |
| 1894~2862 | 2490 | 54,838.27 | −0.01553 | −0.01614 | |
| 2862~3649 | 964 | 70,326.52 | −1.21324 | −0.71253 | |
| 3649~4261 | 298 | 94,711.69 | −2.68492 | −0.93471 | |
| 4261~7143 | 61 | 97,758.19 | −4.30280 | −0.98709 | |
| Slope (°) | 0~7.56 | 6344 | 133,091.41 | 0.03179 | 0.03280 |
| 7.56~16.33 | 7590 | 122,597.76 | 0.29324 | 0.26646 | |
| 16.33~25.09 | 5335 | 117,720.17 | −0.01871 | −0.01941 | |
| 25.09~34.77 | 2997 | 92,670.65 | −0.35612 | −0.30963 | |
| 34.77~77.10 | 1245 | 43,090.92 | −0.46886 | −0.38542 | |
| Aspect | −1~34.39 | 1997 | 44,950.31 | −0.03860 | −0.03962 |
| 34.39~69.77 | 2309 | 48,636.40 | 0.02776 | 0.02870 | |
| 69.77~105.17 | 2737 | 55,293.06 | 0.06953 | 0.07042 | |
| 105.17~141.97 | 2822 | 55,917.75 | 0.08888 | 0.08916 | |
| 141.97~178.77 | 2594 | 51,414.75 | 0.08859 | 0.08888 | |
| 178.77~215.58 | 2183 | 48,367.48 | −0.02281 | −0.02362 | |
| 215.58~250.97 | 2090 | 49,126.10 | −0.08191 | −0.08214 | |
| 250.97~286.36 | 2250 | 54,098.21 | −0.10456 | −0.10358 | |
| 286.36~321.74 | 2202 | 50,808.30 | −0.06338 | −0.06419 | |
| 321.74~359.96 | 2327 | 50,558.54 | −0.00324 | −0.00339 | |
| Plan curve | −8.15~−0.27 | 1870 | 46,660.81 | −0.14039 | −0.13645 |
| −0.27~0.14 | 15,420 | 324,460.31 | 0.03008 | 0.03106 | |
| 0.14~6.63 | 6225 | 138,778.88 | −0.02773 | −0.02864 | |
| Profile curve | −6.01~−0.24 | 2277 | 70,903.92 | −0.36189 | −0.31372 |
| −0.24~0.19 | 14,813 | 325,580.89 | −0.01353 | −0.01408 | |
| 0.19~6.26 | 6425 | 113,415.19 | 0.20572 | 0.19493 | |
| Valley depth | −585~−276.43 | 934 | 104,816.84 | −1.64392 | −0.81403 |
| −276.43~519.09 | 3355 | 135,899.21 | −0.62489 | −0.47644 | |
| 519.09~749.61 | 6953 | 135,408.95 | 0.10745 | 0.10680 | |
| 749.61~1004.40 | 5149 | 81,580.20 | 0.31379 | 0.28235 | |
| 1004.40~1344.12 | 4370 | 39,889.34 | 0.86523 | 0.60704 | |
| 1344.12~2508.88 | 2754 | 12,305.46 | 1.57959 | 0.83232 | |
| Precipitation (mm) | 303.25~732.01 | 1554 | 44,519.13 | −0.27837 | −0.25177 |
| 732.01~886.36 | 2685 | 102,990.07 | −0.57023 | −0.44624 | |
| 886.36~1017.85 | 5470 | 129,631.35 | −0.08870 | −0.08862 | |
| 1017.85~1149.34 | 6068 | 104,914.83 | 0.22660 | 0.21256 | |
| 1149.34~1309.40 | 5270 | 86,028.96 | 0.28407 | 0.25924 | |
| 1309.40~1761.03 | 2466 | 41,845.09 | 0.24534 | 0.22808 | |
| SPI | −13.81~−10.28 | 1660 | 45,712.77 | −0.23991 | −0.22134 |
| −10.28~−5.83 | 6010 | 134,011.18 | −0.02884 | −0.02977 | |
| −5.83~−1.61 | 4883 | 107,532.39 | −0.01638 | −0.01702 | |
| −1.61~0.44 | 6767 | 155,616.51 | −0.05968 | −0.06057 | |
| 0.44~3.52 | 2843 | 54,786.87 | 0.11706 | 0.11582 | |
| 3.52~15.26 | 1349 | 11,705.66 | 0.91495 | 0.62847 | |
| TWI | 2.05~5.20 | 7430 | 196,949.33 | −0.20177 | −0.18988 |
| 5.20~6.97 | 9709 | 190,209.15 | 0.10058 | 0.10032 | |
| 6.97~9.53 | 3752 | 81,459.60 | −0.00216 | −0.00227 | |
| 9.53~13.36 | 1701 | 31,524.24 | 0.15611 | 0.15153 | |
| 13.36~27.12 | 920 | 9223.06 | 0.77057 | 0.56325 | |
| TPI | −310.39~−14.75 | 1386 | 25,236.75 | 0.17461 | 0.16796 |
| −14.75~−6.76 | 6377 | 111,620.64 | 0.21408 | 0.20203 | |
| −6.76~1.23 | 10,301 | 243,522.16 | −0.08648 | −0.08650 | |
| 1.23~11.89 | 4663 | 106,020.09 | −0.04748 | −0.04850 | |
| 11.89~368.80 | 790 | 23,499.23 | −0.31620 | −0.28052 | |
| Surface roughness | 1~1.06 | 14,575 | 265,304.23 | 0.17413 | 0.16754 |
| 1.06~1.15 | 5766 | 138,199.78 | −0.10102 | −0.10027 | |
| 1.15~1.30 | 2472 | 84,701.59 | −0.45841 | −0.37876 | |
| 1.30~1.56 | 624 | 19,267.98 | −0.35435 | −0.30836 | |
| 1.56~5.72 | 74 | 1892.43 | −0.16586 | −0.15905 | |
| FVC | 0~0.50 | 180 | 18,681.15 | −1.56552 | −0.79872 |
| 0.50~0.73 | 1516 | 57,141.71 | −0.55266 | −0.43616 | |
| 0.73~0.88 | 9286 | 189,037.80 | 0.06336 | 0.06436 | |
| 0.88~1 | 12,528 | 245,042.68 | 0.10333 | 0.10291 | |
| Slope height | 0~84.55 | 18,467 | 302,731.60 | 0.27971 | 0.25580 |
| 84.55~225.46 | 4140 | 139,212.17 | −0.43873 | −0.36603 | |
| 225.46~469.70 | 795 | 55,600.24 | −1.17102 | −0.69996 | |
| 469.70~2395.49 | 113 | 12,355.98 | −1.61793 | −0.80909 |
| Models | Susceptibility Level | Classified Area/km2 | Proportion of Classified Area/% | Classified Area/km2 | Proportion of the Number of Landslide Points/% | Density of Landslide Points/(pts/km2) |
|---|---|---|---|---|---|---|
| IV | Very low | 58,864.954 | 0.116 | 52 | 0.002 | 0.00088 |
| Low | 88,686.691 | 0.174 | 174 | 0.007 | 0.00196 | |
| Moderate | 100,583.107 | 0.198 | 803 | 0.034 | 0.00798 | |
| High | 96,681.758 | 0.190 | 4703 | 0.200 | 0.04864 | |
| Very high | 163,505.722 | 0.322 | 17,760 | 0.756 | 0.10862 | |
| IV-LR | Very low | 97,641.331 | 0.192 | 61 | 0.003 | 0.00062 |
| Low | 94,576.997 | 0.186 | 297 | 0.013 | 0.00314 | |
| Moderate | 69,544.901 | 0.137 | 896 | 0.038 | 0.01288 | |
| High | 62,252.741 | 0.122 | 3032 | 0.129 | 0.04870 | |
| Very high | 185,138.611 | 0.364 | 19,225 | 0.818 | 0.10384 | |
| IV-DT | Very low | 73,635.941 | 0.145 | 55 | 0.002 | 0.00075 |
| Low | 76,111.474 | 0.150 | 161 | 0.007 | 0.00212 | |
| Moderate | 91,643.112 | 0.180 | 532 | 0.023 | 0.00581 | |
| High | 91,303.704 | 0.180 | 3684 | 0.157 | 0.04035 | |
| Very high | 175,628.002 | 0.346 | 19,060 | 0.811 | 0.10852 | |
| CF | Very low | 57,115.022 | 0.112 | 129 | 0.005 | 0.00226 |
| Low | 113,965.819 | 0.224 | 612 | 0.026 | 0.00537 | |
| Moderate | 123,232.536 | 0.242 | 2585 | 0.110 | 0.02098 | |
| High | 99,130.810 | 0.195 | 7003 | 0.298 | 0.07064 | |
| Very high | 114,878.045 | 0.226 | 13,163 | 0.560 | 0.11458 | |
| CF-LR | Very low | 97,641.331 | 0.192 | 61 | 0.003 | 0.00069 |
| Low | 94,576.997 | 0.186 | 297 | 0.013 | 0.00244 | |
| Moderate | 69,544.901 | 0.137 | 896 | 0.038 | 0.01512 | |
| High | 62,252.741 | 0.122 | 3032 | 0.129 | 0.04765 | |
| Very high | 185,138.611 | 0.364 | 19,225 | 0.818 | 0.10299 | |
| CF-DT | Very low | 73,635.941 | 0.145 | 55 | 0.002 | 0.00166 |
| Low | 76,111.474 | 0.150 | 161 | 0.007 | 0.00404 | |
| Moderate | 91,643.112 | 0.180 | 532 | 0.023 | 0.01515 | |
| High | 91,303.704 | 0.180 | 3684 | 0.157 | 0.06848 | |
| Very high | 175,628.002 | 0.346 | 19,060 | 0.811 | 0.11182 |
Disclaimer/Publisher’s Note: The statements, opinions and data contained in all publications are solely those of the individual author(s) and contributor(s) and not of MDPI and/or the editor(s). MDPI and/or the editor(s) disclaim responsibility for any injury to people or property resulting from any ideas, methods, instructions or products referred to in the content. |
© 2024 by the authors. Licensee MDPI, Basel, Switzerland. This article is an open access article distributed under the terms and conditions of the Creative Commons Attribution (CC BY) license (https://creativecommons.org/licenses/by/4.0/).
Share and Cite
Zhang, J.; Qian, J.; Lu, Y.; Li, X.; Song, Z. Study on Landslide Susceptibility Based on Multi-Model Coupling: A Case Study of Sichuan Province, China. Sustainability 2024, 16, 6803. https://doi.org/10.3390/su16166803
Zhang J, Qian J, Lu Y, Li X, Song Z. Study on Landslide Susceptibility Based on Multi-Model Coupling: A Case Study of Sichuan Province, China. Sustainability. 2024; 16(16):6803. https://doi.org/10.3390/su16166803
Chicago/Turabian StyleZhang, Jinming, Jianxi Qian, Yuefeng Lu, Xueyuan Li, and Zhenqi Song. 2024. "Study on Landslide Susceptibility Based on Multi-Model Coupling: A Case Study of Sichuan Province, China" Sustainability 16, no. 16: 6803. https://doi.org/10.3390/su16166803
APA StyleZhang, J., Qian, J., Lu, Y., Li, X., & Song, Z. (2024). Study on Landslide Susceptibility Based on Multi-Model Coupling: A Case Study of Sichuan Province, China. Sustainability, 16(16), 6803. https://doi.org/10.3390/su16166803