Article

An Estimation of Biomass Potential and Location Optimization for Integrated Biorefineries in Germany: A Combined Approach of GIS and Mathematical Modeling †

Institute for Industrial Production (IIP), Karlsruhe Institute of Technology (KIT), Hertzstraße 16, 76187 Karlsruhe, Germany
*
Author to whom correspondence should be addressed.
This paper is an extended version of our paper published in 2023 at the 31st European Biomass Conference and Exhibition—Setting the course for a biobased economy, Bologna, Italy, 5–9 June 2023.
Sustainability 2024, 16(16), 6781; https://doi.org/10.3390/su16166781
Submission received: 30 May 2024 / Revised: 30 July 2024 / Accepted: 5 August 2024 / Published: 7 August 2024
(This article belongs to the Special Issue Integrated Approaches to Biomass Sustainability)

Abstract

:
Establishing the utilization of lignocellulosic biomass in integrated biorefineries can reduce environmental impacts and dependency on imported raw materials by substituting fossil-based products. Whereas energetic biomass utilization is common, chemical utilization is still poorly established, primarily due to the lack of feedstock availability. Hence, literature-based estimation and geographical mapping of biomass potentials are key to implementing successful production networks for biobased chemicals. Using the example of Germany, a geographical information system (GIS) analysis was conducted to allocate residual biomass potentials spatially. Based on the obtained GIS data model, a facility location optimization model was developed. The results of a location-allocation analysis for innovative biorefineries, which are integrated with biogas plants, showed an optimal location network for maximizing the amount of residue biomass covered. In a promising model scenario, each biorefinery has a maximum catchment radius of 23 km and a minimum input of 94,500 tonnes of dry matter per year (t DM/a) (31.5 kt DM/a × 3), allowing only existing biogas locations as locations for biorefineries. The results show that a mix of lignocellulosic residual biomass in certain areas can sustainably satisfy the demand for running 69 decentralized, integrated and multi-feed small-to-mid-scale biorefineries in Germany.

1. Introduction

Biorefineries process biomass, a renewable carbon source, to generate bioenergy and produce bioproducts [1]. Despite the high potential and need for replacing fossil raw materials, the number of installed facilities is low. Causes identified in expert interviews include lack of technology, social acceptance of industrial biomass use, political interest, research funding, lack of economic viability, and issues with biomass feedstock supply [2]. One of the most fundamental causes is the lack of knowledge regarding sustainably available biomass for selecting suitable plant locations and the vast expansion of the plant network [3]. Therefore, this literature-based study investigates where biomass is available in Germany and in what quantity. Traditional biogas plants, which convert organic matter into biogas through anaerobic digestion, are widespread, technically mature, and commercially operated in Germany, unlike many biorefinery concepts that could be used to develop higher-value utilization pathways. In particular, this applies to biorefineries for producing multipotent, biobased platform chemicals, which are key intermediates used to produce a variety of chemical products. Non-food lignocellulosic biomass can be used as feedstock, which consists mainly of cellulose, hemicellulose, and lignin. According to Questell-Santiago et al. [4], carbon bound in biomass is the second largest carbon source on Earth after atmospheric CO2. Regarding bioeconomy, a cascadic use should also be sought in the industrial use of biomass, prioritizing material recycling paths over energetic use [5]. Currently, the chemical–material usage paths are not well established, while energetically driven biorefinery concepts for extraction, e.g., biomethane, are commercially applied, especially in Germany [6]. According to Tsita und Pilavachi [7], this is mainly due to the research focus on fuel production in the last decades and the goal of gradually substituting fossil fuels. Since the valorization of residues is a central aspect of cascade use in the bioeconomy, this biomass potential estimate focuses on the locally and regionally available, and untapped but technically mobilizable, residue biomasses. In this study, bioeconomically untapped or underutilized biomass potential is defined as technically available biomass that can be mobilized for value-adding processes but is currently not utilized for any productive purposes such as energy production, chemical material use, or other conventional applications. This typically includes residual biomass left over after primary agricultural, forestry, or landscaping activities, and is not used for energy production, animal feed, bedding, or any other industrial applications.
Within the scope of the biomass potential analysis, agricultural and forestry residues, as well as residues from landscape maintenance and hay, are considered. The mostly joint consideration of different (residual) biomass categories (lignocellulosic biomasses) primarily addresses the plant concept of a multi-feedstock biorefinery, which aims for a broader range of usable biomass to satisfy the supply [8]. Integrated biorefineries, which combine the production of bioenergy and bioproducts in one facility, can improve resource efficiency and sustainability [9]. Robust, small-scale biorefineries are seen as a promising concept for mobilizing and processing biomass in a decentralized valorization network. The scenario analysis evaluates the feasibility of innovative, small-scale lignocellulosic biorefineries [9].
Biomass potential estimations have already been performed in the past, based on different methods, assumptions, and data sets. Often, however, these are carried out from the point of view of the maximum energy output (bioenergy potential) the available biomass can achieve. For example, Brosowski [1] and Brosowski et al. [10] conducted residual biomass monitoring for Germany and determined, among other criteria, the amounts of biomass that could be mobilized. The German Institute for Biomass Research (DBFZ) [11] maintains a database for Germany with detailed information on 77 different residual biomasses, which were categorized according to Brosowski et al. [10]. However, all the sources considered have in common that no information was provided on where exactly or in what quantities (residual material) biomasses were available or could be mobilized. However, such a spatial analysis is required to determine whether biorefinery concepts can be operated economically and sustainably using locally obtained biomass. Therefore, using GIS software, this study performed a georeferenced analysis of the local and sustainably mobilizable (residual) biomass potential. To identify optimal locations for small-to-mid-scale biorefineries based on the biomass estimation, a location-allocation model solving a maximum flow mixed integer linear problem (MFMIP) was developed.

2. Materials and Methods

2.1. GIS Model: Quantifying Mobilizable Residue Biomass

The methodology used to develop the GIS model for residual biomass in Germany is illustrated in Figure 1. First, the data sets used for the biomass potential estimation were gathered, given the accessibility and compatibility of their data formats (Step 1). Subsequently, the process steps for modeling the database in the GIS software ArcGIS Pro Version 3.1.0 (ESRI Inc., Redlands, CA, USA) were documented (Steps 2–7). Afterward, the database was parameterized, after which a literature-based evaluation of the generated model was conducted (Step 8).
The result is a database with over 1 million polygons on the land-cover categories in Germany. The obtained data were transformed into polygons and aggregated onto a 10 × 10 km grid with 3858 grid elements. The methodology and grid size were aligned with studies using a similar data-processing approach [6,13,14].
A biomass catchment area of 100 km2 (grid-based radius of 5.6 km), which represents the area from which biomass can be sourced for a biorefinery, was used as base unit for the analyses, according to the data available in the literature [6,9]. The results are displayed graphically in the grid, where the square lattice elements are colored based on the estimated amount of sustainably mobilizable biomass.
Available georeferenced datasets were assessed for the suitability of their content, area covered, timeliness, and data resolution. The most suitable and primarily used data sets for the GIS model are the baseline CORINE Land Cover (CLC) dataset [15,16], a dataset of protected areas [17], and the Thünen Agraratlas dataset [18]. The CLC dataset provides a comprehensive inventory of land cover in Europe, which is crucial for identifying areas where biomass can be sourced. The dataset of protected areas from the German Federal Agency for Nature Conservation [17] includes information about regions designated for environmental protection, which helps to ensure that biorefinery operations do not infringe on these areas. The Thünen Agraratlas dataset [18] contains detailed agricultural data at the municipal level in Germany, providing essential information on agricultural land use and livestock density. To reduce the complexity of the CLC dataset selected as the baseline dataset for this study, irrelevant land cover categories on which no terrestrially produced biomass can be expected, such as water bodies, lagoons, and rocks without vegetation, were removed from the original dataset.
To estimate the georeferenced biomass potential of each grid cell, the polygon area of different land use categories (e.g., hectare of cropland) was multiplied by the biomass type-specific annual residue quantity (e.g., tons of straw per hectare), the according dry matter content factor, and the untapped technically mobilizable biomass share. The polygon area of each biomass type in each gid cell is based on the CLC dataset [15,16] and the Thünen Agraratlas dataset [18]; the biomass type-specific annual residue quantity per hectare and their share of dry matter were obtained from the Agency for Renewable Resources [19], Schröder [12], and Krause et al. [20]; the shares of untapped but technically mobilizable biomass were derived from the DBFZ biomass potential database [11], the dataset on protected areas [17], and the Thünen Agraratlas dataset [18].
A comparison of the mobilizable technical biomass potentials published by the DBFZ [21] with the mobilizable potentials determined from the CLC dataset showed a high degree of agreement and thus validated the georeferenced estimation: all the determined potentials fell between the minimum and maximum technical biomass potentials of the DBFZ [21]. Hence, the modified CLC dataset achieves consistent and realistic values, and confirms the potential values reported. This dataset is used as input for allocating biorefineries in a location-allocation model, which is a MFMIP formulation.

2.2. Location-Allocation Model: Optimizing Biorefinery Locations

MFMIP (maximum flow mixed integer linear problem) is a type of mathematical optimization problem that combines aspects of maximum flow problems and mixed-integer linear programming (MILP), which is commonly applied in the literature to identify optimal facility locations [6,22]. By integrating these two concepts, MFMIP allows for the optimization of both the quantity of biomass transported and the selection of biorefinery locations under capacity constraints. It belongs to the broader class of combinatorial optimization and network flow problems, which are critical for efficiently managing resources in logistics and supply chain management. This model is implemented in GAMS (General Algebraic Modeling System), Version 45.7.0, which is a high-level modeling system for mathematical programming and optimization. GAMS allows for the formulating and solving of complex linear, nonlinear, and mixed-integer optimization problems [23].
To identify an optimal location network for integrated small-to-mid-scale biorefineries based on the biomass estimation, we formulated a location-allocation model solving a MFMIP. The biomass material flows from biomass supply sources i, to biomass sinks j. The sinks are candidate facility locations for biorefineries. The flow is limited by a maximum supply from each source, a maximum cutoff distance, and a minimum demand from each biorefinery.
The software ArcGIS Pro was used to calculate the road distance matrix from all candidate facility locations to the source points. Due to the need for discrete supply points for the optimization, and to derive a more accurate result, the 10 × 10 km grid was disaggregated into 25 2 × 2 km grid cells. By using the ‘centroid’ function, the smaller grid elements with each of their biomass availability were each reduced to a single point, which resulted in 96,450 biomass supply points. This disaggregation enhanced the resolution of the continuous area covered by the catchment areas’ polygonal shapes (Figure 2). Due to the limitation by ArcGIS of calculating the distance matrix to a maximum of 1000 data points, the dataset was split into smaller sets to form matrices with a subset of facilities, before merging them. This limitation increased the number of calculated distance matrices and the optimization time significantly. This resulted in a calculation time of five days for the most complex scenario (Scenario 2.2). As the number of supply points increased further with higher grid-size resolution, a significant rise in the calculation time was expected. Regarding the trade-off between the quality and detail of the results and the computability, the chosen grid-size resolution made a suitable compromise.
The result was a distance matrix that connected the facilities to all potential supply points (black dots) within their reach (Figure 2). The distances were measured based on the German street network. In Figure 2, the connections are illustrated by red lines. The green polygon represents the maximum catchment area of one facility for a pre-defined maximum driving distance [6,9,22], without showing other facilities competing for the same biomass (Figure 2). The final allocation of the biomass supply points to the facilities was determined by the optimization (Section 2.2.2).
We assume the biorefineries will be installed at existing biogas locations to avoid unnecessary soil sealing (‘brown-field strategy’). Moreover, integrated biorefinery concepts combine existing biogas plants with innovative refinery modules, as introduced by Götz et al. [9]. Location data from existing biogas facilities were obtained from the database Marktstammdatenregister [24], resulting in 9747 candidate locations.

2.2.1. Model Description

To address the optimization of biomass allocation to competing biorefineries in Germany, a maximum flow problem was formulated and solved in GAMS (General Algebraic Modeling System) using the CPLEX solver, Version 22.1.0. The key objective was to determine the optimal biomass allocation to potential biorefinery locations, while considering capacity constraints at biorefineries and limited biomass availability at supply sources. The model maximizes the biomass flow, representing the transportation of biomass from supply sources (i.e., centroids of grid elements) to candidate biorefinery locations. The MFMIP is solved by finding the optimal values for the transport quantities x i j and the binary variable indicating open biorefinery locations y j .
The solution is optimal locations for integrated biorefineries with varying capacities, higher than the minimum capacity. The results were exported to spreadsheet software for further analysis and visualization in ArcGIS Pro.

2.2.2. Mathematical Model Formulation

  • Sets:
    • i : Centroids of grid elements representing biomass supply sources
    • j : Candidate biorefinery locations
  • Variables:
    • x i j : Quantity of transported biomass from supply source i to candidate biorefinery location j
    • y j : Binary variable indicating whether a biorefinery location j is open ( y j = 1 ) , or not ( y j = 0 )
  • Parameters:
    • a i : Biomass supply at location i (source) [tonnes]
    • b j : Biomass demand at candidate biorefinery location j (sink) [tonnes]
    • d i , j : Transport distance between biomass source i and sink j [kilometers]
    • d m a x : Maximal transport distance [kilometers]
    • M : Large number for Big-M constraint
  • Objective Function:
The objective function maximizes the total transportation quantity of biomass, representing the overall flow from supply sources to biomass sinks at biorefinery locations.
M a x i m i z e     i n j m x i j
  • Constraints:
Supply provision at biomass source location i :
j m x i j a i           i  
Demand satisfaction at biorefinery location j :
i = 1 n x i j b j · y j           j
Distance constraint:
y j · d i j   d m a x           i , j  
Big-M constraint linking x i j and y j :
x i j y j · M           i , j  
Open constraint:
i = 1 n x i j M · y j           j

3. Results

The results of the potential estimation for the biomass types—residual straw, hay, forest residues, and landscape maintenance residues—are described in the first part of this chapter. The main findings of the location-allocation analysis are presented thereafter.

3.1. Biomass Potential Estimation

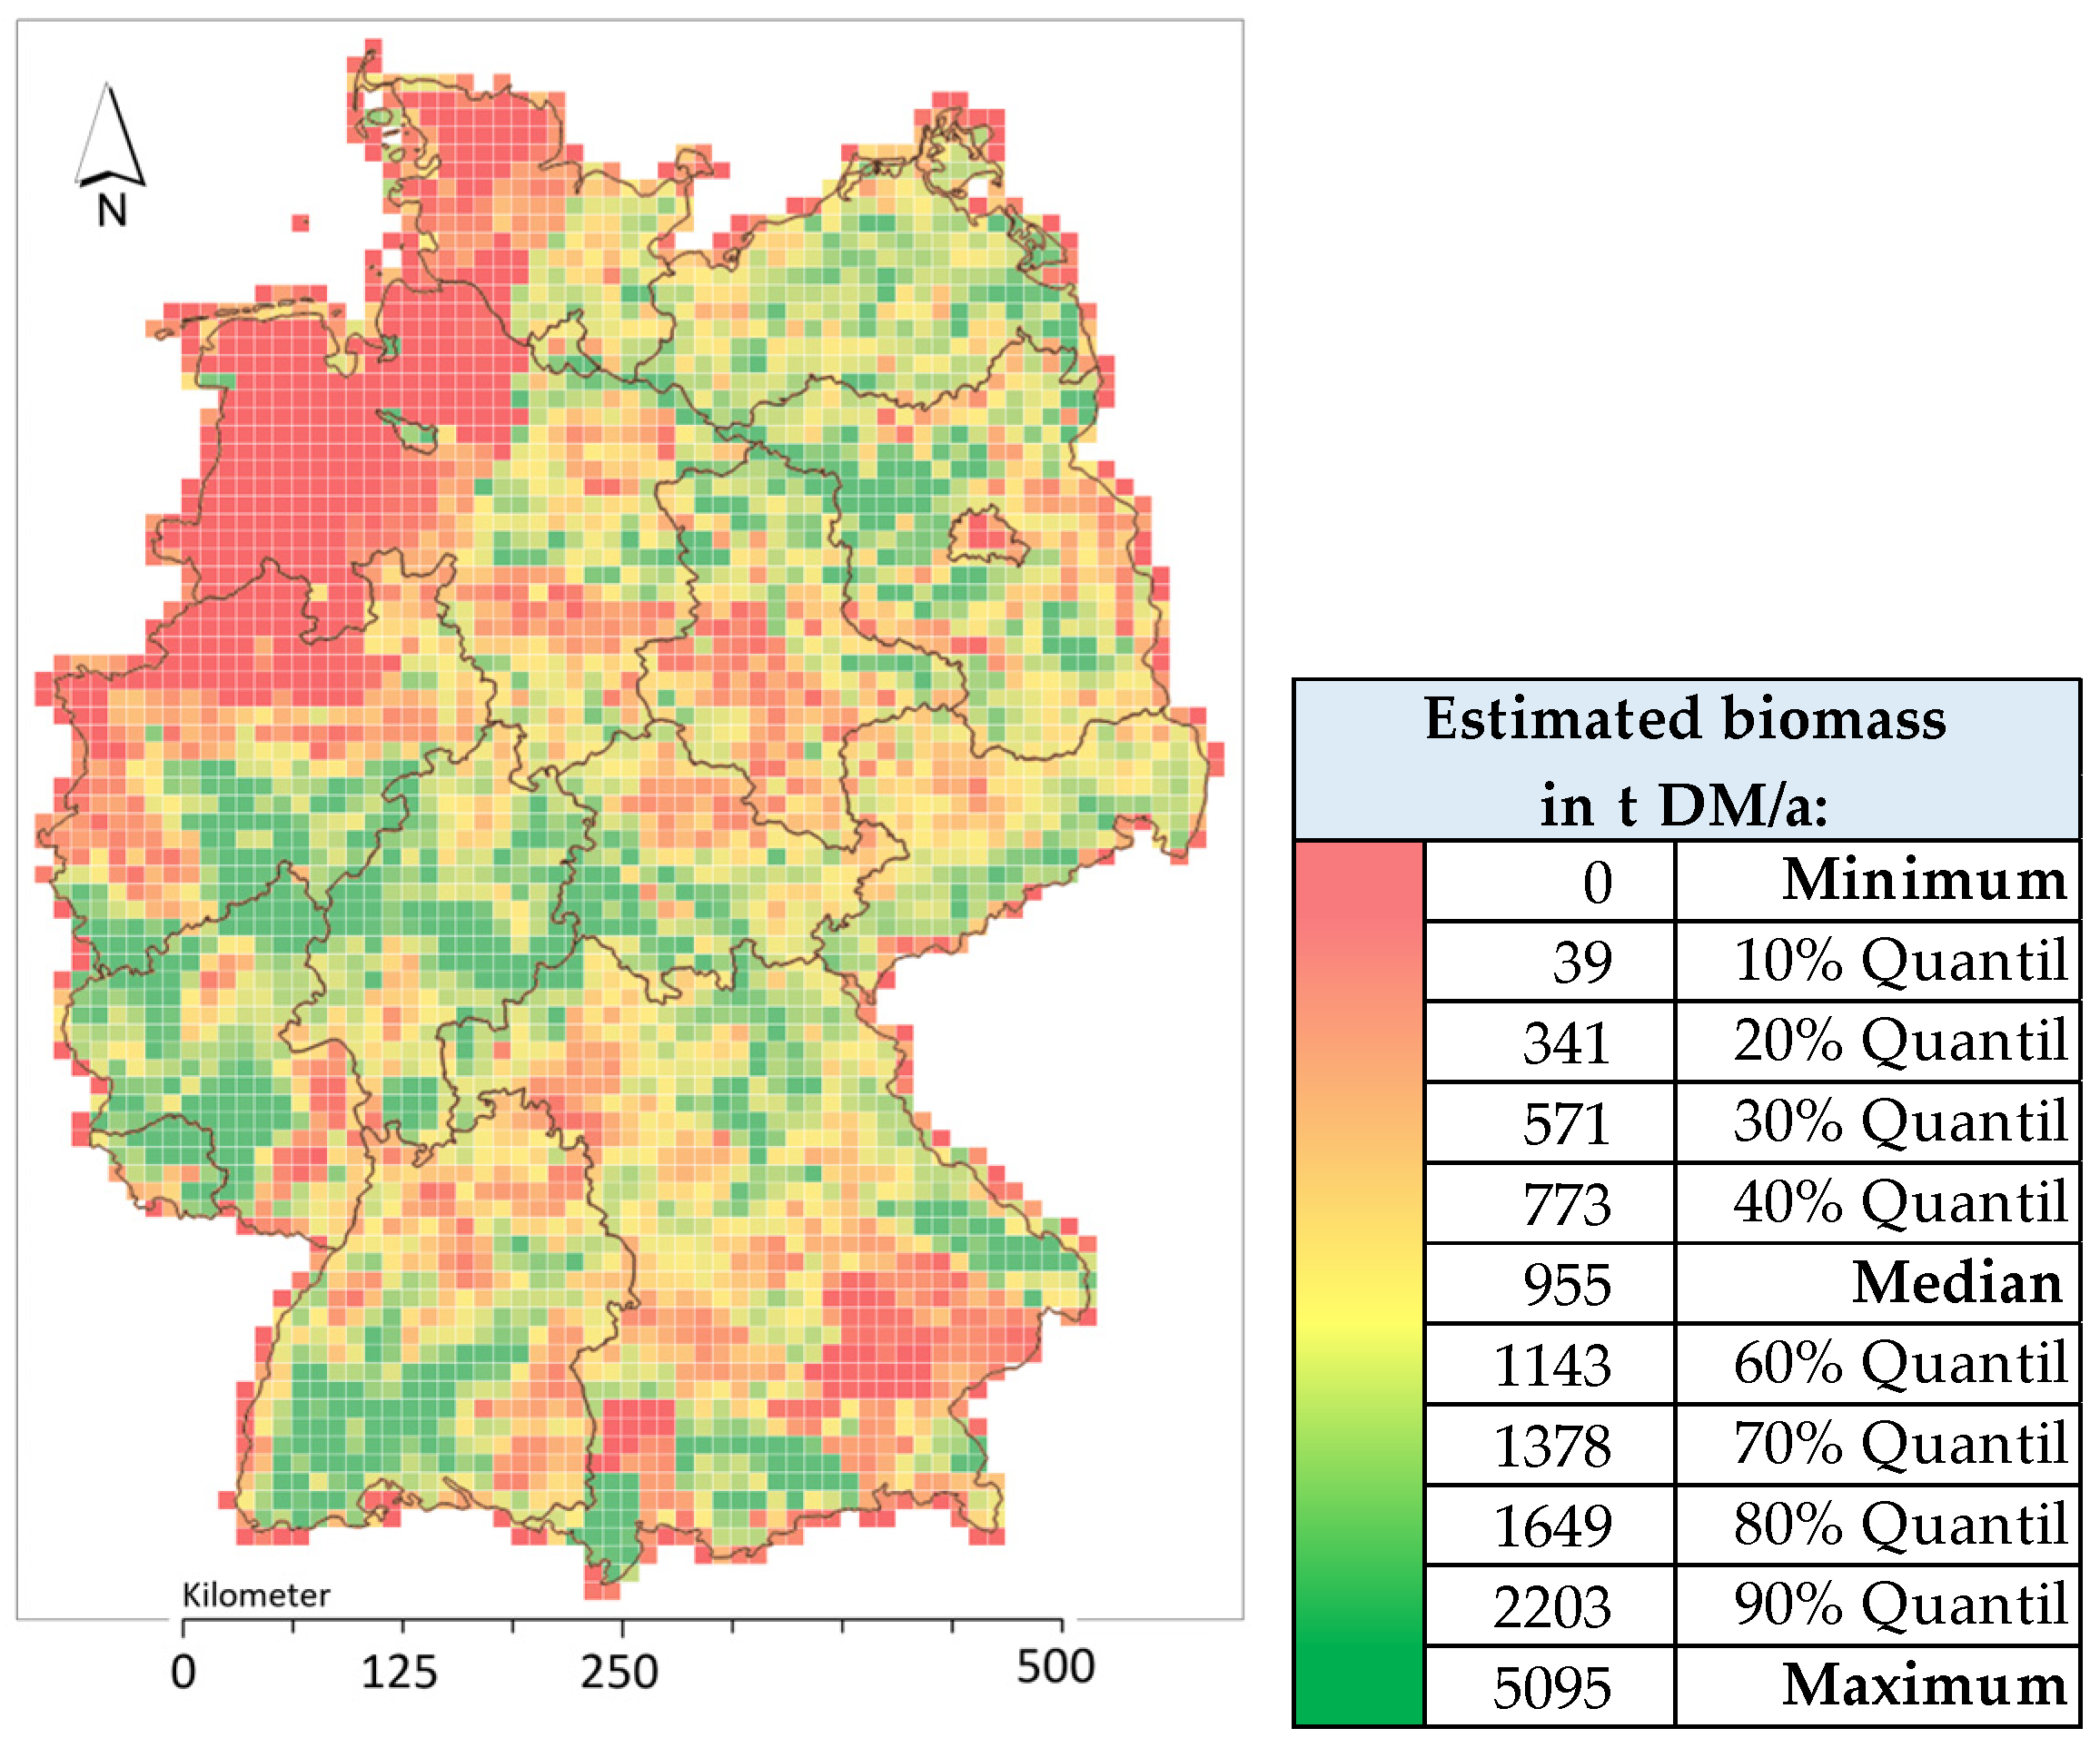
3.1.1. Estimated Potential of Residual Straw

The annual mobilizable residual straw potential is estimated as being up to 9615 t DM per grid cell (100 km2 or a catchment radius of about 5.6 km), with a median of 1569 t DM and an average of 1917 t DM, located between the median and the 0.6 quantile. The spatially distributed and annually mobilizable residual straw is estimated to be approximately 7.40 M t DM in total. The achievable peak potentials are predominantly located along the axis from southwest to northeast Germany, the border with France to the Baltic Sea. This is primarily due to the high cultivation mix of cereals on the fertile arable land in these regions. (see Figure 3).
As a modeling result, Germany has an average non-mobilized share of straw of 58.3%. This value corresponds well with the estimation of the DBFZ of 61.2% [19].
Figure 3 shows that the model reasonably reflects the assumption that straw in regions with a high livestock density is already used for feed and bedding, thus, less redirectable straw accumulates in these areas. Therefore, regions with a high livestock density according to the input data set (i.e., northwest Germany) have low straw potentials, which is also noticeable for regions with a high proportion of forest or settlement areas, and mountain regions (i.e., south Germany) (see Figure 3, left).
The numbers indicate a concentration of mobilizable straw in certain regions but, as the figure shows, they are often spatially apart. The situation is similar to that of the other investigated biomass types. This circumstance indicates the need for multi-feed technologies to combine resources and reach economically and ecologically sustainable amounts of annual input on a regional level. This could enable the development of decentralized bioeconomic production with robust supply chains.

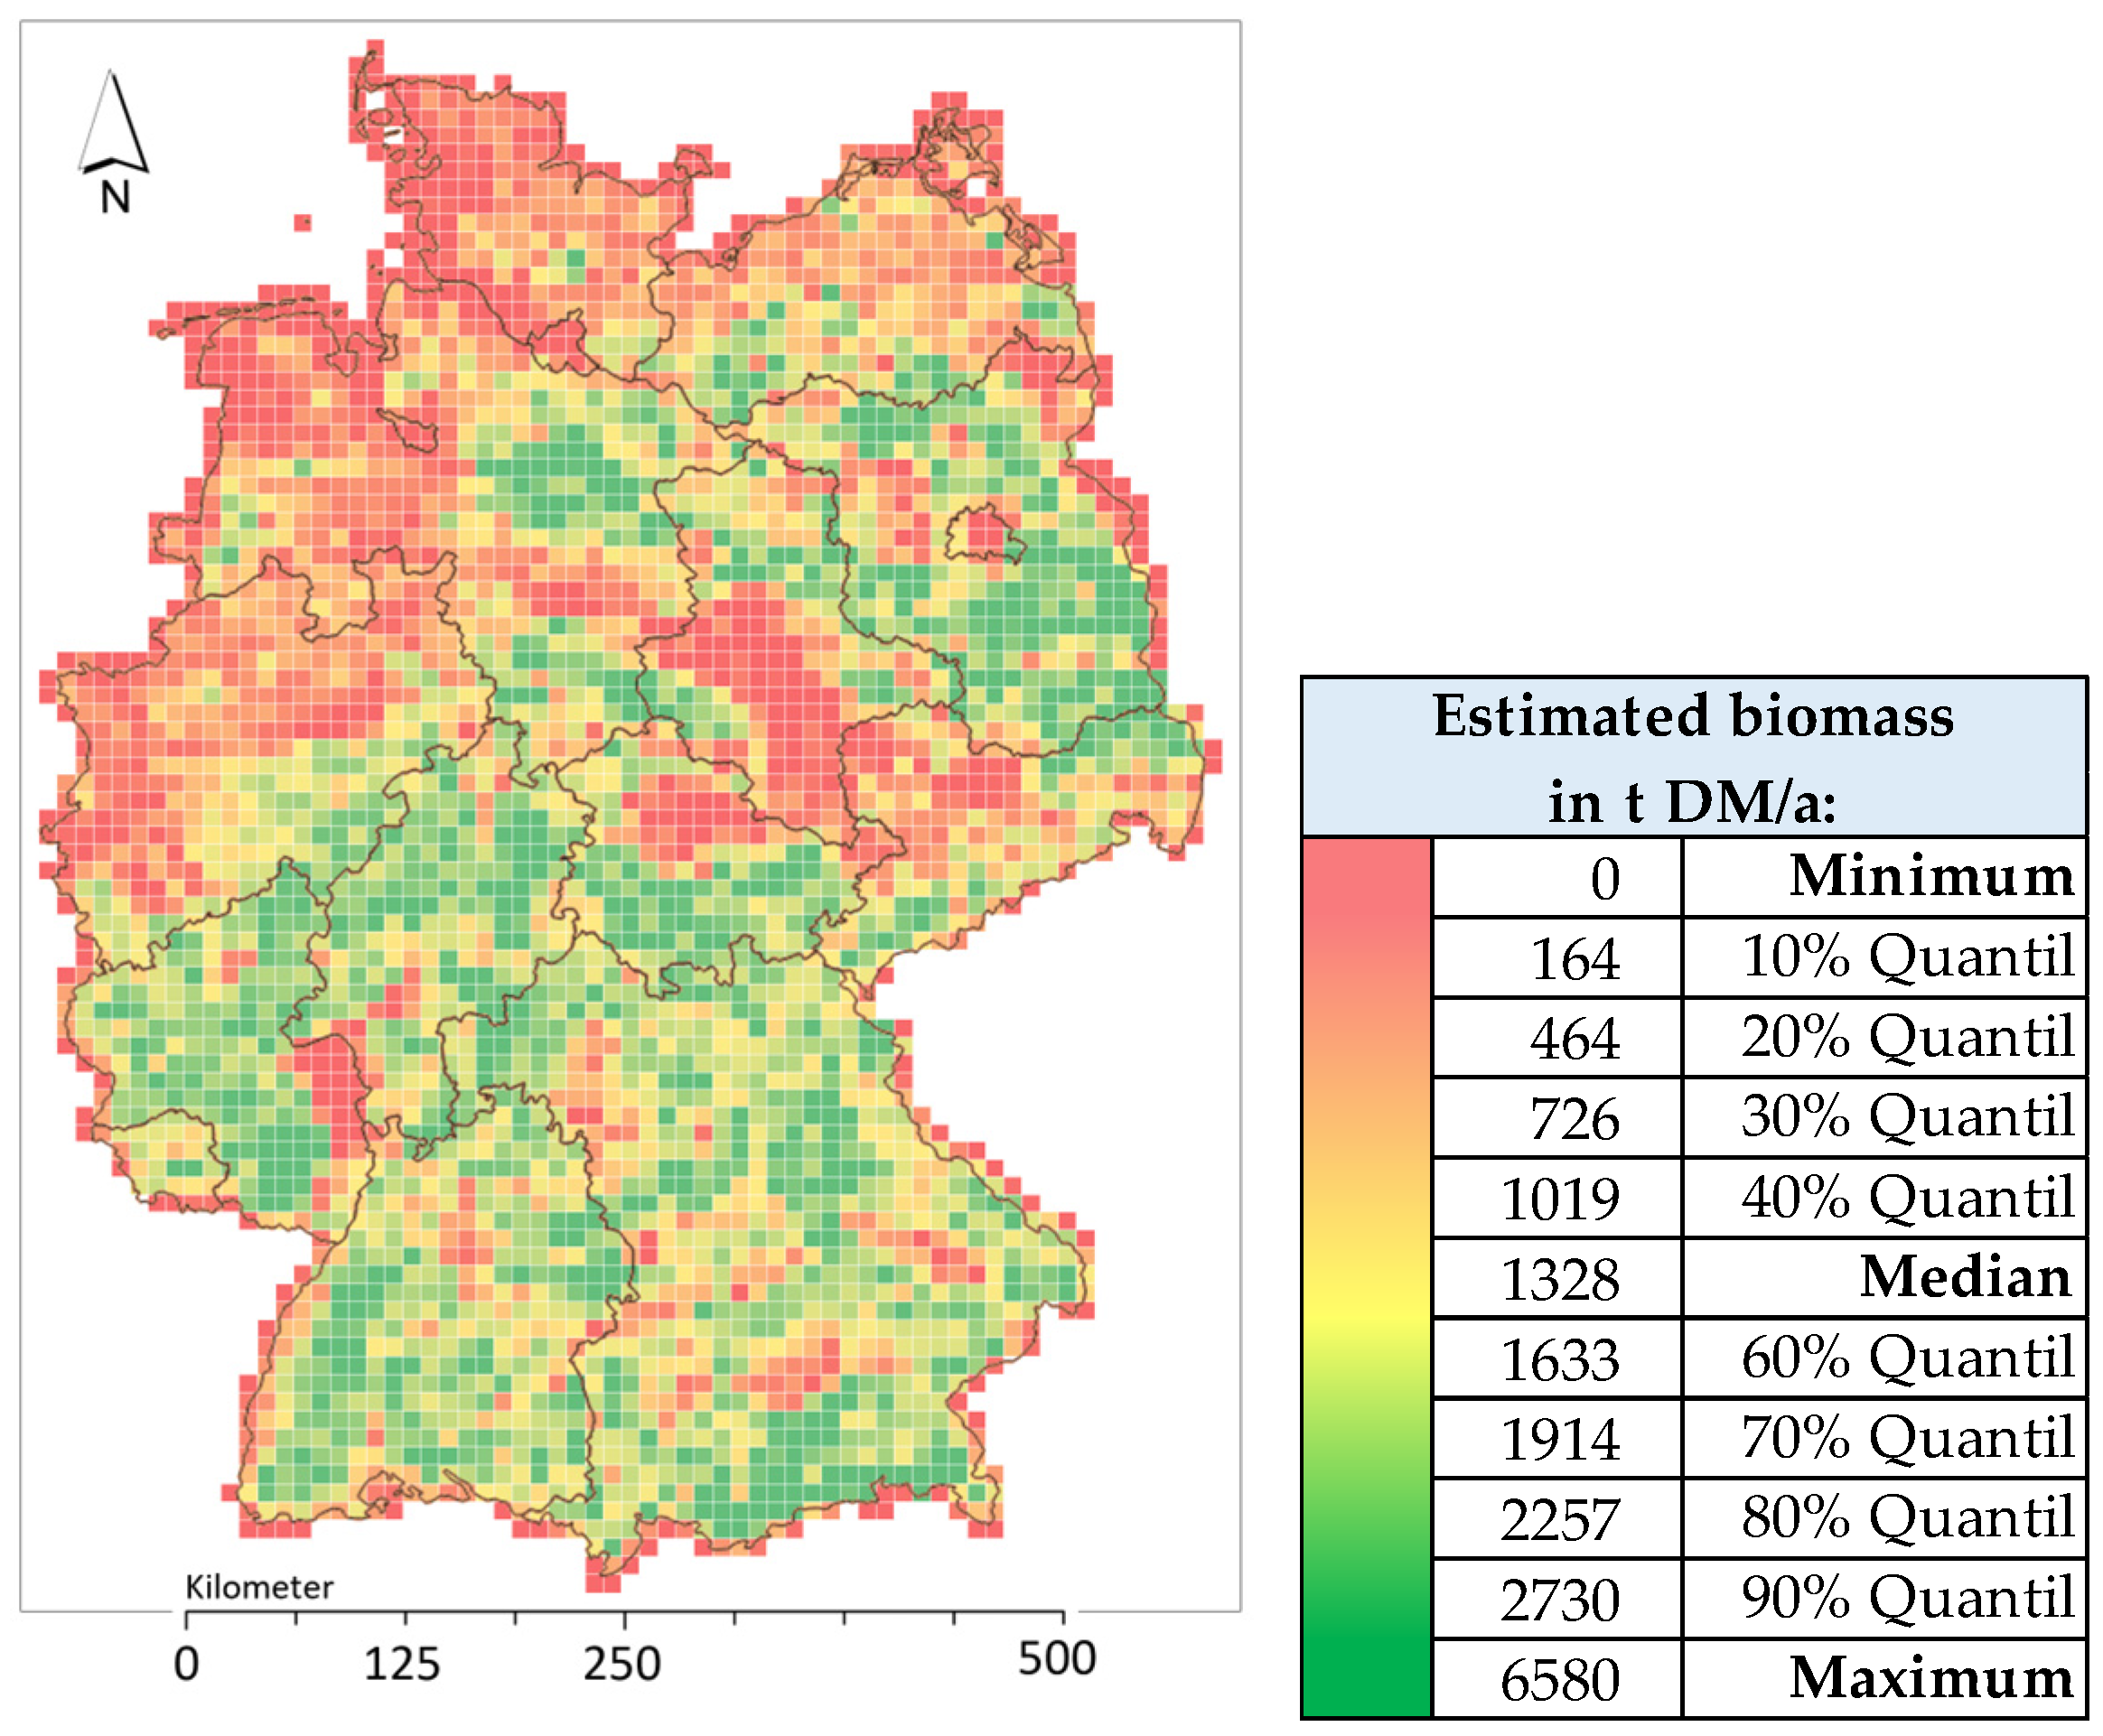
3.1.2. Estimated Potential of Hay

The assumptions regarding the consumption of hay result in an average used share of hay from natural grassland of about 54.6%. The annually mobilizable biomass potentials in the catchment area of a grid element range up to 5095 t DM. The median value is 955 t DM and the average potential is 1077 t DM, between the median and the 0.6 quantile. This indicates that slightly more than half of the grid elements have a lower value than the average potential. The spatially distributed total amount of additionally mobilizable hay is estimated at approximately 4.16 Mt DM. The identified peak potentials are widespread in Germany, often located at federal state borders, which can be attributed to meadows and grassland along rivers. Other significant hay potentials above the 0.9 quantile (2203 t DM per year) are located in southern Germany (see Figure 4).

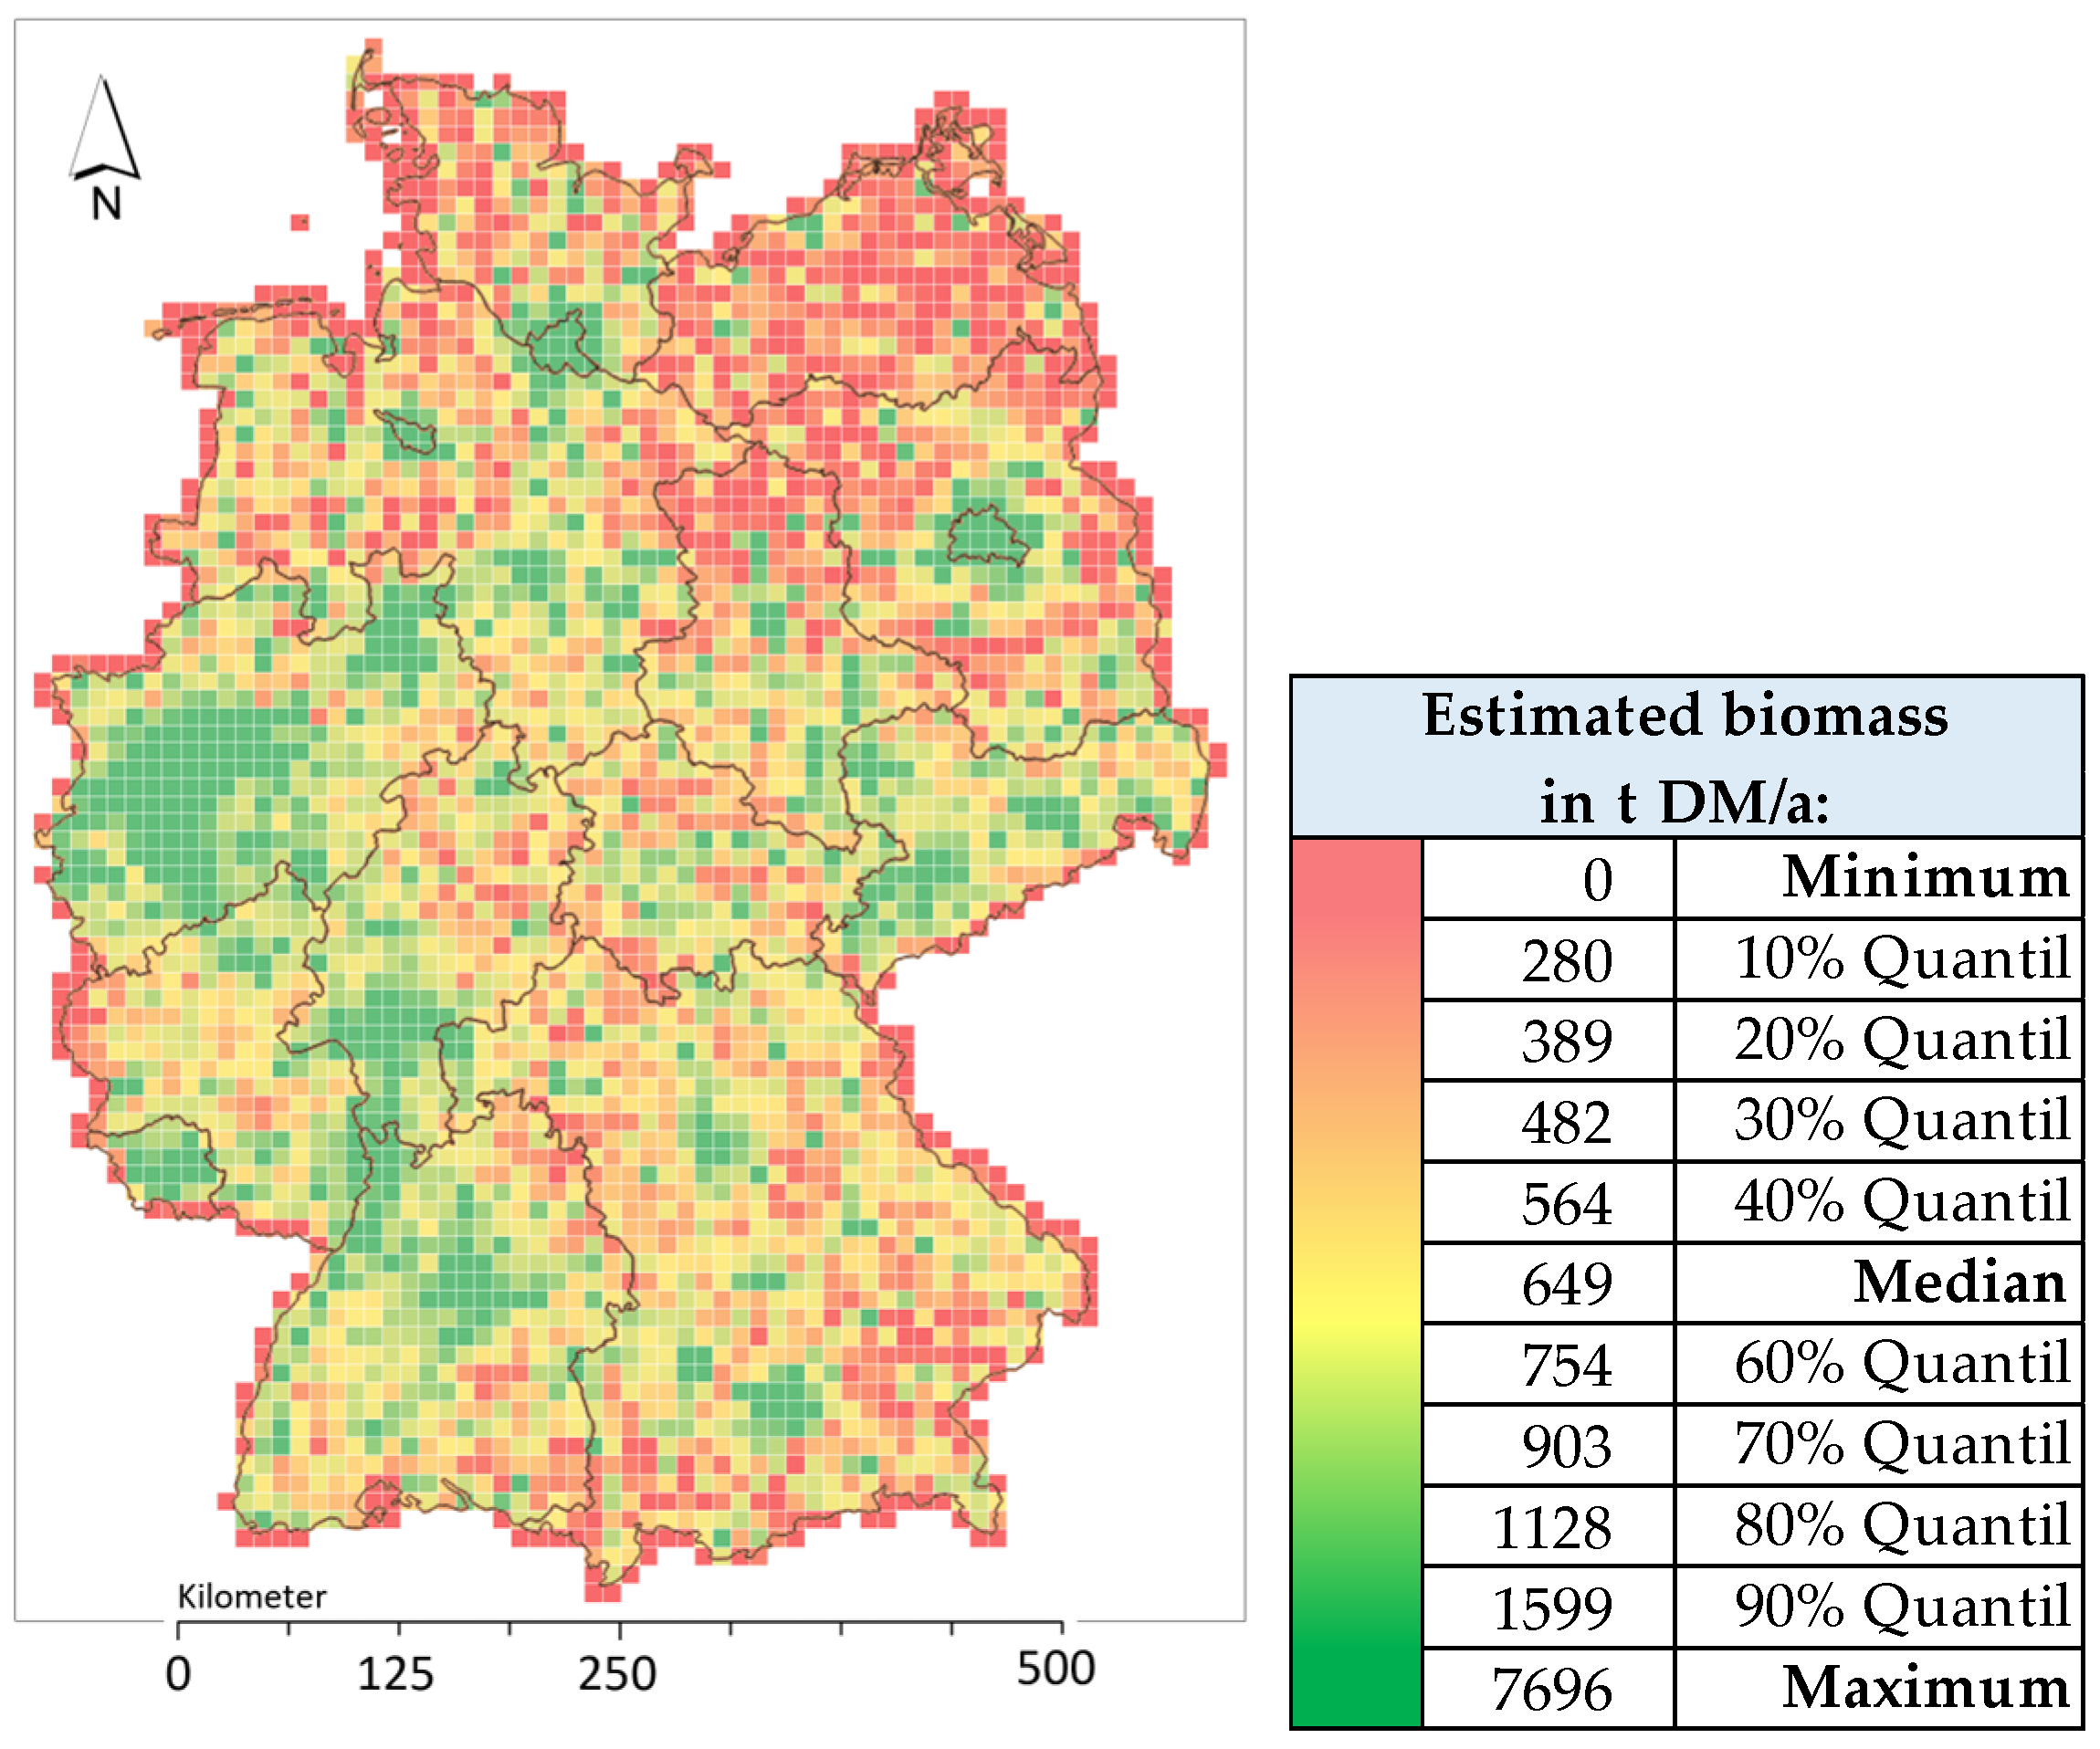
3.1.3. Estimated Potential of Forest Residues

The annually mobilizable forest residue potentials in the catchment area of a grid element range up to 6580 t DM. The median value is 1328 t DM and the average is 1420 t DM. The deviation of the average from the median (+6.9%) indicates that there are individual outlier grid elements with high potentials, which can be attributed to grid elements in forest-rich areas. The spatially distributed total amount of untapped forest residues is estimated at 5.48 Mt DM. The peak potentials are located in areas with a high proportion of forest areas without restrictions imposed for protected areas. This is due to the assumption that more wood is harvested in managed forests, resulting in more forest residue. High biomass potentials above the 0.9 quantile (2730 t DM) are primarily found in the extensive forest areas in the south, the center, and the east of Germany (see Figure 5).

3.1.4. Estimated Potential of Landscape Maintenance Residue

The analysis of biomass generated from landscape maintenance due to nature conservation measures and open-space initiatives in exterior areas and urban areas shows that annually mobilizable biomass potentials range up to 7696 t DM in the catchment area of a grid element. The median is 649 t DM, and the average is 856 t DM. The significant deviation of the average from the median (+32.2%) is due to the concentration of biomass in comparatively few grid elements. There is a major share of more than 90%, where each element provides fewer than 1500 t DM of residue. The spatially distributed total amount of untapped landscape maintenance residue is estimated at 3.30 Mt DM. These residues primarily occur in and around major cities, especially in metropolitan regions in the west (see Figure 6).
The figures and numbers show that, due to the spatial distribution of biomass, by processing a single biomass category there is not enough biomass locally available to operate a national industrially productive biorefinery network. This shows the need for multi-feed biorefinery technologies.

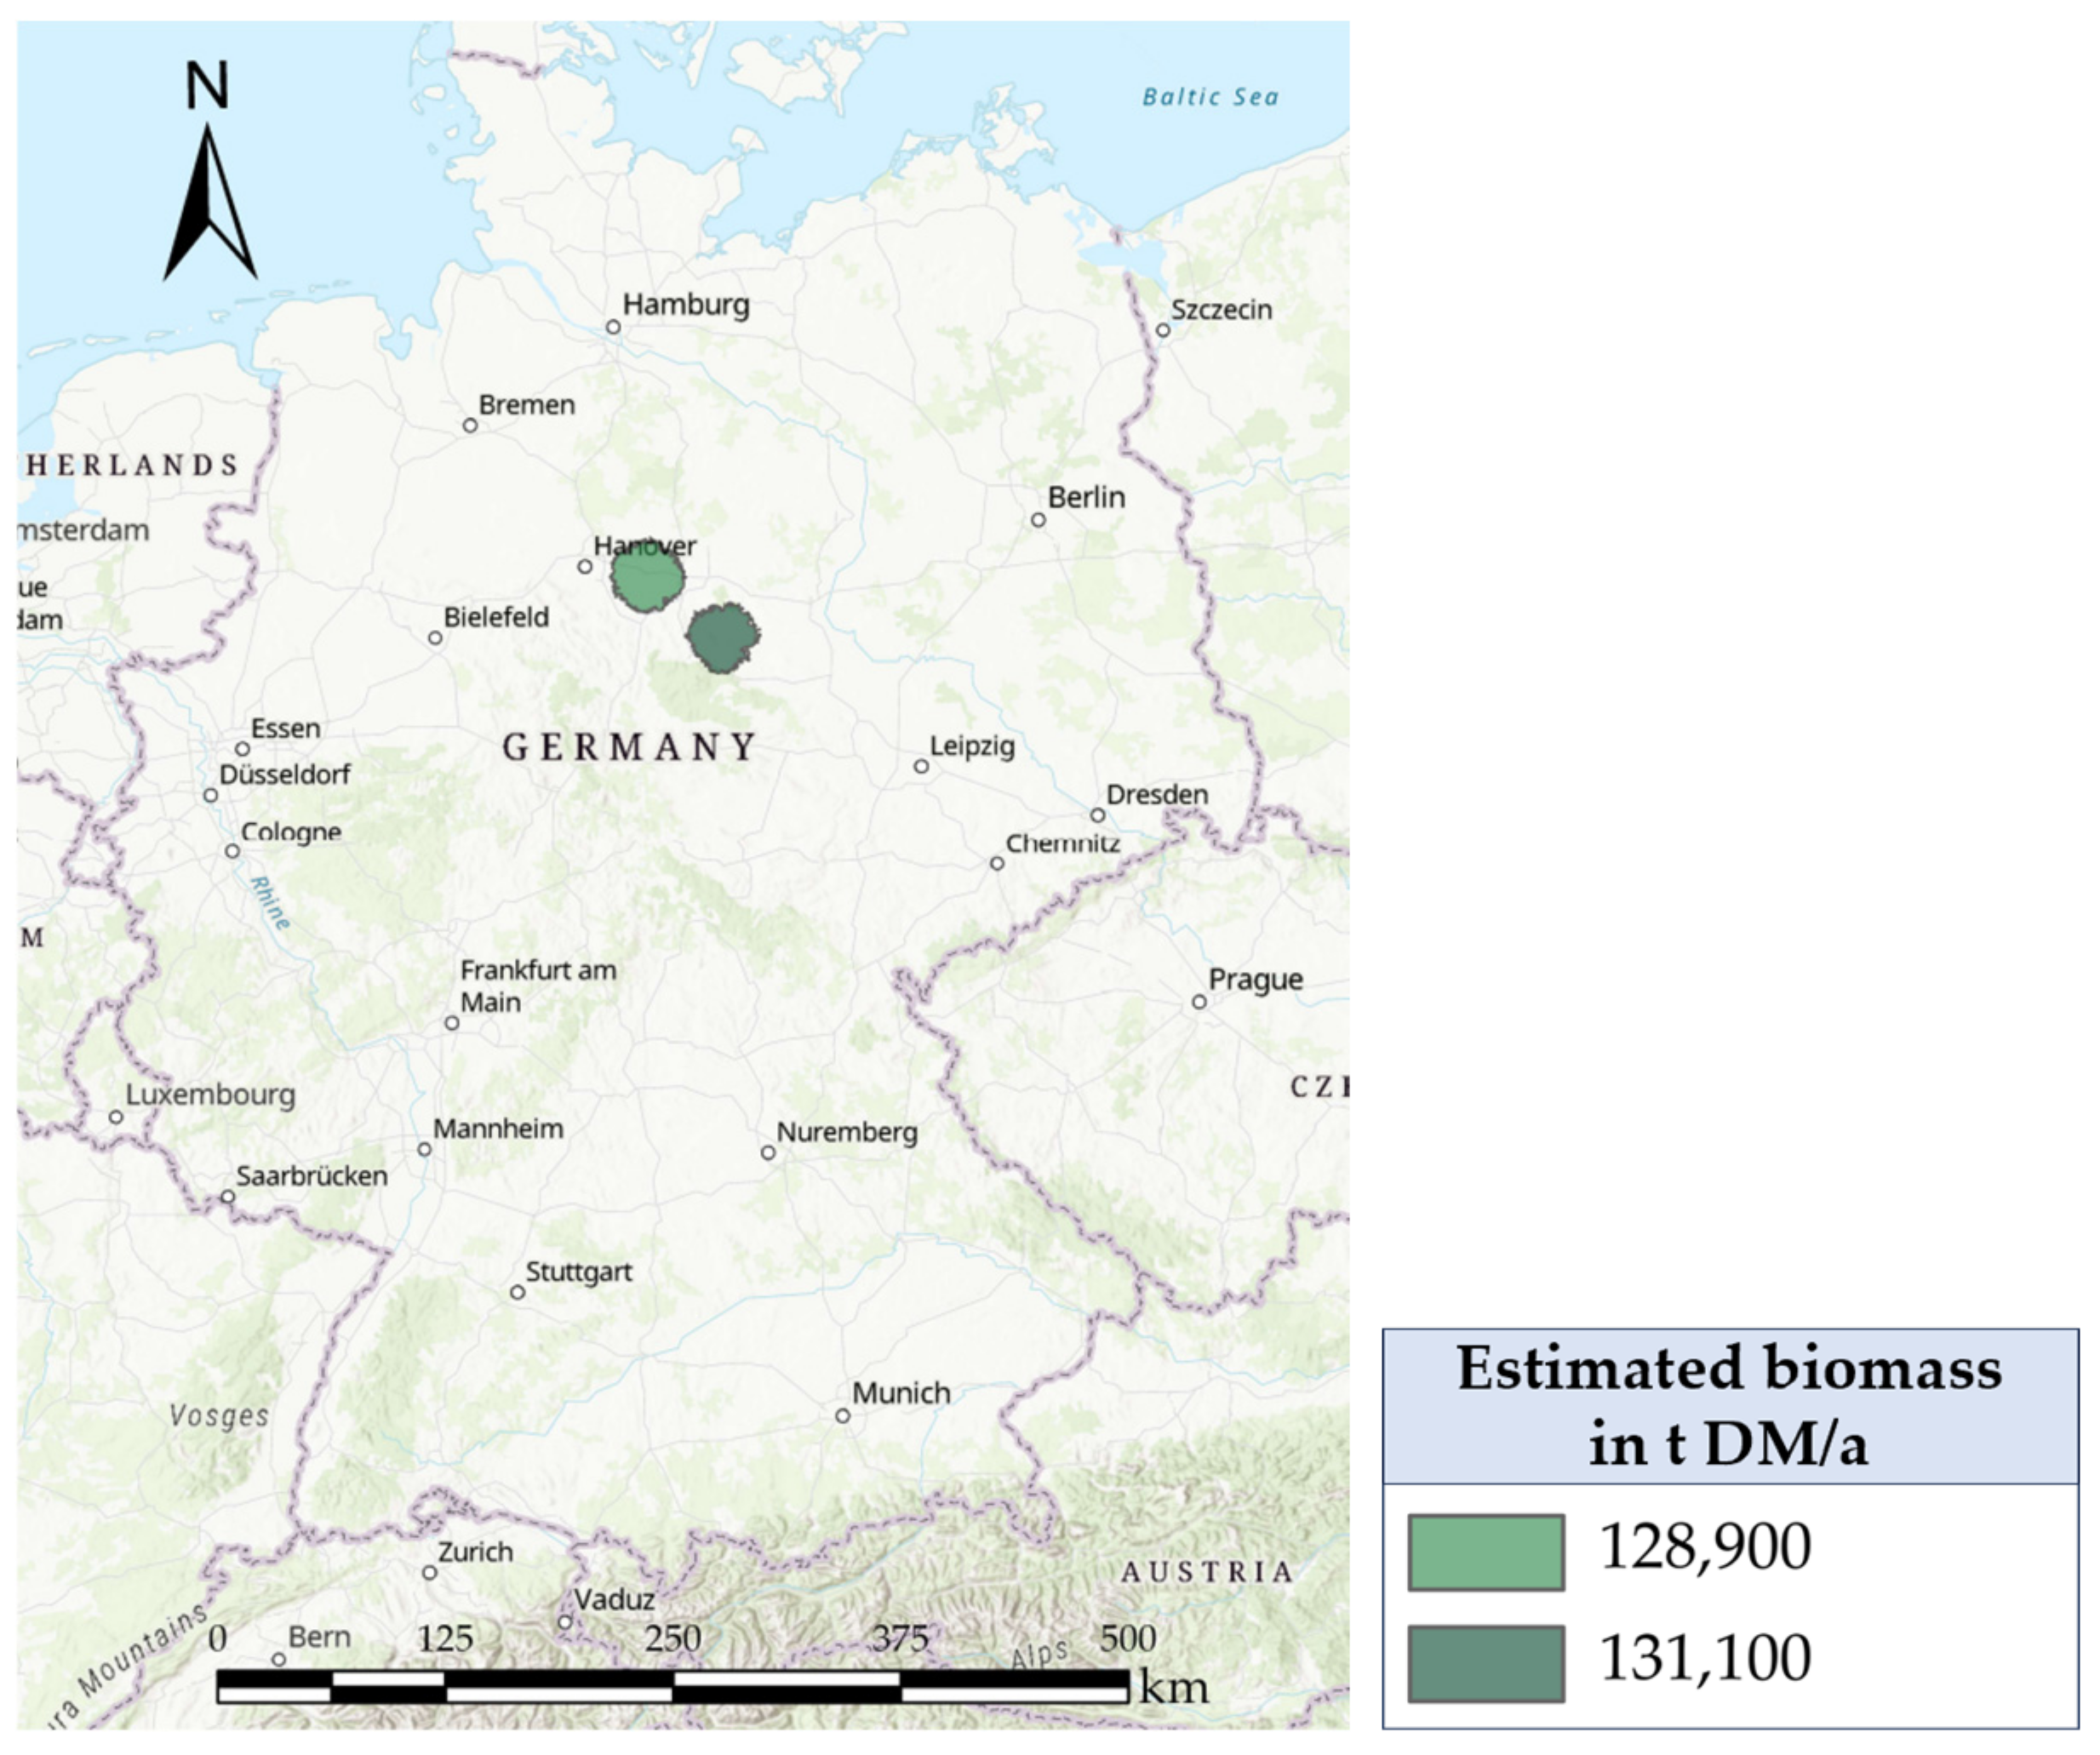
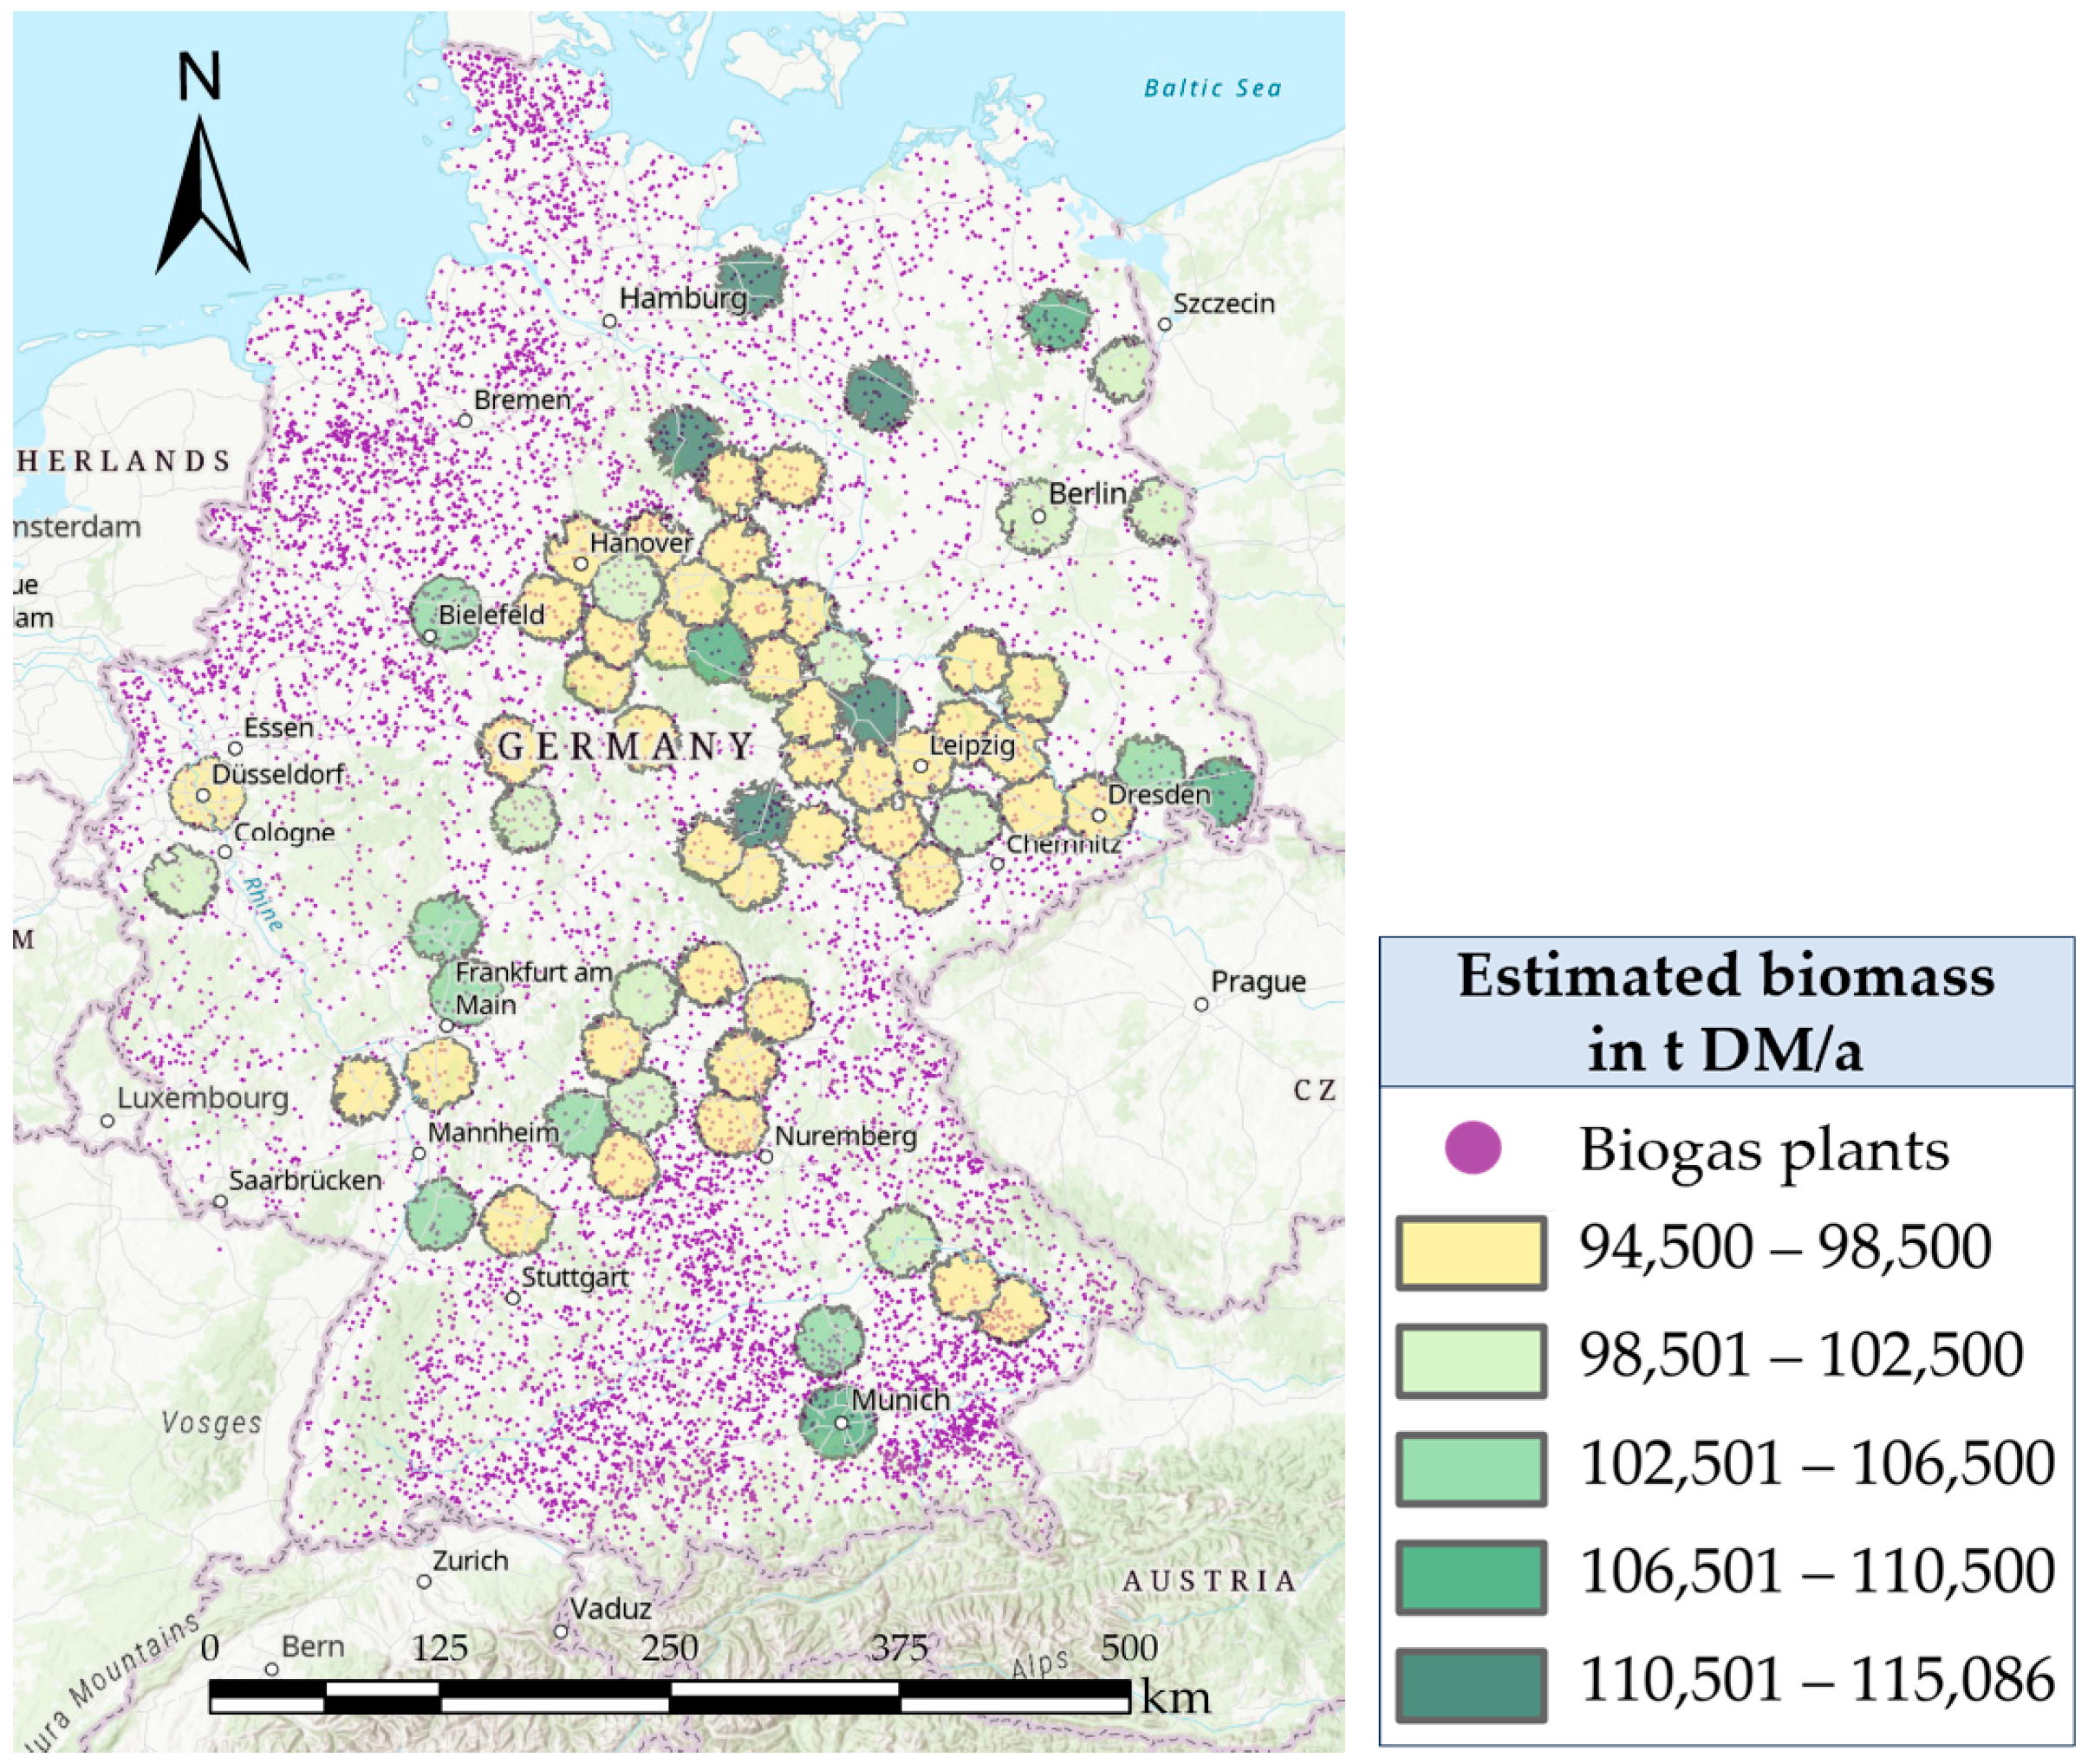
3.2. Biorefinery Location-Allocation: Scenario Analysis

For the investigation of the supply possibilities of an integrated multi-feed biorefinery, the residue biomass potentials of straw, hay, forestry, and landscaping are brought together in this scenario analysis [20].
As the analyses of Heck et al. [3] have shown, even the aggregated amount of potentially underutilized lignocellulosic, woody biomass in a regional scenario is not sufficient for the economic production of bioethanol (at least 250 kt DM input per year) [8] or biobased platform chemicals (at least 400 kt DM input per year) [25], based on the centralized, single-feed plant concepts prevailing in the literature. With a regional catchment radius of 20.3 km (13 times the base unit of 1300 km2), the top 10% of the grid elements with the highest lignocellulosic biomass production are expected to cover only about 37% of a plant with a demand of 250 kt DM input per year, and 23% of a plant with a demand of 400 kt DM input per year [3]. Thus, centralized plant concepts on a large industrial scale are often unsuitable for mobilizing spatially distributed residual biomass and developing regional bioeconomic value creation (cf. [22]).
That makes it necessary to consider the concept of an innovative ‘small-scale’ biorefinery that can be operated in a decentralized manner on a farm site, and directly integrated with a biogas plant. Its minimal annual biomass requirement is 31.5 kt DM. The primary data for such a small-scale biorefinery are taken from Götz et al. [9].
As the high share of personnel costs was identified as a decisive disadvantage for the cost of production with small-scale plants, Götz et al. [9] proposed the clustering of plants. Due to more centralized biomass processing, economies of scale affect the economic efficiency of the plant, and the margin of safety gained increases, which is a key factor for investors’ decisions [9]. For example, three small-scale plants could be operated in a network. Thus, an annual input of 94.5 kt DM (31.5 kt DM/a × 3) is required, which would still be considerably less than what state-of-the-art biomass conversion plants require. So, the identified locations can be seen as prime locations where sufficient substrate availability can be expected. Other scenarios with a plant size lowered to 31.5 kt DM/a could be considered feasible.
Another aspect considered in the scenario analysis is a change in land use. Prior to the war in Ukraine, an EU-wide plan for the benefit of biodiversity envisaged at least 4% of the arable land in Europe set aside from 2023 onwards [26]. Food production would have been forbidden on this land. With an arable land area of 11.6 million hectares in Germany, this corresponds to an area of approximately 0.46 million hectares. The scenario analysis assumes the use of this land for the cultivation of Miscanthus. The reduction of residual straw potential, formerly originating from this arable land, is considered when determining the biomass potential, taking into account the local cultivation mix.
The four investigated capacity scenarios are: Scenario 1.1 with a cut-off distance of 20.3 km and a minimum amount of biomass input for the biorefinery of 94.5 kt DM/a (cluster of three units); Scenario 1.2 with the same cut-off distance of 20.3 km but a minimum amount of biomass input of 126 kt DM/a (cluster of four units); Scenario 2.1 with a cut-off distance of 23 km and a minimum biomass input of 94.5 kt DM/a; and Scenario 2.2 with a cut-off distance of 23 km and a minimum biomass input of 126 kt DM/a (see Table 1).
A ‘pairwise buffer’ tool is used to pre-select and reduce the number of potential candidates. The GIS software creates a circle buffer area around each facility. Calculating the biomass covered by the area of each circle allows all the facilities that do not reach the minimum threshold of 94.5 kt DM/a (Scenarios 1.1 and 2.1) or 126 kt DM/a (Scenarios 1.2 and 2.2) of biomass supply to be excluded. In the 23 km scenarios, the number of candidates is reduced from 9747 to 6574, while in the 20.3 km scenarios it is reduced to 869 candidates. Scenarios 1.1 and 1.2 having the same value, and Scenarios 2.1 and 2.2 having the same value, is due to applying the ‘pairwise buffer’ tool with the same minimal threshold of 94.5 kt DM/a in both cases. This approach is possible because the candidates for the scenarios with a capacity of 126 kt DM/a are a subset of those with a capacity of 94.5 kt DM/a. The subsequent application of the ‘service area’ tool, which generates catchment areas based on the actual street network, results in a refined pre-selection. We applied the ‘origin-destination cost matrix’ tool to the pre-selected candidate biorefinery locations. This tool generates connection lines from each candidate facility to all demand points reached in the 23 km radius. This step is necessary because pre-selection does not account for competition between the facilities for biomass resources. The data obtained are suitable as input data for the algebraic modeling language GAMS.

3.2.1. Scenario 1.1: Reduced Catchment Area and High Demand

In Scenario 1.1, we considered a reduced catchment area of 20.3 km and a high minimum biomass input threshold of 126 kt DM/a for the biorefineries. This scenario aimed to evaluate the feasibility of operating biorefineries with higher capacity requirements within a smaller geographic area. The key findings are that the model identified 869 candidate locations for biorefineries. However, after applying the optimization criteria, no optimal locations met the minimum biomass input threshold (see Table 1). This result indicates that combining a reduced catchment area and a high biomass input requirement is not feasible for identifying viable biorefinery locations in the outlined scenario.

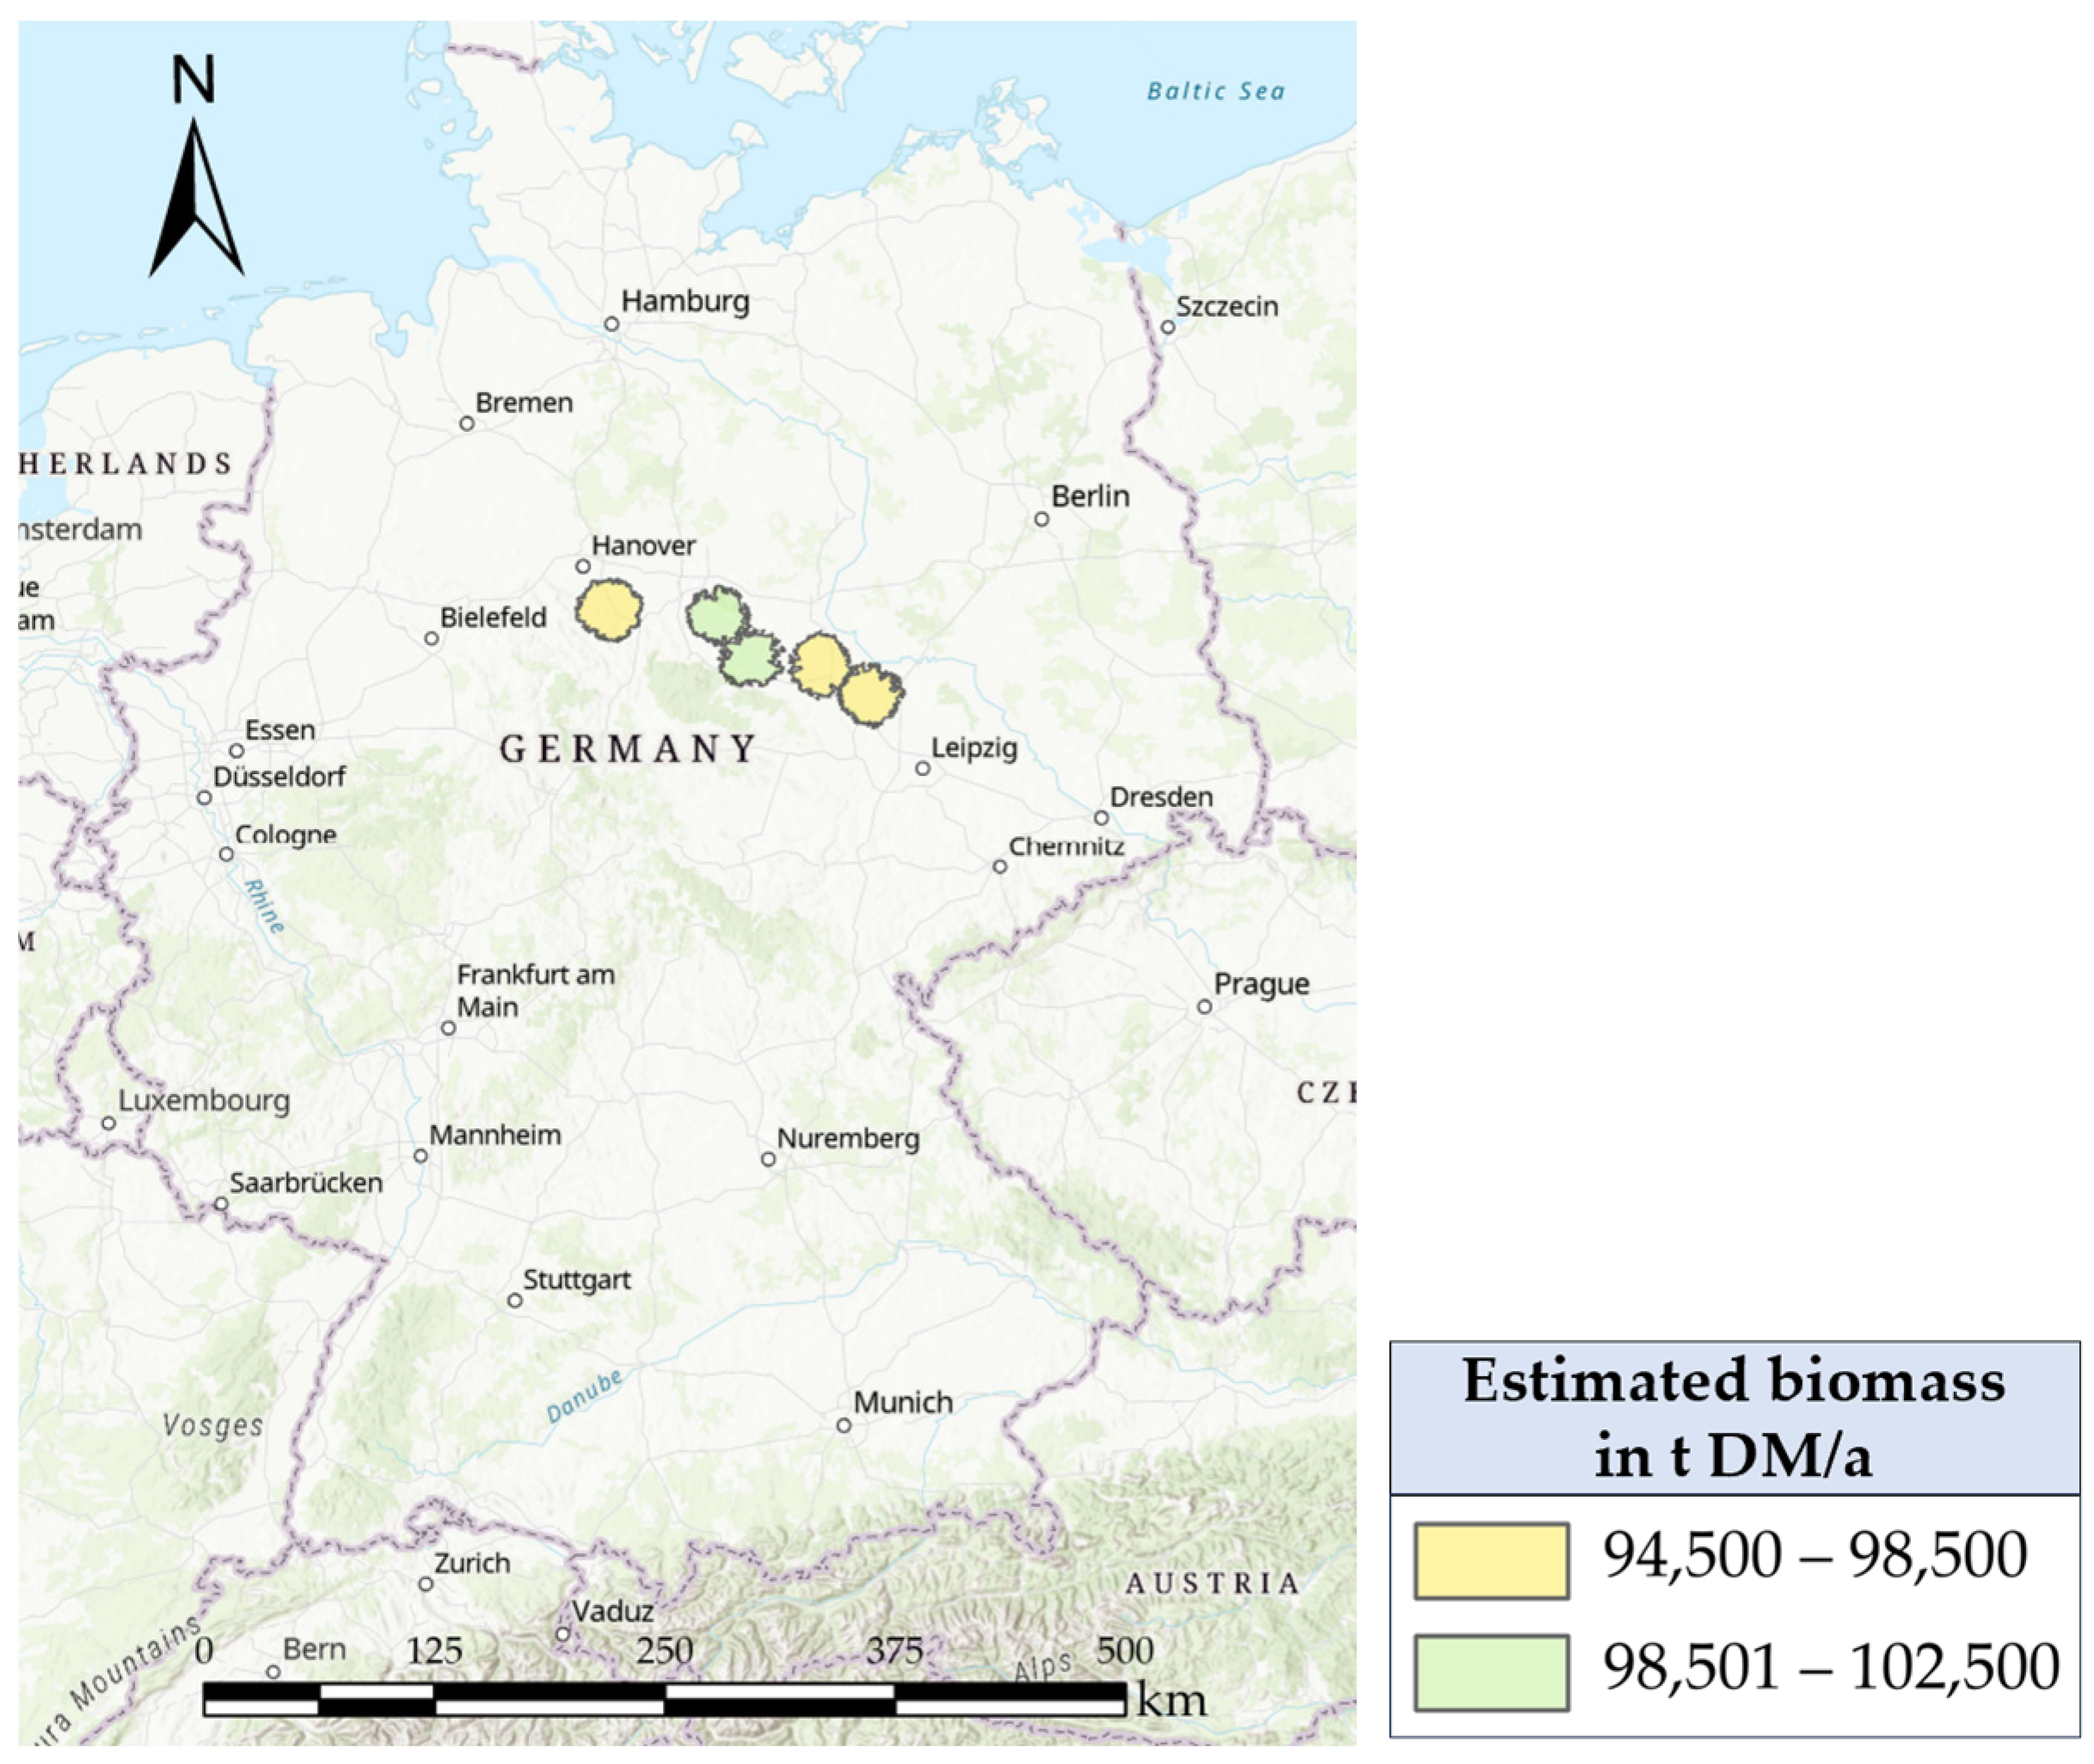
3.2.2. Scenario 1.2: Reduced Catchment Area and Low Demand

Scenario 1.2 also considered a reduced catchment area of 20.3 km, but with a lower minimum biomass input threshold of 94.5 kt DM/a. After 70 pre-selected candidate locations, 5 optimal locations were selected that met the minimum biomass input threshold (see Table 1).
The optimal locations were in the north of Germany, between the cities of Hanover and Leipzig, and in regions with high concentrations of agricultural residues (see Figure 7). These locations are strategically positioned to maximize the sum of collectable biomass covered by the reduced catchment areas. The total amount of biomass mobilized in this scenario was 0.49 Mt DM/a (see Table 1).

3.2.3. Scenario 2.1: Increased Catchment and Area High Demand

Scenario 2.1 considers an increased catchment area of 23 km and a high minimum biomass input threshold of 126 kt DM/a. This scenario aimed to assess the feasibility of operating biorefineries with higher capacity requirements over a larger geographic area, allowing for the inclusion of more dispersed biomass sources. Eight suitable locations of existing biogas plants were identified without considering competition between locations for resources. After optimization, two optimal locations were selected that met the minimum biomass input threshold (cf. Table 1). The optimal locations in Scenario 2.1 were found in regions with abundant biomass resources, including agricultural, forestry, and landscape maintenance residues (see Figure 8). These locations were strategically chosen to ensure efficient biomass collection within the larger catchment area.

3.2.4. Scenario 2.2: Increased Catchment Area and Low Minimum Demand

The pre-selection process revealed that Scenario 2.2 with 703 pre-selected locations was the most promising, as the highest overall coverage and amount of residue biomass mobilized was expected.
With the described input data, 69 locations were identified in Scenario 2.2 for an innovative multi-feed biorefinery with a minimum capacity of 94.5 kt DM and a maximum catchment area of 23 km (see Figure 9). The model gives an optimal selection of existing biogas plant locations for maximizing the amount of non-food biomass covered to be converted to bio-based chemicals. The total biomass flow in Scenario 2.2 is about 6.86 Mt DM/a.
The biorefinery sites are predominantly located in regions with above-average fertile soils and a high proportion of arable land. Figure 9 shows that a main corridor forms along the axis from southwest to northeast, with an accumulation between Hannover in the north and Dresden in the east. Additionally, there are some outliers in southeast near Munich, in the Pre-Alps.
Figure 9 additionally depicts existing biogas facility locations as purple dots (cf. [24]). The highest spatial density of biogas plants is observed in the northwest and southeast of Germany. This is mainly due to their usage in the livestock industry for processing manure for biogas. Conversely, the prime locations for integrated biorefineries are concentrated in regions with lower spatial density of biogas plants.
The remaining, non-mobilized biomass is not reached by any of the plants’ catchment areas. So, if there is residual lignocellulosic biomass available geographically and not concentrated enough to be processed economically with the proposed biorefinery concept, reducing the minimal demand of a plant and/or widening the catchment radius would lead to greater spatial coverage.

4. Discussion

Biorefineries can significantly contribute to reducing the consumption of fossil raw materials and, thus, anthropogenic CO2 emissions [27]. This study shows that sufficient, sustainable mobilizable biomass potentials are available in Germany to operate biorefineries in the identified geographical areas.
The findings of this study have several important implications. Firstly, the identification of optimal biorefinery locations based on sustainable biomass potentials can guide policymakers and investors in making informed decisions about bioeconomic infrastructure development. The integration of biorefineries with existing biogas plants can enhance resource efficiency and promote the use of renewable energy sources. Additionally, the decentralized approach to biomass utilization supports regional economic development and can lead to increased energy and production security, and reduced environmental impact.
However, investing in a biorefinery is a multi-criteria decision-making process in which factors other than biomass supply need to be considered. Expert interviews have revealed that a lack of experience with that kind of technology, insecurities regarding the stability of supply in the procurement market, and the demand from the sales market are the main obstacles to a positive investment decision [28].
Research in this area depends on the availability and access to detailed and recent land use and yield data. Although there have been reports of local farms obtaining funding (the EU’s common agricultural policy (CAP)), there is still a lack of compatible georeferenced data sets that would enable the integration of this information into the (residue) biomass potential analysis. A detailed estimation was conducted to improve the database of mobilizable (residue) biomass potentials in Germany.
The primary data from the literature were presented as a 10 × 10 km grid. More detailed data are desirable from a scientific point of view to improve the accuracy of the analysis results. However, this would demand greater effort for the data collection. The timeliness and regular standardized collection of data are crucial for the analyses and long-term studies. This is the only way to examine the influence of changing factors more closely and to create more reliable recommendations for action to support decisions for developing a sustainable bioeconomy. The model presented for estimating biomass potentials contributes to the merging of existing data for the bioeconomy into a powerful database. The applied scheme of data consolidation is transferable to other data sets or spatial areas in future works.
Since the biogas plant density varies greatly, according to Dotzauer et al. [29], the cannibalism effect with regard to biomass input for biogas plants and integrated biorefineries should not be underestimated. On the contrary, a high density of biogas plants can even be an obstacle for allocating biorefineries. For this purpose, site-specific analyses must be carried out, which evaluate the suitability of different plant concepts and investigate the possible combinations of different types of biogas plants with different types of biorefineries. Any discrepancies or outdated information in the data can affect the reliability of the results.
Since the (residue) biomass potentials considered in this work are very heterogenous, the plant technology needs to be matched with the local biomass mix. Moreover, the model assumes a constant supply of biomass, which may not account for seasonal variations and other factors affecting biomass availability. To mobilize as much biomass as possible, heterogeneous material should be processed in multi-input biorefineries. However, the technology comparison shows that no commercial plants in this area have been implemented in Germany, although sufficient (residue) biomass is available nationwide. This applies, in particular, to the production of platform chemicals. Some laboratory and demonstration plants have shown that platform chemicals can be obtained from mixed biogenic residues, but the transition to a commercial scale has not yet been successful. For example, the Technology Readiness Level (TRL) of the referenced biorefinery concept is currently between TRL 5 and 6 (cf. [9]), demonstrating their technical maturity in a relevant environment. Thus, further research and development is necessary to establish such concepts in the market.
Concerning the biorefinery concept and the use of energy crops, the cultivation area of renewable raw materials and the supply of mono-substrate biomasses in Germany has remained constant over the last decade. Contributing factors are the competition for land and low social acceptance (e.g., ‘food or fuel debate’) [2]. Consequently, no substantial expansion of the biorefinery concepts that use exclusively industrial crops is expected. The future task is not only to establish a further step in the cascadic use by converting biomass in biorefineries, but also to develop technical solutions to utilize a significant amount of heterogeneous (residue) biomass in biorefineries to foster the sustainable industrial production of biobased platform chemicals [30].
Creating incentives and introducing measures to support collaboration between farmers can be an approach to reduce risk stemming from investment and operational costs, and a lack of know-how during the first years of market diffusion of new biorefinery concepts. The joint operation of a plant or several plants in a cluster allows for the benefits of economies of scale to be derived and, e.g., the reduction of high personnel costs [9]. Increasing farmers’ willingness to participate in the bioeconomic transformation process is crucial for establishing changes in biomass valorization.
The economic viability of the proposed biorefinery locations depends on factors such as transportation costs, market demand for biobased products, and potential regulatory changes, which are not fully explored in this study. Transport costs have not been calculated in the scenario analysis in a detailed transport cost analysis. Instead, they are already included as a total sum in the biomass costs used by Götz et al. [9]. To acknowledge location-specific transportation costs, the model could be extended to solve a cost (capacitated)-based vehicle routing problem.
Any changes to the assumptions, the resource availability, or the techno-economic analysis of the biorefinery may first influence the minimal amount of feedstock and, subsequently, the outcome of the optimization model.
However, both developed models—the feedstock estimation model as well as the location-allocation model—are designed to be updated with new data when available. Due to their modular setup, they can also be adapted partially or entirely, and calibrated to new environments, serving other studies.
Despite the rather complementary spatial distribution of regions with a high density of biogas plants and prime regions for novel biorefinery concepts, there are still extensive regions seemingly not highly suitable for either technology. Further studies could investigate what mix of biomass is available in these regions. A technology comparison of state-of-the-art and innovative biomass conversion processes might give insights into which biorefinery concepts need to be developed to convert more biomass into high-value products. Modular, integrated biorefineries need to be adaptable to the regional biomass mix to mobilize more of the untapped biomass potential and close the gaps in the spatial coverage of biorefinery plants.
The reference value for the minimum substrate amount required is an important criterion that marks a threshold for competitiveness with the petrochemical industry. As soon as the price of fossil raw materials rises, e.g., due to environmentally regulated, continuously increasing CO2 taxes, shortages in the world market, or security policy autonomy, it can be expected that the reference value will drop significantly. Even on a local level, biorefineries could become competitive in specific locations. This study shows that the (residual) biomass potential already available today is sufficient without focusing on the production of industrial crops and inducing the rise of extensive monocultures. However, due to the current geopolitical situation and the fact that about 95% of fossil feedstock consumption is used for energy and fuel production [31], it must be assumed that the main focus in politics and business will stay on the energetic use of biomass. In this respect, the expansion of biorefineries and, subsequently, the amount of biobased chemicals produced, is expected to remain below the sustainable resource potential. The coupling of energy production and the production of biobased chemicals in integrated biorefinery concepts could counteract this maldevelopment. Given declining subsidies for existing biogas plants in Germany, integrated biorefineries could serve as a connection technology that benefits farmers and the sustainable development of bioeconomic production on an industrial scale.
Future research should focus on several areas to build on the findings of this study. Firstly, integrating more recent and high-resolution data sets can improve the accuracy of biomass potential estimations. Secondly, conducting a detailed economic analysis, including transportation costs and market dynamics, can provide a more comprehensive assessment of the feasibility of the proposed biorefinery locations. Additionally, exploring the potential for other types of biorefineries and biobased products can help diversify and strengthen the bioeconomy. Finally, investigating the environmental impacts of biorefinery operations, including lifecycle assessments, can ensure that the transition to a bioeconomy is both sustainable and beneficial.

5. Conclusions

We investigated the potential of spatially distributed, lignocellulosic, non-food residue biomass in Germany. Based on the developed database and GIS model, we also gave an example of how the georeferenced biomass data could be used in an algebraic optimization model to identify optimal locations for a modular multi-feed and multi-output lignocellulose biorefinery concept. According to the location-allocation model results, 69 optimal locations of existing biogas facilities met the minimal requirement of 94.5 kt DM/a in a catchment radius of 23 km.
Scenario comparisons showed that a change in the minimum feasible input quantity and the catchment radius, or the available biomass quantity in the catchment area, significantly influence the network density of biorefineries in the model’s results. The lower the minimum feasible input quantity, the more the theoretically available biomass quantity can be mobilized, and the more area is captured. Small-scale, decentralized technology can therefore play a role in value-creation in rural areas, and thus contribute to the resilient bioeconomic production of platform chemicals.
An essential part of the novelty of this study is the first-time application of the combined use of GIS and mathematical modeling to optimize locations for the introduced innovative, integrated, and small-scale biorefinery concept. By integrating GIS data with a location-allocation model, we offered a comprehensive analysis that supports the development of sustainable bioeconomic infrastructure. This approach not only identifies the most suitable sites for biorefineries but also promotes the integrated use of existing biogas facilities. The findings provide actionable insights for policymakers and investors, facilitating informed decision-making in bioeconomic development. Additionally, the decentralized biorefinery model supports regional economic growth and contributes to energy security and environmental sustainability.
With the introduced flexible GIS model, various further potential studies and scenario analyses are conceivable, for example, analyses for other biorefinery types and configurations. Accordingly, the biomass mix of interest can be modeled, and its composition can be varied. Due to the ability to update, manipulate, and extend the local potential amount for each biomass category, numerous other future scenarios can be analyzed cost-effectively, and the model can be extended to other geographical areas.
It should be noted that (residual) biomasses represent a heterogeneous and spatially distributed source of raw materials, for whose industrial tapping an integrated, (semi-)decentralized processing is required. The lack of maturity of biorefinery technology for this integrated use as a multi-feedstock biorefinery is a factor that currently seems to limit the expansion of the bioeconomy. In addition to the organizational tapping of the potential, the technical development of the existing plant types into small-scale and robust biorefinery concepts is crucial. This should be seen as an area of future research. In addition to technological advancements, continuous economic assessment, and environmental impact assessment, through lifecycle analysis the multifactorial willingness of actors to participate in novel bioeconomic value networks should be part of future research efforts.
To integrate additional, individual decision factors other than the ones above, different modeling approaches might be considered. For example, a bottom-up approach with agent-based modeling has been proven to be promising [32]. Combining classical top-down algebraic optimization with bottom-up agent-based simulation could result in more holistic modeling and, thus, more relevant and sustainable results [33].

Author Contributions

Conceptualization, R.H.; methodology, R.H. and A.R.; software, R.H., A.R. and D.L.; validation, R.H. and A.R.; formal analysis, R.H.; investigation, R.H.; resources, R.H. and D.L.; data curation, R.H., A.R. and D.L.; writing—original draft preparation, R.H.; writing—review and editing, R.H., A.R., D.L. and F.S.; visualization, R.H. and D.L.; supervision, F.S.; project administration, F.S.; funding acquisition, F.S. All authors have read and agreed to the published version of the manuscript.

Funding

This research was funded by the German Federal Ministry of Education and Research, with the project CoBiVal (Cooperation and Competition in Bioeconomy Value Chains), grant number 031B0784.

Institutional Review Board Statement

Not applicable.

Informed Consent Statement

Not applicable.

Data Availability Statement

Dataset available on request from the authors.

Conflicts of Interest

The authors declare no conflicts of interest. The funders had no role in the design of the study, in the collection, analyses, or interpretation of the data, in the writing of the manuscript, or in the decision to publish the results.

References

  1. Brosowski, A. National Resource Monitoring for Biogenic Residues, By-Products and Wastes: Development of a Systematic Data Collection, Management and Assessment for Germany. Ph.D. Dissertation, Leipzig University, Leipzig, Germany, 2021. [Google Scholar] [CrossRef]
  2. Platt, R.; Bauen, A.; Reumerman, P.; Geier, C.; van Ree, R.; Vural Gursel, I.; Garcia, L.; Behrens, M.; von Bothmer, P.; Howes, J.; et al. EU Biorefinery Outlook to 2030: Studies on Support to Research and Innovation Policy in the Area of Bio-Based Products and Services; Publications Office of the European Union: Luxembourg, 2021; ISBN 978-92-76-32156-9. [Google Scholar]
  3. Heck, R.; Rudi, A.; Schultmann, F. An Assessment of Biomass Potentials for Decentral Biorefineries in Germany, Based on a Geoinformation System Model. In Proceedings of the 31st European Biomass Conference and Exhibition, Bologna, Italy, 6 May–6 October 2023; pp. 30–36. [Google Scholar] [CrossRef]
  4. Questell-Santiago, Y.M.; Zambrano-Varela, R.; Talebi Amiri, M.; Luterbacher, J.S. Carbohydrate stabilization extends the kinetic limits of chemical polysaccharide depolymerization. Nat. Chem. 2018, 10, 1222–1228. [Google Scholar] [CrossRef] [PubMed]
  5. Pudelko, R.; Borzecka-Walker, M.; Faber, A. Biomass Based Energy Intermediates Boosting Biofuel Production. The Feedstock Potential Assessment for EU-27 + Switzerland in NUTS-3. Project Co-Funded by the European Commisson FP7 Directorate-General for Transport and Energy Grant No. 282873. D1.2. BioBoost. 2013. Available online: https://bioboost.eu/uploads/files/bioboost_d1.2_iung_feedstock_potential_vers1_0-final.pdf (accessed on 29 May 2024).
  6. Petig, E.; Rudi, A.; Angenendt, E.; Schultmann, F.; Bahrs, E. Linking a farm model and a location optimization model for evaluating energetic and material straw valorization pathways—A case study in Baden-Wuerttemberg. GCB Bioenergy 2019, 11, 304–325. [Google Scholar] [CrossRef]
  7. Tsita, K.G.; Pilavachi, P.A. Evaluation of next generation biomass derived fuels for the transport sector. Energy Policy 2013, 62, 443–455. [Google Scholar] [CrossRef]
  8. Gauder, M.; Graeff-Hönninger, S.; Claupein, W. Identifying the regional straw potential for energetic use on the basis of statistical information. Biomass Bioenergy 2011, 35, 1646–1654. [Google Scholar] [CrossRef]
  9. Götz, M.; Rudi, A.; Heck, R.; Schultmann, F.; Kruse, A. Processing Miscanthus to high-value chemicals: A techno-economic analysis based on process simulation. GCB Bioenergy 2022, 14, 447–462. [Google Scholar] [CrossRef]
  10. Brosowski, A.; Thrän, D.; Mantau, U.; Mahro, B.; Erdmann, G.; Adler, P.; Stinner, W.; Reinhold, G.; Hering, T.; Blanke, C. A review of biomass potential and current utilisation—Status quo for 93 biogenic wastes and residues in Germany. Biomass Bioenergy 2016, 95, 257–272. [Google Scholar] [CrossRef]
  11. Deutsches Biomasseforschungszentrum gemeinnützige GmbH. DBFZ Ressourcendatenbank. Available online: https://webapp.dbfz.de/resource-database/?lang=de (accessed on 8 February 2022).
  12. Schröder, T. Simultane Planung von Standort, Kapazität und Konfiguration von Bioraffinerien; Cuvillier Verlag: Goettingen, Germany, 2017; ISBN 9783736985797. [Google Scholar]
  13. Schwaderer, F. Integrierte Standort-, Kapazitäts- Und Technologieplanung von Wertschöpfungsnetzwerken Zur Stofflichen Und Energetischen Biomassenutzung; KIT Scientific Publishing: Karlsruhe, Germany, 2012. [Google Scholar]
  14. Gocht, A.; Röder, N. Using a Bayesian estimator to combine information from a cluster analysis and remote sensing data to estimate high-resolution data for agricultural production in Germany. Int. J. Geogr. Inf. Sci. 2014, 28, 1744–1764. [Google Scholar] [CrossRef]
  15. BKG. CORINE Land Cover 5 ha, Stand 2018. Available online: https://gdz.bkg.bund.de/index.php/default/corine-land-cover-5-ha-stand-2018-clc5-2018.html (accessed on 25 May 2023).
  16. ArcGIS; BKG. Verwaltungsgrenzen Deutschland. Available online: https://hub.arcgis.com/datasets/ae25571c60d94ce5b7fcbf74e27c00e0/about (accessed on 25 May 2023).
  17. Bundesamt für Naturschutz. BfN. Schutzgebiete in Deutschland. Available online: https://geodienste.bfn.de/schutzgebiete?lang=de (accessed on 30 December 2021).
  18. Thünen-Institut. Thünen Atlas: Agraratlas Daten Gemeindeebene. Available online: https://atlas.thuenen.de/layers/agraratlas:geonode:levl_2016_lau2 (accessed on 25 May 2023).
  19. Fachagentur Nachwachsende Rohstoffe e.V. FNR. Basisdaten Bioenergie Deutschland 2020. 2020. Available online: https://www.fnr.de/fileadmin/Projekte/2020/Mediathek/broschuere_basisdaten_bioenergie_2020_web.pdf (accessed on 25 July 2024).
  20. Krause, T.; Mantau, U.; Mahro, B.; Noke, A.; Richter, F.; Raussen, T.; Bischof, R.; Hering, T.; Thrän, D.; Brosowski, A. Nationales Monitoring biogener Reststoffe, Nebenprodukte und Abfälle in Deutschland Teil 1: Basisdaten zu Biomassepotenzialen. Available online: https://www.openagrar.de/receive/openagrar_mods_00065538 (accessed on 29 May 2024).
  21. DBFZ. Systembeitrag von Biomasse. Available online: https://www.dbfz.de/forschung/forschungsschwerpunkte/systembeitrag-von-biomasse (accessed on 27 October 2021).
  22. Rudi, A.; Müller, A.-K.; Fröhling, M.; Schultmann, F. Biomass Value Chain Design: A Case Study of the Upper Rhine Region. Waste Biomass Valor 2017, 8, 2313–2327. [Google Scholar] [CrossRef]
  23. GAMS Development Corporation. General Algebraic Modeling System. Available online: https://www.gams.com/ (accessed on 25 July 2024).
  24. Bundesnetzagentur. 2024. Available online: https://www.marktstammdatenregister.de/MaStR/Einheit/Einheiten/OeffentlicheEinheitenuebersicht (accessed on 20 May 2024).
  25. Nitzsche, R.; Budzinski, M.; Majer, S.; Gröngröft, A.; Müller-Langer, F. Bilanzierung und–Bewertung Holzbasierter Bioraffineriekonzepte Ergebnisse in Kurzform—Begleitforschung Spitzencluster BioEconomy Arbeitspaket TP 5.1.1.2; Deutsches Biomasseforschungszentrum gemeinnützige GmbH: Leipzig, Germany, 2016. [Google Scholar]
  26. Bockholt, K. Grüne 4: Landwirte protestieren gegen 4 Prozent Flächenstilllegung. Agrarheute. 2022. Available online: https://www.agrarheute.com/pflanze/getreide/gruene-4-landwirte-protestieren-gegen-4-prozent-flaechenstilllegung-591619 (accessed on 29 May 2024).
  27. Karras, T.; Brosowski, A.; Thrän, D. A Review on Supply Costs and Prices of Residual Biomass in Techno-Economic Models for Europe. Sustainability 2022, 14, 7473. [Google Scholar] [CrossRef]
  28. Robaey, Z.; Asveld, L.; Sinha, K.M.; Wubben, E.; Osseweijer, P. Identifying practices of inclusive biobased value chains: Lessons from corn stover in Iowa, sugar cane in Jamaica, and sugar beet in the Netherlands. Clean. Circ. Bioecon. 2022, 3, 100032. [Google Scholar] [CrossRef]
  29. Dotzauer, M.; Daniel-Gromke, J.; Barchmann, T. Anlagenbestand Biogas und Biomethan Biogaserzeugung und-Nutzung in Deutschland; 6. Info-Veranstaltung Zum Klimaschutz—Zukunft Der Biogasanlagen; Deutsches Biomasseforschungszentrum gemeinnützige GmbH: Leipzig, Germany, 2021. [Google Scholar]
  30. Yoshioka, T.; Sakurai, R.; Aruga, K.; Sakai, H.; Kobayashi, H.; Inoue, K. A GIS-based analysis on the relationship between the annual available amount and the procurement cost of forest biomass in a mountainous region in Japan. Biomass Bioenergy 2011, 35, 4530–4537. [Google Scholar] [CrossRef]
  31. Verband der Chemischen Industrie e.V. Rohstoffbasis der Chemieindustrie. In Daten und Fakten 2019; Verband der Chemischen Industrie e.V.: Frankfurt am Main, Germany, 2019. [Google Scholar]
  32. Burg, V.; Troitzsch, K.G.; Akyol, D.; Baier, U.; Hellweg, S.; Thees, O. Farmer’s willingness to adopt private and collective biogas facilities: An agent-based modeling approach. Resour. Conserv. Recycl. 2021, 167, 105400. [Google Scholar] [CrossRef]
  33. Pyka, A.; Cardellini, G.; van Meijl, H.; Verkerk, P.J. Modelling the bioeconomy: Emerging approaches to address policy needs. J. Clean. Prod. 2022, 330, 129801. [Google Scholar] [CrossRef]
Figure 1. Applied procedural principle for the generation of a database for biomass potential estimation (based on Schröder [12]).
Sustainability 16 06781 g001
Figure 2. Catchment area (green polygon) of one biorefinery (red square) and road connections (red lines) to biomass supply centroids.
Sustainability 16 06781 g002
Figure 3. Geospatial distribution of mobilizable residual straw in Germany, based on a catchment area of 100 km2.
Sustainability 16 06781 g003
Figure 4. Geospatial distribution of mobilizable hay in Germany, based on a catchment area of 100 km2.
Sustainability 16 06781 g004
Figure 5. Geospatial distribution of mobilizable residual wood from forests in Germany, based on a catchment area of 100 km2.
Sustainability 16 06781 g005
Figure 6. Geospatial distribution of mobilizable landscape conservation residues in Germany, based on a catchment area of 100 km2.
Sustainability 16 06781 g006
Figure 7. Optimal location-allocation for lignocellulosic biorefineries with a maximum catchment distance of 20.3 km and a minimal feedstock amount of untapped but technically mobilizable residue biomass of 94.5 kt DM/a (i.e., Scenario 1.2).
Sustainability 16 06781 g007
Figure 8. Optimal location-allocation for lignocellulosic biorefineries with a maximum catchment distance of 23 km and a minimal feedstock amount of untapped but technically mobilizable residue biomass of 126 kt DM/a (i.e., Scenario 2.1).
Sustainability 16 06781 g008
Figure 9. Optimal location-allocation for lignocellulosic biorefineries with a maximum catchment distance of 23 km and a minimal feedstock amount of untapped but technically mobilizable residue biomass of 94.5 kt DM/a (i.e., Scenario 2.2).
Sustainability 16 06781 g009
Table 1. Overview of the scenarios with their parameters and the number of potential and optimal locations.
ScenariosRadius (in km)Biomass Threshold (in kt DM/a)Number of Candidate
Locations
Number of Optimal LocationsTotal Biomass Flow (in Mt DM/a)
Pairwise BufferService Area
Scenario 1.120.3126869000
Scenario 1.220.394.57050.49
Scenario 2.1231266574820.26
Scenario 2.22394.5703696.86
Disclaimer/Publisher’s Note: The statements, opinions and data contained in all publications are solely those of the individual author(s) and contributor(s) and not of MDPI and/or the editor(s). MDPI and/or the editor(s) disclaim responsibility for any injury to people or property resulting from any ideas, methods, instructions or products referred to in the content.

