Review

The Relationship between Green Infrastructure and Air Pollution, History, Development, and Evolution: A Bibliometric Review

School of Architecture & Architectural Engineering, Hanyang University ERICA, 55 Hanyangdaehak-ro, Sangnok-gu, Ansan 15588, Republic of Korea
*
Author to whom correspondence should be addressed.
Sustainability 2024, 16(16), 6765; https://doi.org/10.3390/su16166765
Submission received: 9 July 2024 / Revised: 5 August 2024 / Accepted: 6 August 2024 / Published: 7 August 2024

Abstract

:
In response to the challenge of atmospheric pollution posed by growing environmental problems, this study reviews and analyzes the research status and development trends of green infrastructure (GI) in improving air pollution from 2014 to 2024. Using the CiteSpace tool, we explore research hotspots, disciplinary developments, significant contributors, and influential literature in this field, identifying current research gaps and predicting future trends. The findings indicate that GI significantly impacts the reduction of air pollution, the regulation of urban microclimates, and the enhancement of ecosystem services. However, existing studies often focus on isolated aspects and lack comprehensive assessments. Moreover, the research trajectory in this field shows a declining trend. Future research should emphasize interdisciplinary integration, combining ecology, urban planning, meteorology, and public health. By utilizing advanced technologies, such as drones, remote sensing, AI, and big data analysis, we can improve data accuracy and the generalizability of research findings. Additionally, it is crucial to consider the performance of GI under different climatic conditions and socio-economic contexts to comprehensively quantify its overall benefits in terms of air quality, urban thermal comfort, public health, and economic impact. This comprehensive approach will provide a scientific basis for policy-making and urban planning.

1. Introduction

Countries worldwide have increasingly emphasized sustainable development and reduction or prevention of environmental pollution in recent years. With the accelerated urbanization process, various compounds released into the atmosphere by industrial production have caused numerous environmental and health issues [1]. Byproducts of combustion, such as sulfur dioxide, carbon monoxide, nitrogen dioxide, and particulate matter, are often discharged into the atmosphere, leading to urban air pollution, ozone layer depletion, and global climate system changes, which are significant environmental threats to ecosystems and human health [2,3]. Air pollution, or atmospheric pollution, refers to the phenomenon where certain substances enter the atmosphere due to human activities or natural processes, reach sufficient concentrations for a significant period, and thus harm human comfort, health, welfare, or the environment. These substances can be gases, solids, or liquid suspensions. The World Health Organization (WHO) lists six typical air pollutants: carbon monoxide (CO), lead (Pb), nitrogen dioxide (NO2), suspended particulate matter (SPM), sulfur dioxide (SO2), and ozone (O3) [4].
Asian cities suffer from the most severe air pollution in the world. Of the 15 cities with the worst particulate pollution globally, 12 are in Asia. Moreover, six of these cities also have high concentrations of atmospheric SO2, far exceeding the international air quality standards recommended by the WHO [4]. Cities such as Beijing, Kolkata, Jakarta, New Delhi, Shanghai, and Tehran are notorious for their high concentrations of suspended particulate matter [5]. New Delhi recorded the highest suspended particulate matter at 420 mg/m3, and Tehran has recorded SO2 concentrations four times the WHO recommended levels [5]. According to the WHO’s 2019 Ambient Air Quality Database (Figure 1), only 17% of cities in high-income countries had air quality below the WHO’s recommended thresholds for PM2.5 or PM10 among the 117 countries where air quality was monitored [4]. Therefore, improving air quality has become a critical issue that countries worldwide urgently need to address.
Current researchers offer various definitions of green infrastructure, which can be summarized as follows: (a) A network for ecosystem services: Benedict and McMahon [6], in their book “Green Infrastructure: Linking Landscapes and Communities”, define green infrastructure (GI) as a network composed of natural and semi-natural areas aimed at providing ecosystem services and enhancing quality of life. (b) A tool for sustainable urban development: Ahern [7] defines it as the use of natural systems and technologies in urban environments to improve water quality, reduce flooding, enhance biodiversity, and provide aesthetic and mental health benefits. (c) A climate change adaptation strategy: Gill et al. [8] define GI as using natural ecosystems and green spaces to enhance urban and community resilience to climate change, including reducing the urban heat island effect and regulating temperature. (d) Water resource management and flood control: Fletcher et al. [9] define GI as using vegetation, soil, and other natural elements to manage water resources and control flooding, reduce stormwater runoff, and improve water quality. Based on these definitions, this study defines GI as an integrated planning tool for promoting sustainable development, forming an interconnected network of natural and artificial elements to protect ecosystem functions, enhance environmental quality, and provide various benefits to human society [10]. These elements include parks, old-growth forests, green spaces, river corridors, wetlands, green roofs, green walls, permeable pavements, urban forests, etc.
Geography and urban planning scholars are extensively researching the relationship between air quality and green infrastructure (GI). Previous studies in this research area have confirmed that GI plays a crucial role in climate change adaptation [11,12], helps cities mitigate the impacts of climate change [13,14,15], and enhances urban resilience [16,17]. Additionally, GI reduces air pollutants and improves air quality [18,19,20]. Furthermore, improved air quality due to GI has positive health impacts [21,22,23]. Using scientific mapping, this study will summarize the research status, hotspots, and GI and air pollution trends. It provides reliable scientific evidence for scholars in related fields, highlighting the current state of research, key issues, and future research directions.

2. Data Sources and Methods

2.1. Data Sources

The core Web of Science (WoS) collection is the world’s leading citation database. It contains article records from the most impactful journals globally, including open-access journals, conference proceedings, and books. It is also the database for the world’s most prestigious core academic publications, spanning the natural sciences, engineering, arts, humanities, biology, and medicine. The database includes the Science Citation Index Expanded (SCIE), Social Sciences Citation Index (SSCI), Arts & Humanities Citation Index (A&HCI), and Emerging Sources Citation Index (ESCI) [24]. To ensure data completeness, the researchers applied the following search terms to the WoS database: TS = (“green infrastructure” OR “green land” OR “green area”) AND TS = (“air pollution” OR “atmospheric pollution” OR “air quality”). The time frame selected was from 1 January 2014 to 1 May 2024, and the publication language was restricted to English. This study excluded (a) early access articles, (b) book chapters, (c) data papers, (d) proceeding papers, (e) editorial materials, and (f) research papers with incomplete literature and those irrelevant to the research topic. A total of 596 documents were retrieved (as of 6 May 2024).

2.2. Research Methodology

This study utilized CiteSpace (Version: 6.3.R2) to conduct a bibliometric analysis and construct a knowledge map. A knowledge map is a graphical representation of scientific knowledge, depicting the development process and structural relationships within scientific knowledge [25]. By visualizing the knowledge map, we can gain insights into the structure of various fields within the knowledge system, construct knowledge networks, and predict the frontiers of scientific technology and knowledge. It visualizes knowledge and a serialized knowledge lineage, illustrating complex relationships such as networks, interactions, derivations, evolutions, and intersections among knowledge groups [26]. CiteSpace is a specialized analysis tool for visualizing scientific literature [27]. It is primarily used to analyze citation relationships, author collaboration networks, keyword frequencies, and deeper information, such as variations in the literature structure and the emergence of keywords, thereby assisting researchers in gaining a deeper understanding of the development trends, history, changes, and research hotspots within their respective disciplines.

3. Bibliometric Analysis

3.1. Statistics by Subject of Publication

From 1 January 2014 to 1 May 2024, 596 articles were published, involving 175 journals, 198 countries and regions, 1716 institutions, and 2360 authors. The statistical results are summarized in Table 1.
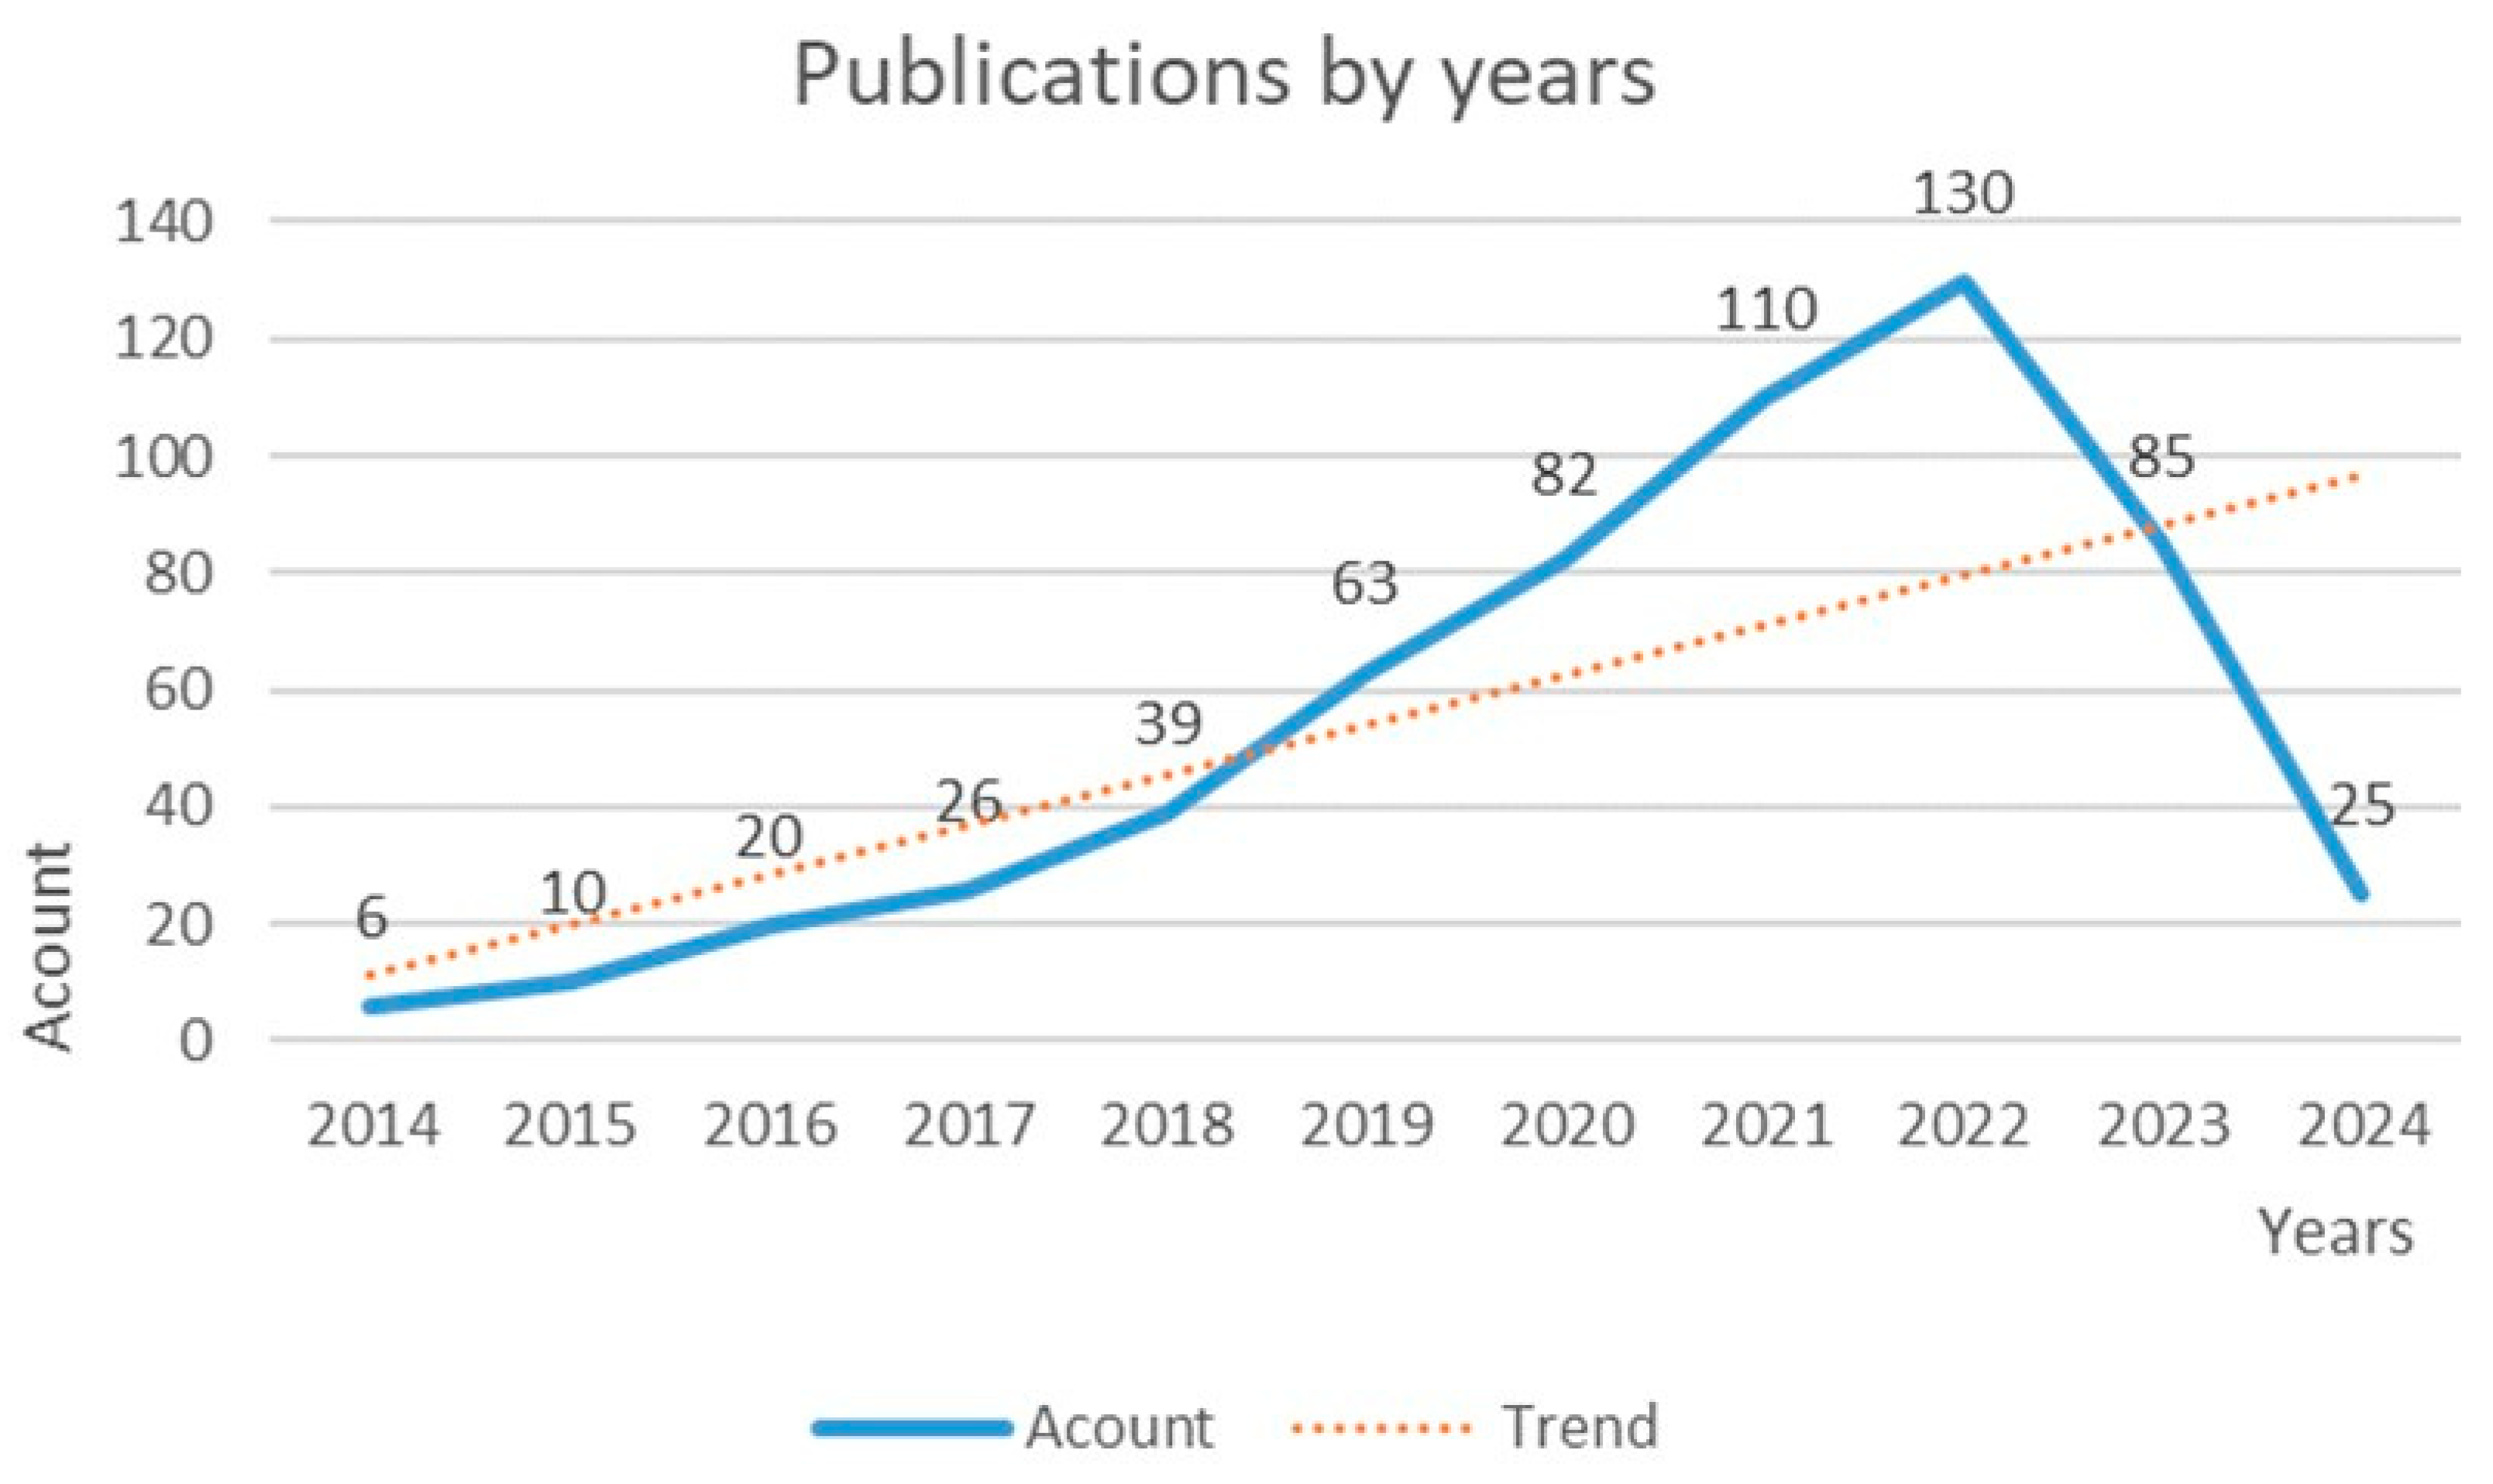
Figure 2 depicts the quantity and trend of publications related to GI and air pollution over the past decade. In 2022, there were 130 relevant publications. Although there was a slight decrease in 2023, which can be attributed to the impact of COVID-19, the steadily increasing trendline indicates a growing interest among researchers in this field.
Regarding national distribution (Table 2), China leads with 125 publications (20.93%), making it the country with the highest number of publications in this research area. The United States and England follow China, with 112 (18.79%) and 104 (17.45%) publications, respectively. Italy and Australia also rank among the top five countries, indicating significant attention from researchers in these countries to the impact of GI on air pollution.
In terms of institutional affiliations, the top ten research institutions are predominantly from European and North American countries, with Italy (three institutions), the United Kingdom (two institutions), and the United States (two institutions) leading the list (Table 3). Only two research institutions from China make it to the top ten, indicating a greater focus on green sustainable development topics in European and North American countries. Conversely, there appears to be a lack of emphasis on environmental and air pollution issues in Asia, where air pollution is more severe.
In terms of disciplinary distribution, the top ten research disciplines mainly revolve around environmental science ecology, other scientific and technological fields, forestry, urban studies, plant sciences, engineering, architectural technology, meteorology and atmospheric science, public environmental and occupational health, and energy fuels (Table 4). Certain articles belong to interdisciplinary fields, which may be simultaneously classified into different disciplinary domains. Hence, the disciplinary classification count exceeds the total number of journal articles.

3.2. Author Collaboration Network

To some extent, the total number of papers published in journals represents the academic standing of the authors in the field. In contrast, the author’s collaboration network can reflect the core group of researchers and their collaborative relationships. This aspect was visualized and analyzed using CiteSpace software, with the results shown in 
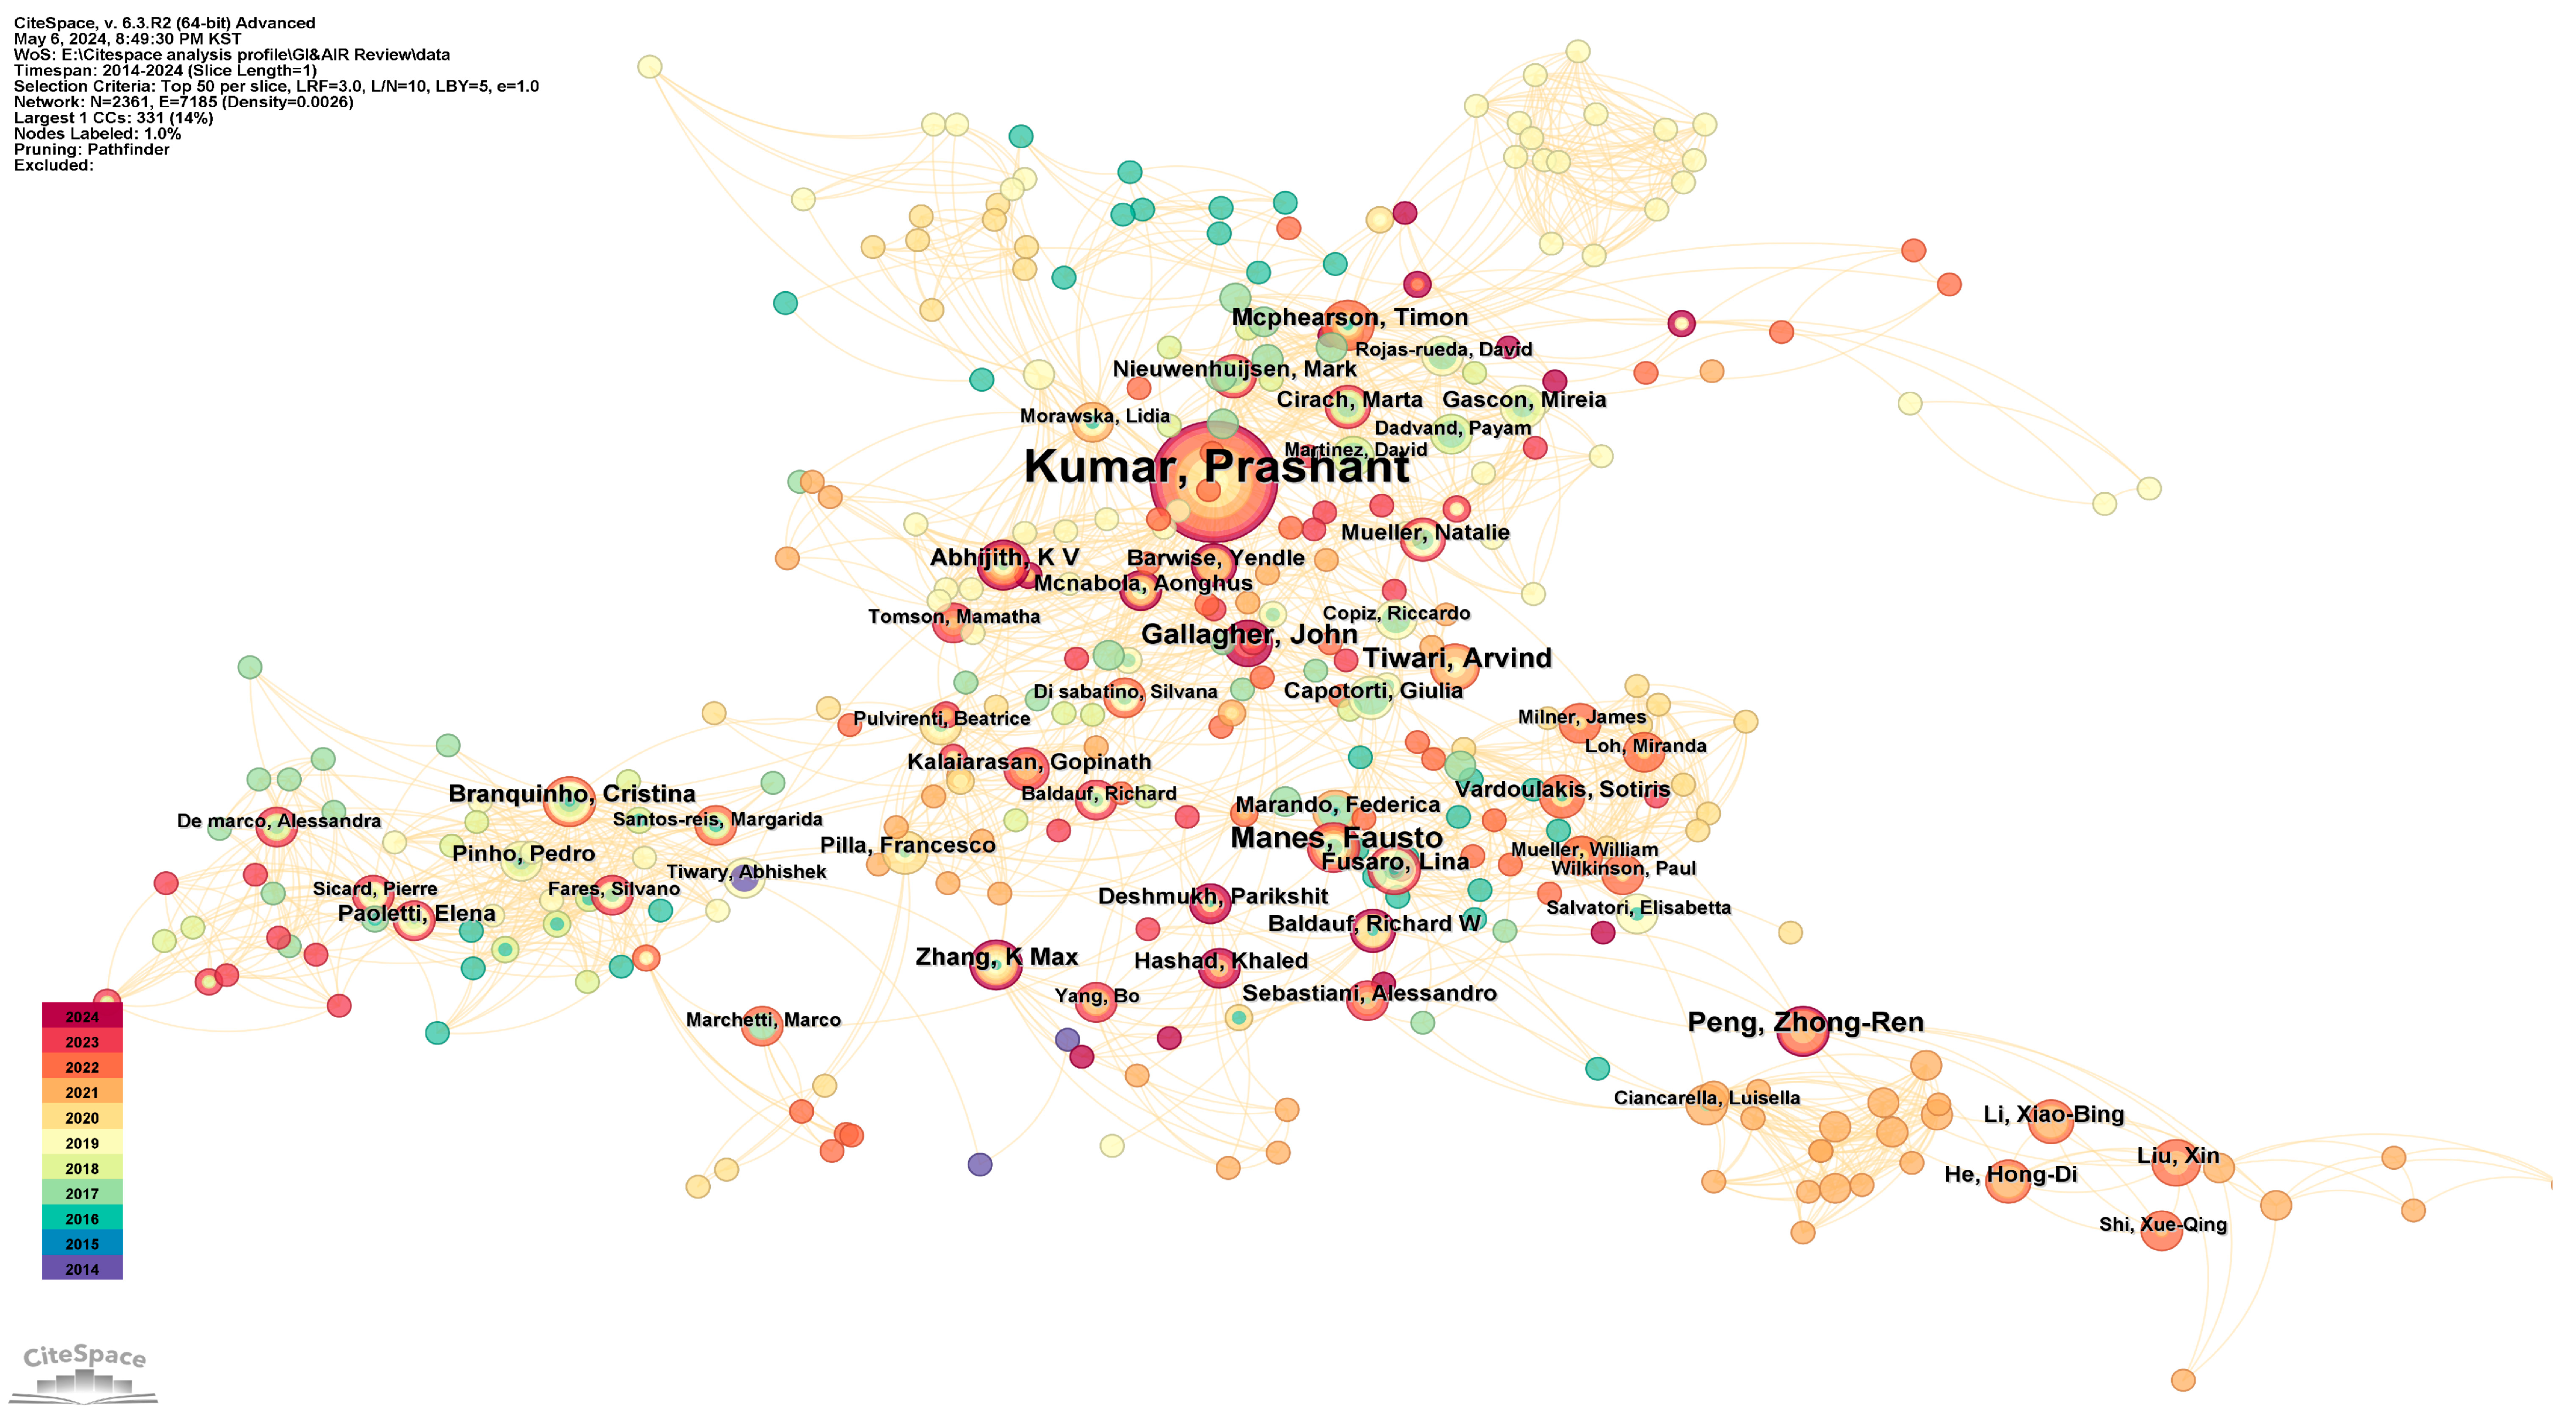
Figure 3. The size of the nodes represents the number of papers co-authored by the authors; the connections between nodes indicate collaborative relationships among different authors; and the node colors represent the publication years of the papers. Analyzing the number of papers authored by researchers and their connections in the research field helps identify prolific and influential authors [27].
From Figure 3, we screened authors with greater than or equal to four publications. Each node corresponds to an author, and the connecting lines between nodes represent links between authors, the node color corresponds to the time of appearance. After software calculations, there were 2361 nodes and 7185 edges. The network diagram depicts the largest network relationship. Regarding the number of published articles, Kumar has the highest number, with 32 papers (Table 5), making him the most prolific author in this field. Due to being extensively cited by many authors, Kumar P has formed close collaborative relationships with numerous researchers and has significantly influenced the field. Other noteworthy authors include Branquinho, C, Zhang, KM, Mcphearson, T, and Abhijith, KV. Although they have not published the most papers, their works have been cited to varying degrees by other scholars in the field (Table 6), indicating their influence and research potential in this area.

3.3. Journal Citation Path Dual-Map

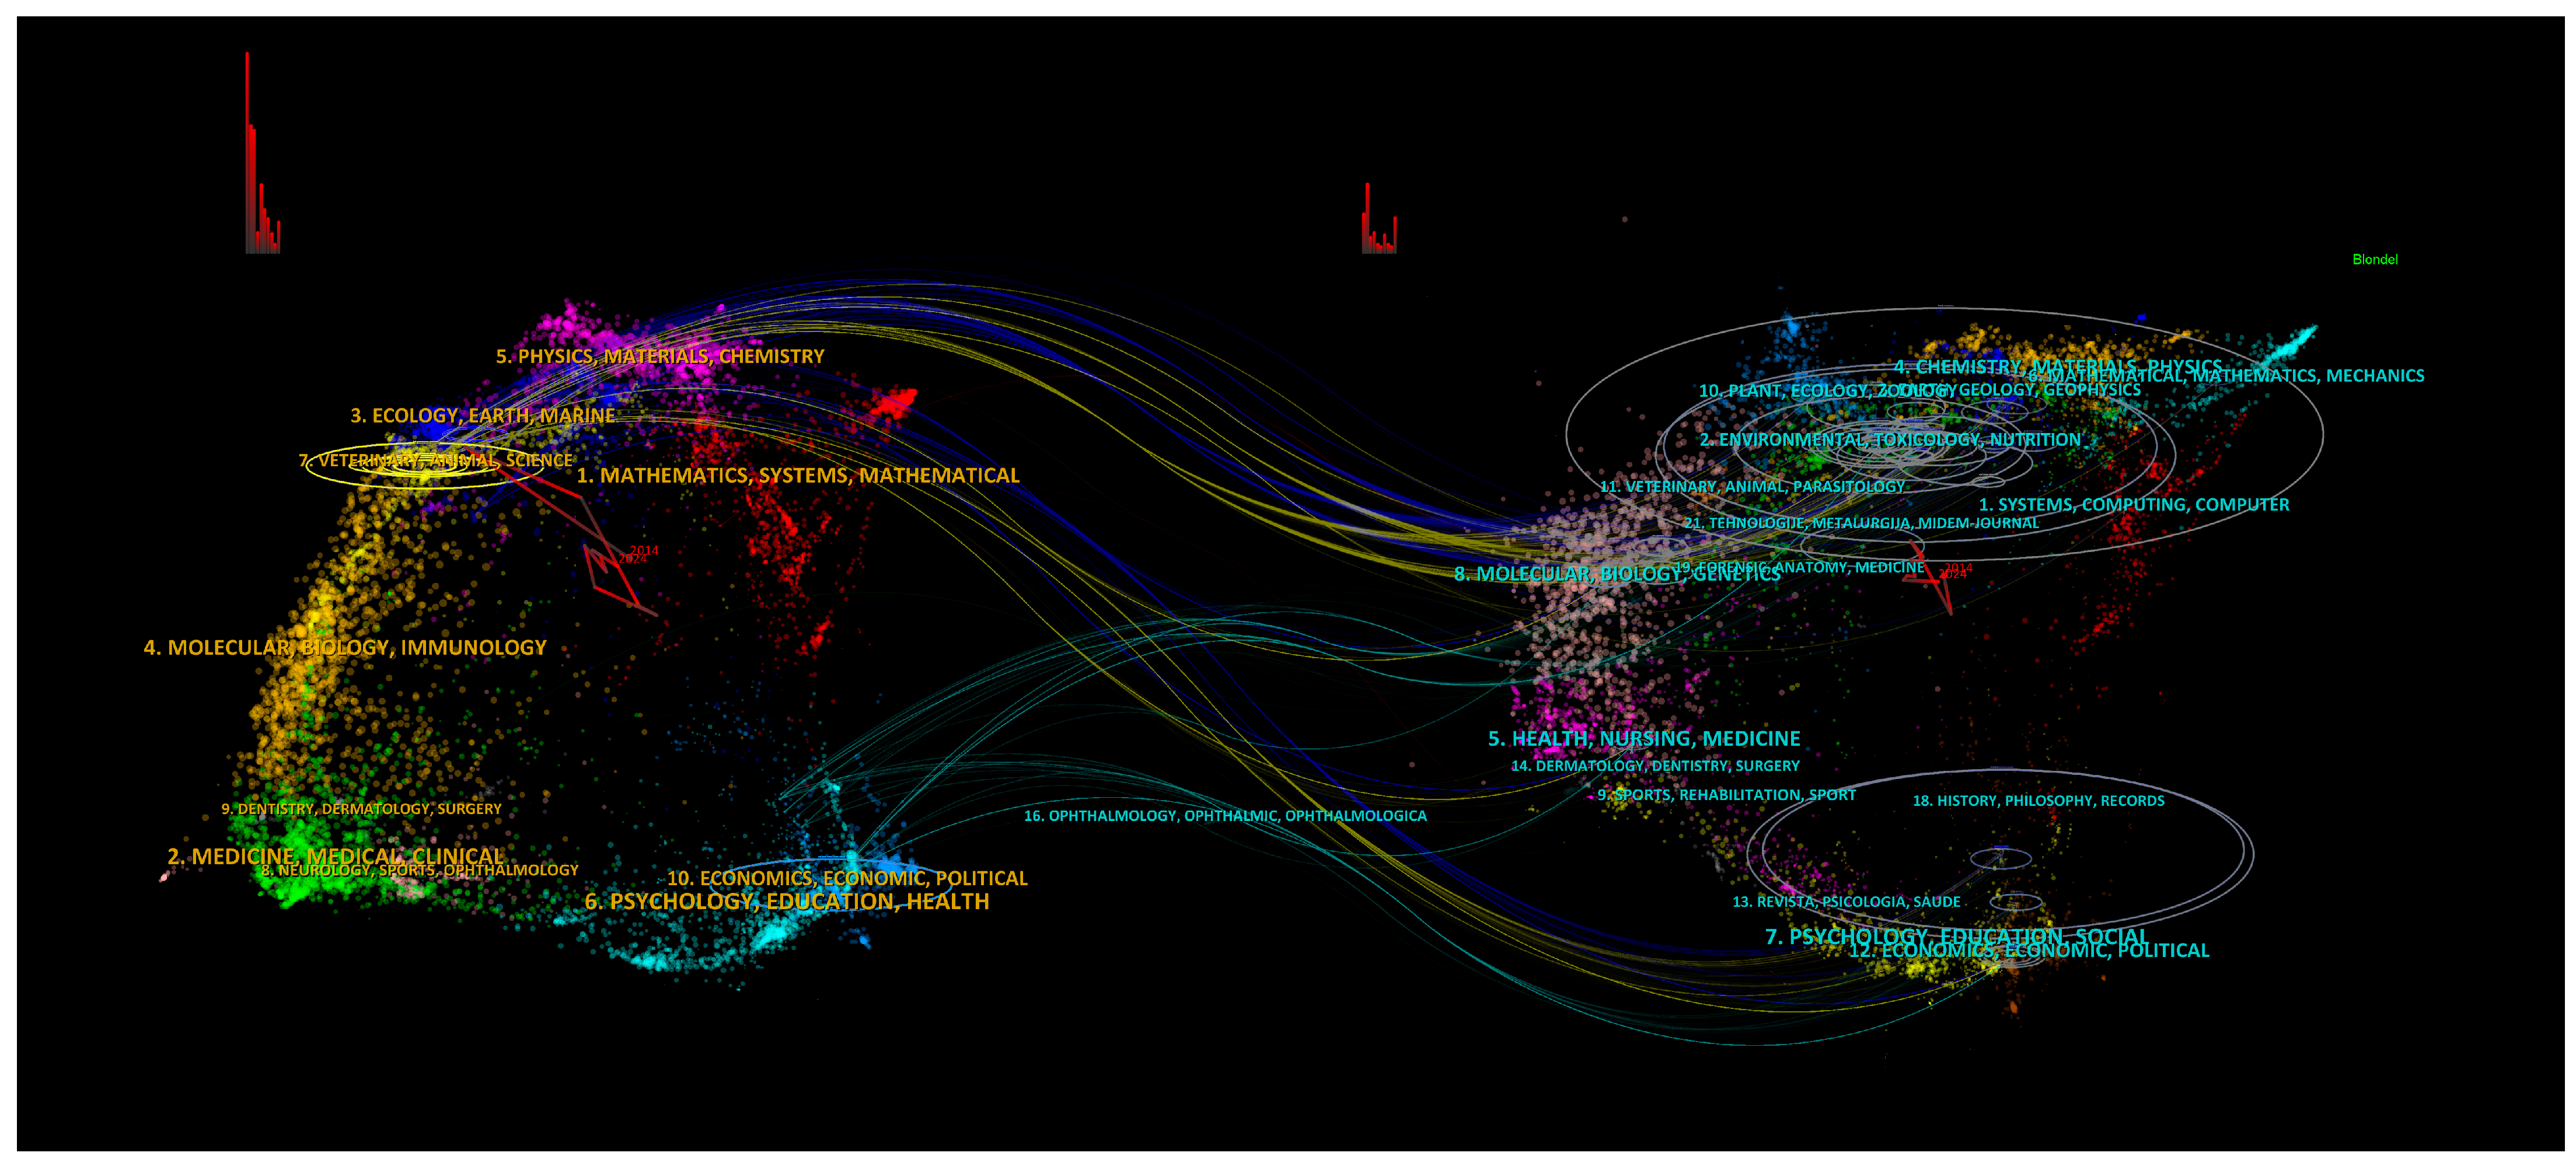
The citation path dual-map of journals provides an intuitive depiction of the paths between citing and cited literature in various disciplinary fields, offering insights into the development and changes within the field (Figure 4). The left side of the figure represents the disciplinary fields of the citing journals, while the right side represents those of the cited journals. These disciplinary classifications are based on the journal classifications provided by the Web of Science database in 2011. The red pathways indicate the development of disciplinary fields within the literature.
The graph shows that the literature in this research field has been mainly published over the past decade in “Ecology, earth, marine” and “Veterinary, animal, science”. Between 2014 and 2024, there has been a shift towards “Mathematics, systems, mathematical”. A smaller portion of the literature is in “Psychology, education, health” and “Economics, and politics”. The cited literature primarily originates from disciplines such as “Environmental, toxicology, nutrition” and “Plant, ecology, geology, geophysics”, while another portion comes from “Psychology, education, social” and “Economics, economic, political” fields. Furthermore, a small portion is sourced from “Health, nursing, medicine”.
This research field exhibits distinct interdisciplinary characteristics, likely involving complex systems and multidimensional issues necessitating the integration of knowledge and methodologies from various disciplines. Moreover, from a disciplinary development perspective, the field appears to be transitioning from predominantly natural and biological sciences toward greater reliance on mathematical and systems science methodologies. This shift may be driven by the need for more precise models and data analysis to address the complexity of research questions. Additionally, research in this field may require handling large volumes of complex data and developing comprehensive models to understand system behavior and changes, incorporating methods such as drone measurements and geographic information systems (GIS).

3.4. Keyword Co-Occurrence Network

One of the primary approaches in keyword co-occurrence analysis is to extract information such as keywords, abstracts, and titles from the target literature to form an intuitive knowledge map based on co-occurrence relationships. By recording the frequency of keyword occurrences, high-frequency keywords in the target literature can be identified, combined with a timeline to reveal hot topics in a research field over a period of time [27]. In terms of parameter settings, given that the literature database for this study spans from 2014 to 2024, ten years, the time slice is set to one year, and the node filtering method selects the top 50, representing the top 50 most cited or occurring items in each time slice. A sub-network of keywords that appear only once in frequency is also pruned.
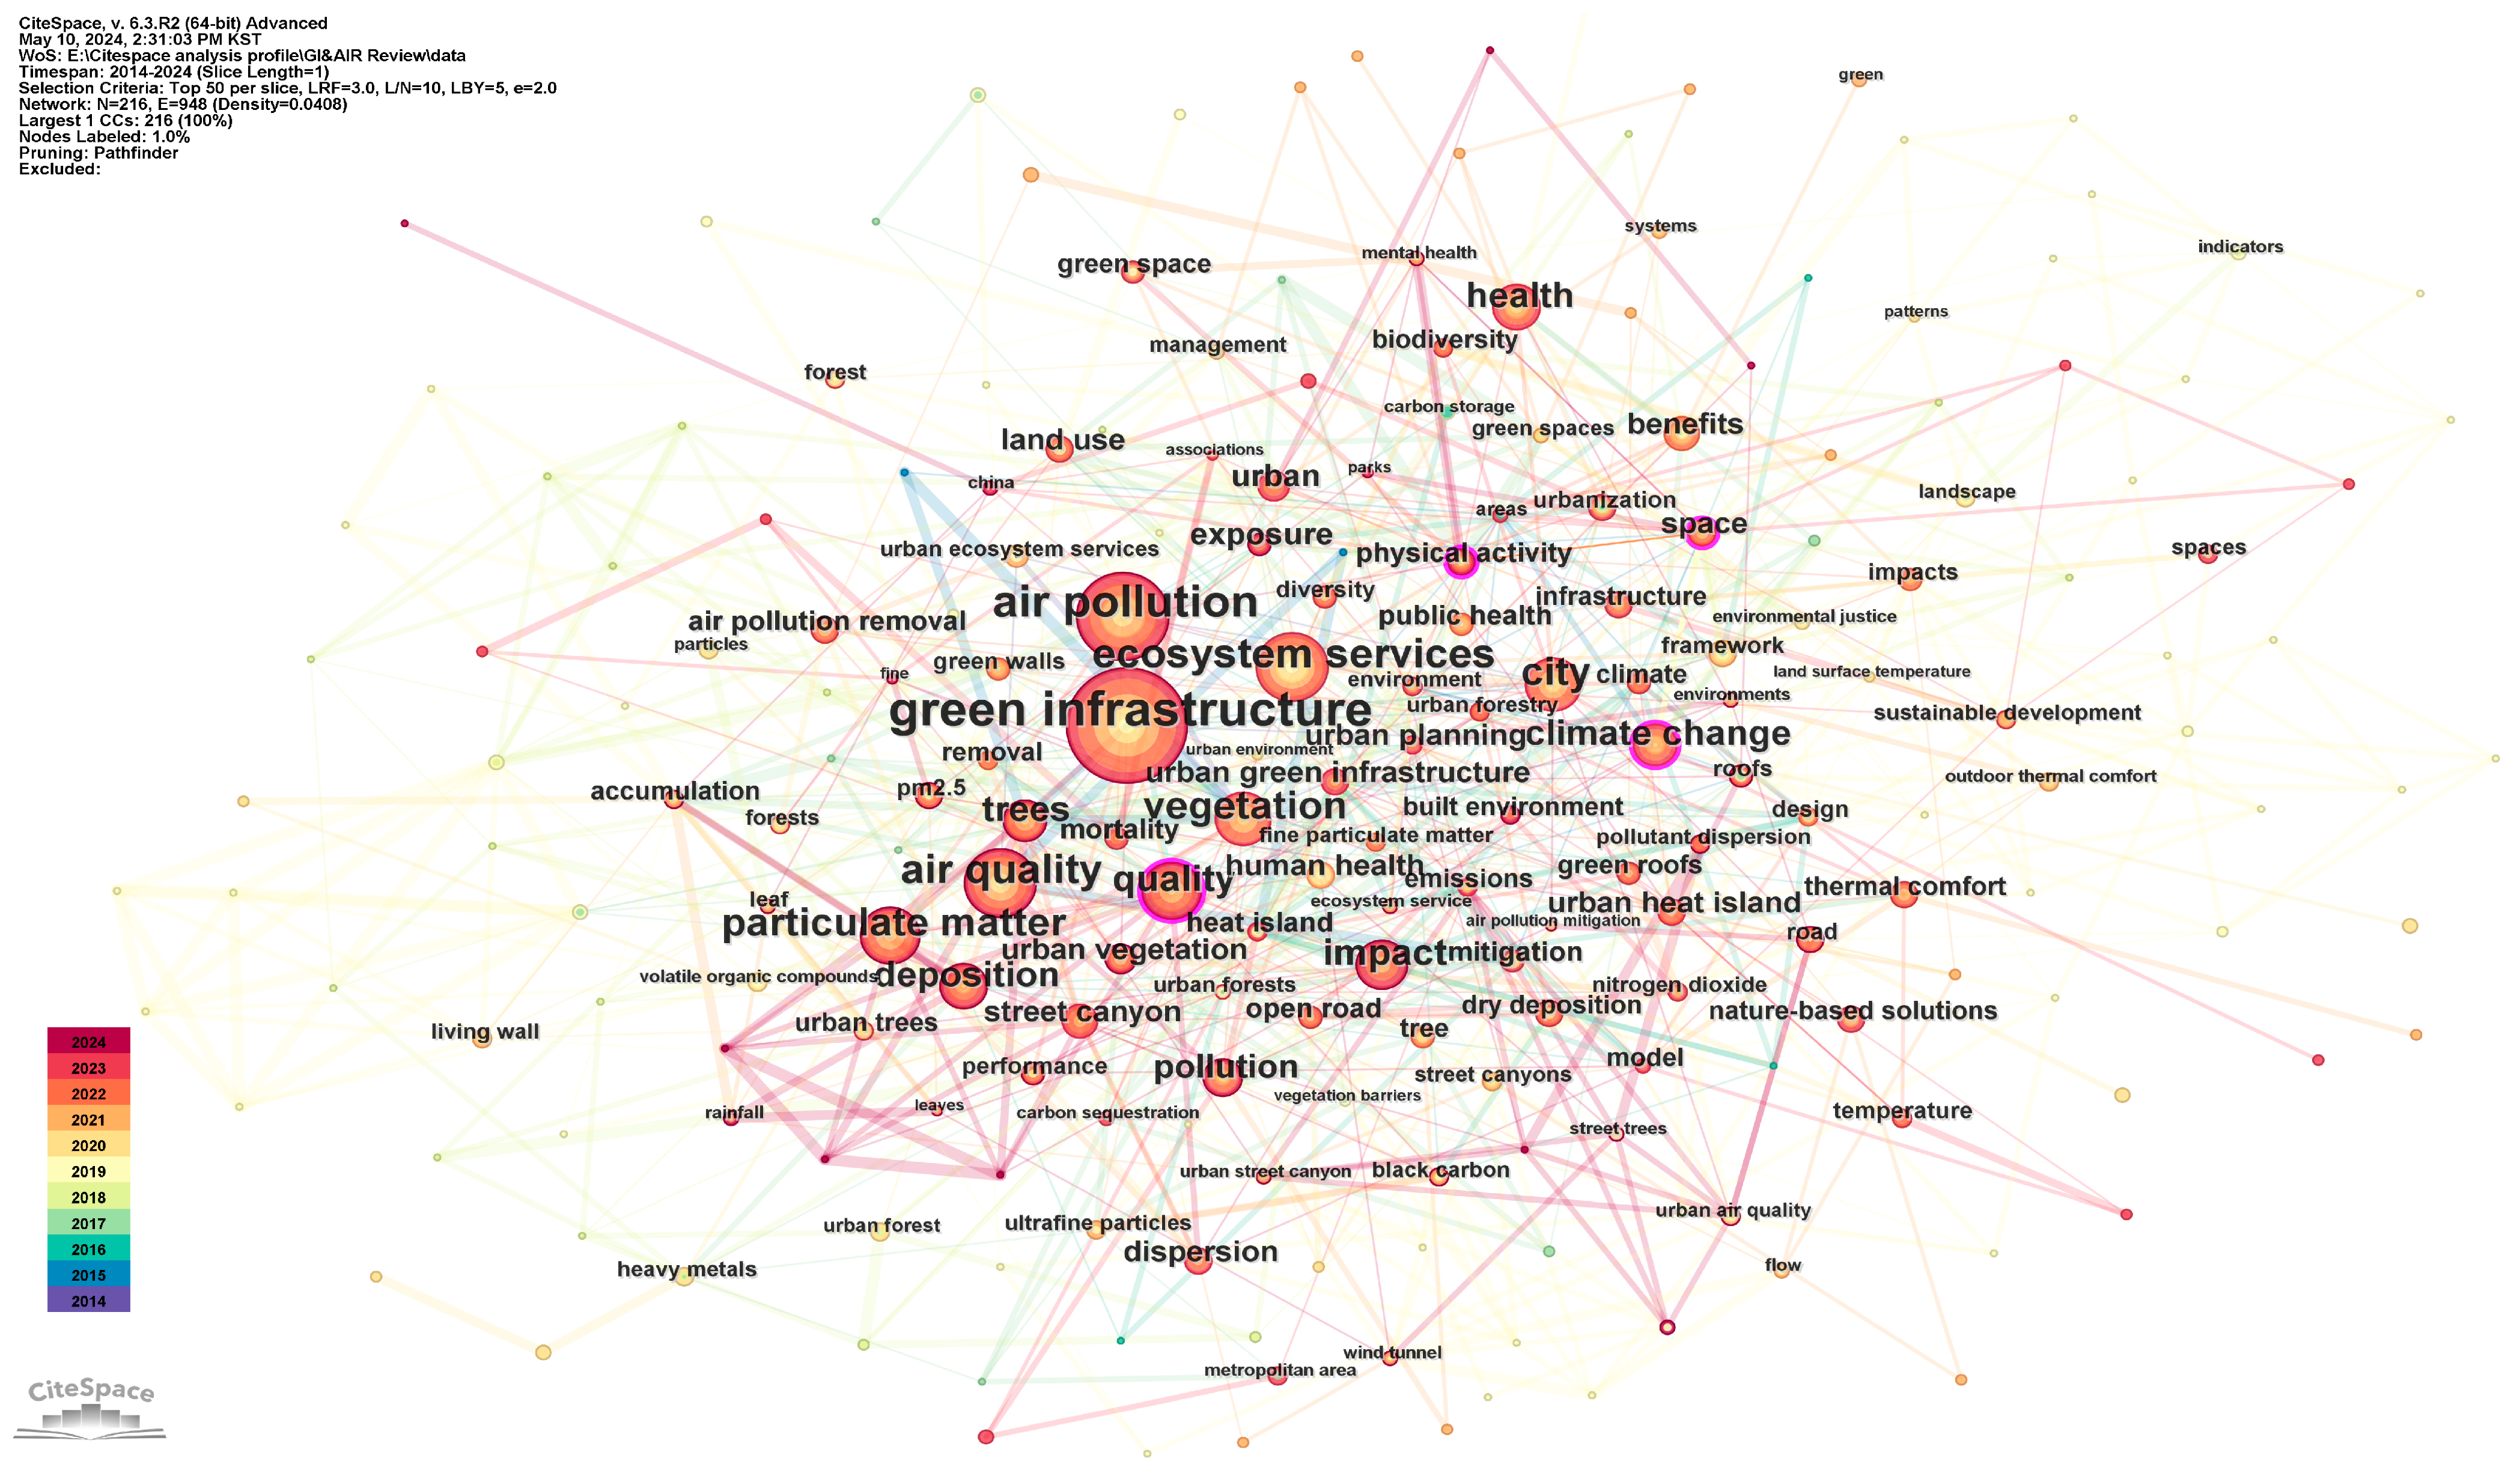
The results (Figure 5) show a co-occurrence network with 216 keyword nodes and 948 connections. Node size represents the frequency of keyword occurrence, while the connections between nodes and their colors represent the relationships established over time. The thickness of connections indicates the strength of keyword co-occurrence (the thicker the line, the stronger the connection between keywords), and the color of nodes and lines represents the year of appearance. Unless otherwise specified, all nodes, colors, and connections mentioned in this paper are executed according to the above description.
Analyzing the graph, aside from the two largest nodes, “Green infrastructure” and “air pollution”, other noteworthy keywords include “ecosystem services”, “climate change”, “particulate matter”, “deposition”, “vegetation”, “urban heat island”, and “health”. These keywords indicate that the research focus in this field mainly revolves around the impact of GI on ecological environments, urban climate change, and health.
Examining the timeline, starting from 2022, research has primarily revolved around keywords such as “particulate matter”, “deposition”, “emissions”, “street canyon”, “urban air quality”, “physical activity”, and “pollutant dispersion”. This indicates that the research trend in this field is gradually shifting towards particulate matter deposition, street canyon dynamics, and pollutant dispersion, which may become new directions for future research.
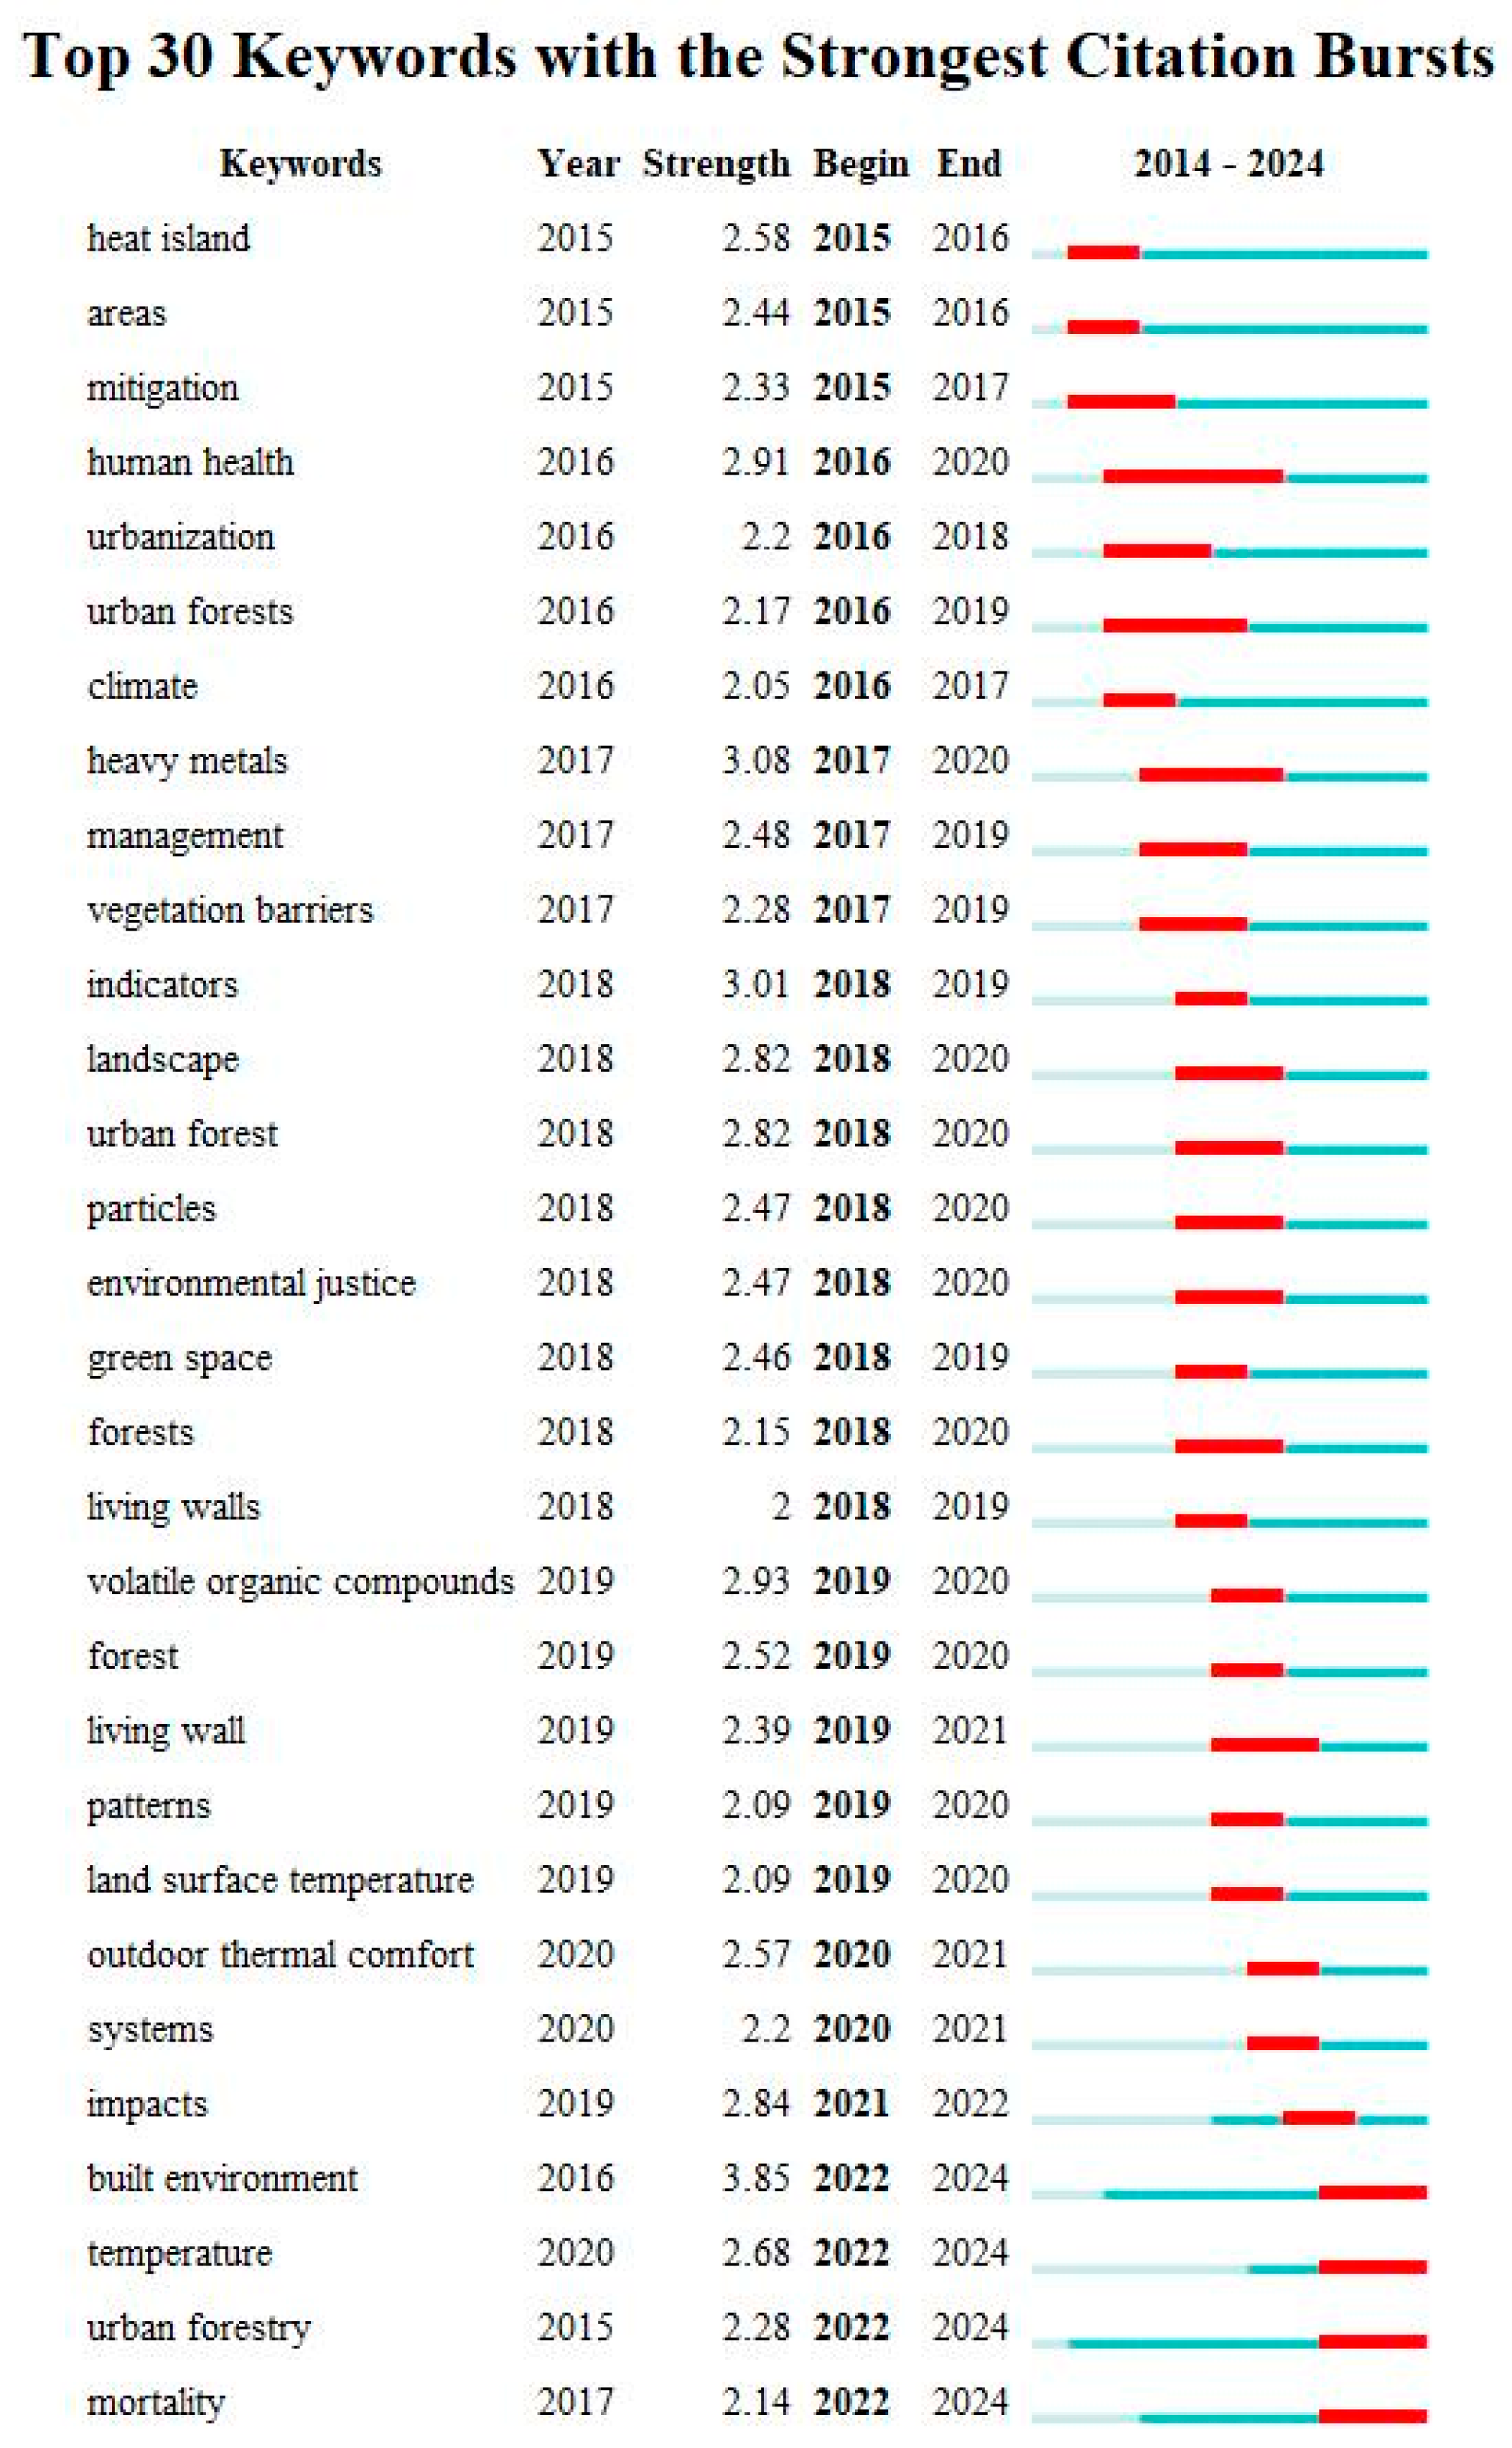
Furthermore, keyword emergence visually indicates a particular keyword’s first appearance, end time, and citation intensity. Analyzing keyword bursts (Figure 6), we observe that “Built environment” first appeared in 2016 and experienced a surge in citations from 2022 to 2024, with an intensity of 3.85, confirming the earlier prediction. Additionally, “Temperature” first appeared in 2020 and experienced a surge in citations from 2022 to 2024, with an intensity of 2.68, indicating it remains a current research hotspot. The other two hotspot keywords are “urban forestry” and “mortality”, further confirming the current research focus in this field.
In addition, the centrality of keywords is a crucial indicator of the positional significance of different keywords in the research field. It serves as an important basis for determining scholars’ focus of attention. Examining the centrality indicators representing the importance of node positions in the network (Table 7), “Physical activity” and “Climate change” exhibit close connections with other hotspot keywords, indicating their frequent placement along paths connecting other keywords. This suggests that they play an active role in facilitating document interrelationships.

3.5. Keyword Cluster Network

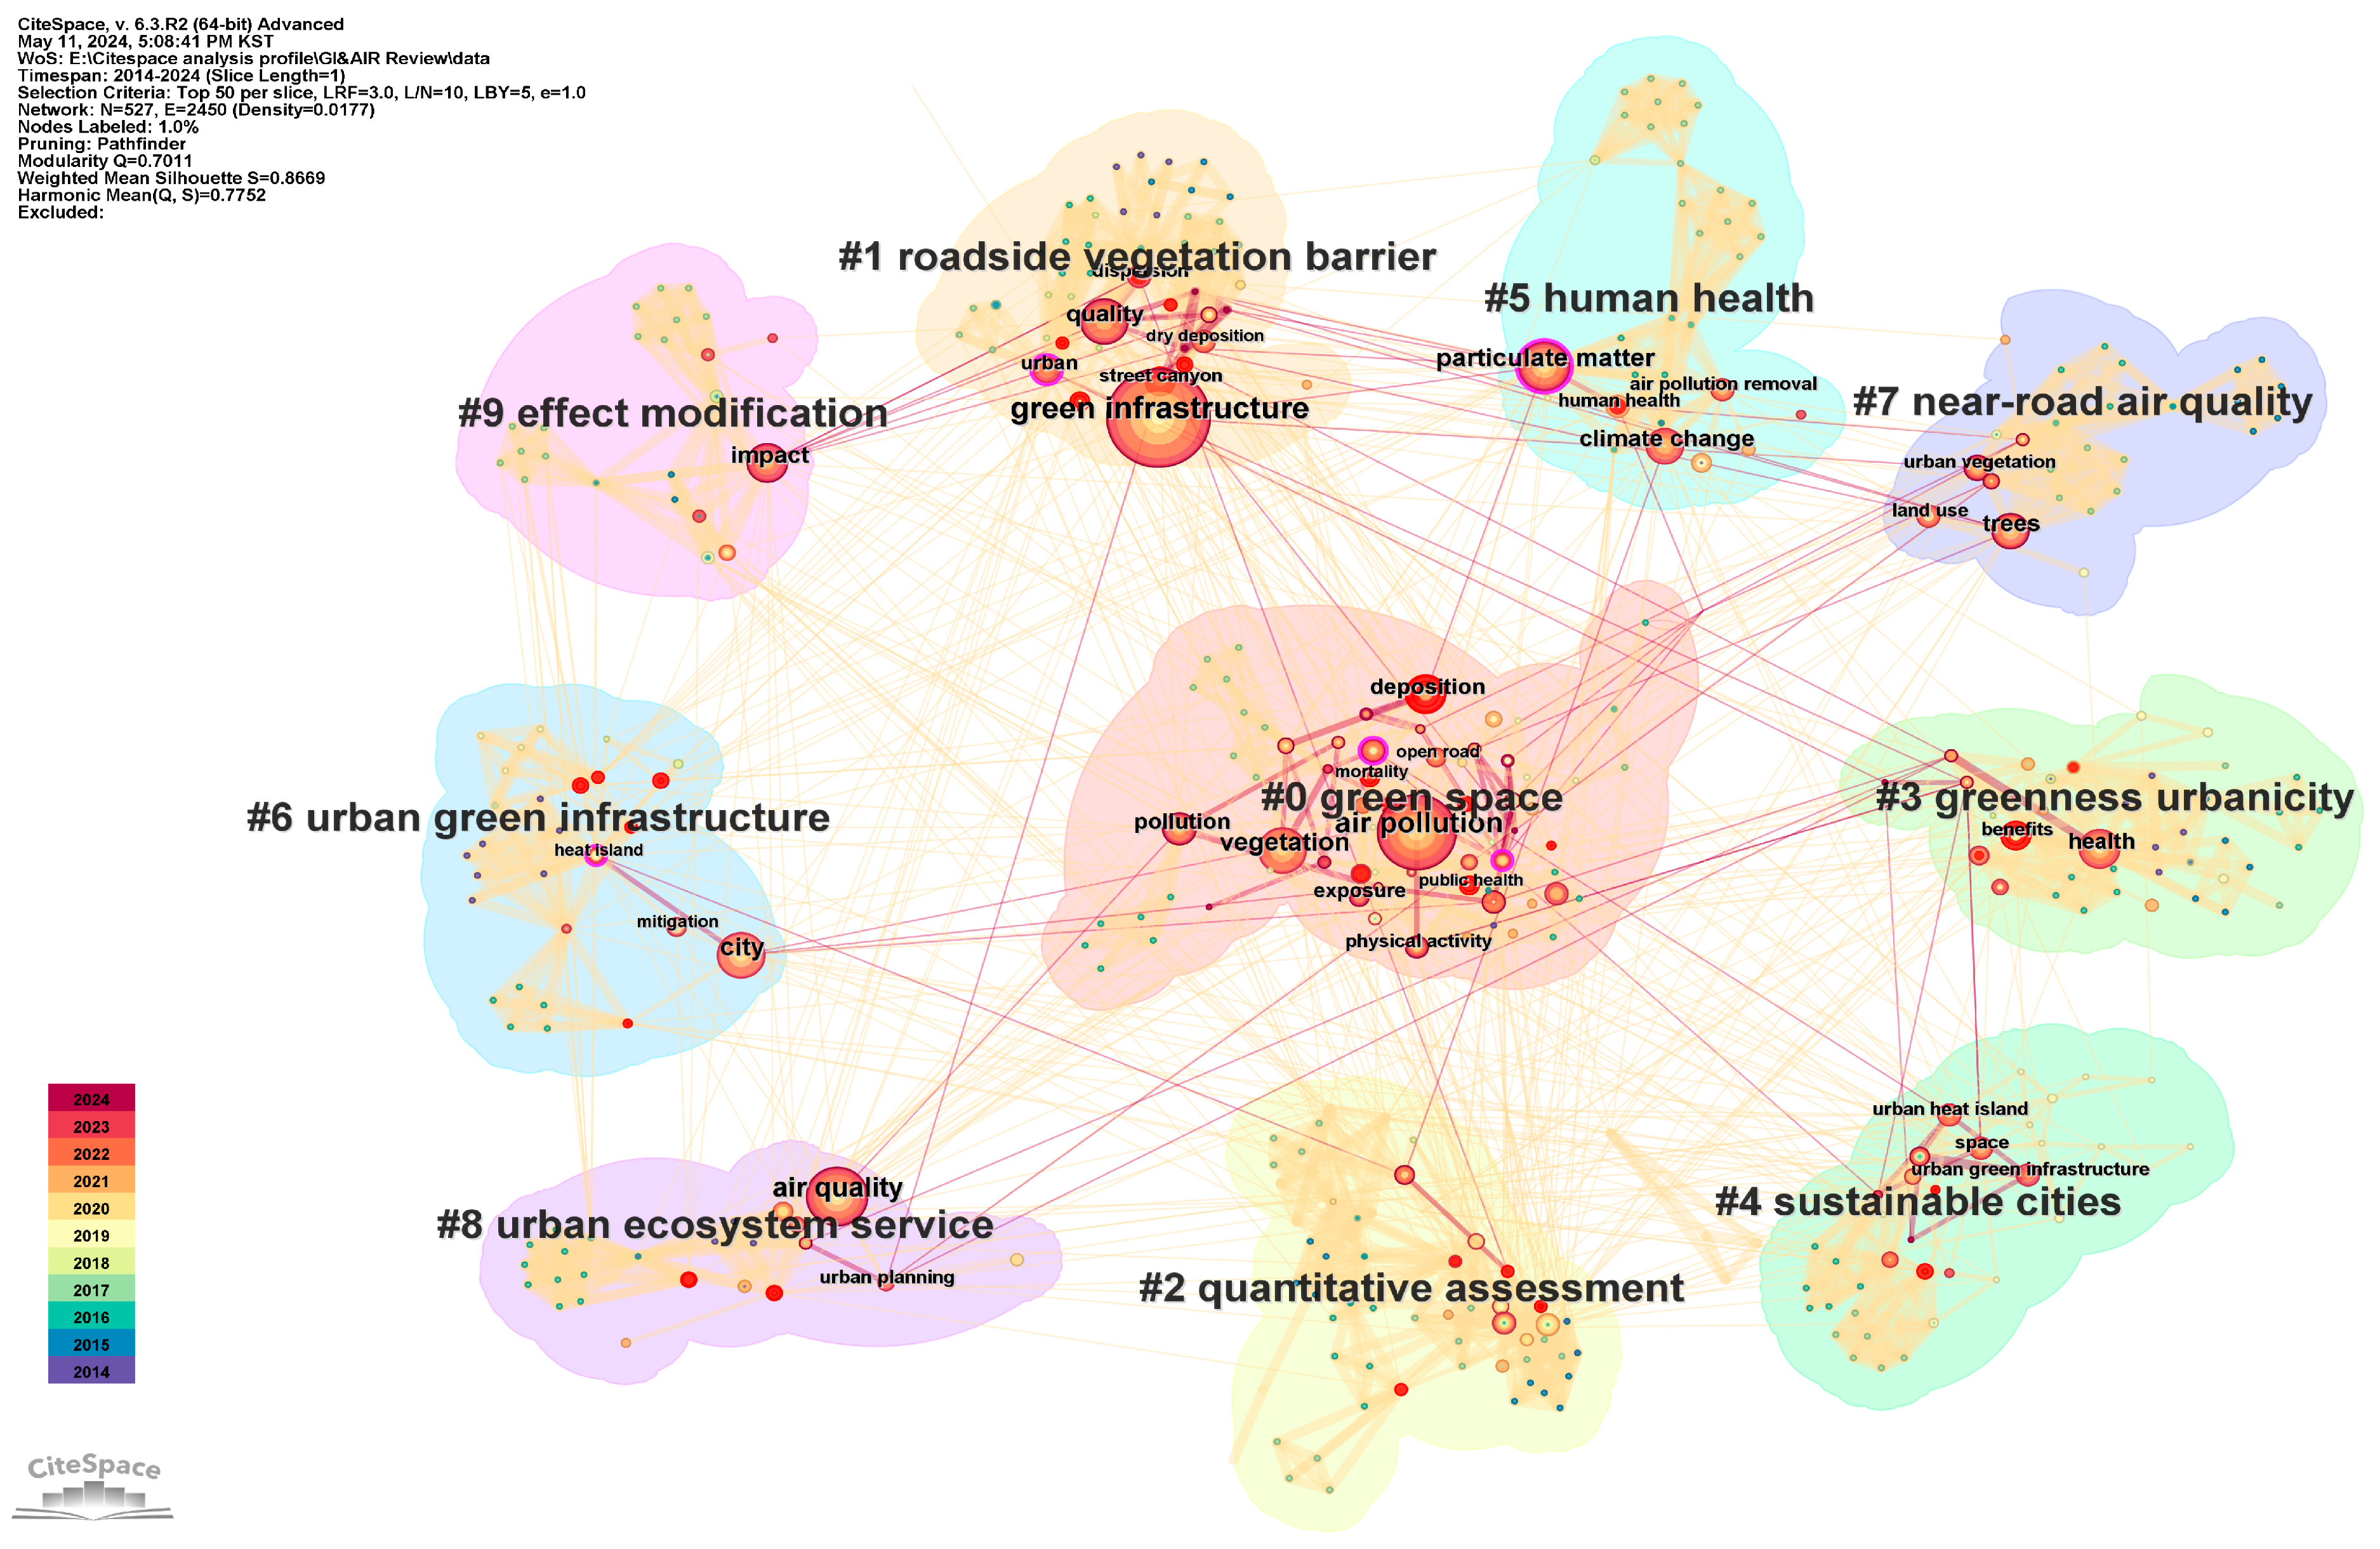
Besides the keyword co-occurrence network, CiteSpace can automatically classify these keywords into varying-sized clusters using built-in algorithms. Observing these clusters can help us to discern the distribution of research topics in the field. Additionally, the size of the clusters reflects the popularity of the research topics and their changes over time. The parameter settings for this graph are the same as those for the keyword co-occurrence network, with the largest ten clusters selected from the network. The resulting keyword cluster graph is depicted in Figure 7. Each colored block represents a cluster, with the color indicating the cluster’s average publication year. This graph comprises 527 nodes and 2450 links. The modularity value (Q) is associated with the density of nodes, where a higher Q value indicates better clustering effectiveness. The average silhouette value (S) measures the homogeneity of clusters, with a higher S indicating greater homogeneity and, thus, higher credibility. In this graph, Q = 0.7011, suggesting good clustering effectiveness, while S = 0.8669 indicates high credibility for this clustering [27].
The largest ten clusters in this research field are listed in Table 8. The average year data shows that the average year of these clusters is around 2016, indicating that this field has already formed a relatively mature research system. The “Size” column represents the number of keywords included in each cluster. By examining the connections in the graph, it can be seen that in 2024, the research topics in this field mainly revolve around keywords such as “impact”, “particulate matter”, “environmental”, “city”, “urban green infrastructure”, “trees”, and “urban street canyon”. However, no new research topics have emerged in recent years, indicating the need for more opportunities for interdisciplinary integration and greater attention from researchers to drive the development of this research field.
In CiteSpace, the intermediary centrality of a piece of literature can be calculated based on its citation and co-citation relationships with the other literature. A higher intermediary centrality value indicates a more important node position in the network, belonging to two categories: (a) hub nodes highly connected with other nodes and (b) nodes located between different clusters. Since nodes between clusters are likely to connect different research topics, they may represent emerging research trends [33].
In Cluster #0, the literature with the highest intermediary centrality related to the theme “Green Space” is the study by Ebisu et al. [34]: “Association between greenness, urbanicity, and birth weight”. This study utilized birth certificate data from Connecticut, USA (2000–2006) to investigate the relationship between green spaces or green areas and birth weight. The findings revealed that increased green space near residences was associated with increased birth weight and a reduced risk of low birth weight (LBW). The results suggest that integrating more green spaces into urban environments can reduce the risk of adverse birth outcomes and play a significant role in public health planning. Meanwhile, another piece of literature with high intermediary centrality [35] confirms from the public health perspective that GI positively affects the community and individual physical and mental health. Weerakkody et al. [36] explored the differences in atmospheric particulate matter (PM) capture ability among plant species. The results indicated that selecting plant combinations with small leaves, hairs, and waxy surfaces may enhance the effectiveness of green wall systems as atmospheric PM filters. Additionally, refs. [37,38], respectively, confirmed from other perspectives the positive impact of GI on improving air pollution.
In Cluster #1, the most cited keywords are air pollution (206), vegetation (102), and deposition (61). The literature with the highest intermediary centrality related to the theme “Roadside Vegetation Barrier” is by Tong et al. [39], titled “Roadside vegetation barrier designs to mitigate near-road air pollution impacts”. This study assessed the impact of roadside vegetation barriers on air quality, indicating that wide and dense vegetation barriers are more effective. Additionally, ref. [28] discussed the influence of roadside green belts on individual exposure to local air pollution in street and building environments. The literature mentioned that greening of building envelope structures—green walls and green roofs—is a passive atmospheric pollution control measure considered a sustainable control method.
In Cluster #2, the most cited keywords are green infrastructure (334), quality (89), urban (42), dispersion (33), and street canyon (32). The literature with the highest intermediary centrality related to the theme “Quantitative assessment” is by Derkzen et al. [40], published “Quantifying urban ecosystem services based on high-resolution data of urban green space: an assessment for Rotterdam, the Netherlands”. This study quantified and mapped six ecosystem services supplied by green spaces in Rotterdam using high-resolution land cover data, emphasizing the importance of green space design in urban planning for healthier and more climate-resilient cities. Meanwhile, Baró et al. [41] proposed a new method to assess the mismatch between supply and demand of ecosystem services in urban areas. Based on environmental quality standards and policy objectives, it was revealed that regulating ecosystem services has a minor role in reducing urban air pollution and greenhouse gas emissions. The research results indicate that the contribution of regulatory ecosystem services provided by urban GI to maintain environmental quality standards is limited, serving as a complementary measure compared to other urban policies. Russo et al. [42] integrated ENVI-met and UFORE models with the local field, pollution, and climate data to explore the local-scale effects of different tree-dominated streetscapes in Bolzano, Italy, on mitigating temperature and air pollution. The results demonstrate the positive role of urban trees in reducing pollution, improving temperature, and enhancing human comfort, contributing to assessing the role of urban GI in improving human well-being and mitigating the impacts of climate change.
Another noteworthy cluster is Cluster #4, focusing on sustainable cities. The most frequently occurring keywords are “urban heat island” (32), “space” (32), and “roofs” (14). This cluster encompasses topics related to sustainable urban development, including green cities, sponge cities, drainage systems, and urban heat islands. The literature with the highest intermediary centrality in this cluster is by Song et al. [43] titled, “Diurnal changes in urban boundary layer environment induced by urban greening”. Using integrated urban-land-atmosphere modeling, this study found that green roofs significantly reduce urban boundary layer temperatures, while the effect of street canyon greening is limited. Urban greening induces different trends in air quality changes over diurnal cycles, contributing to improved urban environments and sustainability. Another highly central piece of literature [44] in this cluster summarizes the various environmental and social benefits brought to cities by combining urban drainage systems and GI.

3.6. Keyword Cluster Timeline

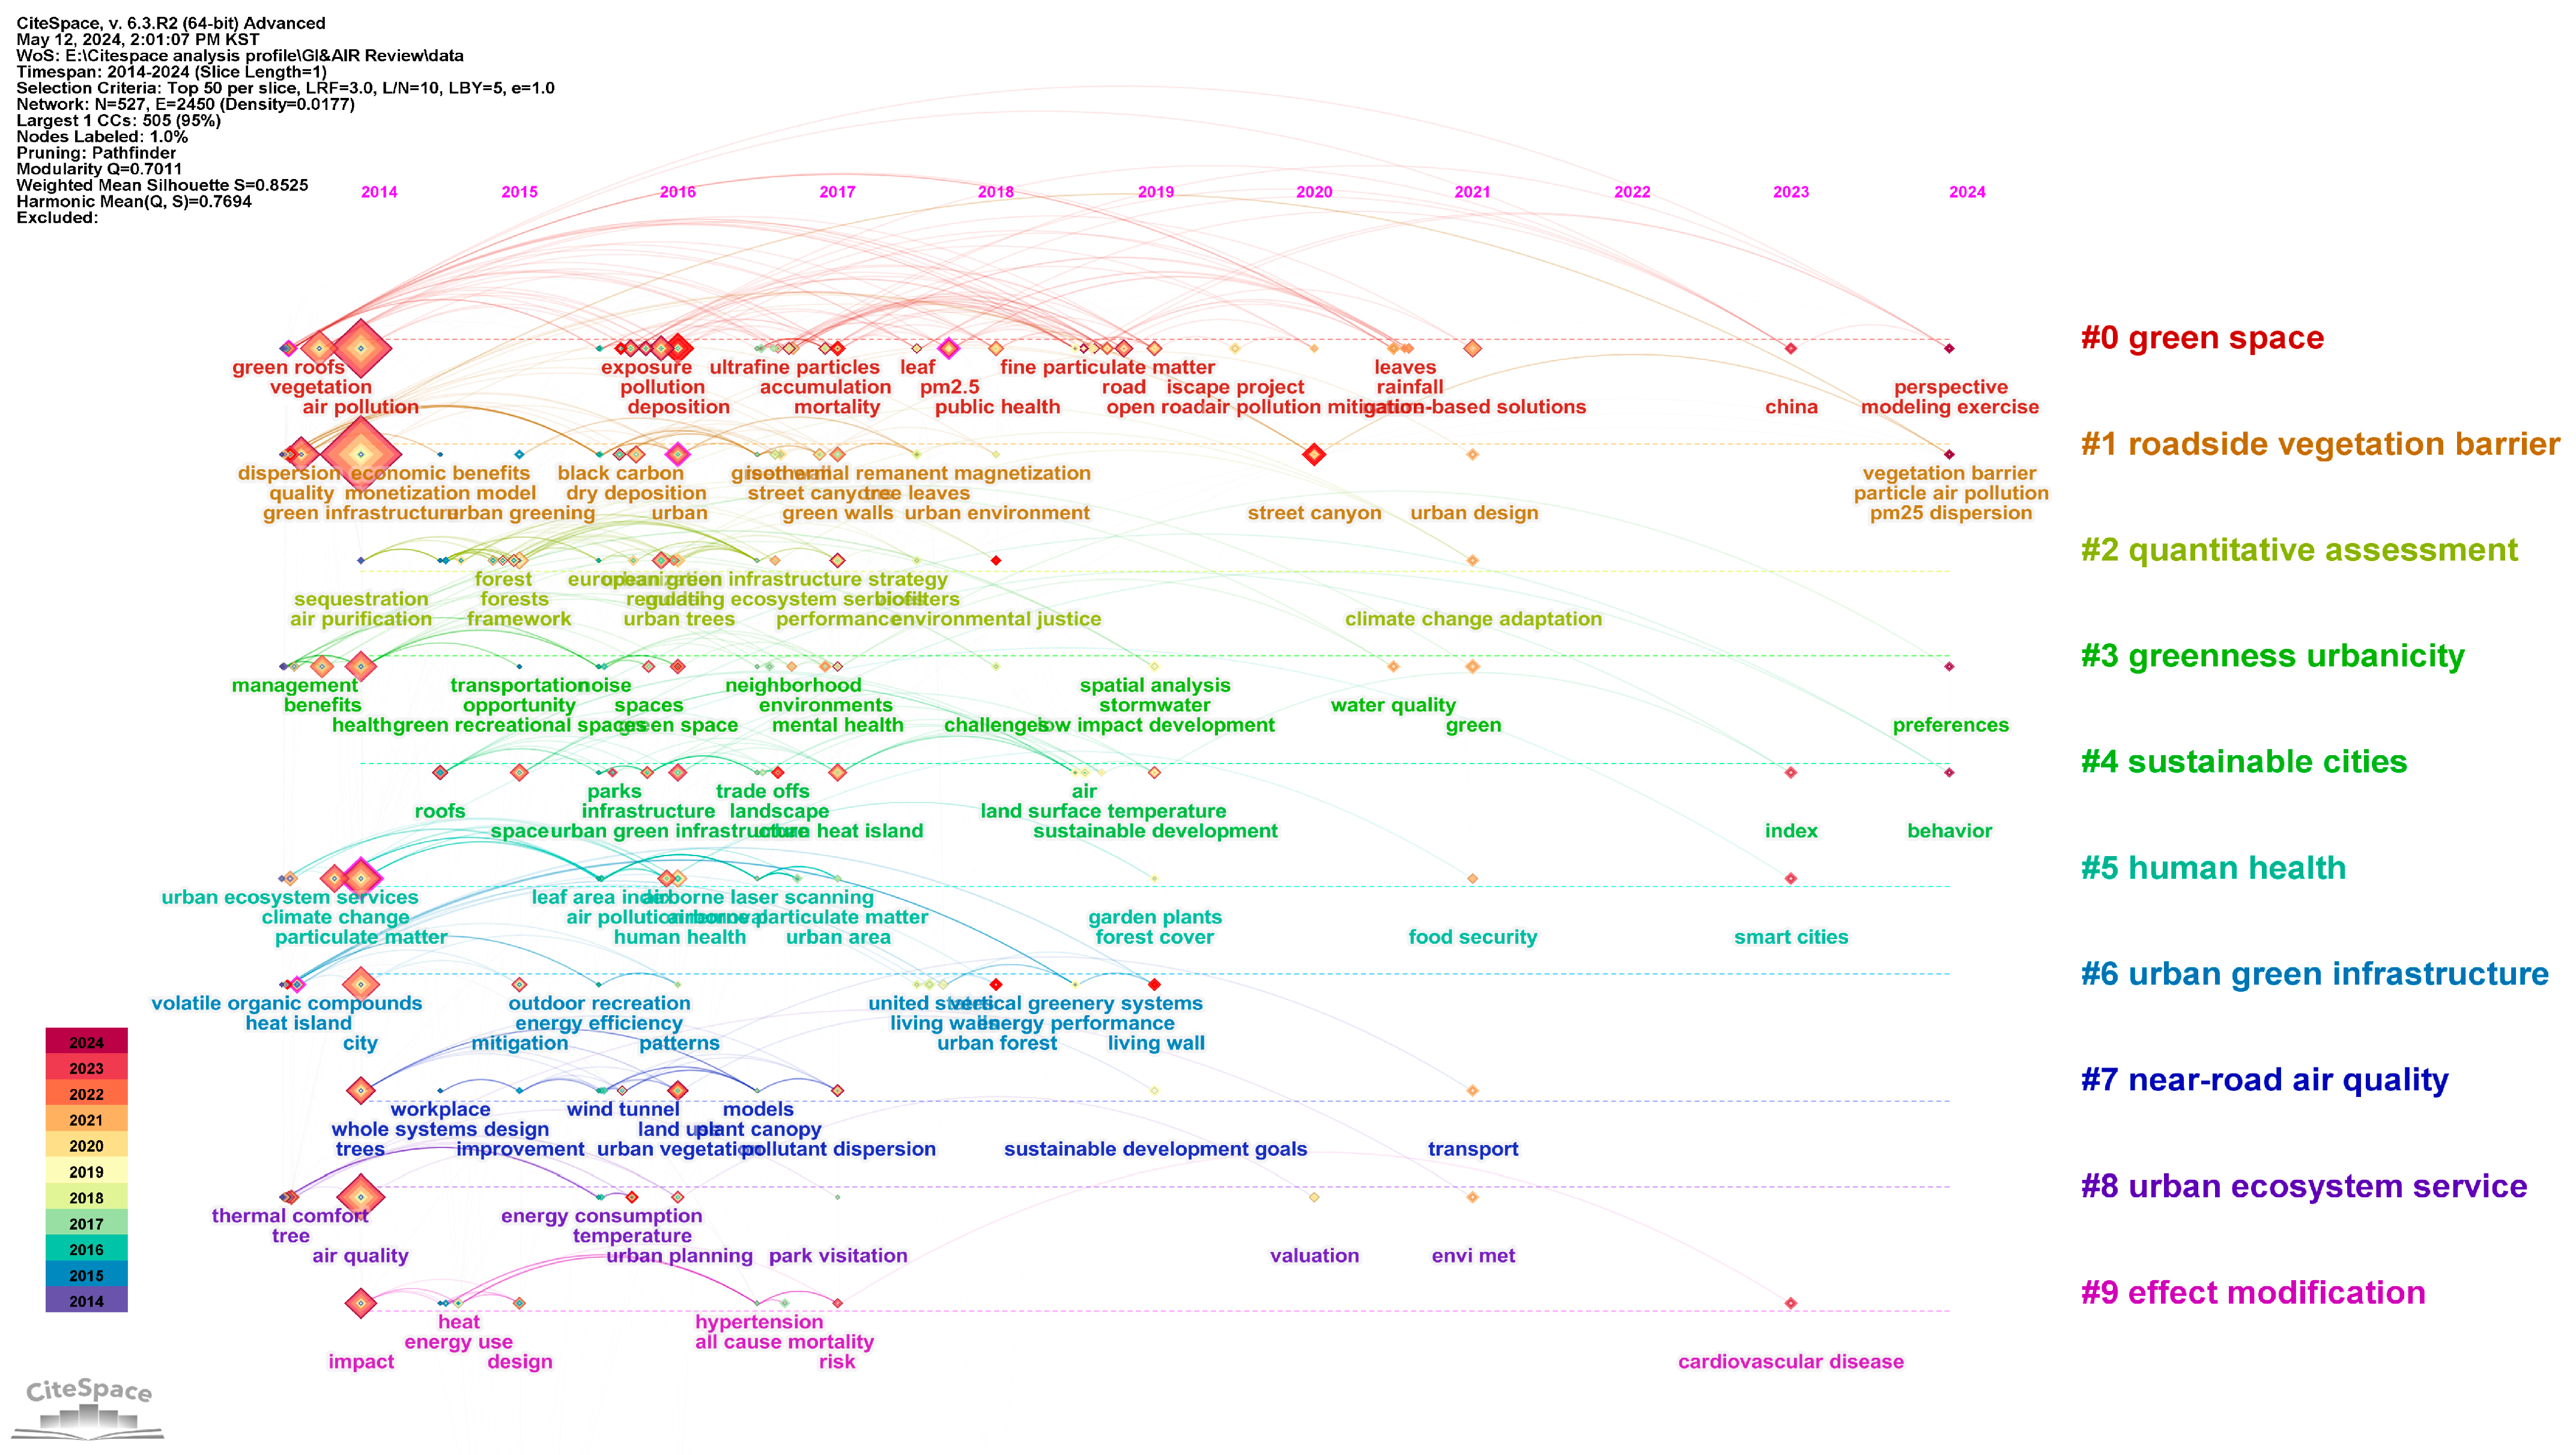
The authors created a timeline graph of keyword clusters to analyze the evolution of research development over time from a temporal perspective (Figure 8). The timeline graph arranges the keywords of research topics according to chronological order, providing a clear display in a two-dimensional coordinate system with time as the horizontal axis. In the timeline graph, the size of the nodes represents the frequency of occurrence of the keywords; the year associated with the nodes indicates the year of the first appearance of the keyword; the lines between nodes represent keywords appearing together in a document, indicating the relationship between keywords; and red nodes represent hotspot keywords.
Through analysis, it was found that the high-frequency keywords first appeared predominantly in 2014 across various clusters. Although new keywords continue to emerge after that, there is an overall trend of decline. To some extent, this suggests a decrease in the overall research interest in this field in recent years, a phenomenon also supported by the data presented in Table 8. Furthermore, in recent years, the main research topics in this field have mainly focused on two directions: Cluster #0, green space; and Cluster #1, roadside vegetation barrier. From a temporal perspective, the research content has evolved from the initial focus on green roofs and vegetation to more in-depth topics such as modeling exercises, nature-based solutions, PM2.5 dispersion, etc.

3.7. The Literature Co-Citation Network and Overly Network

The literature co-citation network is a scientific bibliometric method used in literature analysis. It quantifies the co-citation relationships between documents [45]. Co-citation analysis measures the frequency at which cited references (cited reference) are cited by other documents (citing reference), analyzing and calculating the cross-referencing relationships between selected papers. When other documents frequently cite two documents, they indicate a strong correlation [45,46]. Network analysis is employed to visualize the co-citation structure of a network of documents. To better understand the connections and development process between research areas, researchers calculated and visualized the literature co-citation network using Citespace (
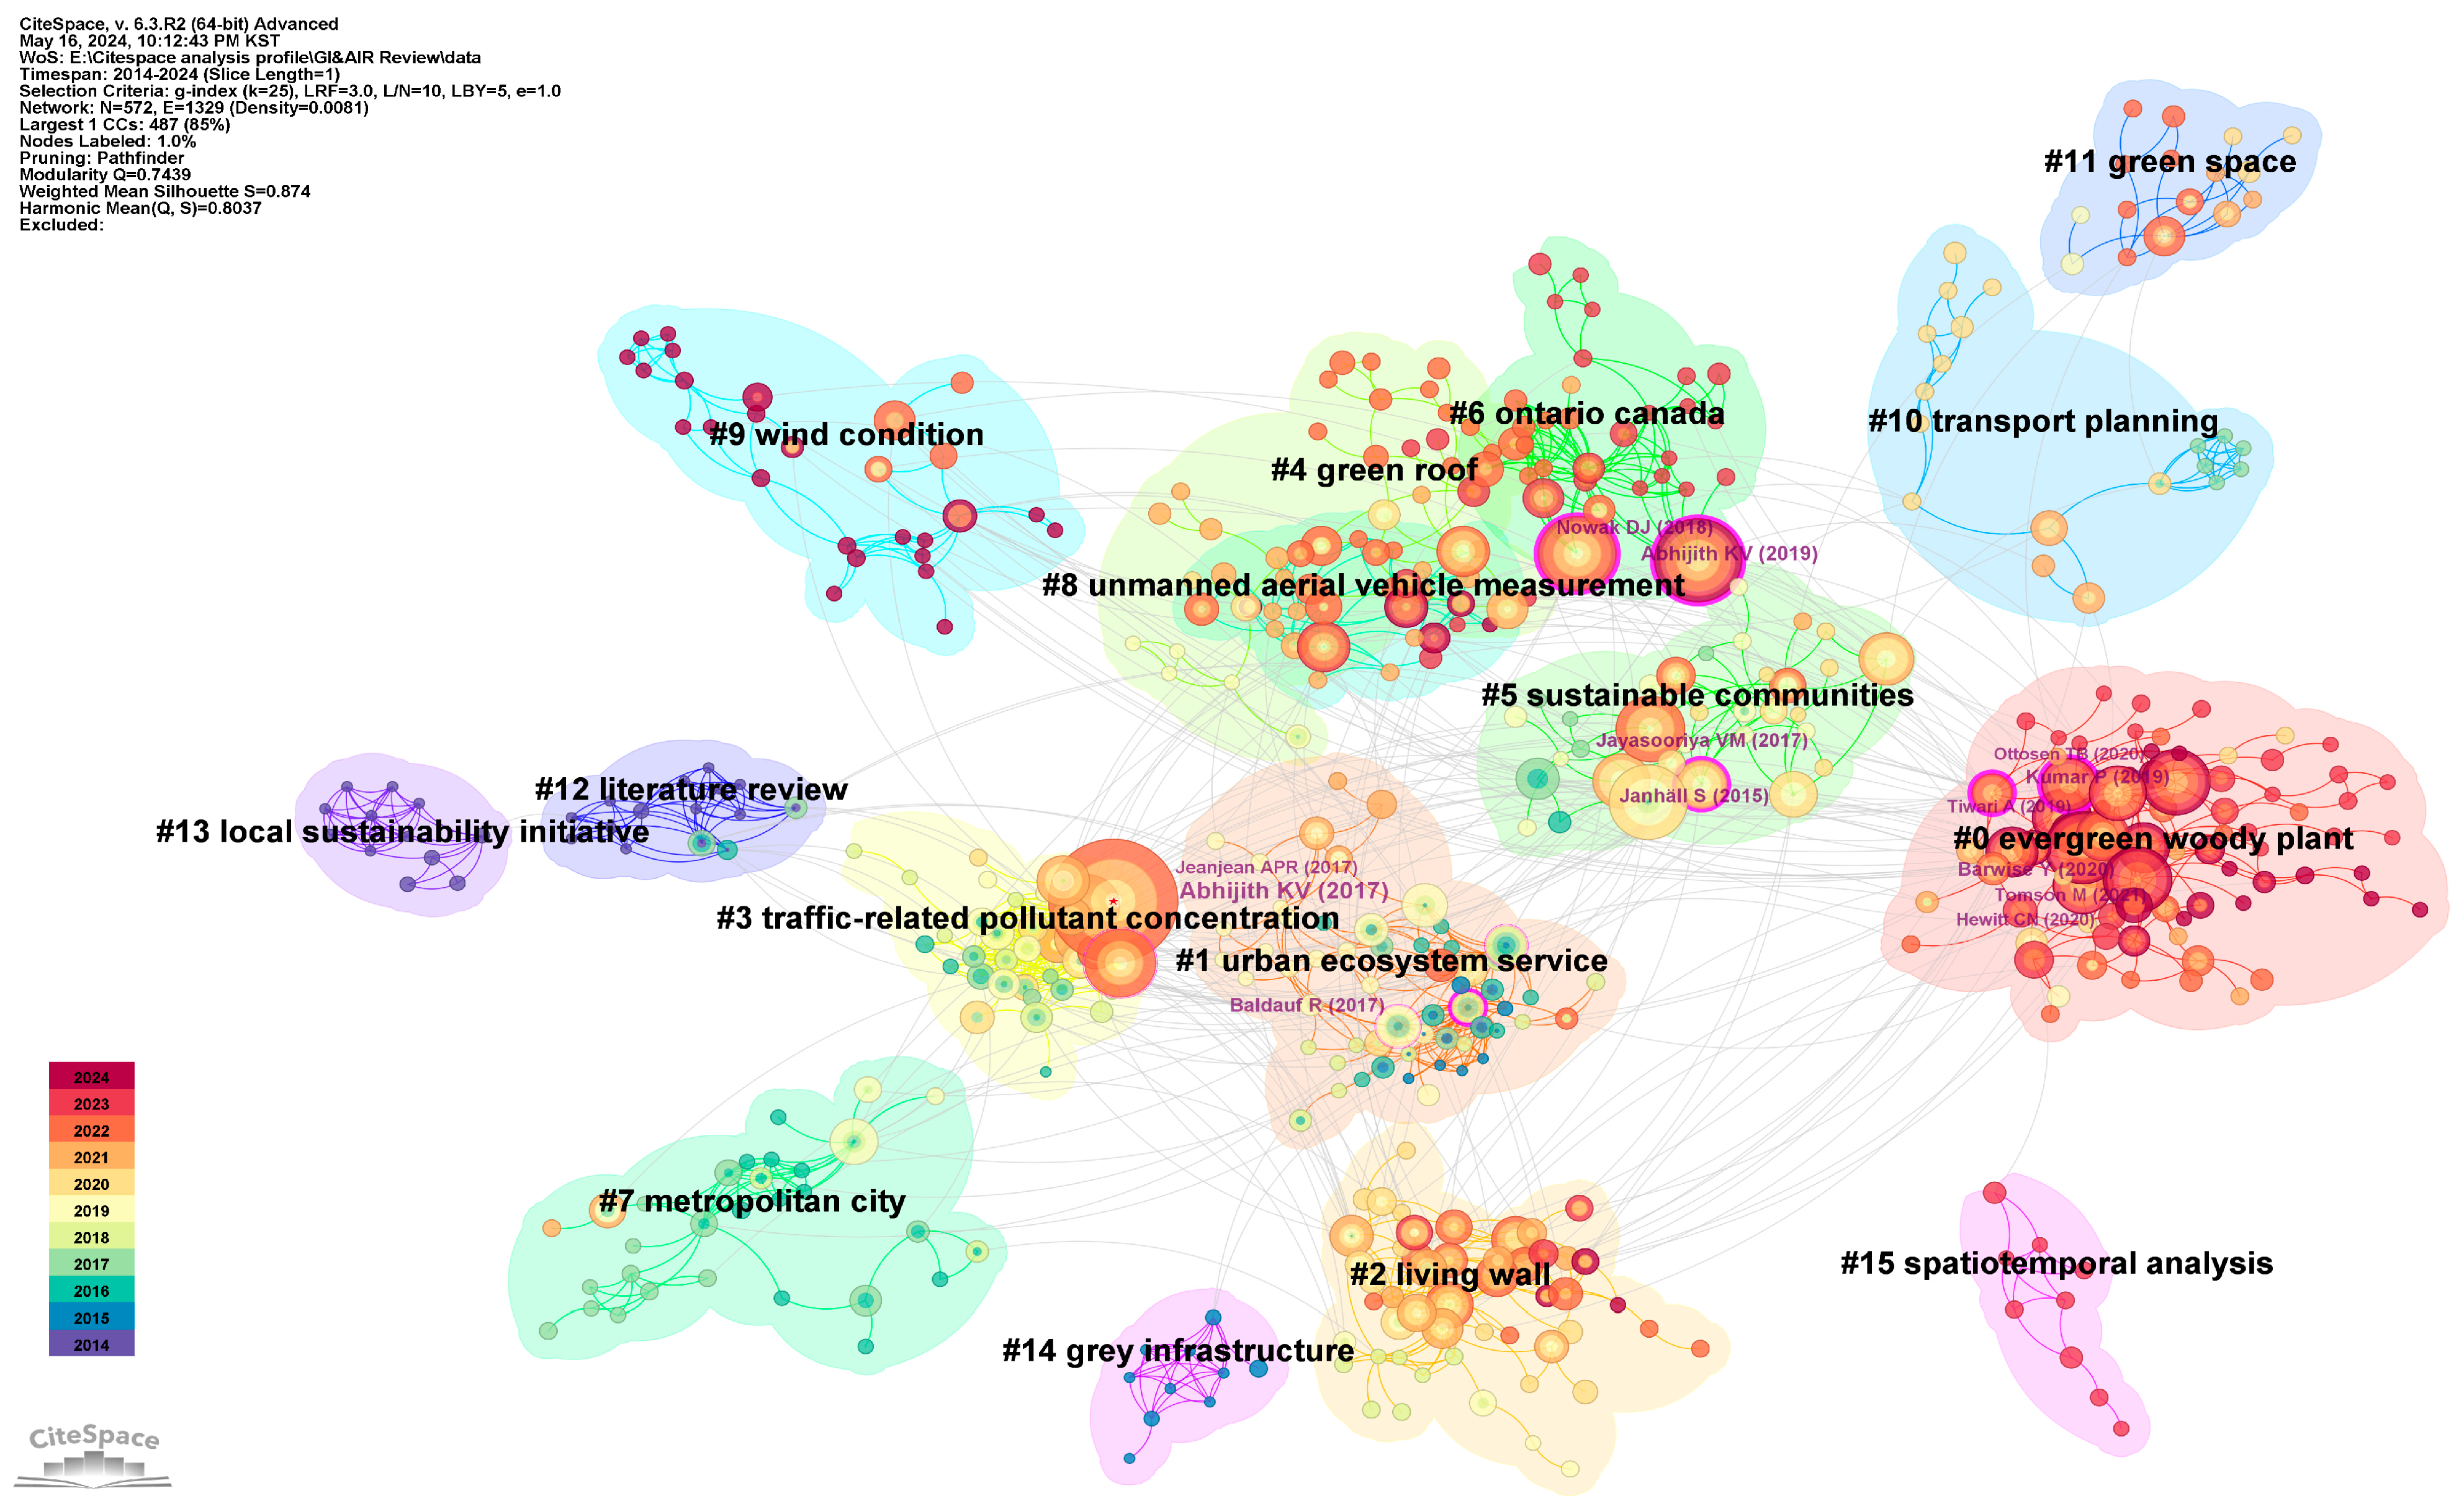
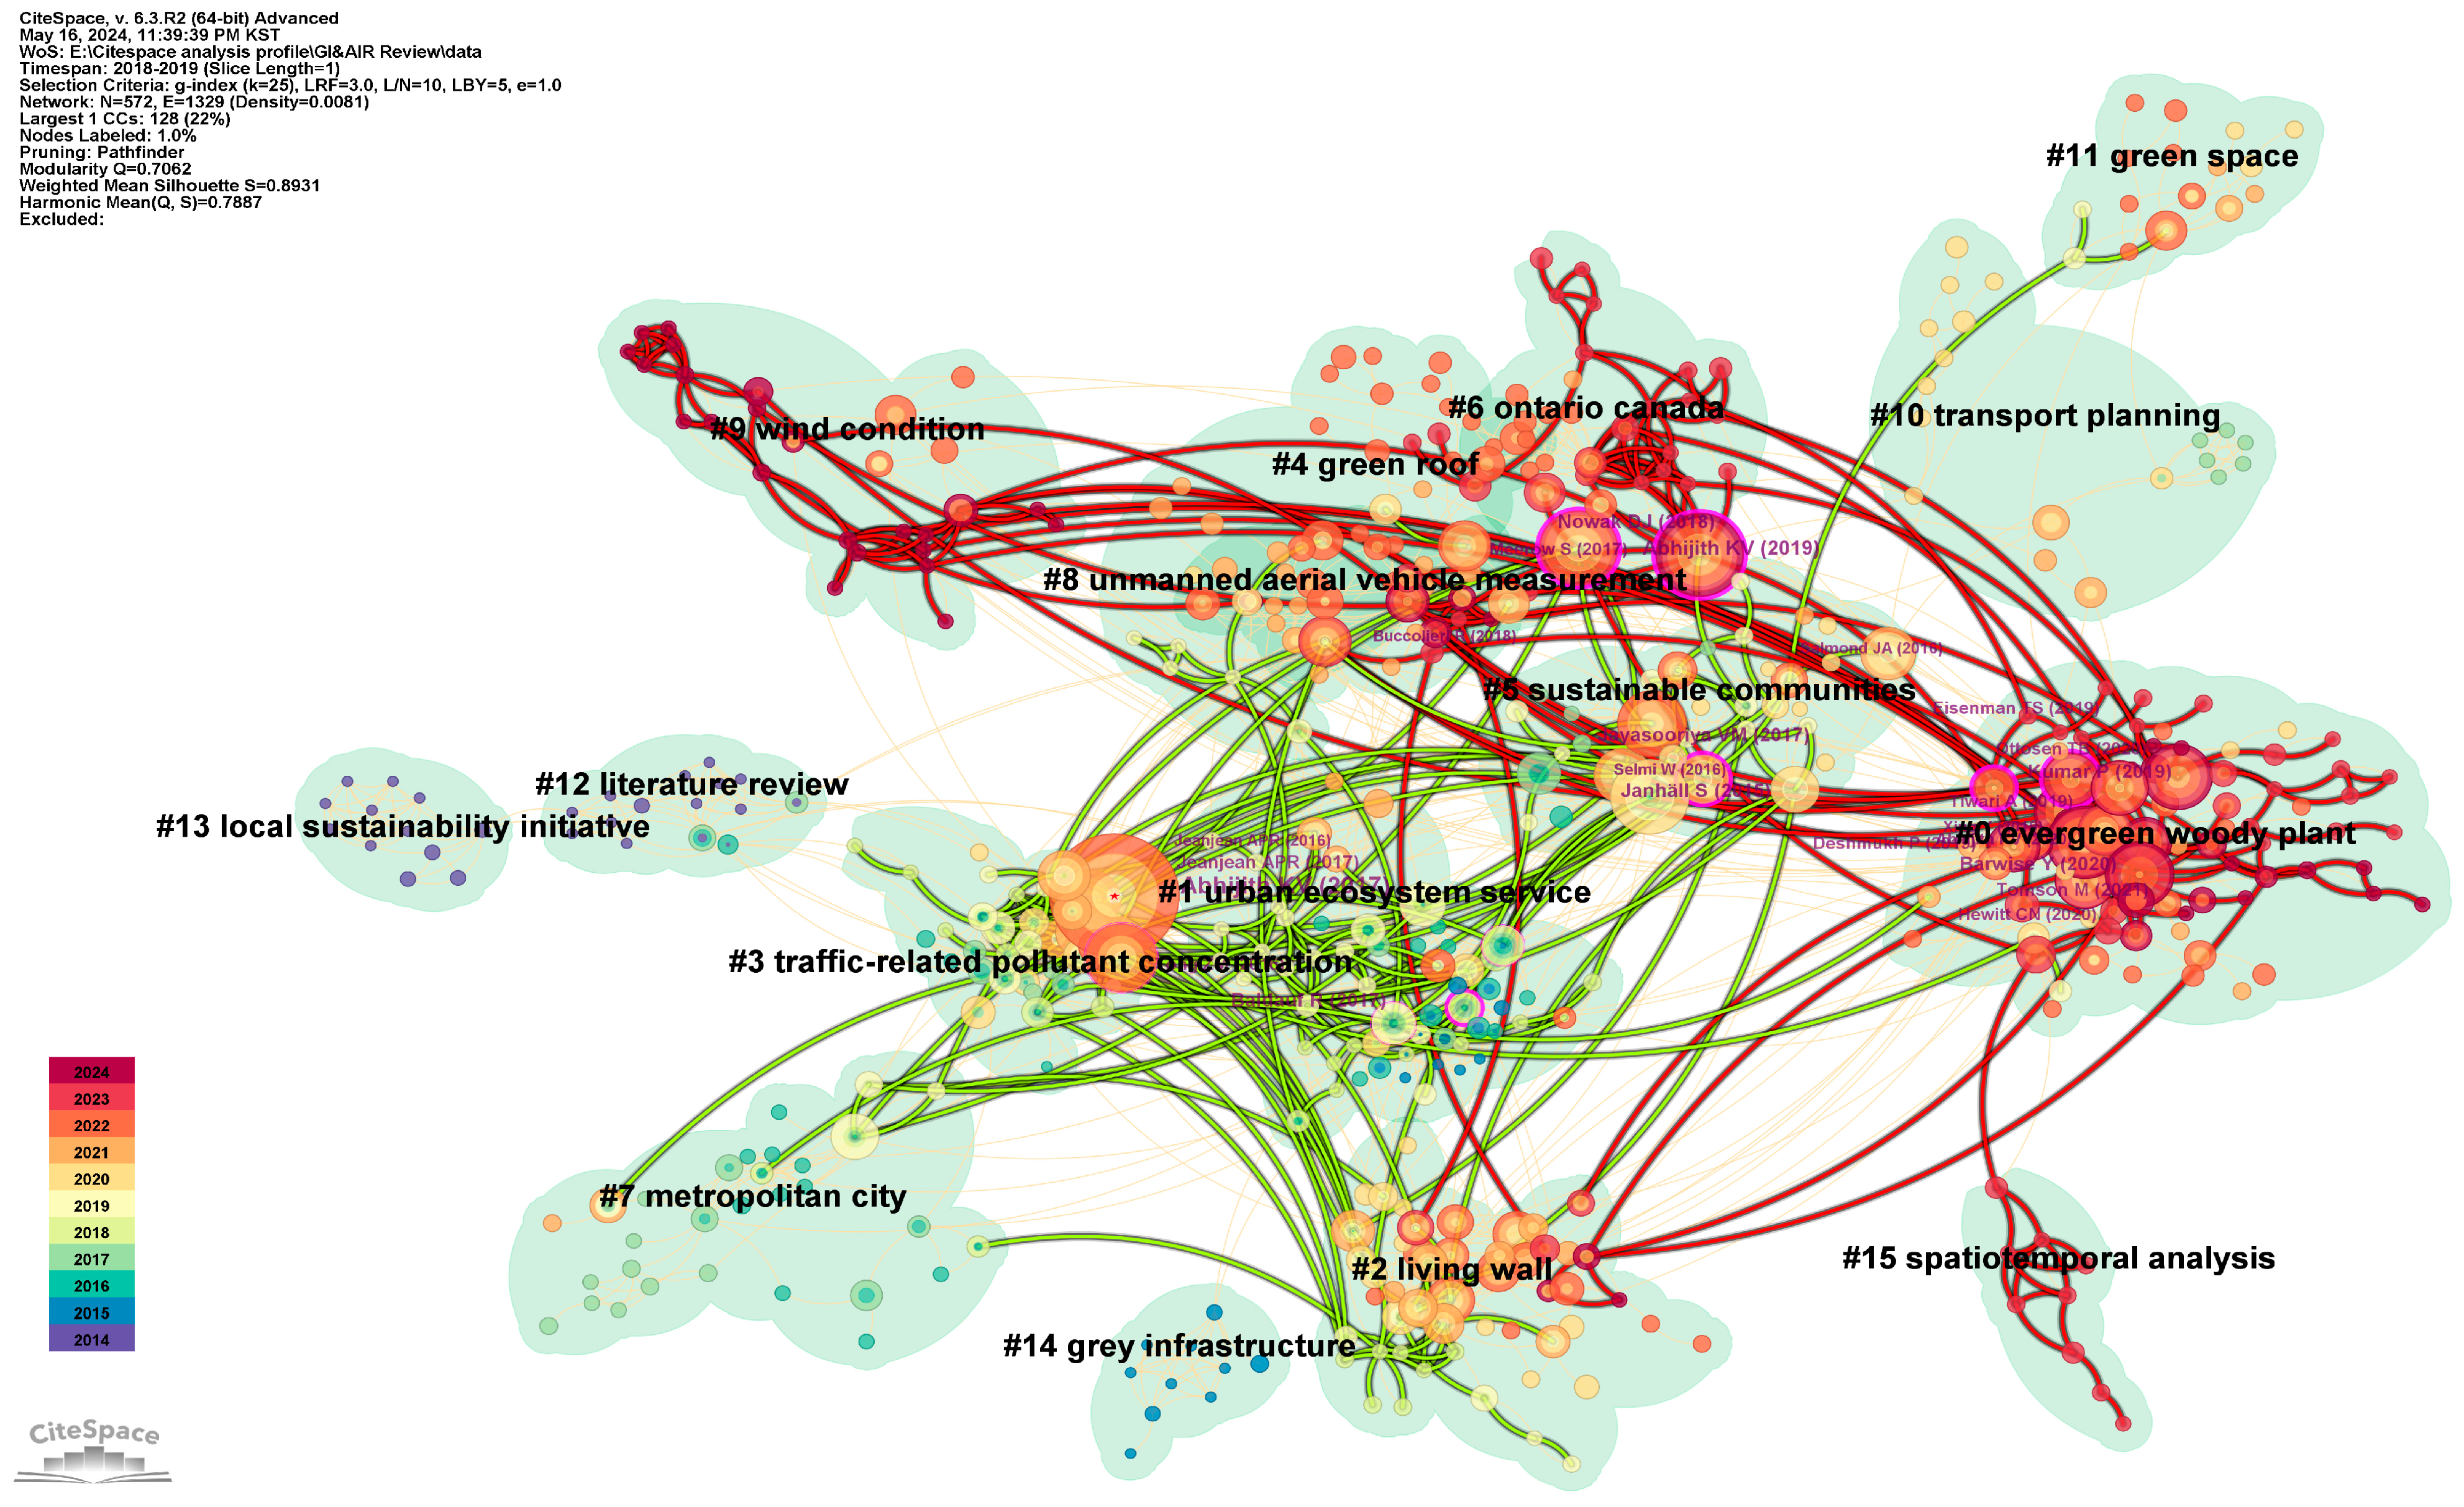
Figure 9). The authors overlaid the visualization networks to observe the citation situation of the literature more intuitively from 2023 to 2024. The logic behind overlaying the networks is to superimpose smaller data as one layer onto the layer of larger data. This allows for a more intuitive observation of the citation situation of the years under analysis (small data) within the entire data range (Figure 10) and the development process and changes in research areas. The Q value of this visualization result is 0.7062, and the S value is 0.8931, indicating high credibility for the results.
By comparing the two figures, it can be observed that the literature frequently cited from 2023 to 2024 mainly focuses on the following topics: evergreen woody plants, sustainable communities, unmanned aerial vehicle measurement, wind condition, green roofs, living walls, spatiotemporal analysis, etc. (indicated by red lines). This indicates that the recent research directions in GI and air pollution predominantly lean towards several areas, including (a) green plants and ecology [47,48,49,50,51]: researching plant species, growth habits, and their roles in ecosystems; (b) sustainable development and communities [15,52,53,54]: establishing and maintaining environmentally friendly and resource-efficient urban communities; (c) drone technology and applications [55,56,57,58]: drones are used for environmental monitoring and data collection, including measuring wind conditions and thermal data; (d) green technology and urban planning [16,59,60,61,62]: improving urban environments, conserving energy, and beautifying cities through plant cultivation; (e) spatial and temporal data analysis [63,64,65,66]: analyzing data changes over time and space using GIS or other techniques; (f) life safety and health [67,68,69]: investigating the impact of GI on human health.
Furthermore, these research areas emphasize environmental protection and sustainable development, highlighting the application of technological innovations in addressing environmental issues. However, compared to the research domain clusters from 2018 to 2019, which mainly focused on traditional environmental issues and urban management areas, such as urban ecosystem services, traffic-related pollutant concentration, and metropolitan cities (indicated by green lines), there is an overall trend of weakening. This could be attributed to several reasons: (a) Technological advancements: In recent years, the advancement and widespread adoption of technologies such as drones and smart devices have provided new methods and higher precision for environmental detection and analysis. (b) Increased environmental awareness: With a significant global increase in attention to environmental protection and sustainable development, research directions have shifted from singular pollution source control towards comprehensive ecosystem management and sustainable community development. (c) Escalation of climate change: The increasingly significant impacts of climate change have prompted research to focus more on ecosystem adaptation and mitigation strategies, such as studying the influence of wind conditions on climate patterns and the role of plants in mitigating climate change. (d) Urbanization processes: With the advancement of global urbanization, research focuses have expanded from pollution control in major cities to broader studies on urban ecosystem services and GI to address complex urban environmental issues.
Among the specific nodes the literature represents, the most central document regarding intermediary centrality is [37]. This paper connects clusters #0, #5, #7, and #8 and occupies a central position in cluster #1, indicating its significant influence on multiple research topics. Using Barcelona as a case study, the results suggest that urban forests significantly mitigate pollution, albeit moderately compared to overall urban pollution levels and greenhouse gas emissions. Thus, there is a need to coordinate efforts in GI at a broader spatial scale to counteract urban pollution effectively. Additionally, in terms of positioning, documents authored by Abhijith et al. [70] (centrality 0.17) and Nowak et al. [71] (centrality 0.15) are located at the boundary of clusters #5 and #6, connecting multiple nodes, indicating that these two papers have, to some extent, propelled the development of the research field. [70] investigated the impact of roadside GI on different particulate matter concentrations, while [71] studied the positive effects of ecosystem services on health. The other influential review paper is authored by Abhijith and Kumar [28] (centrality 0.15), which examines the influence of urban GI on air pollution levels and suggests a comprehensive and quantitative approach to deploying various vegetation types in the built environment. The study evaluated individual exposure to air pollution sources in open roads and built street canyon environments in the presence of vegetation, critically summarizing the available literature to better understand the interaction between vegetation and surrounding built environments and identify methods for using GI to reduce local air pollution exposure. This node is the most frequently cited throughout the research field, indicating its high impact.

3.8. Modeling of Structural Variation in the Literature in the Field of GI and Air Pollution

Chen initially proposed research on the Theory of Structural Variation in 2012 [72]. Its core issue is how to quantify the novelty of a document. According to Professor Chen’s theory, the creativity or innovation of scientific research largely involves connectivity, the ability to connect unrelated concepts or ideas, essentially bridging between different islands. The second condition is that the appearance of this bridge quickly attracts other researchers’ attention to the research field and leads to more research results being published. Simply, it triggers a butterfly effect, which CiteSpace refers to as the structural variation model.
The structural variation model mainly includes three indicators measuring the degree of structural transformation. These are Modularity Change Rate (ΔModularity), which refers to the increase in connections in the knowledge base network caused by citing the literature. The larger the ΔM value, the greater the potential impact of the literature on disciplinary development; Cluster Linkage Change Rate (ΔCluster linkage) indicates the change in the span of node connections between different clusters in the basic network caused by citing the literature. A larger ΔCL value indicates a stronger interdisciplinary attribute of the literature and Centrality Dispersion (ΔCentrality), which measures the change in centrality of nodes between two time periods. A larger ΔC value indicates that the literature becomes more important during the period [27].
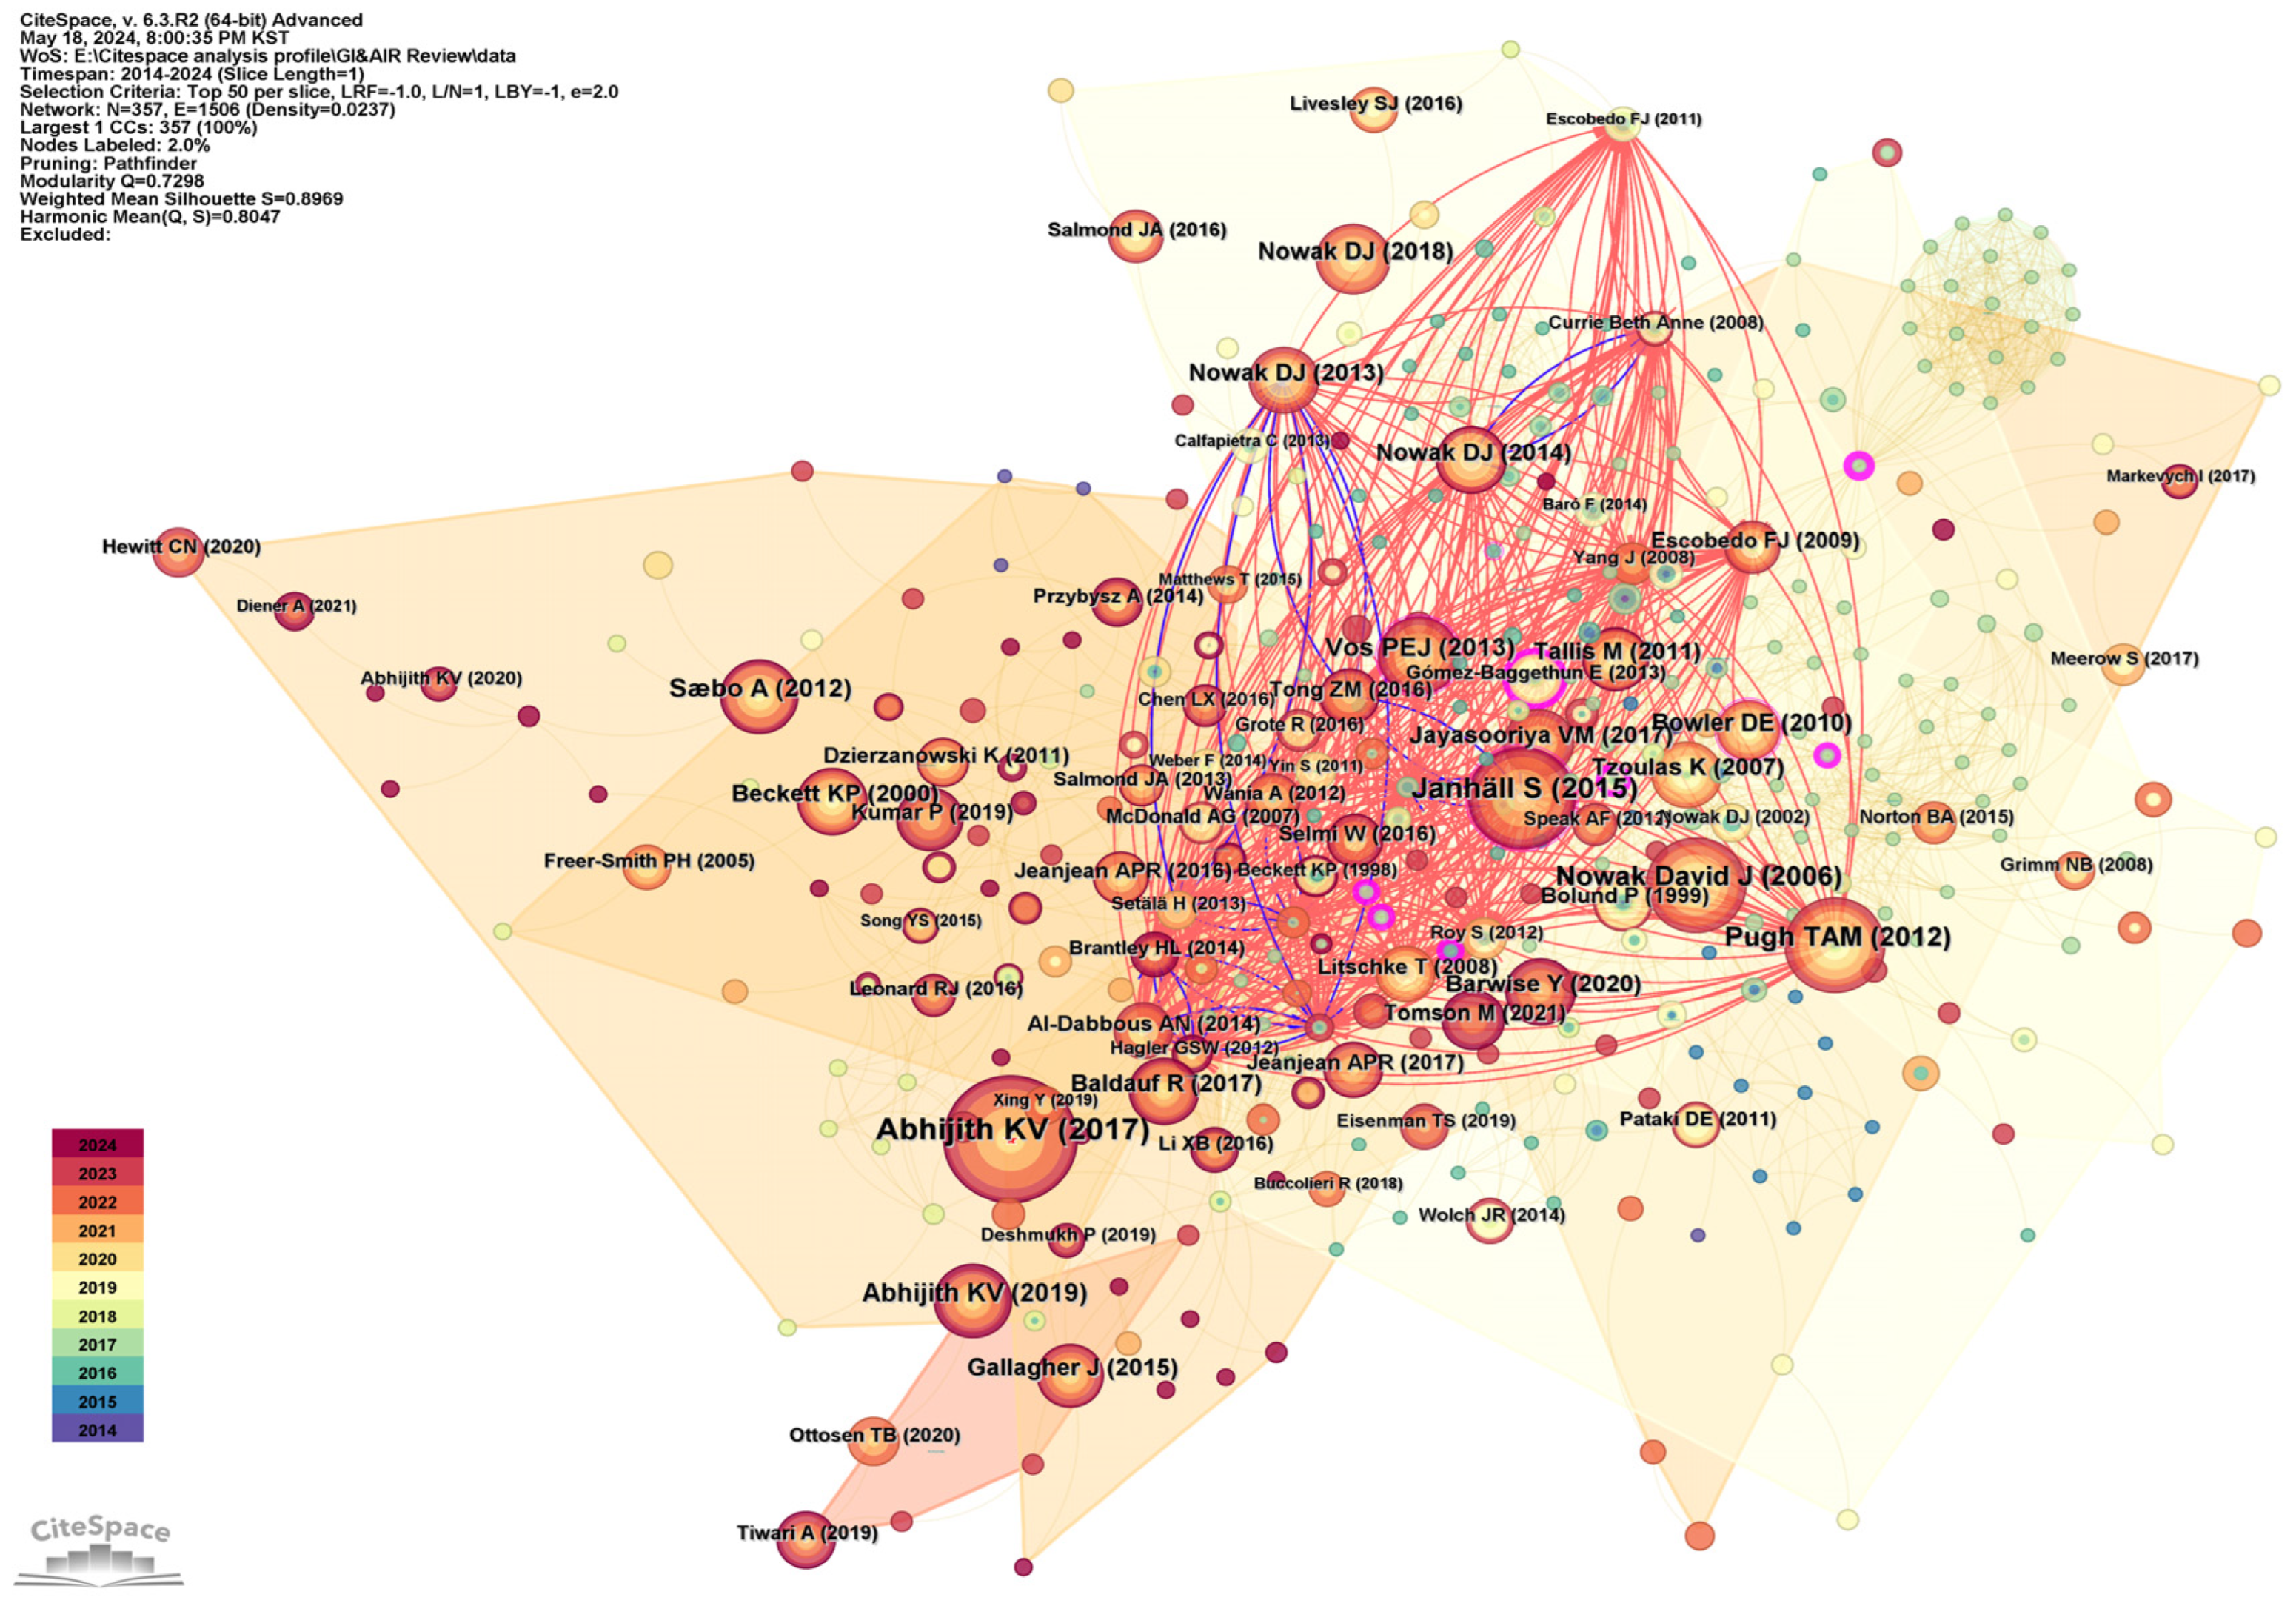
Among all the literature in this research field, the significant literature in all three indicators is the paper by Abhijith et al. [28], published in 2017, as visualized in Figure 11. In the figure, the solid blue lines represent citation relationships before the publication of this paper. In contrast, the dashed red lines represent citation relationships formed after the publication of this paper. In essence, after the publication of this paper, the research field gradually attracted more attention from researchers, forming a larger cross-citation subnetwork, demonstrating that this paper has the strongest impact in this research field.
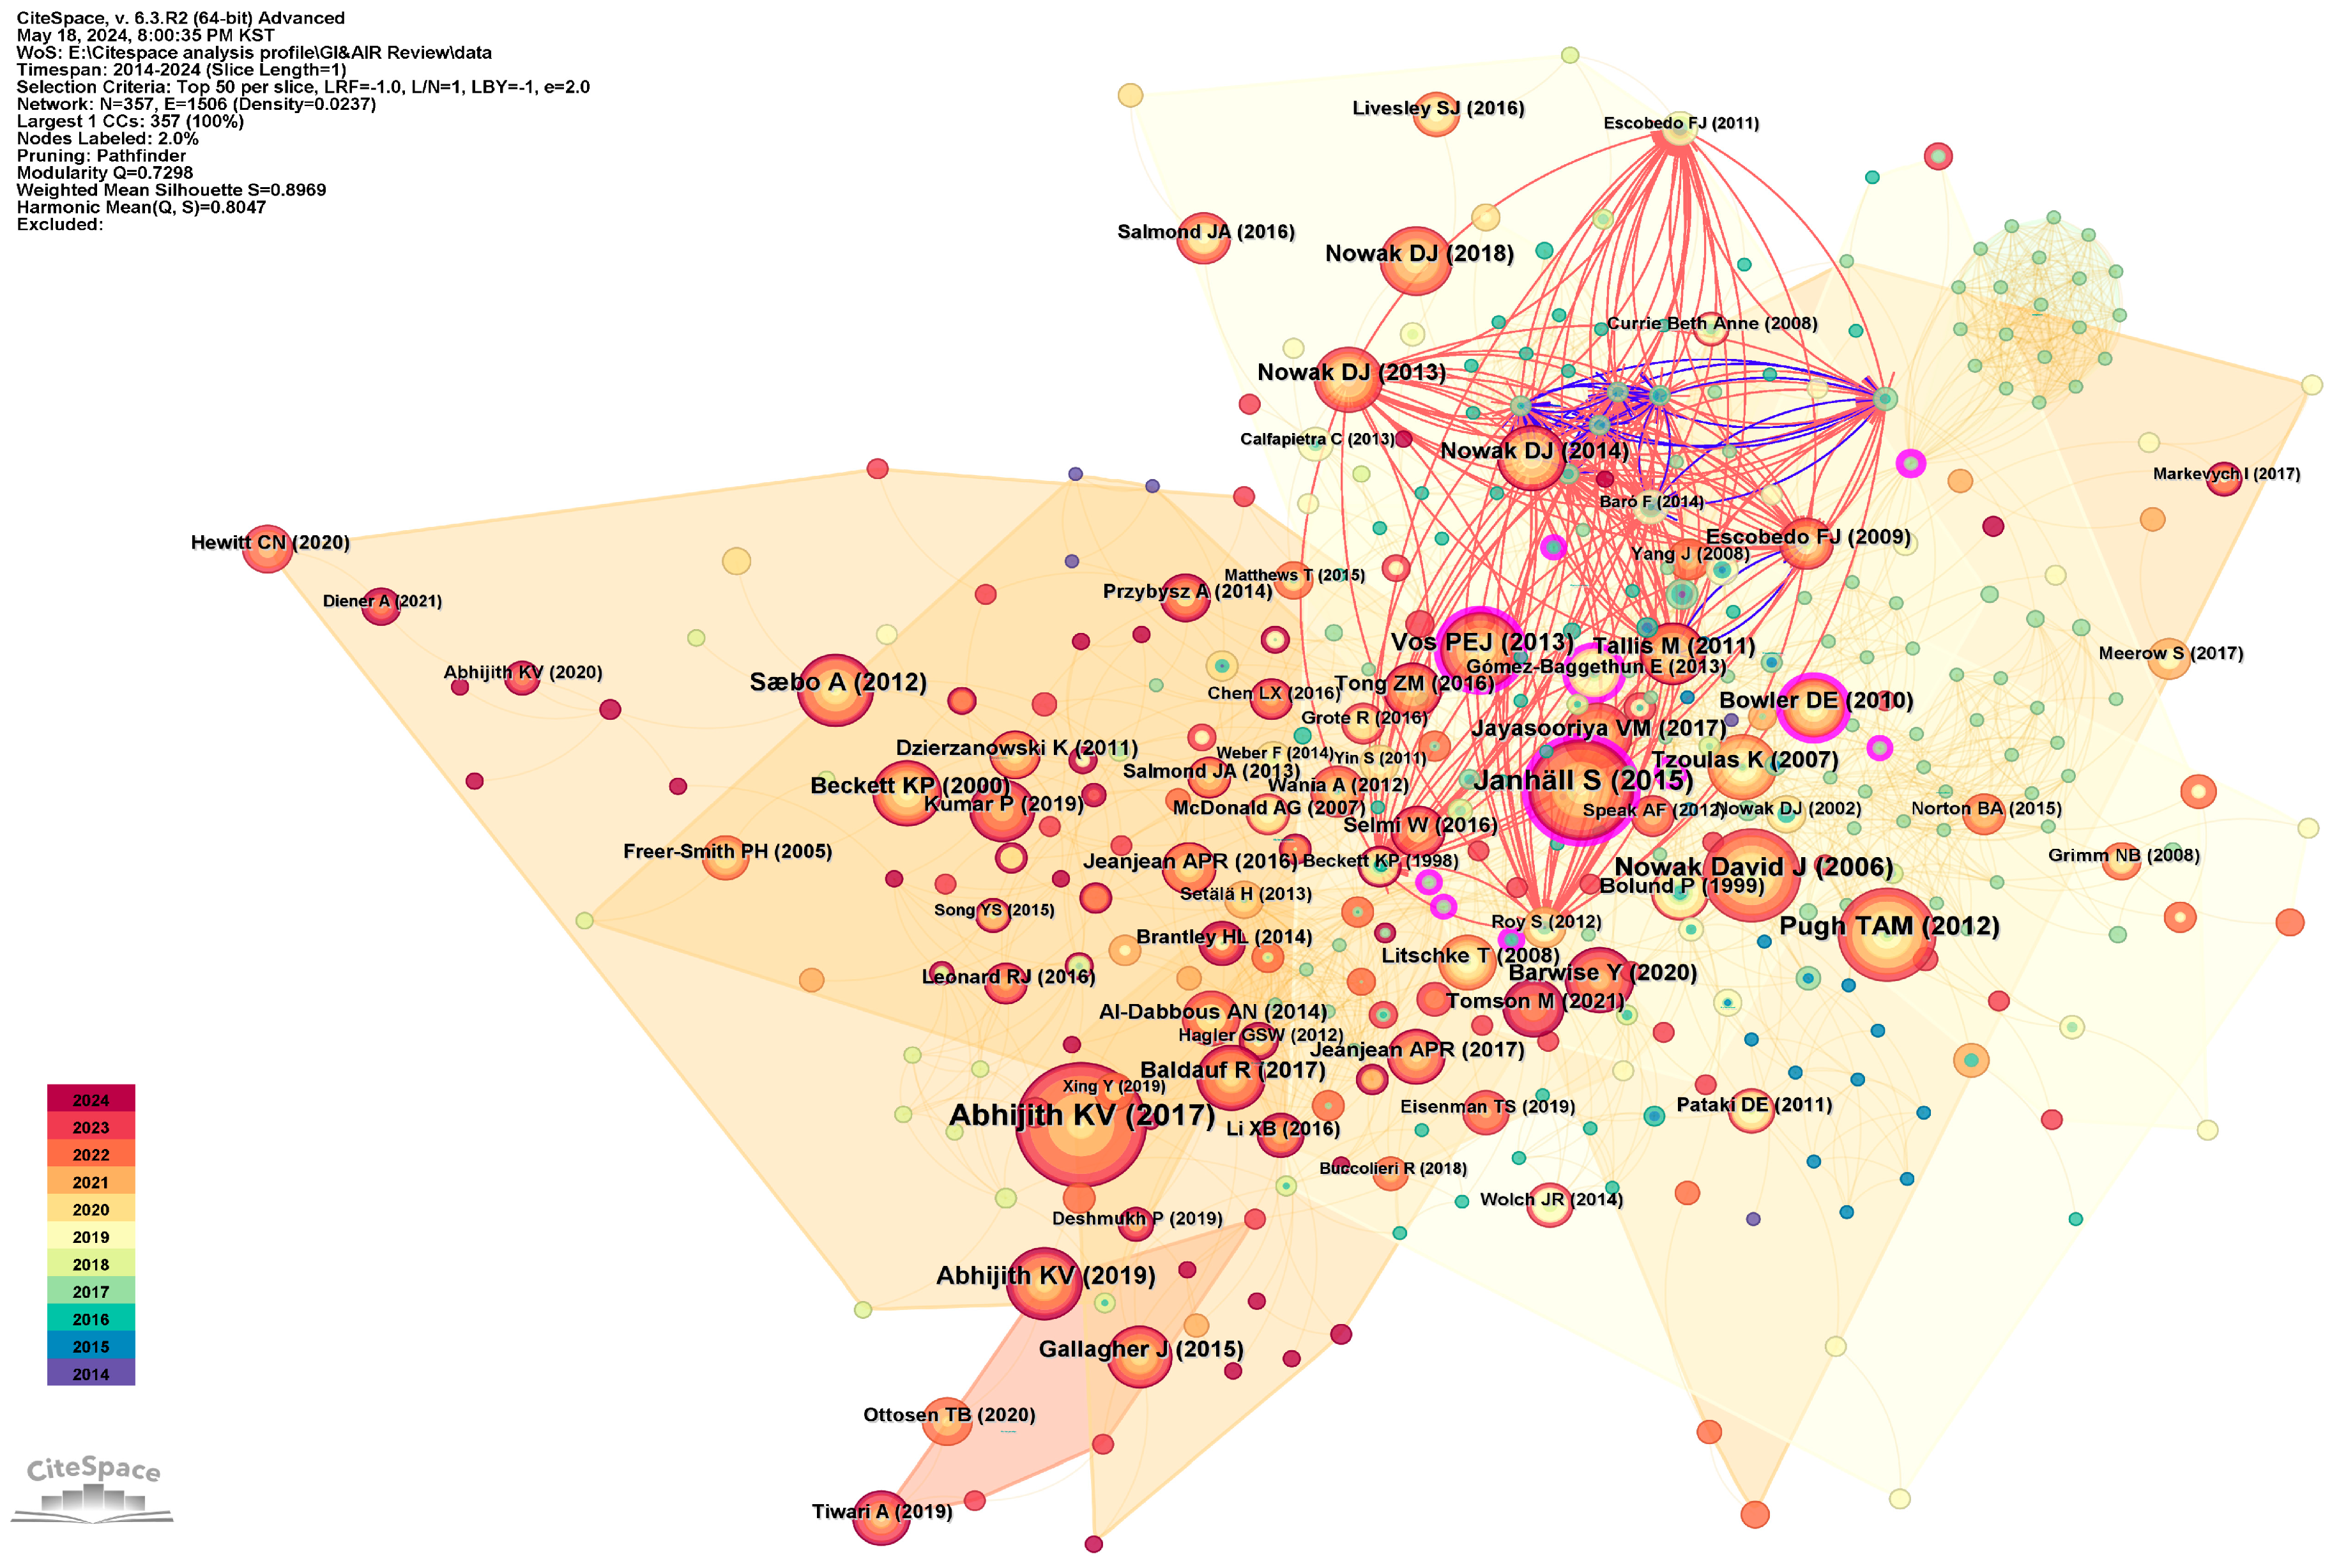
The field has another highly influential article, published by Bottalico et al. [73] in 2017, as visualized in Figure 12. This article, based in Florence, Italy, utilized high spatial resolution remote sensing data and on-site observations to create a spatial distribution map of urban forests and estimate the leaf area index (LAI). It measured and analyzed the effectiveness of urban forests in removing the air pollutants PM10 and O3. The results emphasized the different contributions of various vegetation types to air pollution removal and suggested increasing the diversity of green coverage in urban planning to enhance air quality improvement. Through comprehensive screening of the three parameters, the literature in this research field includes articles with strong influence and research potential, as shown in Table 9. It is worth noting that, due to the increasing citation and impact over time, there may be articles with potential that have not yet gained attention.

4. Discussion and Future Research

The current research on the impact of GI and air pollution in different environments has provided valuable insights. The current research areas can be broadly categorized into the following aspects: (a) green plants and ecology; (b) sustainable development and communities; c.) drone measurement and application; (d) green sustainability and urban planning; (e) spatial and temporal data analysis; and (f) life safety and health. However, it also reveals several aspects worth further exploration and improvement. At the same time, future research directions are discussed, built upon existing research findings and data, thus having a certain scientific basis.

4.1. Research Methodology and Data Reliability

The current research primarily employs various methods, including field measurements, remote sensing technologies, and computational fluid dynamics (CFD) simulations [82,83]. Each of these methods has its advantages. While field measurements are precise, they can be costly and time-consuming when applied on a large scale; remote sensing technologies can cover large areas, but their data accuracy is limited by resolution and meteorological conditions; and CFD simulations can test the effects of multiple variables in a virtual environment, but their accuracy depends on the precision of input parameters and the reasonableness of model assumptions. Therefore, future research should consider integrating multiple methods to compensate for their limitations. For instance, field measurements can validate and refine the accuracy of remote sensing and simulation results, thereby enhancing data reliability and universality. Additionally, future research should focus on collecting more measurement data under different meteorological and geometric conditions and providing raw data to validate the rationality of models and experiments.

4.2. Climate Change and Adaptation Strategies

With the impact of climate change on urban environments becoming increasingly significant, researching the performance of GI under different climatic scenarios has become particularly important. In the future, integrating climate change prediction models, especially for extreme weather events, along with climate and environmental simulation, will be essential to assess the role of GI in addressing climate change. This will thoroughly explore its potential and adaptability in mitigating the urban heat island effect [84,85] and improving air quality, thereby providing scientific evidence for urban planning and policy formulation.

4.3. Impact of Socio-Economic Factors

The planning and implementation of GI are technical and complex socio-economic issues. The economic development level, policy support, and public participation level in different regions significantly impact GI’s promotion and effectiveness. Existing research has mostly focused on the technical aspects, but attention should be paid to socio-economic factors in the future. Through interdisciplinary research methods, it is essential to comprehensively analyze the influence of these factors on the implementation effectiveness of GI, ensuring its effectiveness and sustainability in different socio-economic backgrounds.

4.4. Green Infrastructure and Health Benefits

Although current research has confirmed the significant positive impact of GI on improving air quality and residents’ health, existing studies mainly focus on changes in air pollutant concentrations, with relatively few directly quantifying the health benefits. In the future, more attention should be paid to the health benefits of GI and its direct impact on public health [86,87,88,89,90]. For example, quantifying its direct effects on preventing respiratory and cardiovascular diseases. Exploring the differences in health benefits among different population groups can raise awareness of the importance of environmental pollution and green sustainable development goals.

4.5. Deepening Research in Multidisciplinary Integration

Future research should emphasize interdisciplinary integration, especially the intersection of ecology, meteorology, urban planning, and public health. Additionally, with technological innovations such as drones, remote sensing, the Internet of Things (IoT), artificial intelligence (AI), and big data, there will be access to higher precision data and detailed environmental monitoring for GI research. This interdisciplinary approach and technological advancement will better elucidate the comprehensive effects of GI on improving air pollution and drive progress in the research field.

4.6. Versatility of Gi System Evaluation

GI improves air quality, regulates urban microclimates, increases biodiversity, and provides recreational spaces, among other ecosystem services. However, current research mainly focuses on individual functions, lacking systematic assessments of its comprehensive benefits. Future studies should pay more attention to the multifunctionality of GI and quantify its comprehensive benefits in air quality, urban thermal comfort, public health, and economic benefits through multidimensional assessments at multiple scales. For instance, comprehensive assessments using life cycle assessment (LCA) methods could measure GI’s environmental and social benefits throughout its construction, operation, and maintenance processes [91]. This integrated assessment and analysis will help reveal the comprehensive value of GI and promote its widespread application in urban environmental governance.
Due to the impact of COVID-19, countries implemented strict lockdowns and social distancing measures, causing many research projects requiring field observations and experiments to be postponed or canceled, thus affecting the progress of research and the publication of results. Additionally, the pandemic’s economic impact and threat to public health have led to a renewed examination of the relationship between public health and environmental quality, which may prompt more research focusing on how to enhance urban resilience and improve public health through better green infrastructure. Future research may increasingly focus on how GI can play a greater role in mitigating air pollution while also addressing public health crises. Furthermore, future studies are likely to emphasize interdisciplinary collaboration among fields such as environmental science, public health, and urban planning. Such collaborations are expected to provide more comprehensive research perspectives and solutions.

5. Conclusions

This study conducted a comprehensive analysis using CiteSpace to examine the field’s key terms, research clusters, disciplinary development, and structural variation models. It reviewed and analyzed the current status, development process, and research hotspots of GI and air pollution from 2014 to 2024, delving into valuable and influential authors and pieces of literature in this research field. Furthermore, it discussed the shortcomings of current research and proposed future research directions.
The main conclusions of this study are as follows: (a) The number of publications in this research field steadily increased from 2014 to 2024, indicating growing attention from researchers. However, there was a decrease in publications in 2023, possibly due to the impact of COVID-19. (b) Compared to Asian countries, European and American countries are more focused on topics related to green sustainable development. Asian countries or researchers should increase their investment in relevant topics. (c) The literature in this research field mainly concentrates on environmental science, plant science, urban planning, and architecture, with less participation from the humanities, economics, and social sciences. Future research should focus more on interdisciplinary integration and conduct deeper interdisciplinary research. (d) In recent years, research in this field has shifted from predominantly natural and biological sciences to more reliance on mathematical and systems science methodologies. This change may be attributed to the need for more precise models and data analysis to address the complexity of research questions. (e) Keyword analysis indicates that research trends in this field are gradually shifting towards particle deposition, street canyons, pollutant dispersion, etc., which may become new directions for future research. In addition, studies related to sports activities and climate change may also receive more attention. (f) The research field has formed relatively mature clusters, mainly concentrated around 2016. Despite the continuous increase in publications in recent years, there have been no newer research clusters, indicating the need for more interdisciplinary integration opportunities to broaden research paths and promote the development of this research field. (g) Future research trends will focus on interdisciplinary integration and technological innovation to enhance the reliability of data and the universality of research results. Moreover, research should pay more attention to the multifunctionality of GI and its comprehensive benefits under different climatic conditions and socio-economic backgrounds, quantifying its comprehensive benefits in air quality, urban thermal comfort, public health, and economic benefits.

6. Research Limitations

This study utilized CiteSpace for bibliometric analysis, but it also has some limitations. Since this study used Web of Science to obtain the literature data, there may be issues of data incompleteness and bias. Some emerging fields or non-English pieces of literature might not be included, affecting the comprehensiveness and representativeness of the analysis results. Additionally, some bibliometric indicators used by CiteSpace (such as co-citation analysis and keyword co-occurrence analysis) are primarily based on citation relationships and keyword frequency. However, these indicators may not adequately reflect the quality and importance of the literature content. Furthermore, these indicators might be influenced by highly cited pieces of literature or popular keywords, resulting in certain research topics being overemphasized while other important but less cited studies might be overlooked.

Author Contributions

Conceptualisation, J.L.; methodology, J.L.; software, J.L.; validation, J.L. and H.Y.K.; formal analysis, J.L. and H.Y.K.; investigation, J.L.; resources, H.Y.K.; data curation, J.L.; writing—original draft preparation, J.L.; writing—review and editing, J.L. and H.Y.K.; visualisation, J.L.; supervision, H.Y.K.; project administration, J.L. and H.Y.K. All authors have read and agreed to the published version of the manuscript.

Funding

This research was supported by the Basic Research Program through the National Research Foundation of Korea (NRF), funded by the MSIT (RS-2023-00220751).

Institutional Review Board Statement

Not applicable.

Informed Consent Statement

Not applicable.

Data Availability Statement

The data used to support this study’s findings are available from the corresponding author upon reasonable request.

Conflicts of Interest

The authors declare no conflicts of interest.

References

  1. Abubeker, K.M.; Baskar, S. Wireless sensor and wireless body area network assisted biosensor network for effective monitoring and prevention of non-ventilator hospital-acquired pneumonia. Front. Sustain. Cities 2022, 4, 1063067. [Google Scholar] [CrossRef]
  2. Agudelo-Castañeda, D.; Arellana, J.; Morgado-Gamero, W.B.; De Paoli, F.; Portz, L.C. Linking of built environment inequalities with air quality: A case study. Transp. Res. Part D Transp. Environ. 2023, 117, 103668. [Google Scholar] [CrossRef]
  3. Ai, H.S.; Zhang, X.; Zhou, Z.Q. The impact of greenspace on air pollution: Empirical evidence from China. Ecol. Indic. 2023, 146, 109881. [Google Scholar] [CrossRef]
  4. World Health Organization. Billions of People Still Breathe Unhealthy Air: New WHO Data. Available online: https://www.who.int/news/item/04-04-2022-billions-of-people-still-breathe-unhealthy-air-new-who-data (accessed on 1 May 2024).
  5. World Health Organization. The United Nations and Air Quality. Available online: https://www.un.org/zh/sustainability/airpollution/china.shtml (accessed on 1 May 2024).
  6. Benedict, M.A.; McMahon, E.T. Green Infrastructure: Linking Landscapes and Communities; Island Press: Washington, DC, USA, 2012. [Google Scholar]
  7. Ahern, J. Green infrastructure for cities: The spatial dimension. Cities Future Integr. Sustain. Water Landsc. Manag. 2007, 13, 267–283. [Google Scholar]
  8. Gill, S.E.; Handley, J.F.; Ennos, A.R.; Pauleit, S. Adapting cities for climate change: The role of the green infrastructure. Built Environ. 2007, 33, 115–133. [Google Scholar] [CrossRef]
  9. Fletcher, T.D.; Shuster, W.; Hunt, W.F.; Ashley, R.; Butler, D.; Arthur, S.; Trowsdale, S.; Barraud, S.; Semadeni-Davies, A.; Bertrand-Krajewski, J.-L. SUDS, LID, BMPs, WSUD and more—The evolution and application of terminology surrounding urban drainage. Urban Water J. 2015, 12, 525–542. [Google Scholar] [CrossRef]
  10. Mell, I.C. Can you tell a green field from a cold steel rail? Examining the “green” of Green Infrastructure development. Local Environ. 2013, 18, 152–166. [Google Scholar] [CrossRef]
  11. Elmqvist, T.; Setälä, H.; Handel, S.N.; van der Ploeg, S.; Aronson, J.; Blignaut, J.N.; Gómez-Baggethun, E.; Nowak, D.J.; Kronenberg, J.; de Groot, R. Benefits of restoring ecosystem services in urban areas. Curr. Opin. Environ. Sustain. 2015, 14, 101–108. [Google Scholar] [CrossRef]
  12. Danilina, N.; Tsurenkova, K.; Berkovich, V. Evaluating Urban Green Public Spaces: The Case Study of Krasnodar Region Cities, Russia. Sustainability 2021, 13, 14059. [Google Scholar] [CrossRef]
  13. Chen, H.S.; Tam, K.I.; Zhao, Y.L.; Yuan, L.; Wang, W.Y.; Lin, M.R.S.; Chiang, P.C. Development of Environmental Action Plans for Adaptation to Climate Change: A Perspective of Air Quality Management. Aerosol Air Qual. Res. 2023, 23, 220377. [Google Scholar] [CrossRef]
  14. Li, X.Q.; Stringer, L.C.; Dallimer, M. The Impacts of Urbanisation and Climate Change on the Urban Thermal Environment in Africa. Climate 2022, 10, 164. [Google Scholar] [CrossRef]
  15. Pandey, B.; Ghosh, A. Urban ecosystem services and climate change: A dynamic interplay. Front. Sustain. Cities 2023, 5, 1281430. [Google Scholar] [CrossRef]
  16. Newman, G.; Shi, T.Q.; Yao, Z.; Li, D.Y.; Sansom, G.; Kirsch, K.; Casillas, G.; Horney, J. Citizen Science-Informed Community Master Planning: Land Use and Built Environment Changes to Increase Flood Resilience and Decrease Contaminant Exposure. Int. J. Environ. Res. Public Health 2020, 17, 486. [Google Scholar] [CrossRef]
  17. Ko, S.; Lee, D. Effectiveness of Green Infrastructure Location Based on a Social Well-Being Index. Sustainability 2021, 13, 9620. [Google Scholar] [CrossRef]
  18. Chen, H.S.; Lin, Y.C.; Chiueh, P.T. Nexus of ecosystem service-human health-natural resources: The nature-based solutions for urban PM2.5 pollution. Sustain. Cities Soc. 2023, 91, 104441. [Google Scholar] [CrossRef]
  19. Eisenman, T.S.; Churkina, G.; Jariwala, S.P.; Kumar, P.; Lovasi, G.S.; Pataki, D.E.; Weinberger, K.R.; Whitlow, T.H. Urban trees, air quality, and asthma: An interdisciplinary review. Landsc. Urban Plan. 2019, 187, 47–59. [Google Scholar] [CrossRef]
  20. Yao, Y.B.; Wang, Y.F.; Ni, Z.B.; Chen, S.Q.; Xia, B.C. Improving air quality in Guangzhou with urban green infrastructure planning: An i-Tree Eco model study. J. Clean. Prod. 2022, 369, 133372. [Google Scholar] [CrossRef]
  21. Rigolon, A.; Browning, M.; McAnirlin, O.; Yoon, H. Green Space and Health Equity: A Systematic Review on the Potential of Green Space to Reduce Health Disparities. Int. J. Environ. Res. Public Health 2021, 18, 2563. [Google Scholar] [CrossRef]
  22. Roe, J.; Mondschein, A.; Neale, C.; Barnes, L.; Boukhechba, M.; Lopez, S. The Urban Built Environment, Walking and Mental Health Outcomes among Older Adults: A Pilot Study. Front. Public Health 2020, 8, 575946. [Google Scholar] [CrossRef] [PubMed]
  23. Wolf, K.L.; Lam, S.T.; McKeen, J.K.; Richardson, G.R.A.; van den Bosch, M.; Bardekjian, A.C. Urban Trees and Human Health: A Scoping Review. Int. J. Environ. Res. Public Health 2020, 17, 4371. [Google Scholar] [CrossRef] [PubMed]
  24. Web of Science. Available online: https://www.webofscience.com/ (accessed on 1 May 2024).
  25. Hogan, A.; Blomqvist, E.; Cochez, M.; d’Amato, C.; Melo, G.D.; Gutierrez, C.; Kirrane, S.; Gayo, J.E.L.; Navigli, R.; Neumaier, S. Knowledge graphs. ACM Comput. Surv. 2021, 54, 1–37. [Google Scholar] [CrossRef]
  26. Chen, Y.; Wang, Y.P.; Zhou, D. Knowledge Map of Urban Morphology and Thermal Comfort: A Bibliometric Analysis Based on CiteSpace. Buildings 2021, 11, 427. [Google Scholar] [CrossRef]
  27. Chen, C.; Dubin, R.; Kim, M.C. Emerging trends and new developments in regenerative medicine: A scientometric update (2000–2014). Expert Opin. Biol. Ther. 2014, 14, 1295–1317. [Google Scholar] [CrossRef] [PubMed]
  28. Abhijith, K.; Kumar, P.; Gallagher, J.; McNabola, A.; Baldauf, R.; Pilla, F.; Broderick, B.; Di Sabatino, S.; Pulvirenti, B. Air pollution abatement performances of green infrastructure in open road and built-up street canyon environments—A review. Atmos. Environ. 2017, 162, 71–86. [Google Scholar] [CrossRef]
  29. Meerow, S.; Newell, J.P. Spatial planning for multifunctional green infrastructure: Growing resilience in Detroit. Landsc. Urban Plan. 2017, 159, 62–75. [Google Scholar] [CrossRef]
  30. Salmond, J.A.; Tadaki, M.; Vardoulakis, S.; Arbuthnott, K.; Coutts, A.; Demuzere, M.; Dirks, K.N.; Heaviside, C.; Lim, S.; Macintyre, H. Health and climate related ecosystem services provided by street trees in the urban environment. Environ. Health 2016, 15, 95–111. [Google Scholar] [CrossRef] [PubMed]
  31. Keeler, B.L.; Hamel, P.; McPhearson, T.; Hamann, M.H.; Donahue, M.L.; Meza Prado, K.A.; Arkema, K.K.; Bratman, G.N.; Brauman, K.A.; Finlay, J.C. Social-ecological and technological factors moderate the value of urban nature. Nat. Sustain. 2019, 2, 29–38. [Google Scholar] [CrossRef]
  32. Tsoka, S.; Tsikaloudaki, A.; Theodosiou, T. Analyzing the ENVI-met microclimate model’s performance and assessing cool materials and urban vegetation applications—A review. Sustain. Cities Soc. 2018, 43, 55–76. [Google Scholar] [CrossRef]
  33. Chen, C. Science mapping: A systematic review of the literature. J. Data Inf. Sci. 2017, 2, 1–40. [Google Scholar]
  34. Ebisu, K.; Holford, T.R.; Bell, M.L. Association between greenness, urbanicity, and birth weight. Sci. Total Environ. 2016, 542, 750–756. [Google Scholar] [CrossRef]
  35. Anderson, V.; Gough, W.A.; Agic, B. Nature-based equity: An assessment of the public health impacts of green infrastructure in Ontario Canada. Int. J. Environ. Res. Public Health 2021, 18, 5763. [Google Scholar] [CrossRef] [PubMed]
  36. Weerakkody, U.; Dover, J.W.; Mitchell, P.; Reiling, K. Particulate matter pollution capture by leaves of seventeen living wall species with special reference to rail-traffic at a metropolitan station. Urban For. Urban Green. 2017, 27, 173–186. [Google Scholar] [CrossRef]
  37. Blum, J. Contribution of ecosystem services to air quality and climate change mitigation policies: The case of urban forests in Barcelona, Spain. In Urban Forests; Apple Academic Press: Waretown, NJ, USA, 2017; pp. 21–54. [Google Scholar]
  38. Jin, M.-Y.; Zhang, L.-Y.; Peng, Z.-R.; He, H.-D.; Kumar, P.; Gallagher, J. The impact of dynamic traffic and wind conditions on green infrastructure performance to improve local air quality. Sci. Total Environ. 2024, 917, 170211. [Google Scholar] [CrossRef] [PubMed]
  39. Tong, Z.; Baldauf, R.W.; Isakov, V.; Deshmukh, P.; Zhang, K.M. Roadside vegetation barrier designs to mitigate near-road air pollution impacts. Sci. Total Environ. 2016, 541, 920–927. [Google Scholar] [CrossRef]
  40. Derkzen, M.L.; van Teeffelen, A.J.; Verburg, P.H. Quantifying urban ecosystem services based on high-resolution data of urban green space: An assessment for Rotterdam, The Netherlands. J. Appl. Ecol. 2015, 52, 1020–1032. [Google Scholar] [CrossRef]
  41. Baró, F.; Haase, D.; Gómez-Baggethun, E.; Frantzeskaki, N. Mismatches between ecosystem services supply and demand in urban areas: A quantitative assessment in five European cities. Ecol. Indic. 2015, 55, 146–158. [Google Scholar] [CrossRef]
  42. Russo, A.; J Escobedo, F.; Zerbe, S. Quantifying the local-scale ecosystem services provided by urban treed streetscapes in Bolzano, Italy. AIMS Environ. Sci. 2016, 3, 58–76. [Google Scholar] [CrossRef]
  43. Song, J.; Wang, Z.-H. Diurnal changes in urban boundary layer environment induced by urban greening. Environ. Res. Lett. 2016, 11, 114018. [Google Scholar] [CrossRef]
  44. Fenner Andrew, R. Spatial evaluation of multiple benefits to encourage multi-functional design of sustainable drainage in blue-green cities. Water 2017, 9, 953. [Google Scholar] [CrossRef]
  45. Small, H. Co-citation in the scientific literature: A new measure of the relationship between two documents. J. Am. Soc. Inf. Sci. 1973, 24, 265–269. [Google Scholar]
  46. Shiau, W.-L.; Dwivedi, Y.K.; Yang, H.S. Co-citation and cluster analyses of extant literature on social networks. Int. J. Inf. Manag. 2017, 37, 390–399. [Google Scholar] [CrossRef]
  47. He, C.; Qiu, K.Y.; Alahmad, A.; Pott, R. Particulate matter capturing capacity of roadside evergreen vegetation during the winter season. Urban For. Urban Green. 2020, 48, 126510. [Google Scholar] [CrossRef]
  48. Weerakkody, U.; Dover, J.W.; Mitchell, P.; Reiling, K. The impact of rainfall in remobilising particulate matter accumulated on leaves of four evergreen species grown on a green screen and a living wall. Urban For. Urban Green. 2018, 35, 21–31. [Google Scholar] [CrossRef]
  49. Xu, H.Y.; Zhao, G.H. Assessing the Value of Urban Green Infrastructure Ecosystem Services for High-Density Urban Management and Development: Case from the Capital Core Area of Beijing, China. Sustainability 2021, 13, 12115. [Google Scholar] [CrossRef]
  50. Wuyts, K.; Smets, W.; Lebeer, S.; Samson, R. Green infrastructure and atmospheric pollution shape diversity and composition of phyllosphere bacterial communities in an urban landscape. FEMS Microbiol. Ecol. 2020, 96, fiz173. [Google Scholar] [CrossRef] [PubMed]
  51. Muyshondt, B.; Wuyts, K.; Van Mensel, A.; Smets, W.; Lebeer, S.; Aleixo, C.; Ortí, M.A.; Casanelles-Abella, J.; Chiron, F.; Giacomo, P.; et al. Phyllosphere bacterial communities in urban green areas throughout Europe relate to urban intensity. FEMS Microbiol. Ecol. 2022, 98, fiac106. [Google Scholar] [CrossRef]
  52. Hui, C.X.; Dan, G.; Alamri, S.; Toghraie, D. Greening smart cities: An investigation of the integration of urban natural resources and smart city technologies for promoting environmental sustainability. Sustain. Cities Soc. 2023, 99, 104985. [Google Scholar] [CrossRef]
  53. Jain, M.; Nagpal, A. Relationship between Environmental Sustainability and Human Development Index: A Case of Selected South Asian Nations. Vision 2019, 23, 125–133. [Google Scholar] [CrossRef]
  54. Zinia, N.J.; McShane, P. Urban ecosystems and ecosystem services in megacity Dhaka: Mapping and inventory analysis. Urban Ecosyst. 2021, 24, 915–928. [Google Scholar] [CrossRef]
  55. Jaron, A.; Borucka, A.; Delis, P.; Sekrecka, A. An Assessment of the Possibility of Using Unmanned Aerial Vehicles to Identify and Map Air Pollution from Infrastructure Emissions. Energies 2024, 17, 577. [Google Scholar] [CrossRef]
  56. Miao, C.; Cui, A.; Xiong, Z.; Hu, Y.; Chen, W.; He, X. Vertical evaluation of air quality improvement by urban forest using unmanned aerial vehicles. Front. Ecol. Evol. 2022, 10, 1045937. [Google Scholar] [CrossRef]
  57. Liu, X.; Shi, X.Q.; He, H.D.; Li, X.B.; Peng, Z.R. Vertical distribution characteristics of particulate matter beside an elevated expressway by unmanned aerial vehicle measurements. Build. Environ. 2021, 206, 108330. [Google Scholar] [CrossRef]
  58. Liu, X.; Shi, X.Q.; Li, X.B.; Peng, Z.R. Quantification of multifactorial effects on particle distributions at urban neighborhood scale using machine learning and unmanned aerial vehicle measurement. J. Clean. Prod. 2022, 378, 134494. [Google Scholar] [CrossRef]
  59. Nordman, E.E.; Isely, E.; Isely, P.; Denning, R. Benefit-cost analysis of stormwater green infrastructure practices for Grand Rapids, Michigan, USA. J. Clean. Prod. 2018, 200, 501–510. [Google Scholar] [CrossRef]
  60. Sturiale, L.; Scuderi, A. The Role of Green Infrastructures in Urban Planning for Climate Change Adaptation. Climate 2019, 7, 119. [Google Scholar] [CrossRef]
  61. Tiwary, A.; Kumar, P. Impact evaluation of green-grey infrastructure interaction on built-space integrity: An emerging perspective to urban ecosystem service. Sci. Total Environ. 2014, 487, 350–360. [Google Scholar] [CrossRef] [PubMed]
  62. Karteris, M.; Theodoridou, I.; Mallinis, G.; Tsiros, E.; Karteris, A. Towards a green sustainable strategy for Mediterranean cities: Assessing the benefits of large-scale green roofs implementation in Thessaloniki, Northern Greece, using environmental modelling, GIS and very high spatial resolution remote sensing data. Renew. Sustain. Energy Rev. 2016, 58, 510–525. [Google Scholar] [CrossRef]
  63. Tella, A.; Balogun, A.L. GIS-based air quality modelling: Spatial prediction of PM10 for Selangor State, Malaysia using machine learning algorithms. Environ. Sci. Pollut. Res. 2022, 29, 86109–86125. [Google Scholar] [CrossRef]
  64. Zhou, Y.J.; Liu, H.L.; Zhou, J.X.; Xia, M. GIS-Based Urban Afforestation Spatial Patterns and a Strategy for PM2.5 Removal. Forests 2019, 10, 875. [Google Scholar] [CrossRef]
  65. Fernández, I.C.; Wu, J.G. A GIS-based framework to identify priority areas for urban environmental inequity mitigation and its application in Santiago de Chile. Appl. Geogr. 2018, 94, 213–222. [Google Scholar] [CrossRef]
  66. Badach, J.; Szczepanski, J.; Bonenberg, W.; Gebicki, J.; Nyka, L. Developing the Urban Blue-Green Infrastructure as a Tool for Urban Air Quality Management. Sustainability 2022, 14, 9688. [Google Scholar] [CrossRef]
  67. Castillo, M.D.; Anenberg, S.C.; Chafe, Z.A.; Huxley, R.; Johnson, L.S.; Kheirbek, I.; Malik, M.; Marshall, J.D.; Naidoo, S.; Nelson, M.L.; et al. Quantifying the Health Benefits of Urban Climate Mitigation Actions: Current State of the Epidemiological Evidence and Application in Health Impact Assessments. Front. Sustain. Cities 2021, 3, 768227. [Google Scholar] [CrossRef]
  68. Hegeman, E.E.; Levin, P.S. Using human health disparities and salmon health to guide spatial prioritization of green stormwater infrastructure. Landsc. Urban Plan. 2023, 240, 104905. [Google Scholar] [CrossRef]
  69. Wang, R.; Dong, P.; Dong, G.; Xiao, X.; Huang, J.; Yang, L.; Yu, Y.; Dong, G.-H. Exploring the impacts of street-level greenspace on stroke and cardiovascular diseases in Chinese adults. Ecotoxicol. Environ. Saf. 2022, 243, 113974. [Google Scholar] [CrossRef]
  70. Abhijith, K.; Kumar, P. Field investigations for evaluating green infrastructure effects on air quality in open-road conditions. Atmos. Environ. 2019, 201, 132–147. [Google Scholar] [CrossRef]
  71. Nowak, D.J.; Hirabayashi, S.; Doyle, M.; McGovern, M.; Pasher, J. Air pollution removal by urban forests in Canada and its effect on air quality and human health. Urban For. Urban Green. 2018, 29, 40–48. [Google Scholar] [CrossRef]
  72. Chen, C. Predictive effects of structural variation on citation counts. J. Am. Soc. Inf. Sci. Technol. 2012, 63, 431–449. [Google Scholar] [CrossRef]
  73. Bottalico, F.; Travaglini, D.; Chirici, G.; Garfi, V.; Giannetti, F.; De Marco, A.; Fares, S.; Marchetti, M.; Nocentini, S.; Paoletti, E.; et al. A spatially-explicit method to assess the dry deposition of air pollution by urban forests in the city of Florence, Italy. Urban For. Urban Green. 2017, 27, 221–234. [Google Scholar] [CrossRef]
  74. Fusaro, L.; Marando, F.; Sebastiani, A.; Capotorti, G.; Blasi, C.; Copiz, R.; Congedo, L.; Munafò, M.; Ciancarella, L.; Manes, F. Mapping and assessment of PM10 and O3 removal by woody vegetation at urban and regional level. Remote Sens. 2017, 9, 791. [Google Scholar] [CrossRef]
  75. Santos, A.; Pinho, P.; Munzi, S.; Botelho, M.J.; Palma-Oliveira, J.M.; Branquinho, C. The role of forest in mitigating the impact of atmospheric dust pollution in a mixed landscape. Environ. Sci. Pollut. Res. 2017, 24, 12038–12048. [Google Scholar] [CrossRef]
  76. Ghasemian, M.; Amini, S.; Princevac, M. The influence of roadside solid and vegetation barriers on near-road air quality. Atmos. Environ. 2017, 170, 108–117. [Google Scholar] [CrossRef]
  77. Capotorti, G.; Del Vico, E.; Anzellotti, I.; Celesti-Grapow, L. Combining the conservation of biodiversity with the provision of ecosystem services in urban green infrastructure planning: Critical features arising from a case study in the metropolitan area of Rome. Sustainability 2016, 9, 10. [Google Scholar] [CrossRef]
  78. Buccolieri, R.; Santiago, J.-L.; Rivas, E.; Sanchez, B. Review on urban tree modelling in CFD simulations: Aerodynamic, deposition and thermal effects. Urban For. Urban Green. 2018, 31, 212–220. [Google Scholar] [CrossRef]
  79. Jayasooriya, V.; Ng, A.; Muthukumaran, S.; Perera, B. Green infrastructure practices for improvement of urban air quality. Urban For. Urban Green. 2017, 21, 34–47. [Google Scholar] [CrossRef]
  80. Santiago, J.-L.; Buccolieri, R.; Rivas, E.; Calvete-Sogo, H.; Sanchez, B.; Martilli, A.; Alonso, R.; Elustondo, D.; Santamaría, J.M.; Martin, F. CFD modelling of vegetation barrier effects on the reduction of traffic-related pollutant concentration in an avenue of Pamplona, Spain. Sustain. Cities Soc. 2019, 48, 101559. [Google Scholar] [CrossRef]
  81. Mori, J.; Fini, A.; Galimberti, M.; Ginepro, M.; Burchi, G.; Massa, D.; Ferrini, F. Air pollution deposition on a roadside vegetation barrier in a Mediterranean environment: Combined effect of evergreen shrub species and planting density. Sci. Total Environ. 2018, 643, 725–737. [Google Scholar] [CrossRef]
  82. Jeanjean, A.P.R.; Monks, P.S.; Leigh, R.J. Modelling the effectiveness of urban trees and grass on PM2.5 reduction via dispersion and deposition at a city scale. Atmos. Environ. 2016, 147, 1–10. [Google Scholar] [CrossRef]
  83. Rafael, S.; Vicente, B.; Rodrigues, V.; Miranda, A.I.; Borrego, C.; Lopes, M. Impacts of green infrastructures on aerodynamic flow and air quality in Porto’s urban area. Atmos. Environ. 2018, 190, 317–330. [Google Scholar] [CrossRef]
  84. Aleksejeva, J.; Voulgaris, G.; Gasparatos, A. Assessing the potential of strategic green roof implementation for green infrastructure: Insights from Sumida ward, Tokyo. Urban For. Urban Green. 2022, 74, 127632. [Google Scholar] [CrossRef]
  85. Francis, L.F.M.; Jensen, M.B. Benefits of green roofs: A systematic review of the evidence for three ecosystem services. Urban For. Urban Green. 2017, 28, 167–176. [Google Scholar] [CrossRef]
  86. Servadio, J.L.; Lawal, A.S.; Davis, T.; Bates, J.; Russell, A.G.; Ramaswami, A.; Convertino, M.; Botchwey, N. Demographic Inequities in Health Outcomes and Air Pollution Exposure in the Atlanta Area and its Relationship to Urban Infrastructure. J. Urban Health 2019, 96, 219–234. [Google Scholar] [CrossRef] [PubMed]
  87. Tieges, Z.; Georgiou, M.; Smith, N.; Morison, G.; Chastin, S. Investigating the association between regeneration of urban blue spaces and risk of incident chronic health conditions stratified by neighbourhood deprivation: A population-based retrospective study, 2000–2018. Int. J. Hyg. Environ. Health 2022, 240, 113923. [Google Scholar] [CrossRef] [PubMed]
  88. Jennings, V.; Gragg, R.S.; Brown, C.P.; Hartel, D.; Kuehler, E.; Sinykin, A.; Johnson, E.; Kondo, M. Structural Characteristics of Tree Cover and the Association with Cardiovascular and Respiratory Health in Tampa, FL. J. Urban Health 2019, 96, 669–681. [Google Scholar] [CrossRef] [PubMed]
  89. Maher, B.A.; Gonet, T.; Karloukovski, V.V.; Wang, H.X.; Bannan, T.J. Protecting playgrounds: Local-scale reduction of airborne particulate matter concentrations through particulate deposition on roadside ‘tredgest’ (green infrastructure). Sci. Rep. 2022, 12, 14236. [Google Scholar] [CrossRef]
  90. Jones, L.; Vieno, M.; Fitch, A.; Carnell, E.; Steadman, C.; Cryle, P.; Holland, M.; Nemitz, E.; Morton, D.; Hall, J.; et al. Urban natural capital accounts: Developing a novel approach to quantify air pollution removal by vegetation. J. Environ. Econ. Policy 2019, 8, 413–428. [Google Scholar] [CrossRef]
  91. Rowe, T.; Poppe, J.; Buyle, M.; Belmans, B.; Audenaert, A. Is the sustainability potential of vertical greening systems deeply rooted? Establishing uniform outlines for environmental impact assessment of VGS. Renew. Sustain. Energy Rev. 2022, 162, 112414. [Google Scholar] [CrossRef]
Figure 1. Locations of settlements with data on (a) PM2.5 and (b) PM10 concentrations, 2010–2019. Source: World Health Organization. (2023). WHO ambient air quality database, 2022 update: status report. World Health Organization. https://iris.who.int/handle/10665/368432, accessed on 1 May 2024. License: CC BY-NC-SA 3.0 IGO.
Sustainability 16 06765 g001
Figure 2. Publications by years in WoS.
Sustainability 16 06765 g002
Figure 3. Visualization of collaborating author’s network.
Sustainability 16 06765 g003
Figure 4. Visualization of journal citation path dual-map.
Sustainability 16 06765 g004
Figure 5. Visualization of keywords network.
Sustainability 16 06765 g005
Figure 6. Top 30 keywords with the strongest citation bursts.
Sustainability 16 06765 g006
Figure 7. Visualization of keyword clusters.
Sustainability 16 06765 g007
Figure 8. Visualization of keywords clusters timeline.
Sustainability 16 06765 g008
Figure 9. Visualization of the literature co-citation network.
Sustainability 16 06765 g009
Figure 10. Visualization of the literature co-citation overlay network (2018–2019 and 2023–2024).
Sustainability 16 06765 g010
Figure 11. Visualization of literature structural variation by Abhijith et al. (2017) [28].
Sustainability 16 06765 g011
Figure 12. Visualization of the literature structural variation by Bottalico et al. (2017) [73].
Sustainability 16 06765 g012
Table 1. Statistical information on the data.
Data SourceInformation
Covered periodFrom January 2014 to May 2024
Countries/regions198
Publications596
Institutions 1716
Number of authors2360
Table 2. Top five most productive countries.
RankCountries/RegionsRecord Count% of 596
1People’s Republic of China12520.97%
2USA11218.79%
3England10417.45%
4Italy6711.24%
5Australia427.04%
Table 3. Top 10 productive institutions.
RankCountries/RegionsRecord Count% of 596
1University of Surrey 345.70%
2Chinese Academy of Sciences 172.85%
3Trinity College Dublin 152.51%
4Consiglio Nazionale Delle Ricerche CNR132.18%
5Sapienza University Rome 132.18%
6Shanghai Jiao Tong University 122.01%
7Imperial College London 101.68%
8University of Salento 101.68%
9Arizona State University 91.51%
10Arizona State University Tempe91.51%
Table 4. Top 10 distribution of disciplines in the field.
RankSubject AreasRecord CountPercentage
1Environmental sciences ecology43072.15%
2Science technology other topics11519.30%
3Forestry7212.08%
4Urban studies7111.91%
5Plant sciences569.40%
6Engineering528.73%
7Construction building technology518.56%
8Meteorology atmospheric sciences508.39%
9Public environmental occupational health406.71%
10Energy fuels335.54%
Table 5. Top three of the most productive authors.
RankAuthorRecord Count% of 596
1Kumar, P325.369%
2Manes, F101.678
3Anderson, V91.510
=3Buccolieri, R91.510
Table 6. Top five of the most-cited publications in WOS.
RankPublication TitleAuthors and YearsResearch FocusAverage
per Year
Total
1Air pollution abatement performances of green infrastructure in open road and built-up street canyon environments—A reviewAbhijith (2017) [28]Atmospheric Environment65.63525
2Spatial planning for multifunctional green infrastructure: Growing resilience in DetroitMeerow (2017) [29]Landscape And Urban Planning61.38491
3Health and climate-related ecosystem services provided by street trees in the urban environmentSalmond (2016) [30]Environmental Health33.89305
4Social–ecological and technological factors moderate the value of urban natureKeeler (2019) [31]Nature Sustainability45.33272
5Analyzing the ENVI-met microclimate model’s performance and assessing cool materials and urban vegetation applications-A reviewTsoka (2018) [32]Sustainable Cities and Society37.71264
Table 7. Top five keyword centrality.
RankKeywordFrequencyCentrality
1Physical activity240.15
2Climate change660.12
3Quality870.10
=3Space320.10
=3Emissions170.10
4Vegetation1020.09
=4Urban400.09
=4Urban planning320.09
5Urban heat island310.08
Table 8. Top 10 keyword clusters.
RankCodeCluster NameSizeAverage Year
10Grean space682017
21Roadside vegetation barrier482016
32Quantitative assessment482016
43Greenness urbanicity402016
54Sustainable cities 362017
65Human health332016
76Urban green infrastructure282015
87Near-road air quality262016
98Urban ecosystem service252015
109Effect modification242016
Table 9. Top five integrated high-impact and high-potential pieces of literature.
ΔMΔCLΔCAuthorLiteratureYear
97.90150.270.52Abhijith [28]Air pollution abatement performances of green infrastructure in open road and built-up street canyon environments—A review2017
96.78280.34Bottalico [73]A spatially explicit method to assess the dry deposition of air pollution by urban forests in the city of Florence, Italy2017
96.61−17.850.26Fusaro [74]Mapping and Assessment of PM10 and O3 Removal by Woody Vegetation at Urban and Regional Level2017
98.47−50.330.21Santos [75]The role of forest in mitigating the impact of atmospheric dust pollution in a mixed landscape2017
93.93−44.600.13Ghasemian [76]The influence of roadside solid and vegetation barriers on near-road air quality2017
96.20−75.160.10Capotorti [77]Combining the Conservation of Biodiversity with the Provision of Ecosystem Services in Urban Green Infrastructure Planning: Critical Features Arising from a Case Study in the Metropolitan Area of Rome2017
88.9231.870.08Buccolieri [78]Review on urban tree modeling in CFD simulations: Aerodynamic, deposition and thermal effects2019
96.58−82.810.05Jayasooriya [79]Green infrastructure practices for improvement of urban air quality2017
80.15−59.430.01Santiago [80]CFD modeling of vegetation barrier effects on the reduction of traffic-related pollutant concentration in an avenue of Pamplona, Spain2019
81.73−94.850.01Mori [81]Air pollution deposition on a roadside vegetation barrier in a Mediterranean environment: Combined effect of evergreen shrub species and planting density2018
This table’s rank is via the value of ΔC. Display first author only.
Disclaimer/Publisher’s Note: The statements, opinions and data contained in all publications are solely those of the individual author(s) and contributor(s) and not of MDPI and/or the editor(s). MDPI and/or the editor(s) disclaim responsibility for any injury to people or property resulting from any ideas, methods, instructions or products referred to in the content.

