1. Introduction
The adoption of Council Directive 1999/31/EC of 26 April 1999 on the landfill of waste [
1] marked a turning point in waste management strategies across Europe. The Directive’s primary objective is to prevent or minimize environmental impacts, particularly those affecting surface and groundwater, soil, air, and human health, arising from waste disposal practices. This legislation mandated EU member states to establish national strategies for reducing the quantity of biodegradable waste deposited in landfills.
The objectives of the Landfill Directive have been further reinforced by the adoption of the European Parliament and Council Directive (EU) 2018/850 of 30 May 2018 [
2], which requires member states to implement measures ensuring that by 2035, the amount of municipal solid waste (MSW) landfilled can be reduced to no more than 10% of the total (by weight) of MSW generated. This aims to facilitate the transition of EU member states toward a circular economy and align with the requirements of Directive 2008/98/EC of the European Parliament and of the Council [
3].
Another key obligation imposed by these directives is the requirement to subject waste destined for landfills to pre-treatment before disposal. To achieve these objectives, most EU member states have adopted mechanical–biological treatment (MBT) technology for MSW. This treatment combines sorting and recovering recyclable materials (metals, paper, plastics, glass) with biological stages that reduce and stabilize biodegradable matter under controlled anaerobic and/or aerobic conditions [
4,
5].
Between 1990 and 2010, approximately 180 MBT plants were installed in Europe [
6], and by the end of 2016, there were approximately 570 MBT plants in operation, with a capacity of 55 million metric tons [
7]. In Spain, the MBT waste treatment capacity increased by 5 million tons with the installation of 50 new MBT plants [
8]. Thus, the number and capacity of plants in Europe have increased significantly over the past two decades, driven by the legal obligation to limit the disposal of biodegradable organic matter in landfills and to increase waste recycling and energy recovery [
9,
10,
11,
12,
13].
In many European countries, recyclable materials remain present in significant quantities within MSW streams, either due to inadequate or nonexistent separate collection systems. Most MBT plants recover metal fractions and other recyclable materials, such as plastics (typically HDPE, LDPE, and PET), beverage containers, paper, and cardboard [
14]. The majority of studies that analyze the economic data, in terms of the importance of costs and benefits related to the recovery of recyclable materials in MBT plants, focus on life cycle analyses [
6,
8,
15] and greenhouse gas emission savings [
5,
16,
17].
However, recyclable materials, particularly plastics and metals, recovered in MBT plants exhibit quality comparable to that of materials originating from separate collections, enabling their commercialization in secondary material markets for recycling [
14]. The amount of potentially recyclable materials recovered in MBT plants is highly dependent on their content in the incoming MSW, with recovery percentages ranging from 5% to 31% [
5,
7,
10,
18]. The revenue generated from the sale of these recovered materials can significantly impact the economic analysis of MBT plants. However, there is a paucity of studies in the scientific literature addressing this aspect, with limited references providing information on the selling prices of these recovered materials [
19,
20].
The objective of this study is to conduct an analysis of the selling prices of the various byproducts obtained from mechanical–biological treatment plants for municipal solid waste. The analysis was carried out based on data corresponding to the treatment plants that serve the metropolitan area of Valencia (Spain), as described below. This research on pricing recycled materials from MBT plants, though focused on a specific case study, offers valuable insights for the waste management community. It sheds light on the complexities of pricing these materials, a crucial factor for a global circular economy. By understanding how various factors influence prices, stakeholders worldwide can develop better strategies for recycling and byproduct utilization. The research also informs policy decisions on a global scale and offers valuable data collection and pricing model approaches for waste management efforts.
2. Materials and Methods
2.1. Description of the Solid Waste Management System in the Valencia Metropolitan Area
The Metropolitan Waste Management Entity (EMTRE) is a local public utility established by the Valencian government through Law 2/2001, of 11 May 2001, on the creation and management of metropolitan areas in the Valencian Community [
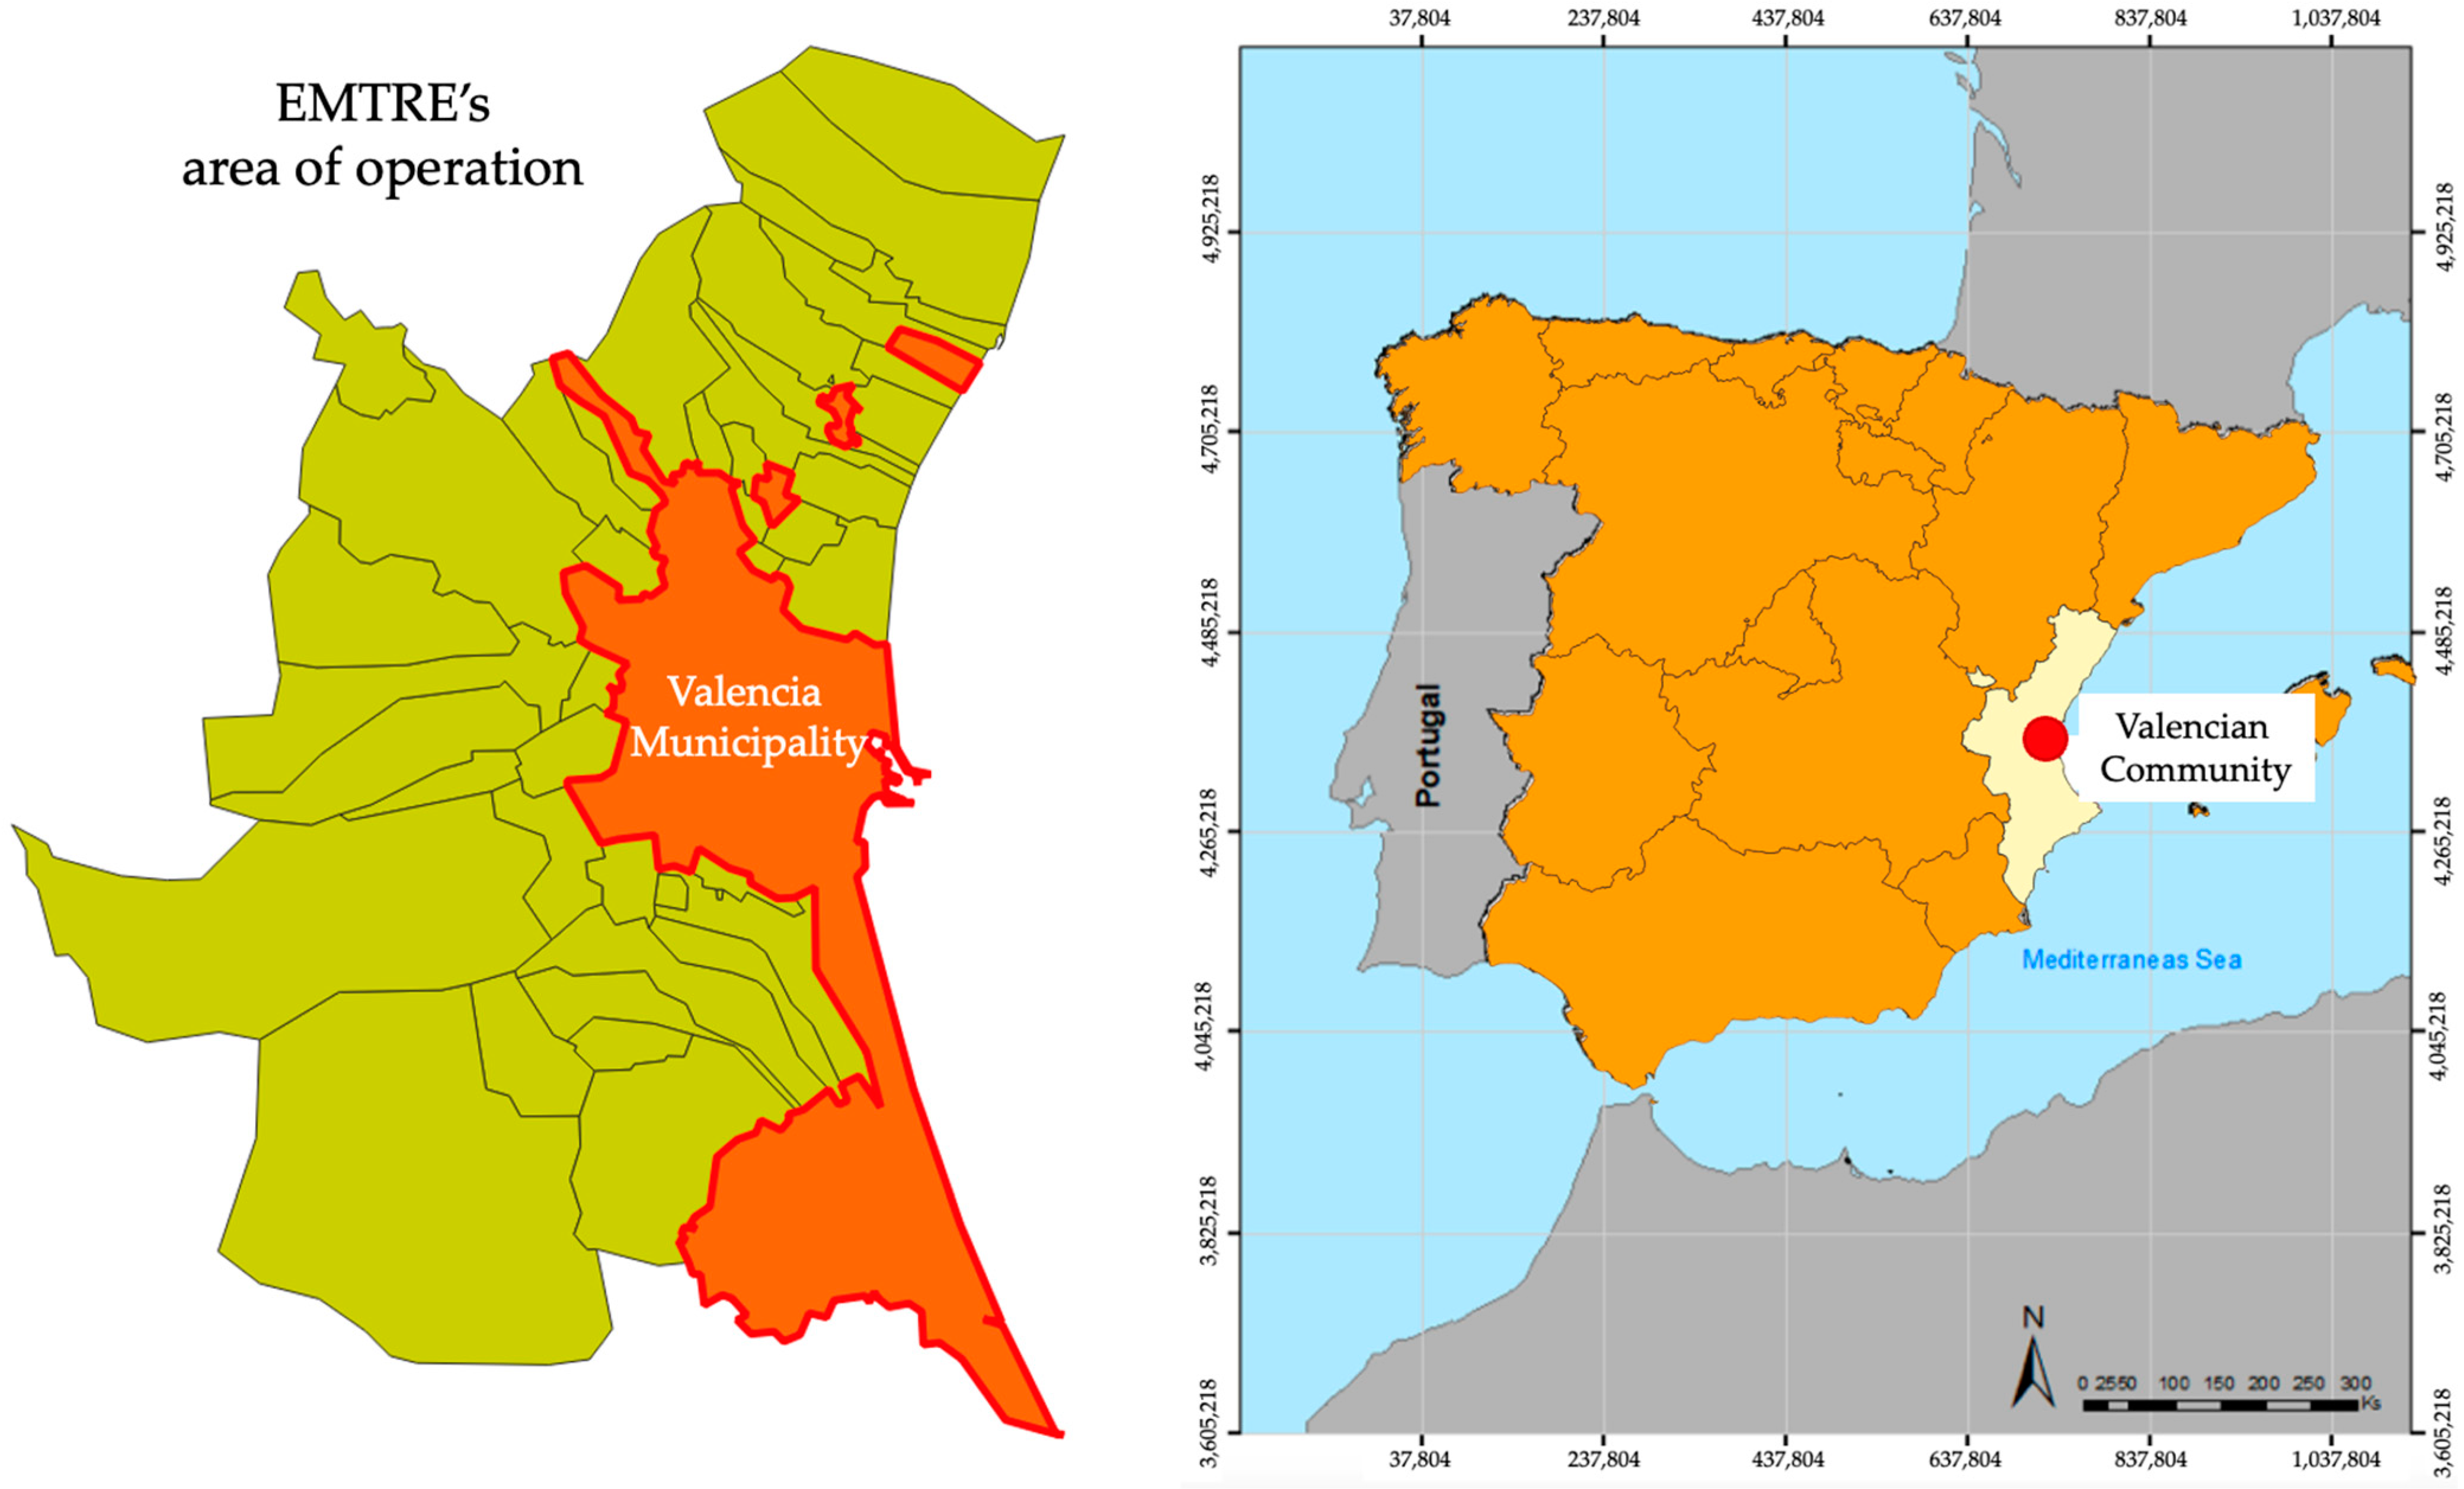
21]. Created with the specific purpose of overseeing waste management in the Valencia Metropolitan Area, EMTRE serves a population of roughly 1.6 million residents across 27 municipalities. Their core mission aligns with the objectives set by the Valencian Regional Government, focusing on environmentally responsible treatment and disposal of municipal waste in accordance with sectoral regulations and planning instruments.
EMTRE’s area of operation encompasses a significant portion of the Valencia region, including the following municipalities: Alaquàs, Albal, Albalat dels Sorells, Alboraya, Albuixech, Alcàsser, Aldaia, Alfafar, Alfara del Patriarca, Almàssera, Benetússer, Beniparrell, Bonrepòs i Mirambell, Burjassot, Catarroja, Emperador, Foios, Godella, LLocnou de la Corona, Manises, Massalfassar, Massamagrell, Massanassa, Meliana, Mislata, Moncada, Museros, Paiporta, Paterna, Picanya, Picassent, la Pobla de Farnals, Puçol, Puig de Santa María, Quart de Poblet, Rafelbuñol, Rocafort, San Antonio de Benagéber, Sedaví, Silla, Tavernes Blanques, Torrent, València, Vinalesa, and Xirivella.
Figure 1 shows the locations of the municipalities whose solid wastes are managed by EMTRE.
EMTRE tackles the complex task of waste management for the Valencia Metropolitan Area. This includes collecting and processing waste from various sources, like the designated bins for mixed waste (gray) and organic waste (brown). EMTRE operates two mechanical–biological treatment and recovery plants (MBT) in Quart de Poblet and Manises to efficiently handle this waste. Their work goes beyond just household waste. They also manage the waste deposited in the network of eco-parks, including agricultural waste, commercial waste, and industrial waste that is similar to household waste.
The financial resources required to support their public service activities come primarily from the Tamer tax. This mandatory tax applies to both households and businesses within the operational area. The revenue generated from the Tamer tax plays a crucial role in supporting the operations of the two MBT plants and the Dos Aguas landfill. Located approximately 65 km from the MBT plants, the Dos Aguas landfill serves as the final destination for waste that cannot be processed or recycled at the MBT facilities.
EMTRE’s MBT plants utilize sophisticated sorting technologies to automatically classify incoming MSW. This automated classification separates the waste stream into various components, such as recyclable materials, organic waste, and inert materials. By precisely distinguishing between these fractions, MBT plants ensure each component receives the most appropriate treatment and maximizes the potential for resource recovery. These MBT plants prioritize maximizing the recovery of subproducts from the waste stream. These subproducts can include materials like plastics, metals, glass, and paper. Once extracted, these materials can be recycled and reintroduced into the manufacturing process.
The recovery of recyclable subproducts and their subsequent sale generates significant revenue for EMTRE, effectively alleviating their operational costs. This strategy plays a crucial role in the financial sustainability of EMTRE’s waste management operations.
However, the prices of byproducts fluctuate over time. Additionally, the contractual conditions established between EMTRE and the companies that operate its MBT plants under an administrative concession regime (usually for a period of 20 years) require to define the market prices for each byproduct at the beginning of the concession in 2010. The determination of these prices must be carried out based on a market price analysis that reflects, with the greatest possible precision, the real prices in 2010, when the plants were not yet in operation.
As a methodology for establishing the market prices of byproducts in 2010, the prices available from auctions held in 2012 in other MBT plants from Spain and the Valencia Region were collected. To obtain the market price values in 2010 from the prices in 2012, it was necessary to deflate the values obtained using the Consumer Price Index in Spain in the period 2010–2012, which was 9.6% according to the National Institute of Statistics of Spain. In this way, the prices that should actually be used as a reference to define the economic amounts that the concessionaire companies should actually receive according to the conditions defined in their corresponding contract with EMTRE were determined.
2.2. Relation between the Gross Domestic Product and Waste Generation
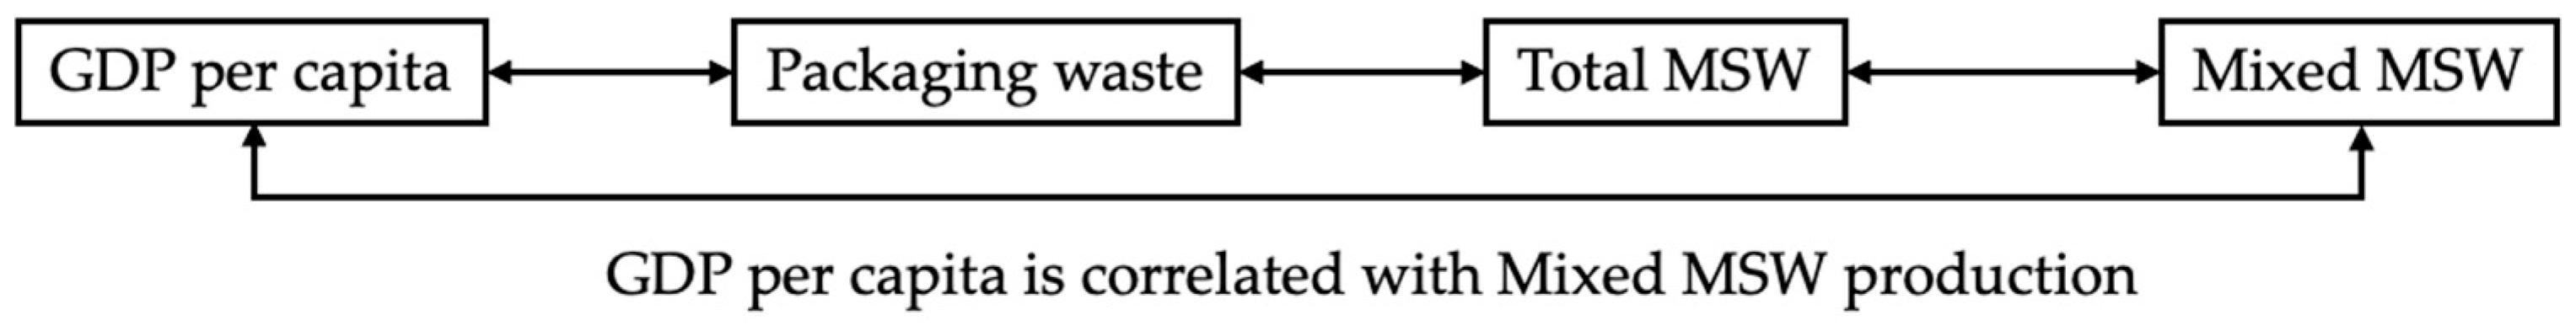
A well-documented effect in the specific scientific literature on waste is the relationship between waste production and the evolution of global economic indicators. This effect highlights the direct correlation between waste production and the gross domestic product (GDP) of a country or region. An increase in GDP corresponds to a higher rate of waste production. In other words, if GDP rises, the rate of waste production will also increase, although not necessarily at the same pace. This effect has been described by numerous researchers and has been evidenced in specialized publications on waste management. The generation of solid waste increases with population growth, but it is also statistically correlated with socioeconomic variables that indicate the general level of growth [
22]. Solid waste generation can be estimated based on a country’s gross domestic product (GDP) [
23]. According to [
24], the per capita GDP of European Union countries in 1995 was linearly correlated with per capita municipal waste generation. Economic development is highly correlated with municipal solid waste generation, meaning that higher rates of economic growth will lead to higher rates of per capita waste production [
25]. In fact, both GDP and municipal waste production grew by 19% between 1995 and 2003 in the whole European Union [
26]. Refs. [
27,
28] also observed that the growth in per capita waste production is directly proportional to per capita GDP.
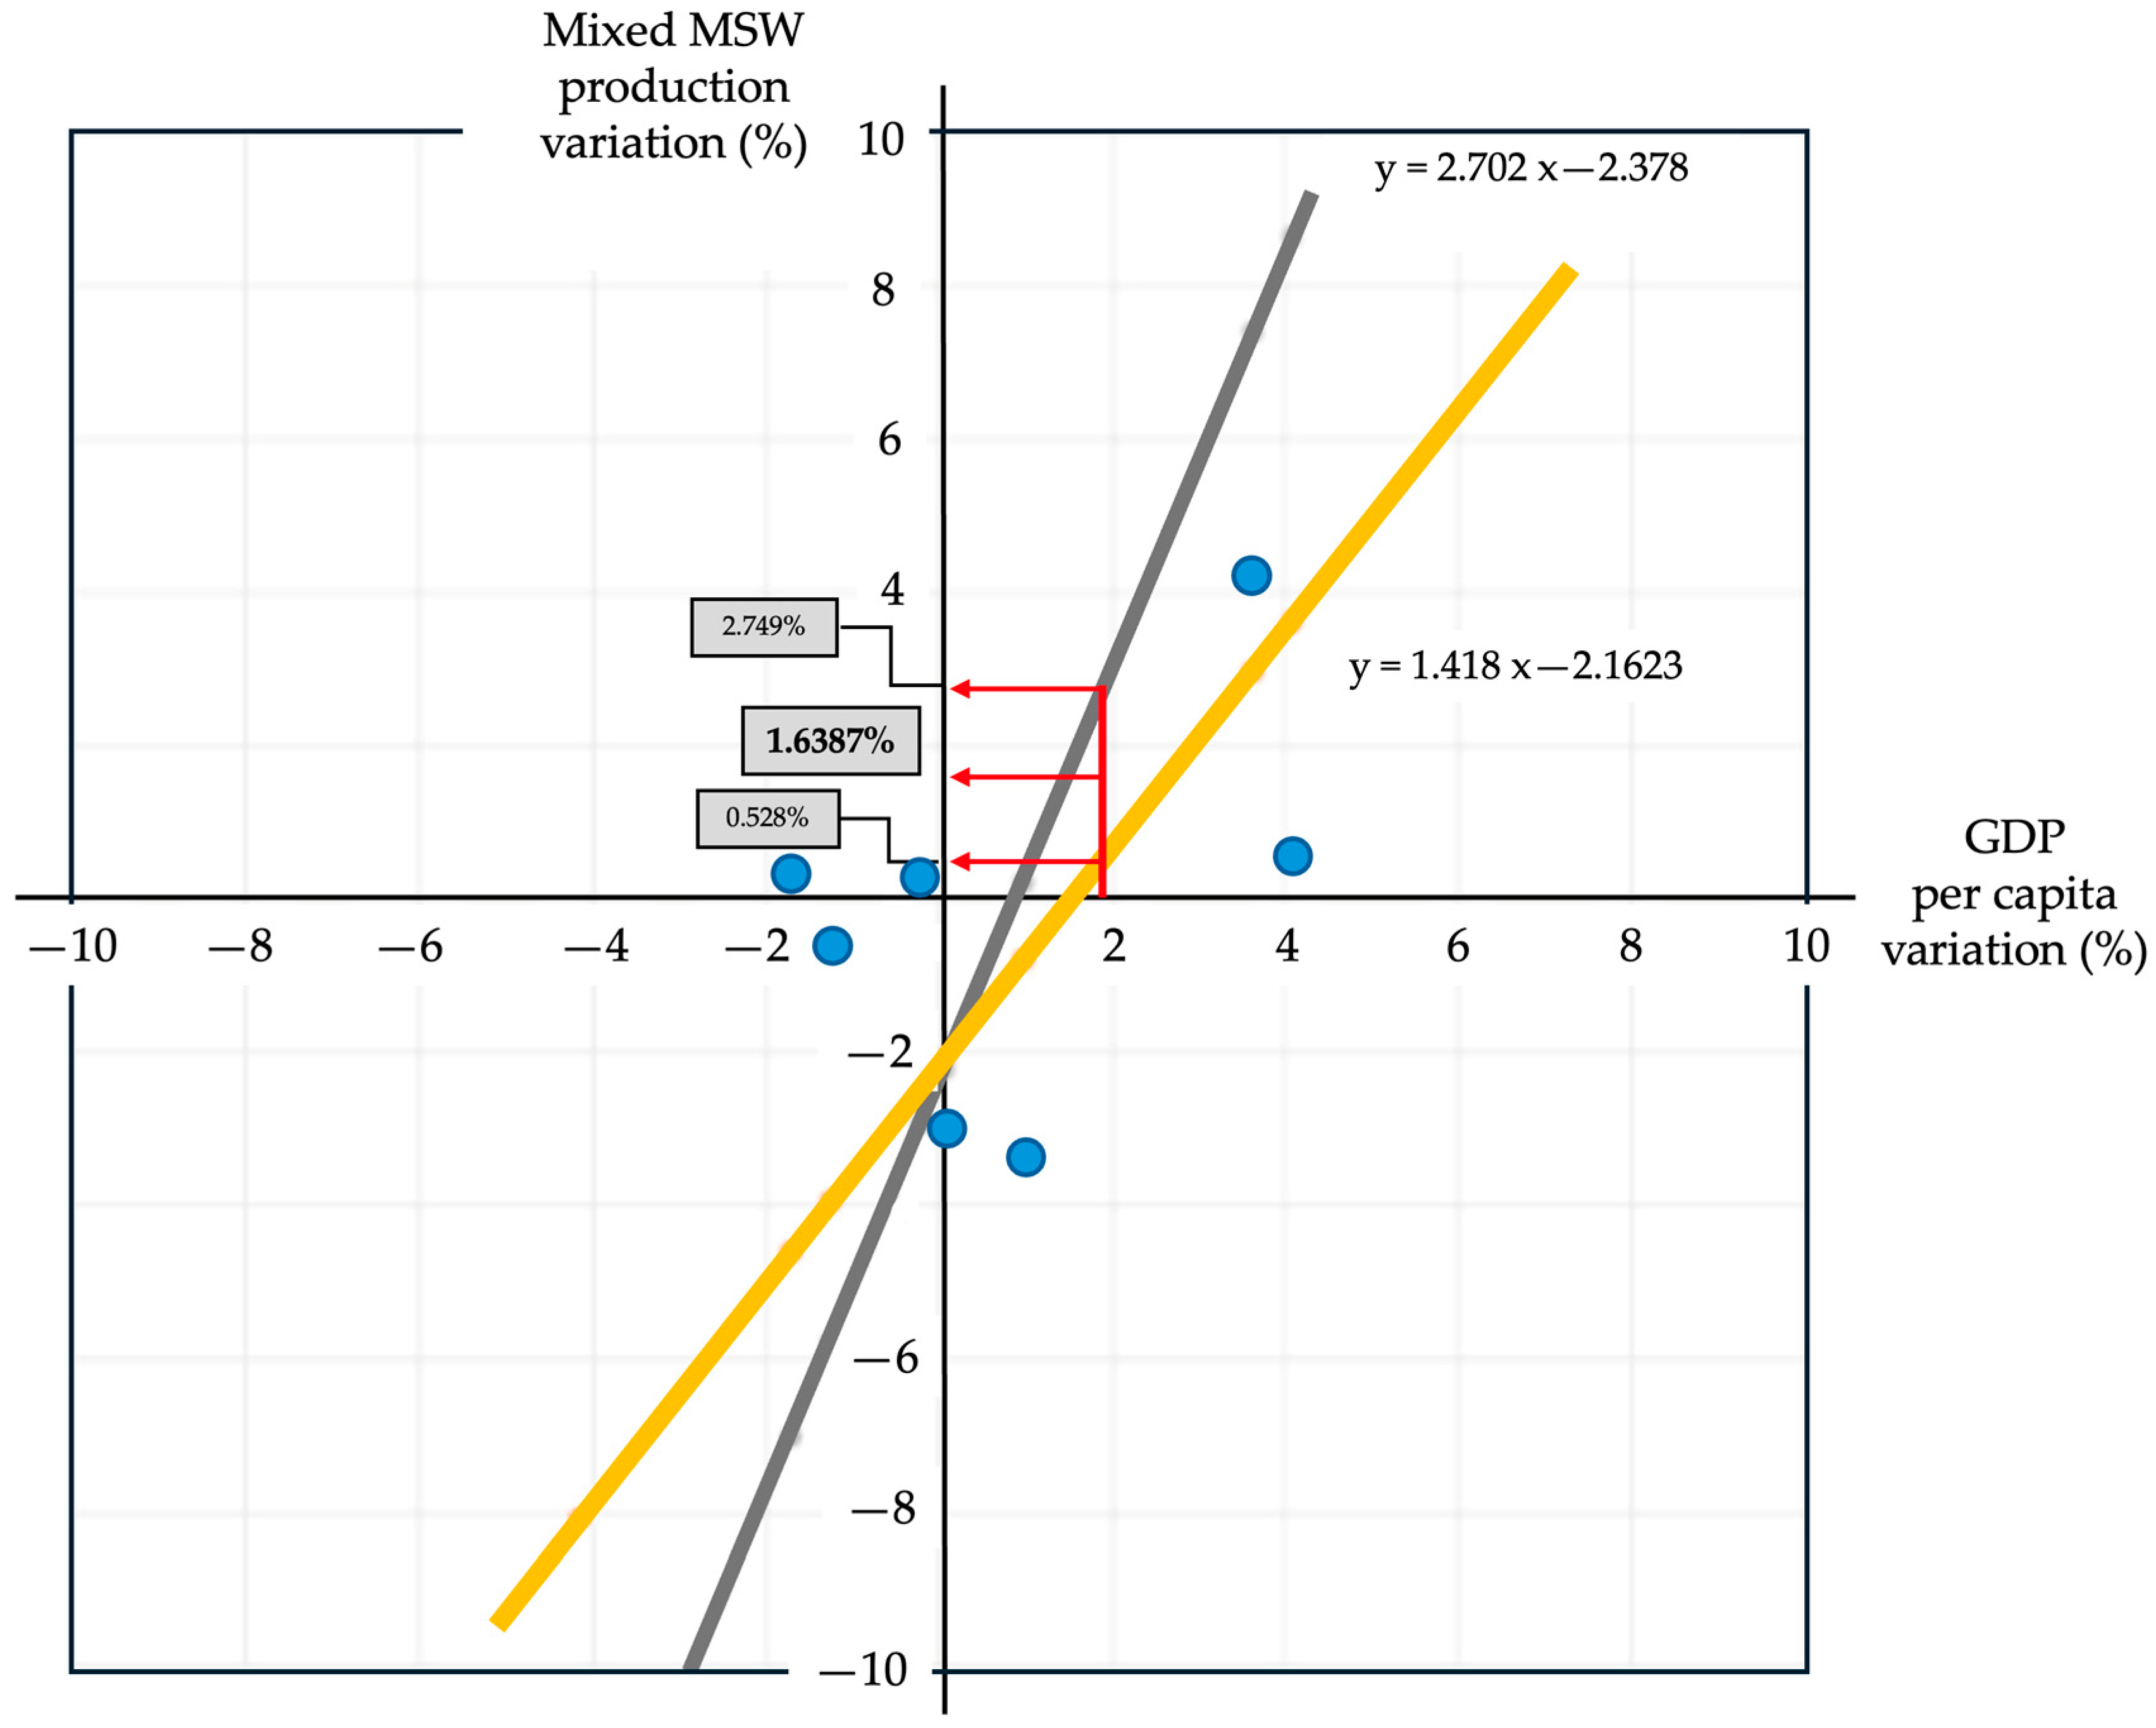
To accurately forecast waste production in a specific region, it is crucial to analyze the established correlation between economic growth and waste generation. Fortunately, numerous official environmental organizations publish statistics that shed light on this connection.
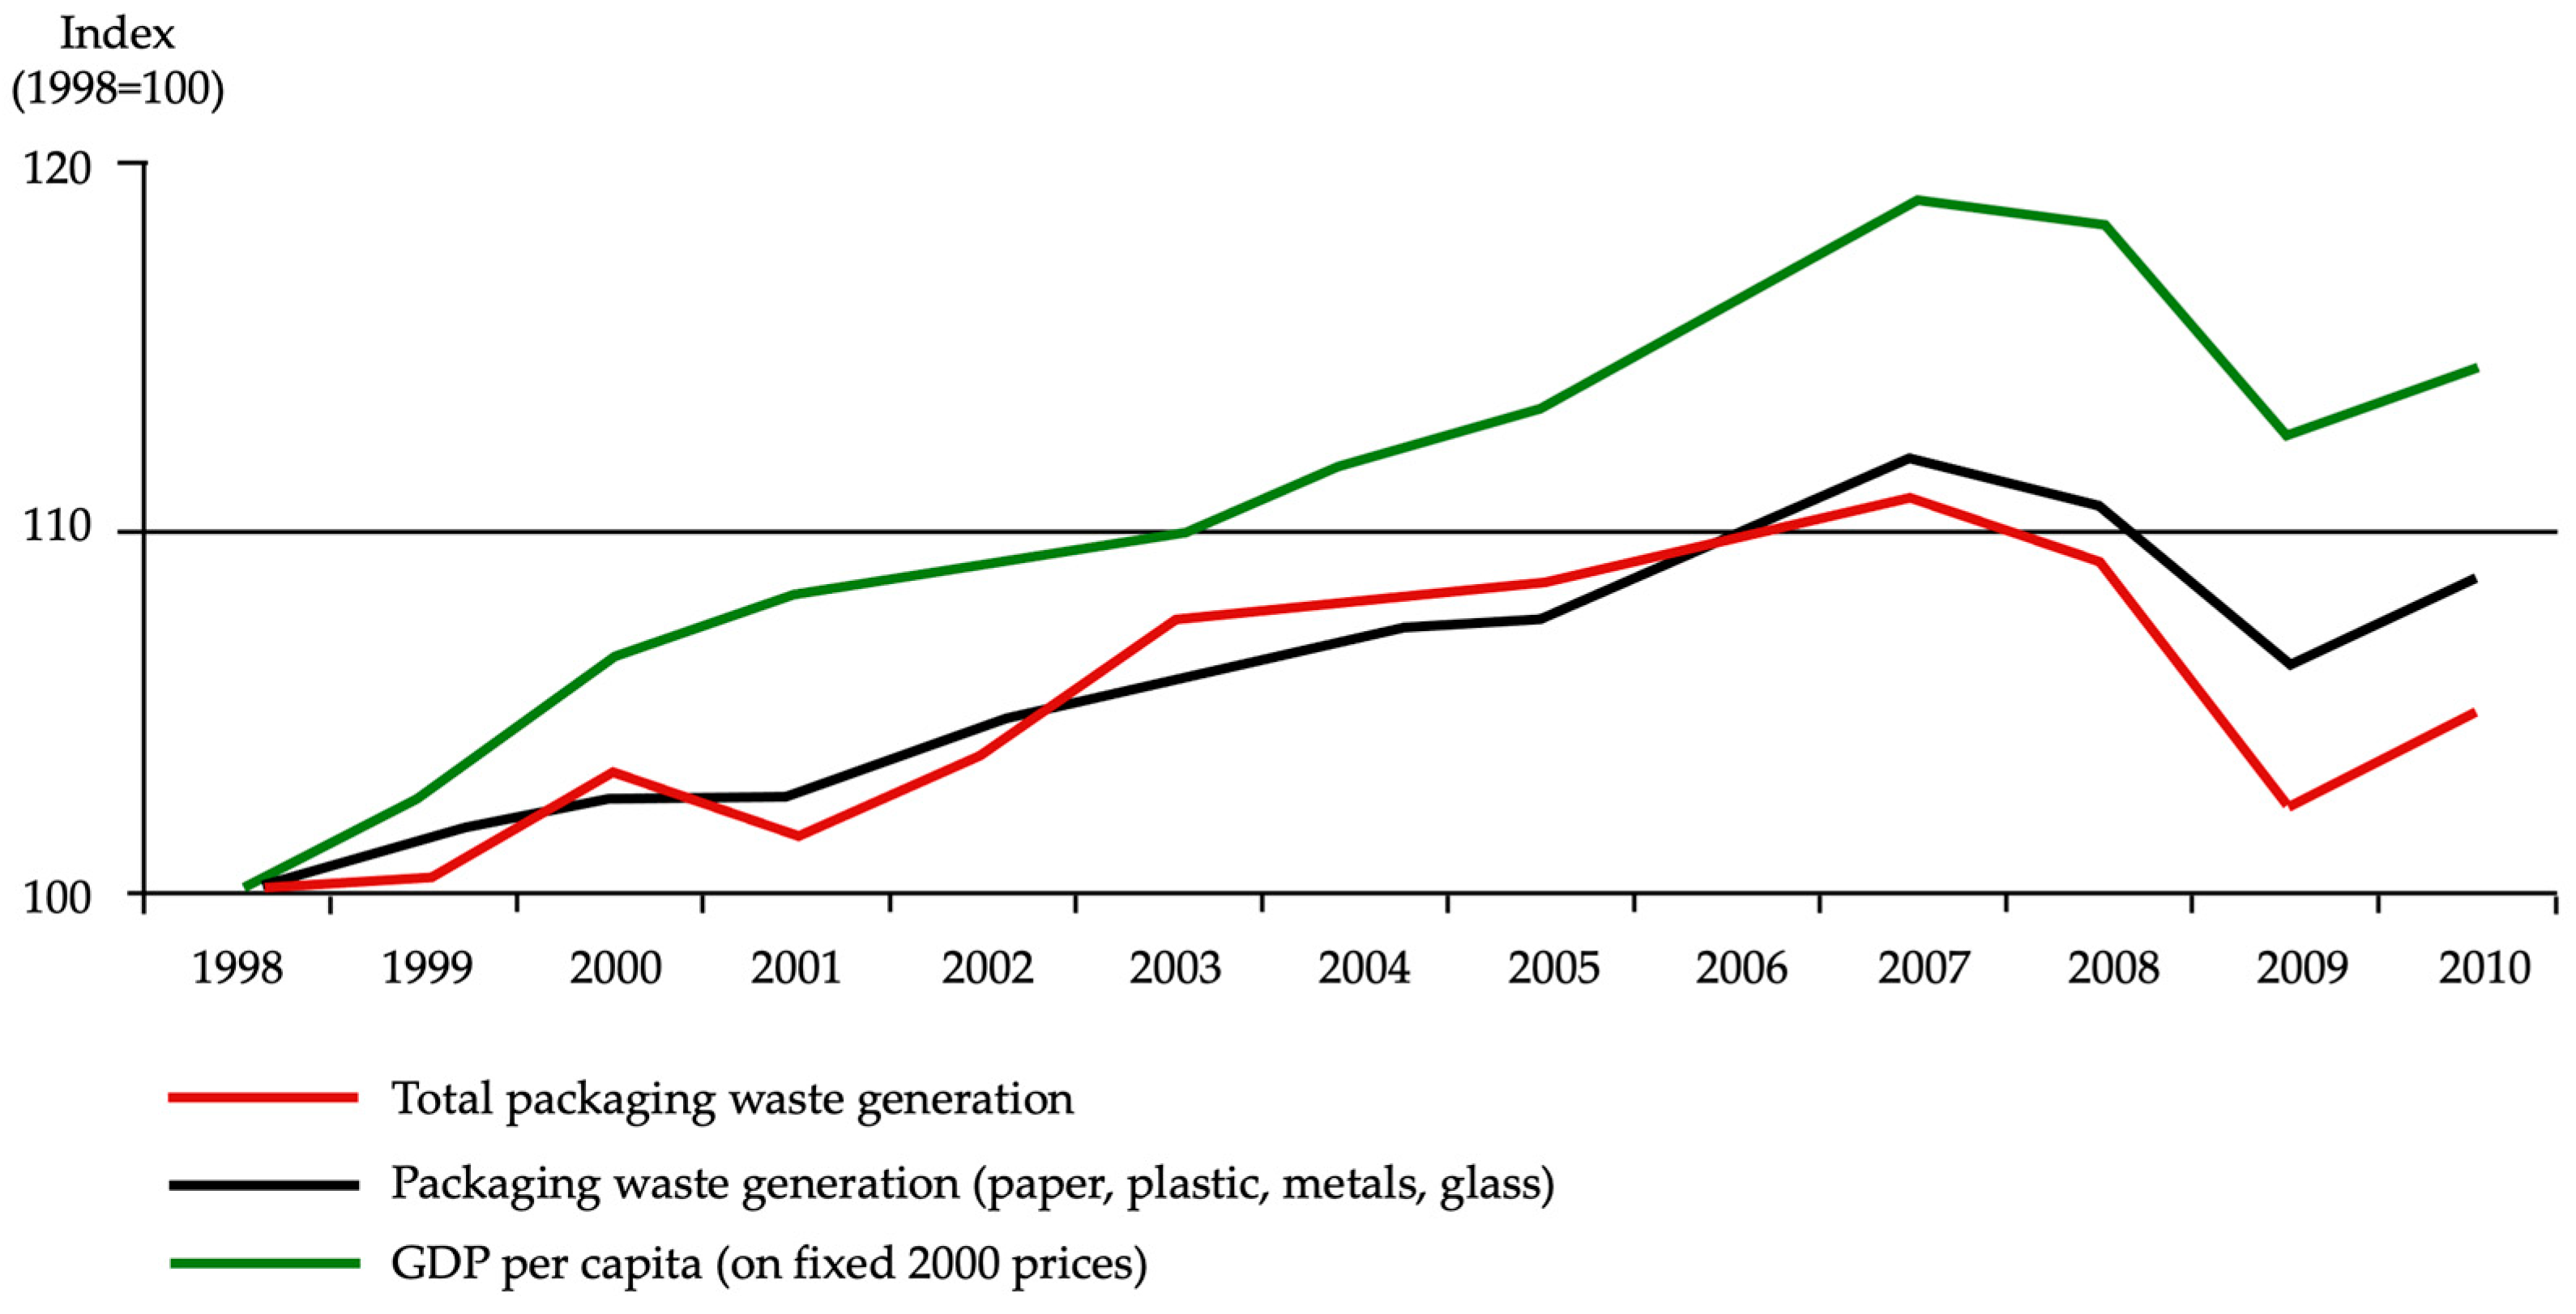
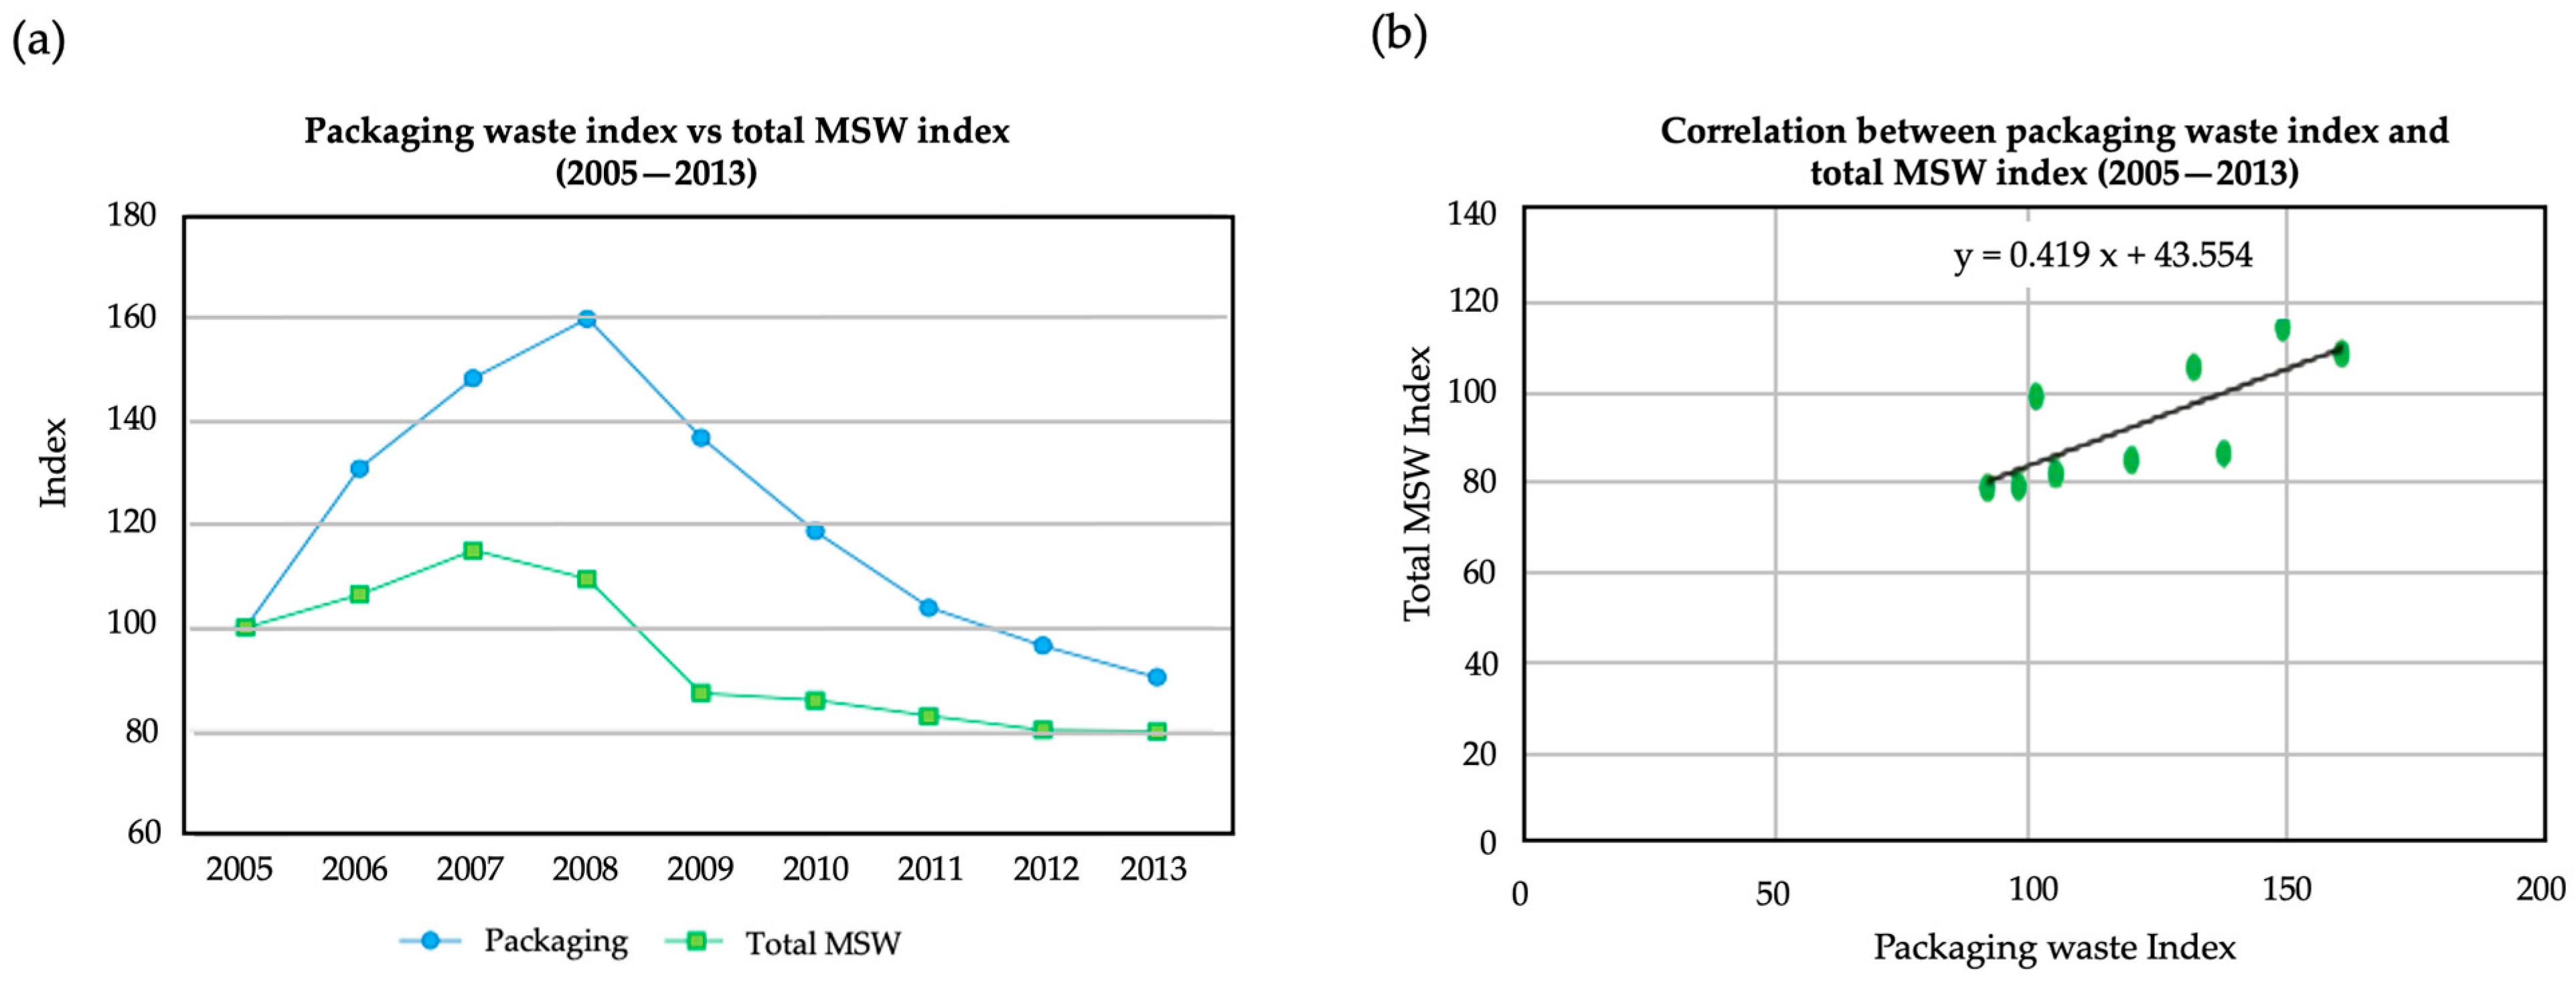
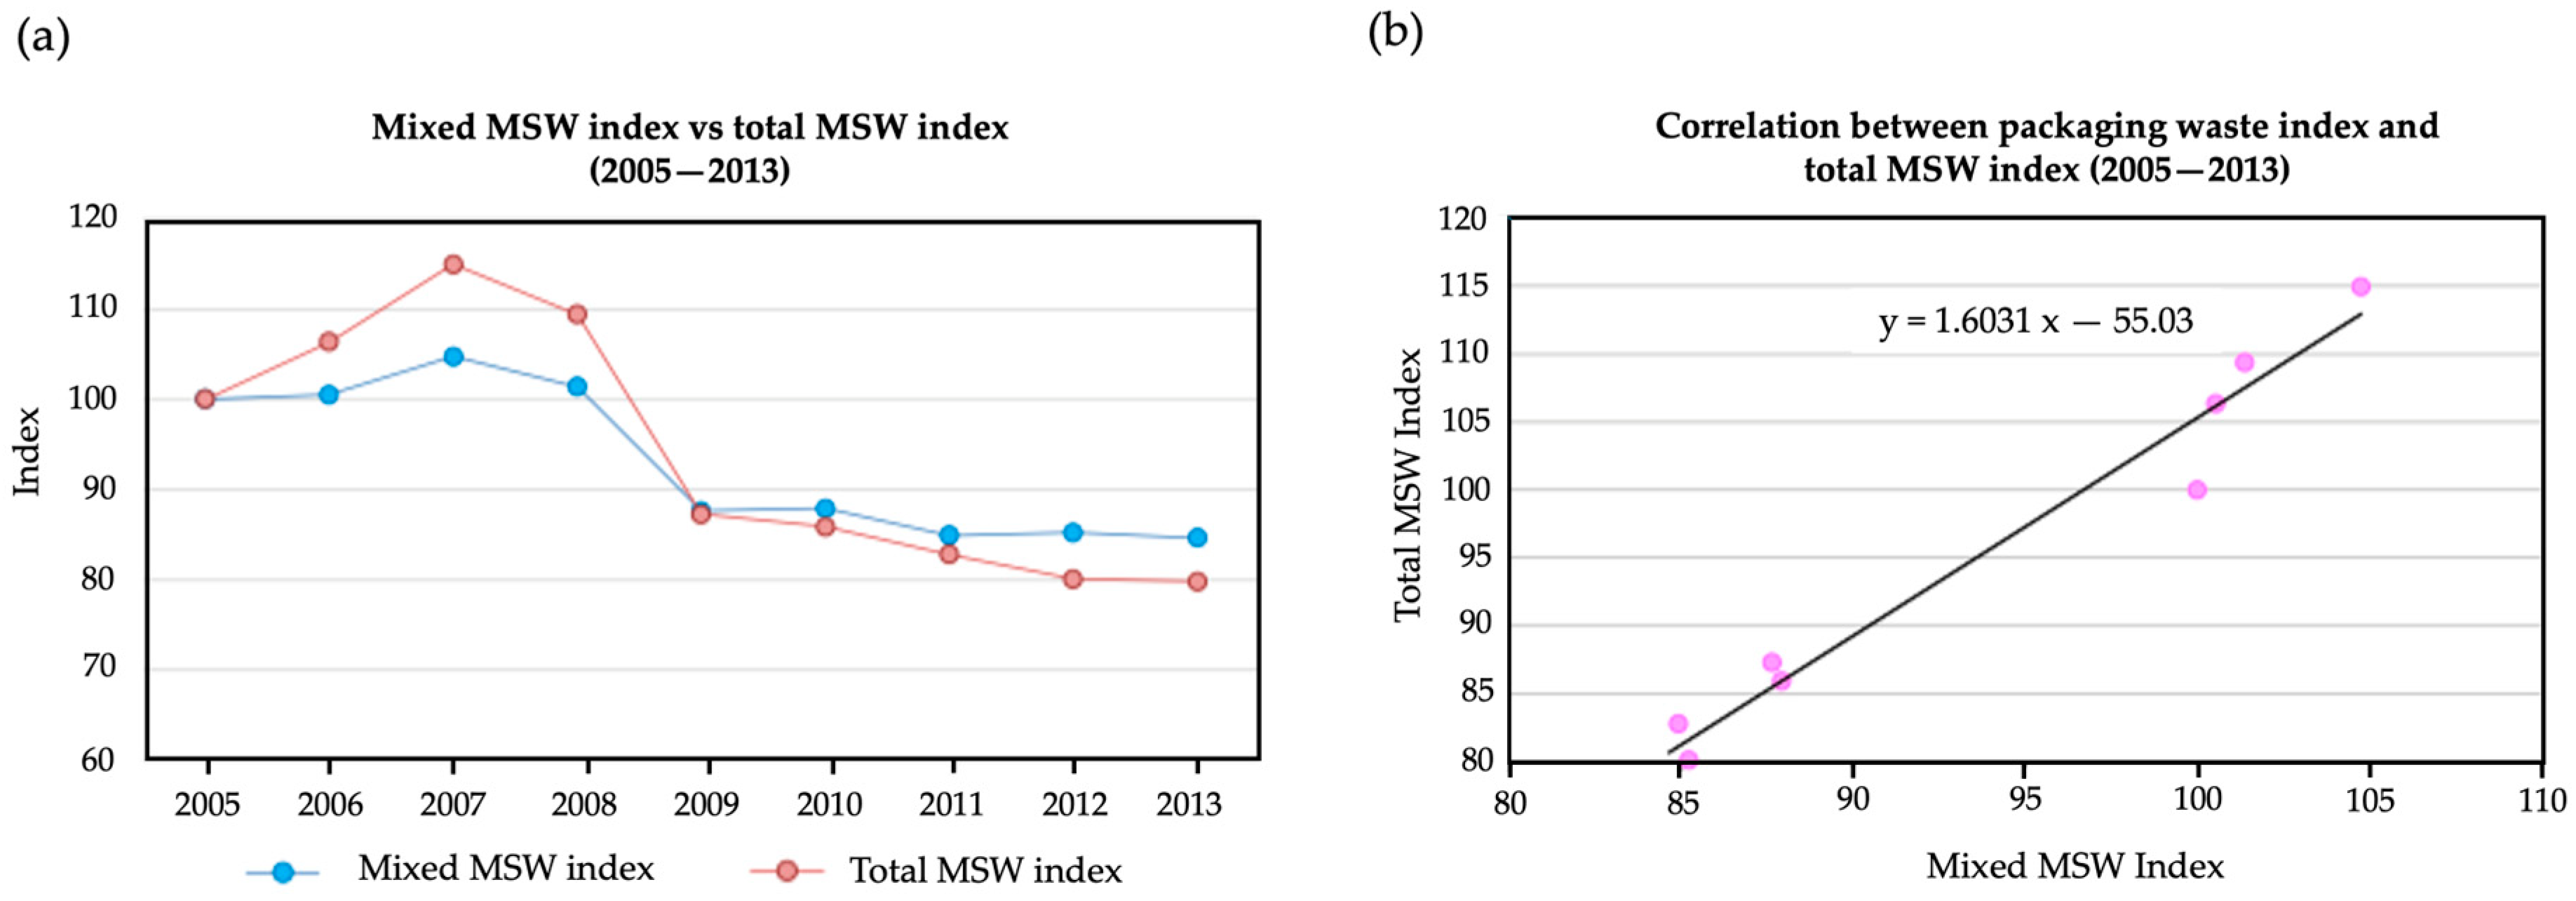
Figure 2 serves as an illustration of this relationship. It depicts the evolution of packaging waste production plotted against the average gross domestic product (GDP) per person (per capita) for the European Union with 15 members (EU15). As the graph reveals, there is a striking parallel between the rise and fall trends in both indicators. When the average GDP per person in the EU15 increases, the amount of packaging waste produced per person also rises, and vice versa. This strong correlation suggests that economic prosperity can be a significant driver of waste generation.
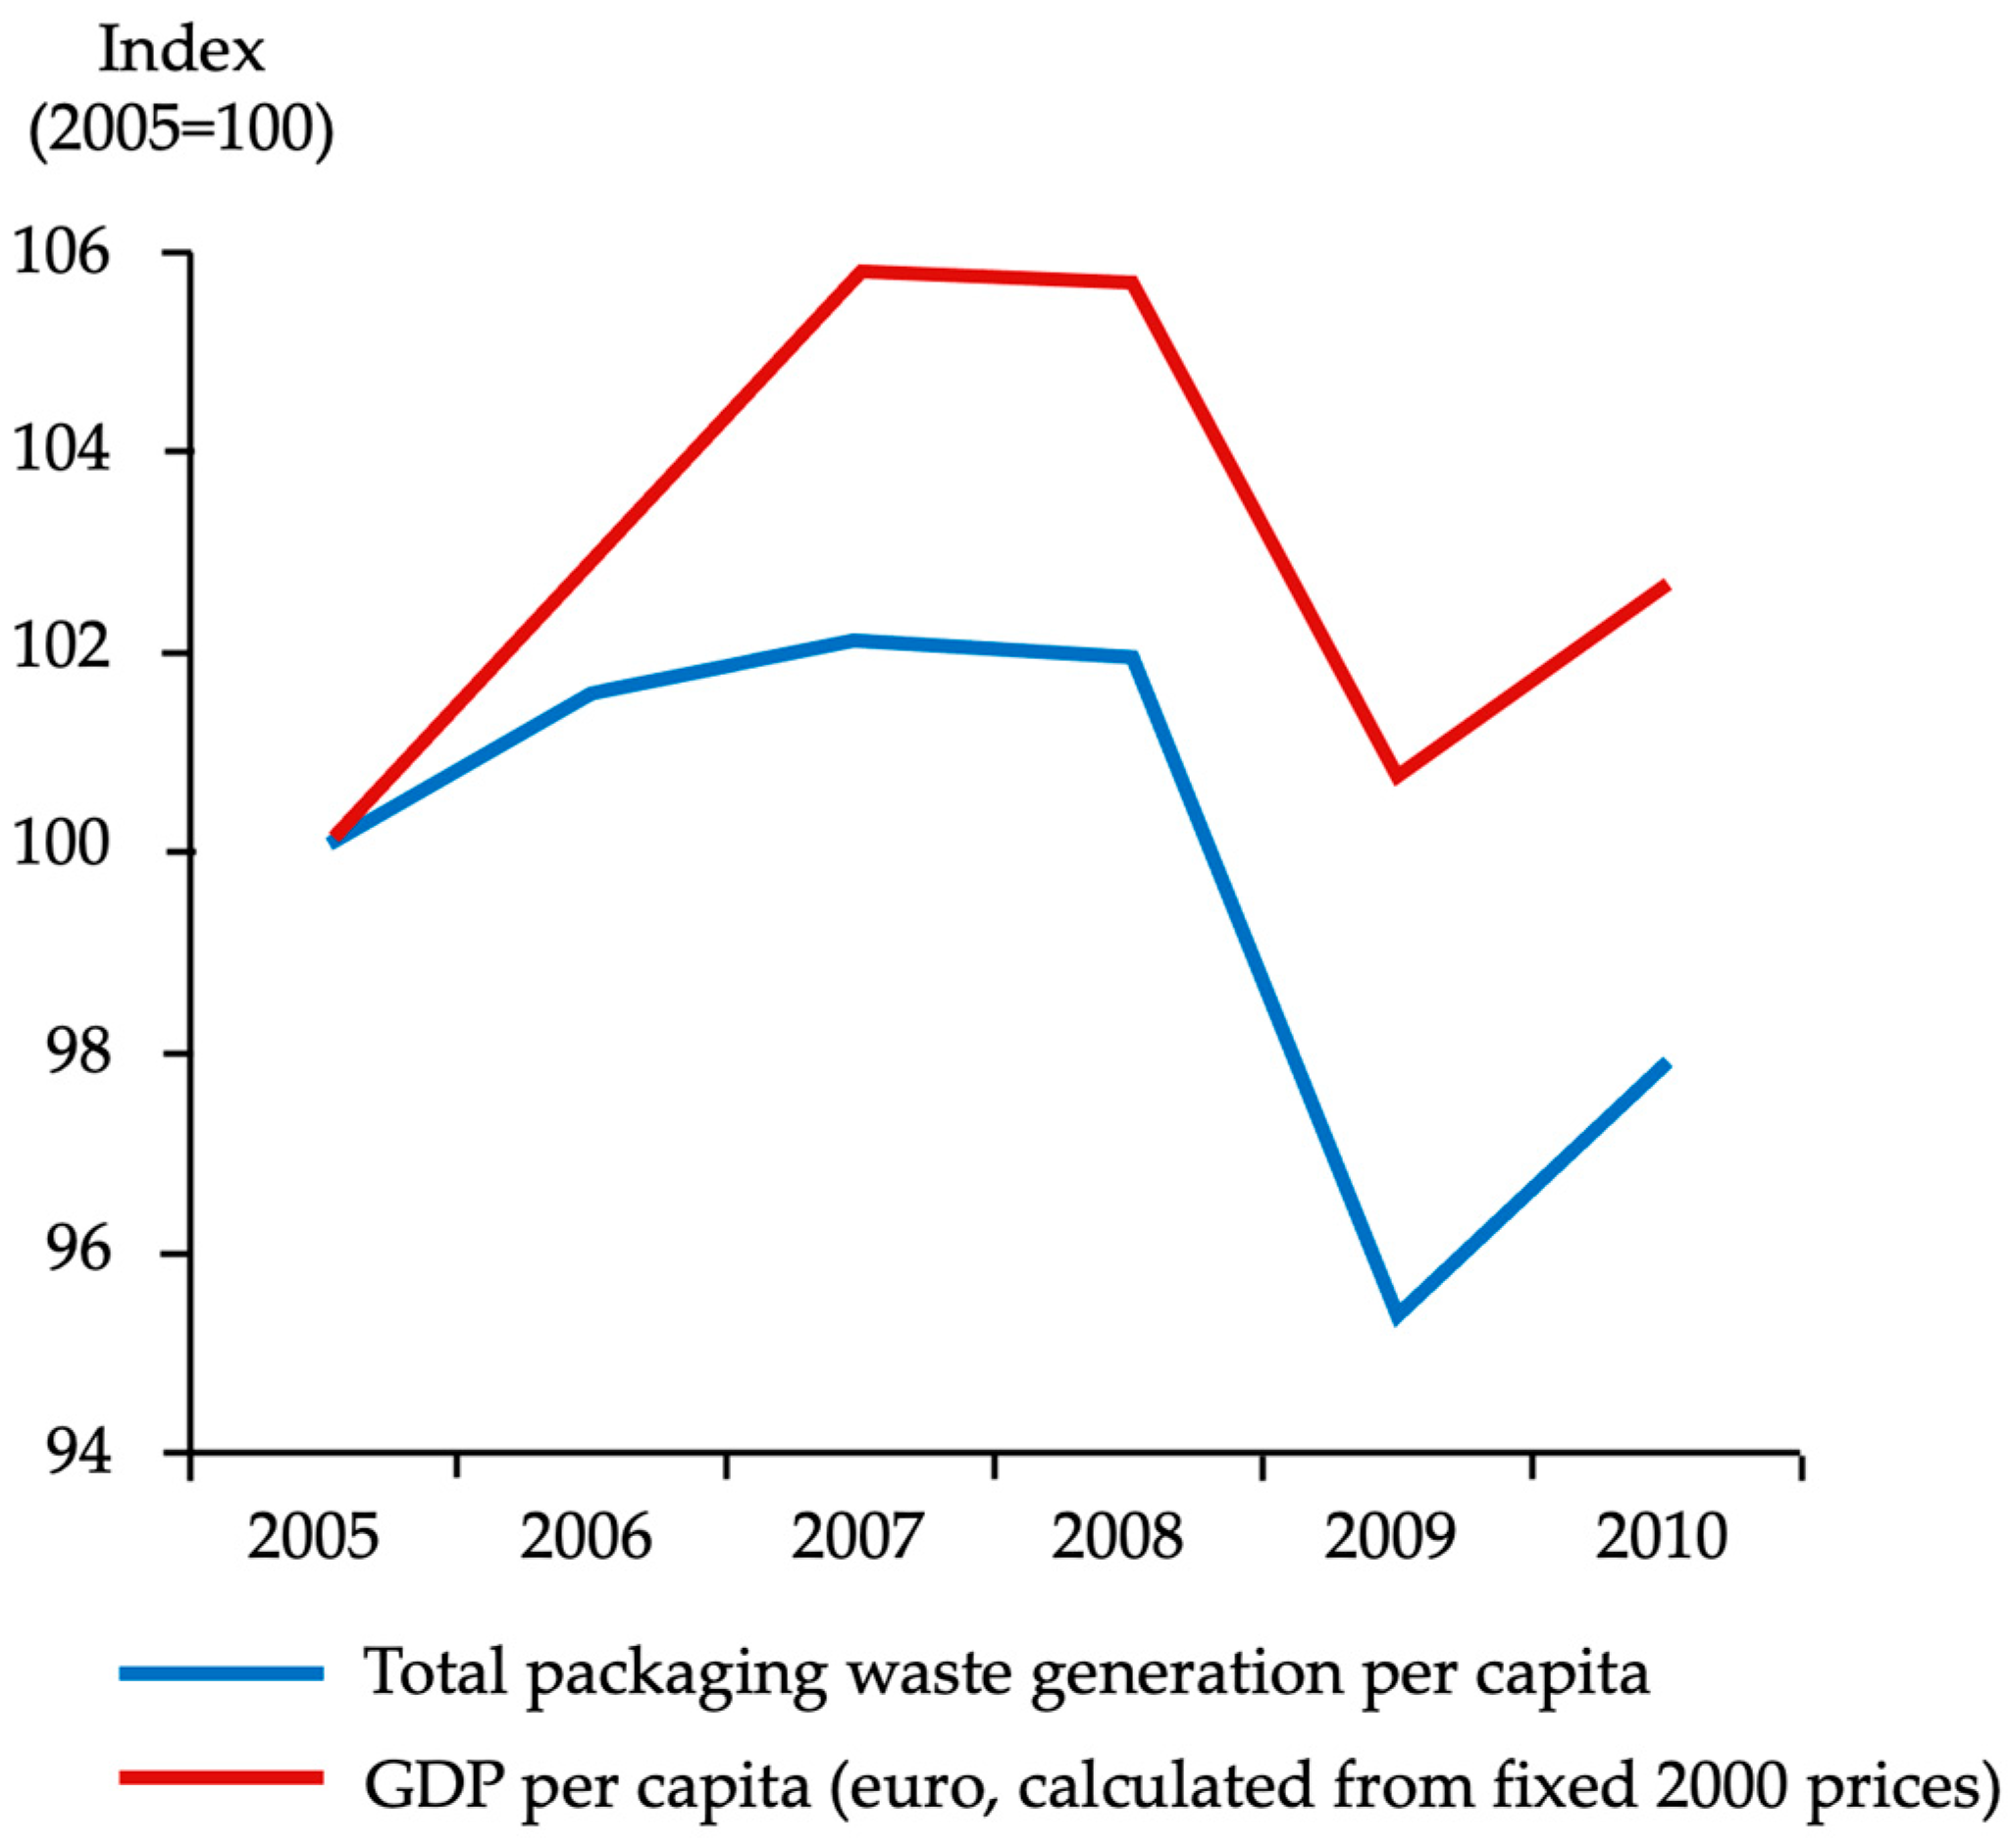
Figure 3 reinforces the connection between economic development and packaging waste generation but on an individual level. This time, the graph plots the average gross domestic product (GDP) per person (per capita) for the 27 member states of the European Union (EU27) against the per capita packaging waste production. Similar to the previous figure, a striking correlation emerges: the trends in both lines closely mirror each other. As the average GDP per person in the EU27 increases, so too does the average amount of packaging waste produced per person.
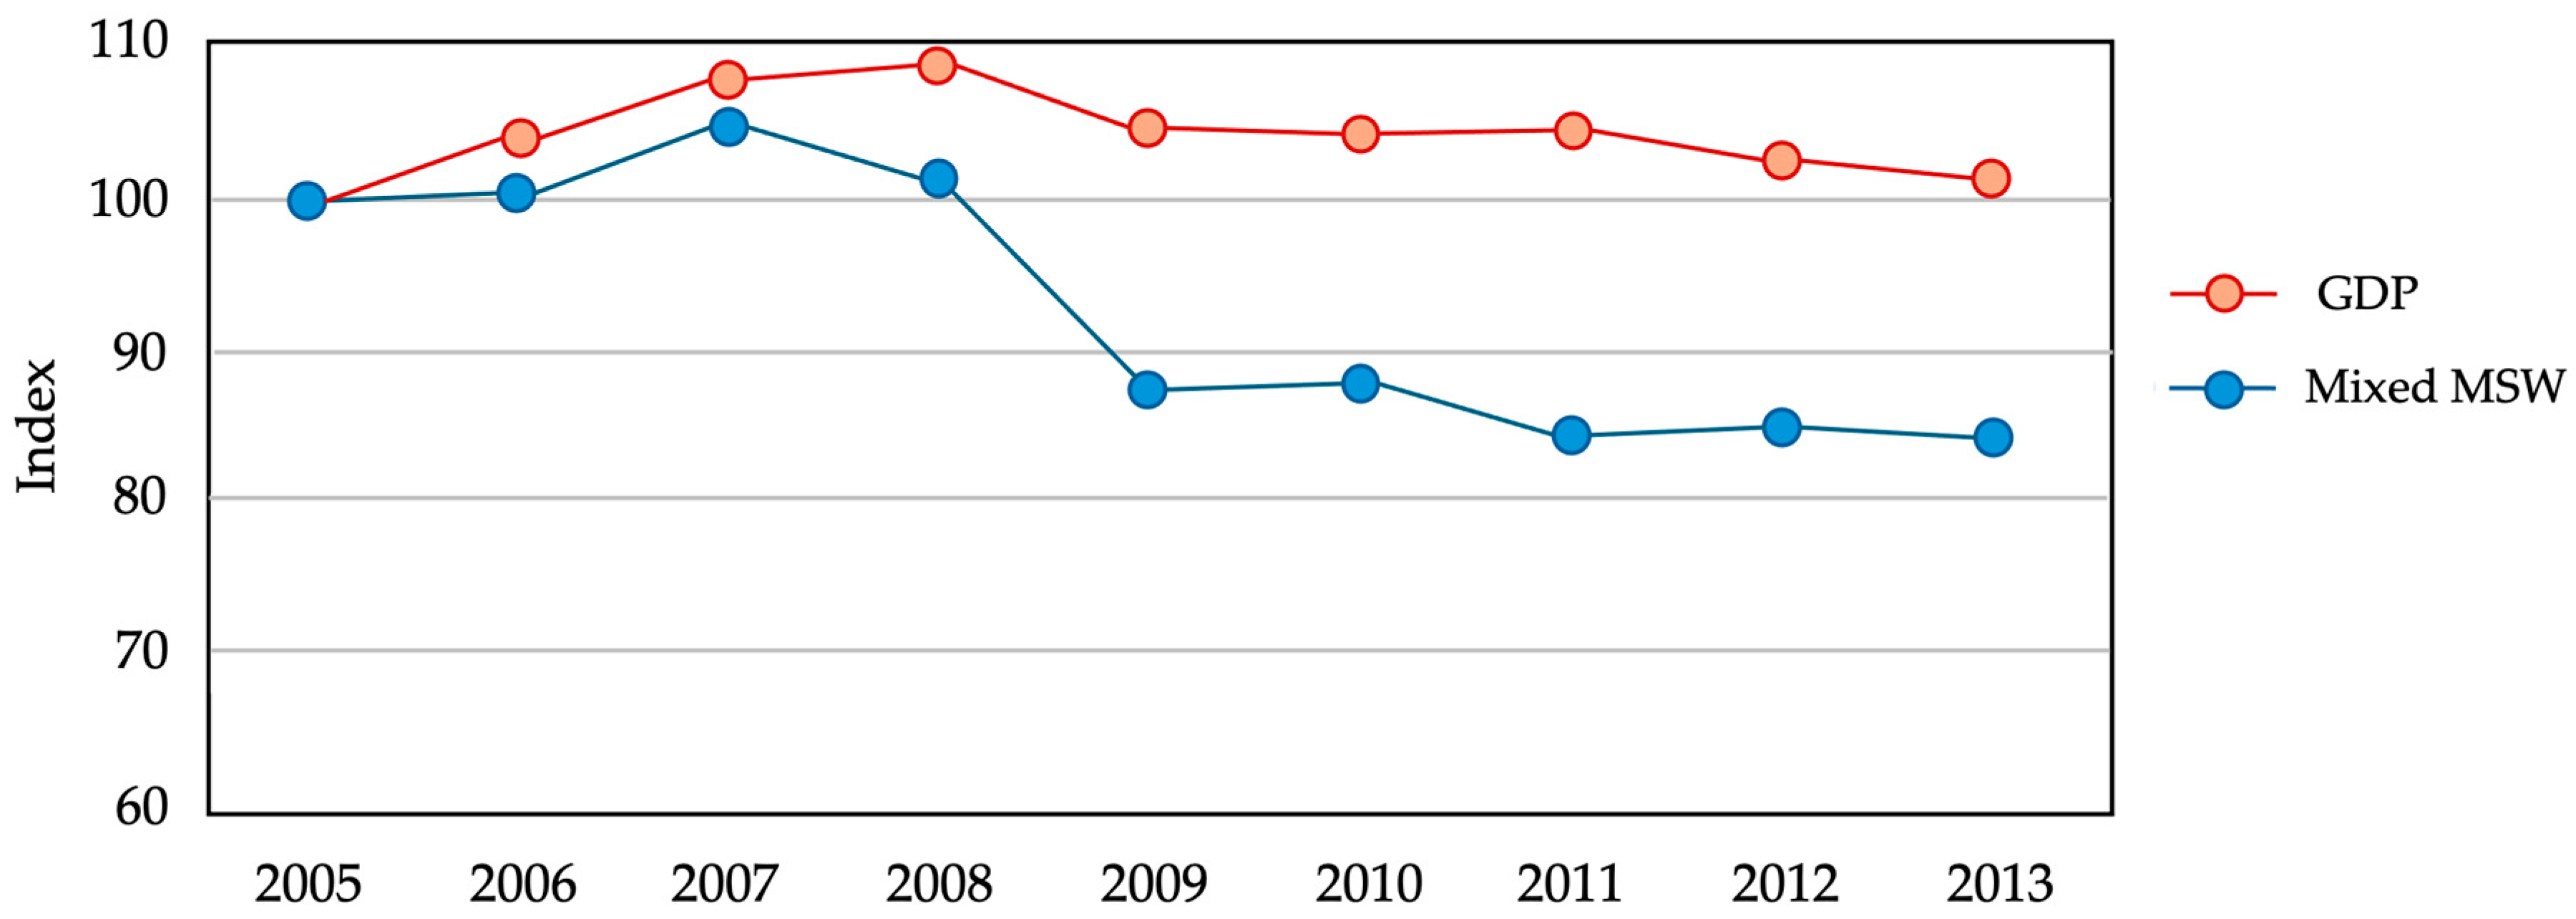
Table 1 shows the evolution over the period 1998–2010 of the indices that describe GDP and packaging waste production. Both indices adopt a value of 100 in 1998 and increase simultaneously during this period, indicating a parallel growth trend. This simultaneous increase highlights the correlation between economic growth, as represented by GDP, and the rise in packaging waste production. The data underscores the direct relationship between the two variables, with both indices reflecting similar patterns of variation over the analyzed years.
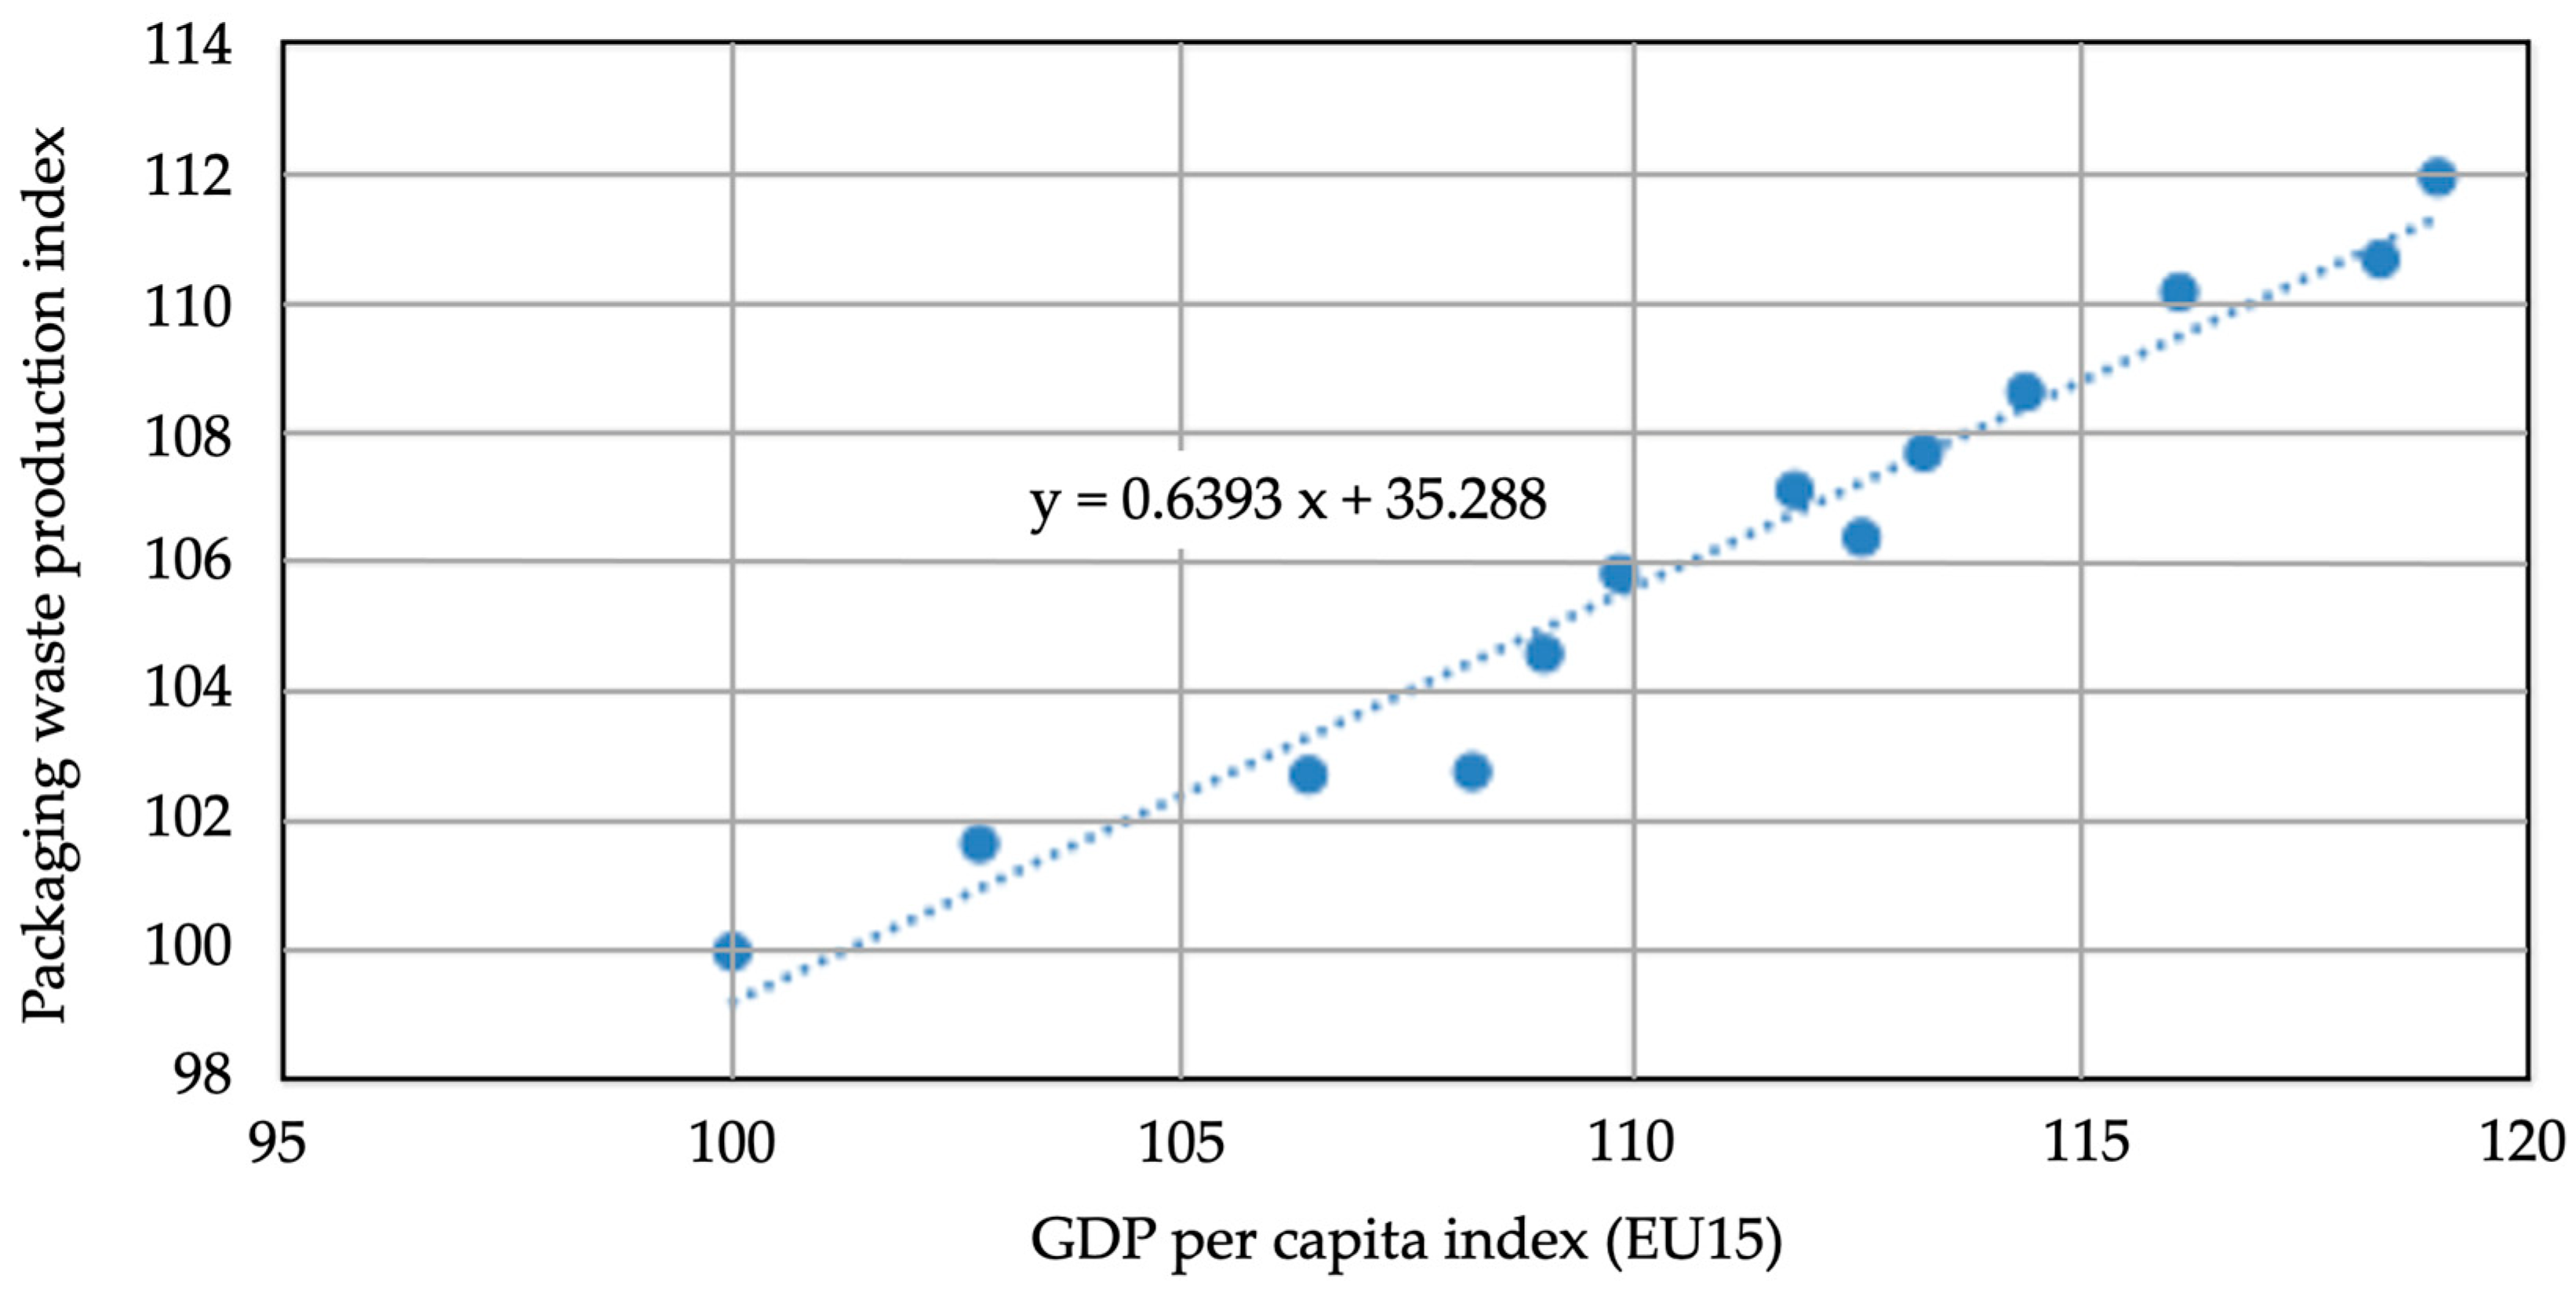
Figure 4 presents a consolidated visualization of the growth trends observed in
Table 1. The figure plots the relation between the packaging waste production index and the per capita GDP index on the same graph. As evident from the graph, the relationship between the two indicators exhibits a remarkably linear correlation. The upward and downward trends in packaging waste production closely mirror the corresponding changes in per capita GDP. This strong linear association further underscores the significant influence of economic growth on packaging waste generation.
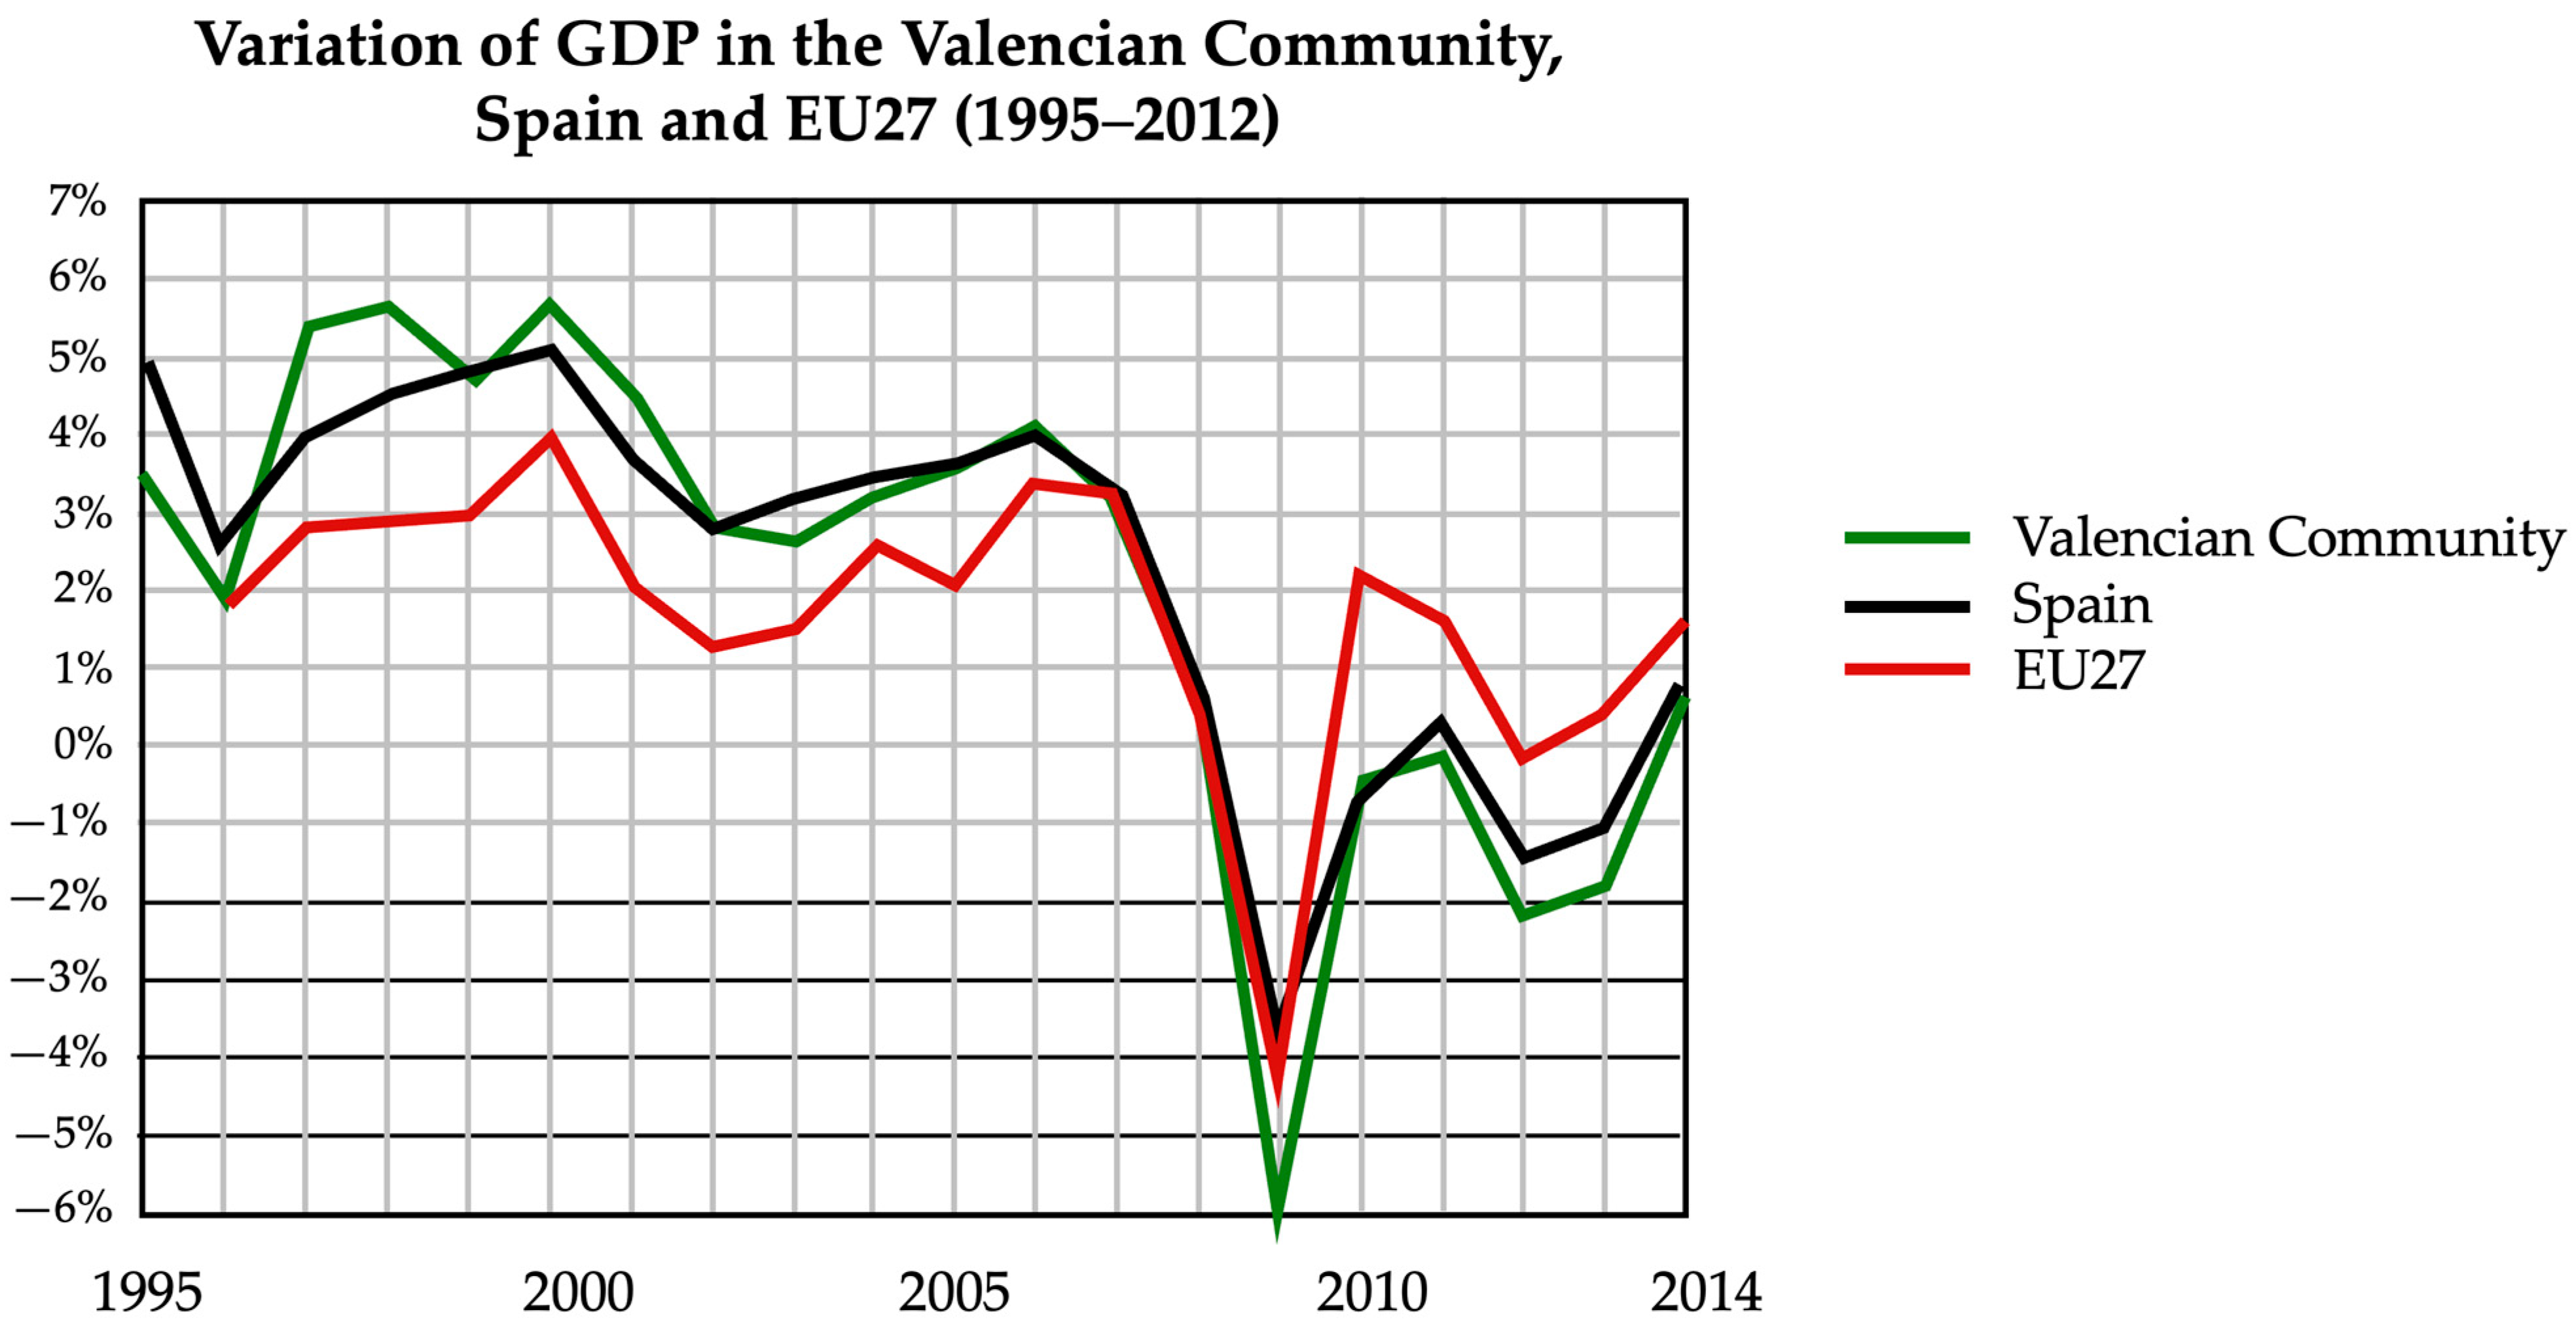
In this study, the aforementioned relationships were investigated using information from public databases of the Valencian Community (Spain). This is important for understanding the interrelationships between the different byproducts from waste treatment plants and the economic implications of their corresponding sales prices. The results of this analysis are presented in
Section 3.1.
2.3. Methodology Employed for Conducting the Analysis of the Selling Prices of Byproducts
In this study, the prices from auctions of various byproducts conducted by Ecoembes [
31] are used. Ecoembes is the most relevant integrated waste management system for household packaging in Spain and has been used to manage the byproducts from the two MBT plants managed by EMTRE. The representativeness of the sales price data used in this study is guaranteed precisely because they come from Ecoembes auctions, as this is a highly respected entity in the field of solid waste management in Spain. This research considers the results of auctions held in Spain, excluding the Canary Islands due to their geographical and fiscal peculiarities. The methodology employed in this study facilitated the determination of average sales prices for each byproduct in 2012. An analysis of Ecoembes auction prices in 2012 was conducted for byproducts using available data (HDPE bottles, PET plastic, aluminum, Brik, and paperboard). This analysis encompassed both national and regional data (Valencian Community).
Standard statistical measures, particularly mean and quartiles, were calculated to comprehend the overall price distribution. Within the analysis of recycling byproduct prices, it is important to identify outliers that may deviate significantly from the central tendency of the data. Outliers can potentially skew statistical analyses and distort results. Therefore, a crucial step in data preparation and analysis is the detection and treatment of outliers.
A common method for outlier detection utilizes quartiles (Q
i, i = 1, 3) and the interquartile range (IQR) [
32]. The IQR is calculated as the difference between the third quartile (Q
3) and the first quartile (Q
1). This method identifies outliers as data points falling below the lower limit (LL) or exceeding the upper limit (UL), defined as shown in Equations (1) and (2):
Therefore, values that fall below (or above) the lower (or upper) limit will be considered outliers. In the context of recycling byproduct prices, outliers could represent unusual market fluctuations, errors in data collection, or even fraudulent transactions.
This approach establishes reasonable boundaries for the distribution of byproduct prices and allows for the identification of data points that deviate substantially from the central trend. The detection of outliers does not necessarily imply their removal from the dataset. In some instances, these outliers may represent valid observations reflecting exceptional events or conditions. This is the reason why results are shown as accounting for or not contributing to the outliers.
To determine average values, outliers were removed in cases of high data dispersion. These outliers were identified as prices that deviated from the first and third quartiles by more than 1.5 times the interquartile range toward the extremes of the distribution.
For byproducts lacking Ecoembes auction data in 2012 (ferrous metals, scrap metal, glass, and mixed plastic), average values were obtained from two sources: average selling prices reported by various Valencian Community treatment plants and those communicated by EMTRE itself.
4. Discussion
To evaluate the representativeness of the results presented in
Table 5, a search was conducted in open-access databases to compare the prices obtained in Spain and the Valencian Community with those reported in other regions. The only data on recycled material prices available for comparison with the results shown in
Table 5 were obtained from Letsrecycle [
36], an independent UK website that provides information to businesses, local authorities, and community groups involved in recycling and waste management.
Table 6 presents a comparison between the average prices calculated for the Spanish case and those reported by [
37] for the UK in 2012. The comparison reveals that both average prices are very similar, which lends validity to the study conducted.
To gain a deeper understanding of the market dynamics for the various byproducts recovered at EMTRE’s MBT plants in 2012, a comprehensive statistical analysis was conducted on all available sales price data. The analysis focused on the distribution of these sales prices, aiming to identify patterns and potential variations between different byproducts. The analysis includes the determination of the boxplot, the histograms, and the statistics of the sales price data. The boxplots shown in
Figure 2,
Figure 3,
Figure 4,
Figure 5 and
Figure 6 have been calculated independently for the first- and second-best bids of the Ecoembes’ auctions.
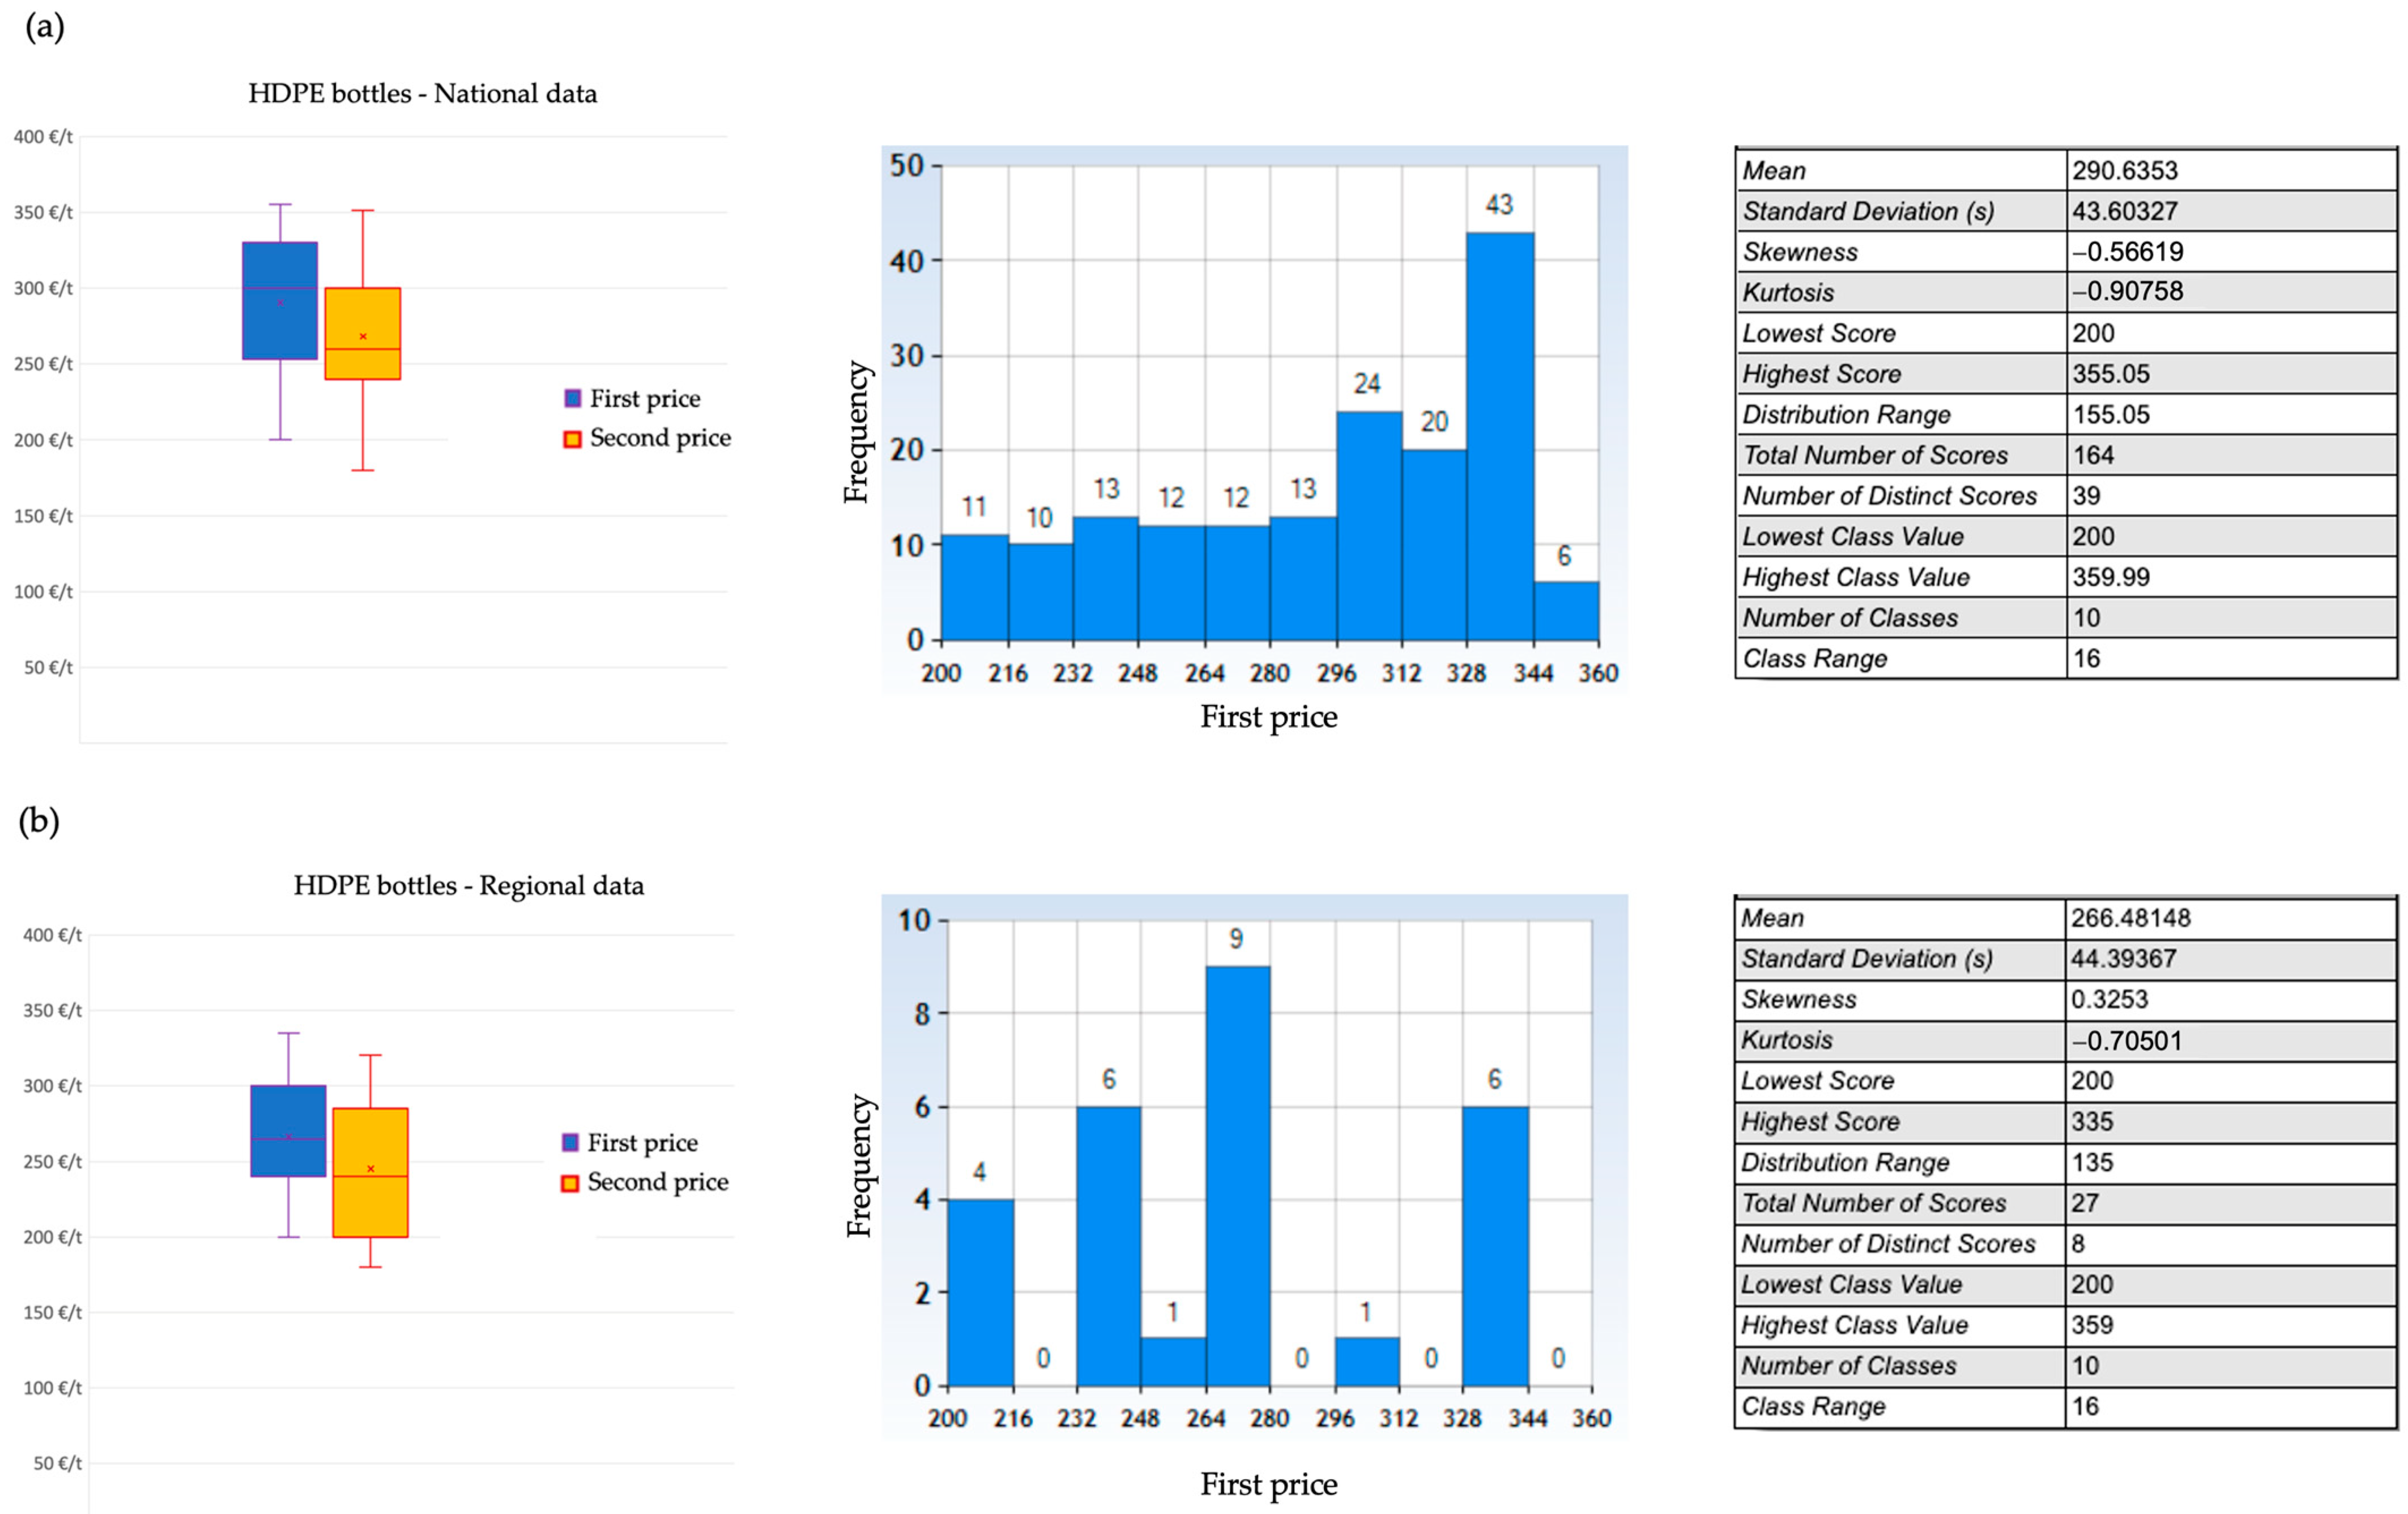
Figure 11 shows the statistical analysis for Ecoembes’ auction prices of HDPE bottles in 2012.
The analysis of HDPE bottles’ national data (
Figure 11a) revealed a non-Gaussian distribution of sales prices. This is evident from the skewness (−0.566) and kurtosis (−0.907), which deviate significantly from the values expected in a Gaussian distribution (skewness = 0 and kurtosis = 3). No outliers were identified; consequently, all 164 values corresponding to the winning bids (awarded prices) from the relevant Ecoembes public auctions across Spain were included in the calculation of the average market value. This analysis resulted in an average price of 290.64 €/t, with the minimum and maximum winning bids ranging from 200 €/t to 355.05 €/t.
The analysis for HDPE bottles Ecoembes auctions in the Valencian Community in the same period (
Figure 11b) produced different results. The distribution function followed a slightly more Gaussian pattern, though still far from it (skewness = 0.325, and kurtosis = −0.705). The average price was 266.48 €/t, 10% lower than the average value obtained from the national data. Interestingly, the minimum and maximum winning bids remained almost identical to the national data, ranging from 200 €/t to 355.05 €/t.
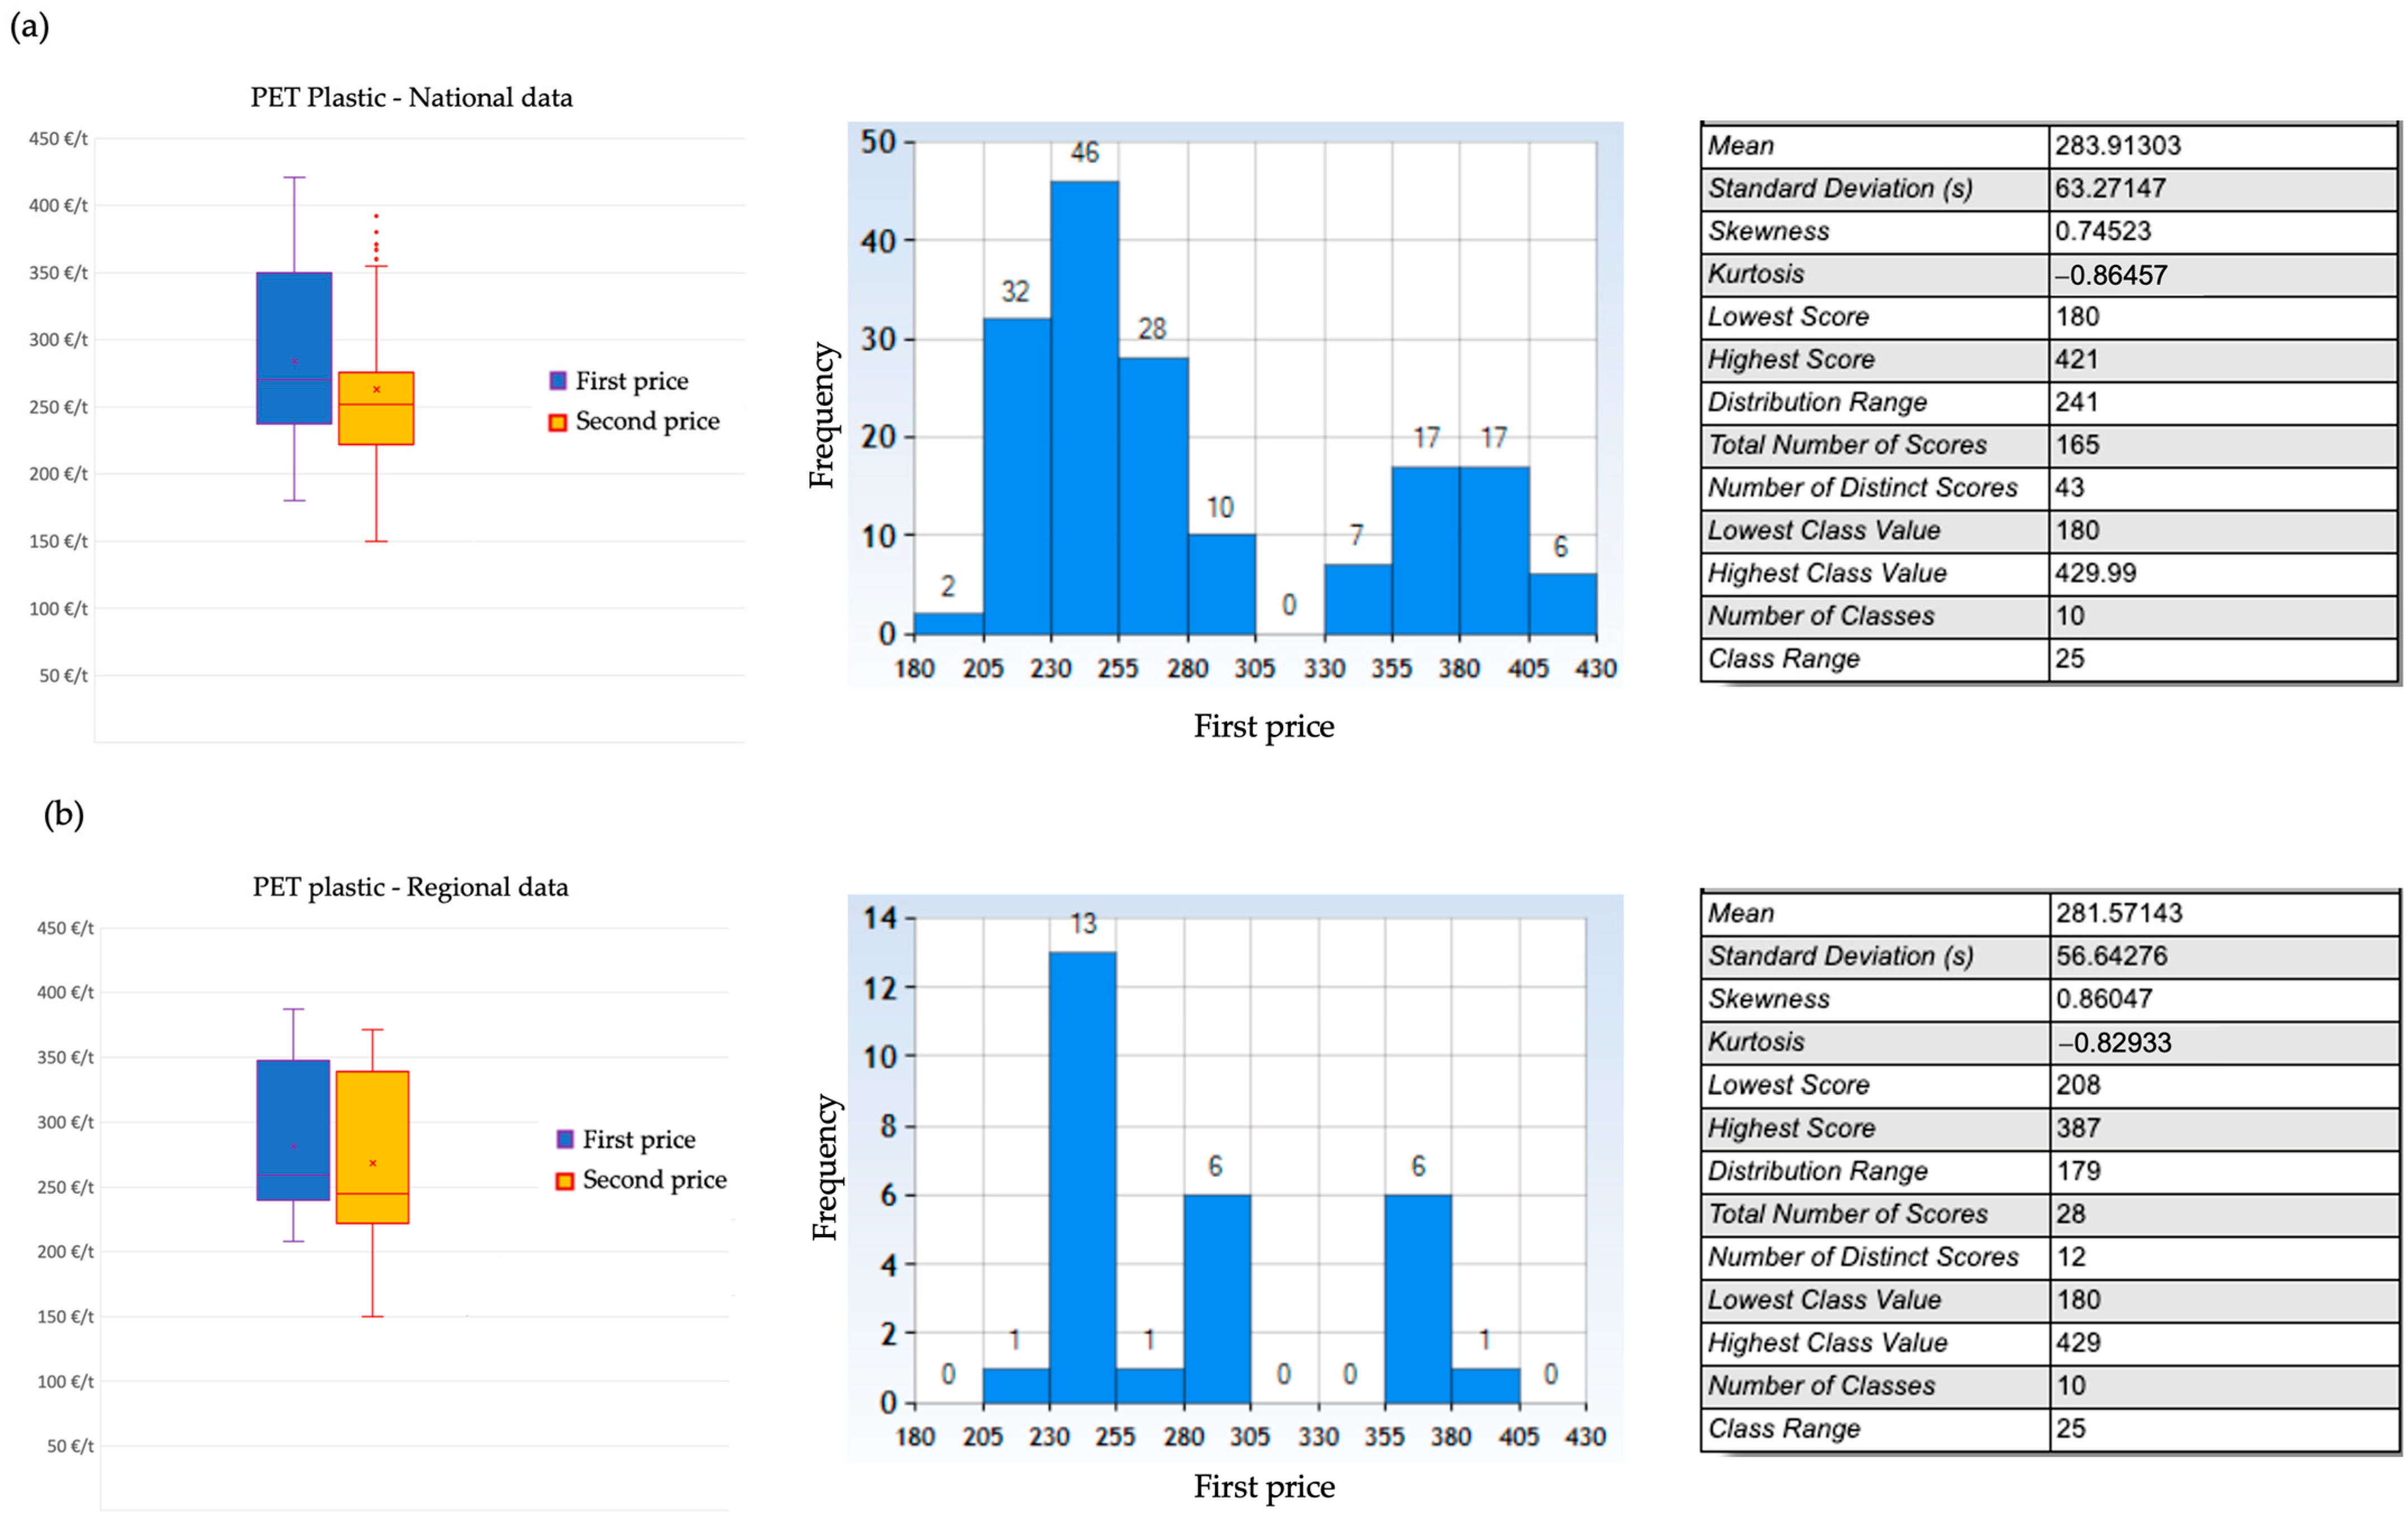
Figure 12 shows the statistical analysis for Ecoembes’ auction prices of PET plastic in 2012. Similarly to those results obtained for HDPE bottles, the analysis of PET plastic national data (
Figure 12a) revealed a non-Gaussian distribution of winning bids (skewness = −0.745; and kurtosis = −0.864). No outliers were identified. Therefore, all 165 values corresponding to the winning bids were included in the calculations. This analysis resulted in an average price of 283.91 €/t, with the minimum and maximum winning bids ranging from 180 €/t to 421.00 €/t.
The shape of the distribution function of PET plastic Ecoembes auctions in the Valencian Community (
Figure 12b) suggests the existence of two price ranges (205–305 €/t and 355–405 €/t). The average price was 281.57 €/t, which is less than 1% lower than the national average. However, the minimum and maximum winning bids are quite different from the national data, ranging from 180 €/t to 387 €/t.
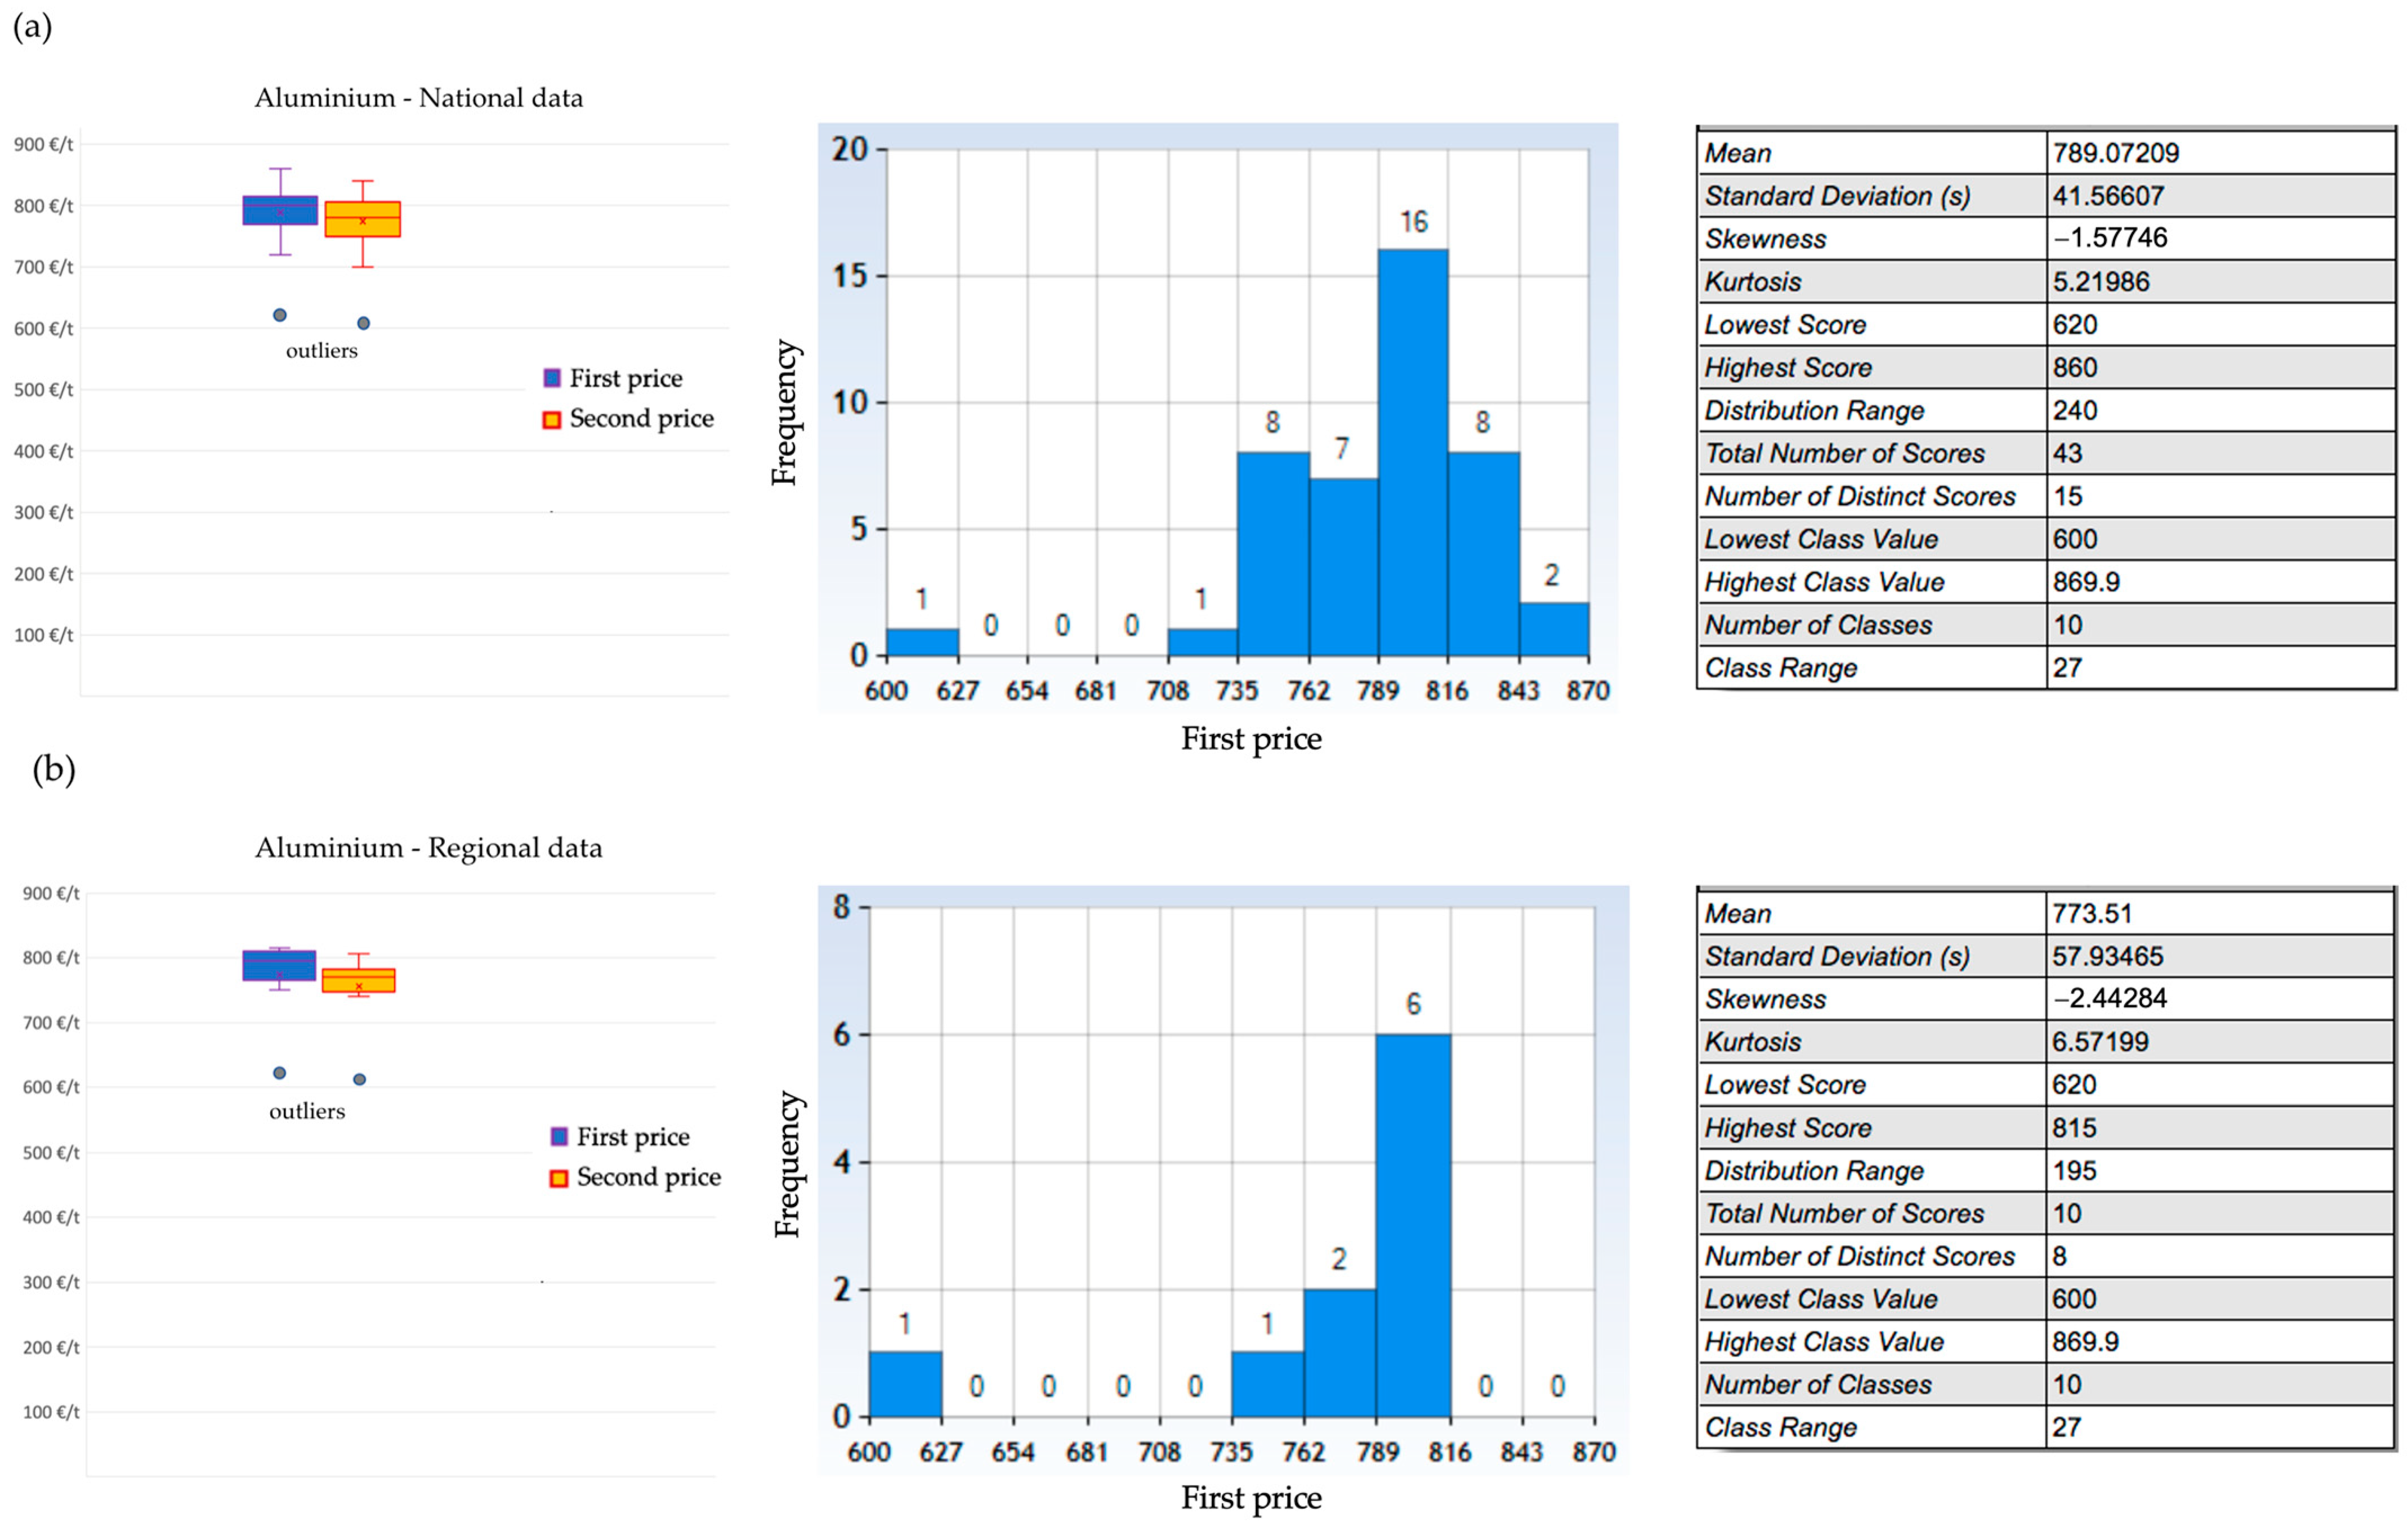
Figure 13a shows the statistical analysis of Ecoembes’ auction prices (national data) for aluminum in 2012. Results revealed a distribution with characteristics similar to a normal distribution for winning bids. This is evidenced by the skewness value of −1.577, which indicates a slight negative skew toward higher prices. The kurtosis value of 5.219 suggests a distribution with slightly fatter tails compared to a perfect normal distribution. However, the presence of an extreme outlier significantly impacted the shape of the distribution. The presence of outliers can be observed in both winning bids and the second-highest bids. By excluding the outlier from the analysis, the average price increased to 793.10 €/t, indicating a potential underestimation of the average price when the outlier is included. Conversely, including the outlier slightly reduced the average price to 789.07 €/t. The range of winning bids, spanning from 620 €/t to 860 €/t, reflects a moderate level of price dispersion in the national market.
The distribution of winning bids for aluminum Ecoembes auctions in the Valencian Community (
Figure 13b) exhibited a marked departure from a normal distribution. This is evident from the skewness value of −2.442, which indicates a more pronounced negative skew compared to the national data, suggesting a stronger tendency toward lower winning bids. The kurtosis value of 6.572 further reinforces this observation, implying even fatter tails in the distribution compared to the national data. The average price, incorporating the identified outlier, was 773.51 €/t. Interestingly, excluding the outlier resulted in a higher average price of 790.57 €/t. This highlights the potential influence of outliers on central tendency measures like average price. It is noteworthy that this adjusted average price is only marginally lower (less than 1%) than the national average. In contrast to the national data, the range of winning bids in the Valencian Community displayed a narrower disparity, with values ranging from a minimum of 620 €/t to a maximum of 815 €/t. This significant difference in the range suggests a lower degree of price variability within the Valencian Community compared to the national market.
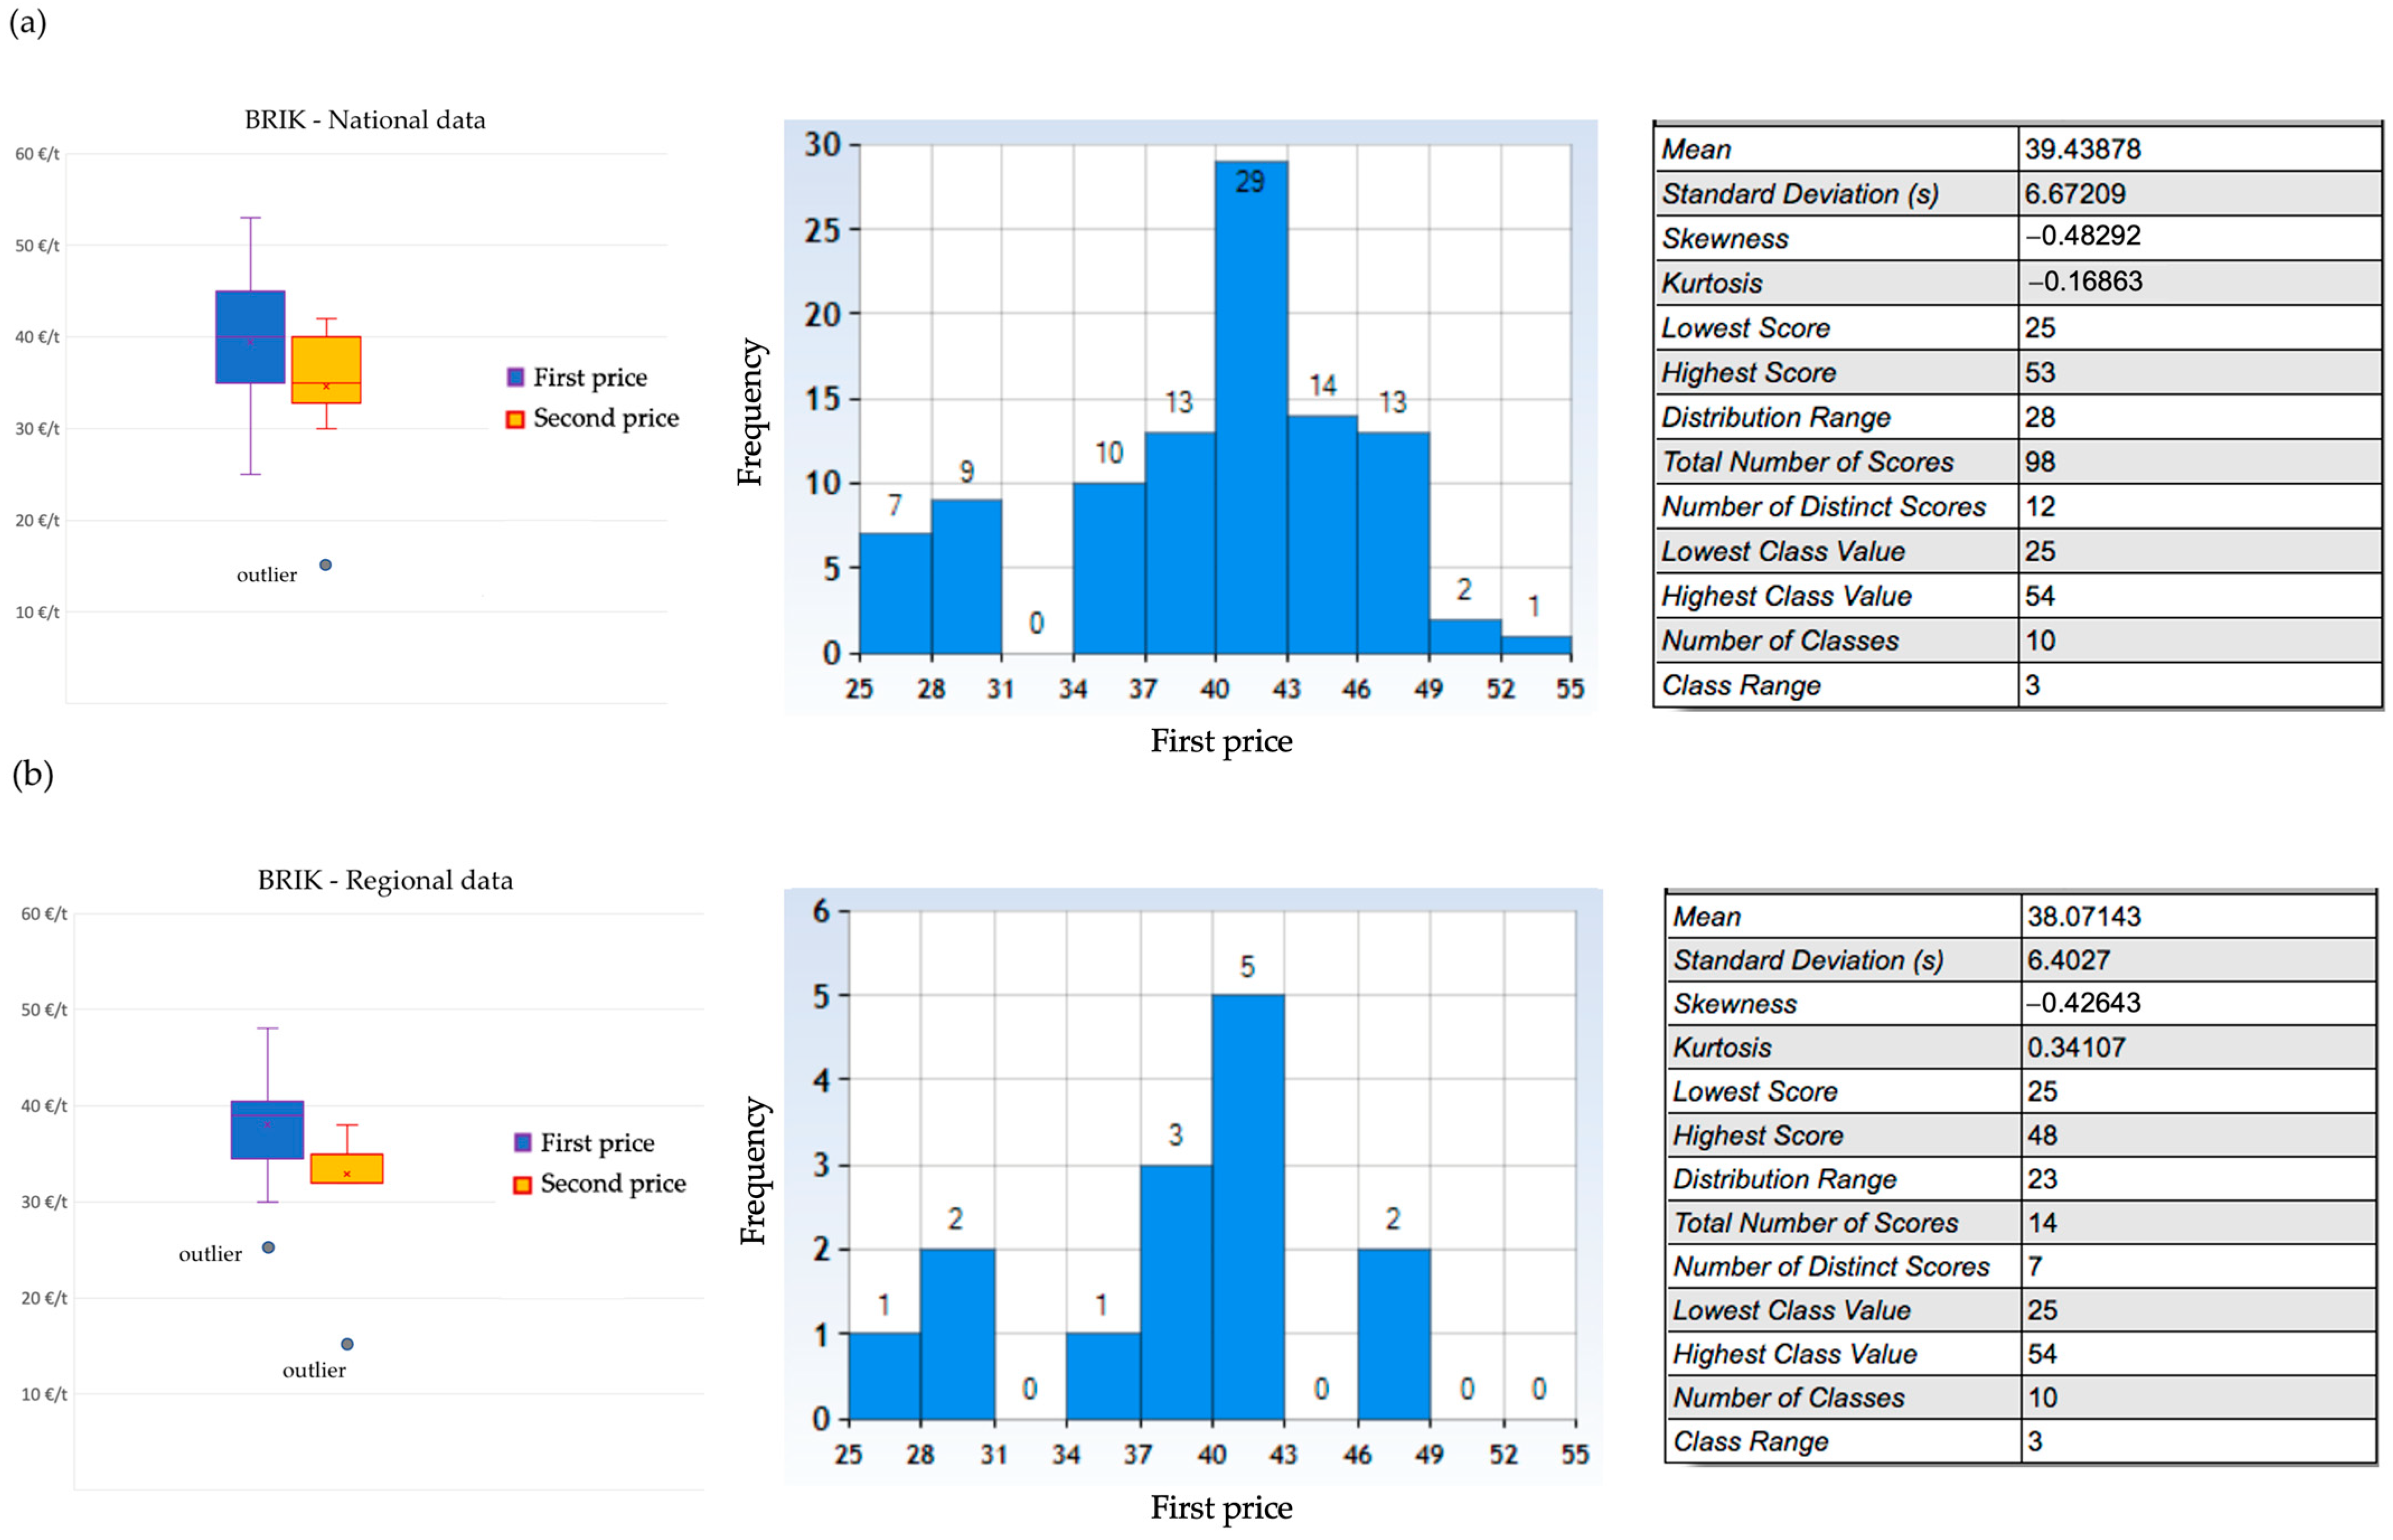
The analysis of BRIK national data (
Figure 14a) revealed a distribution resembling a Gaussian distribution of sales prices but with a slightly longer tail toward lower values (skewness = −0.482; kurtosis = −0.168). No outliers were detected in the winning bids, although one outlier was identified in the second prices. The analysis of winning bids resulted in an average price of 39.44 €/t, with the minimum and maximum winning bids ranging from 25 €/t to 53 €/t.
The analysis for BRIK Ecoembes auctions in the Valencian Community during the same period (
Figure 14b) yielded similar results, albeit with only 14 data values available. The average price was 38.07 €/t, marginally lower than the national average. The minimum winning bid remained identical to the national data (25 €/t), but the maximum value was 10% lower (48 €/t).
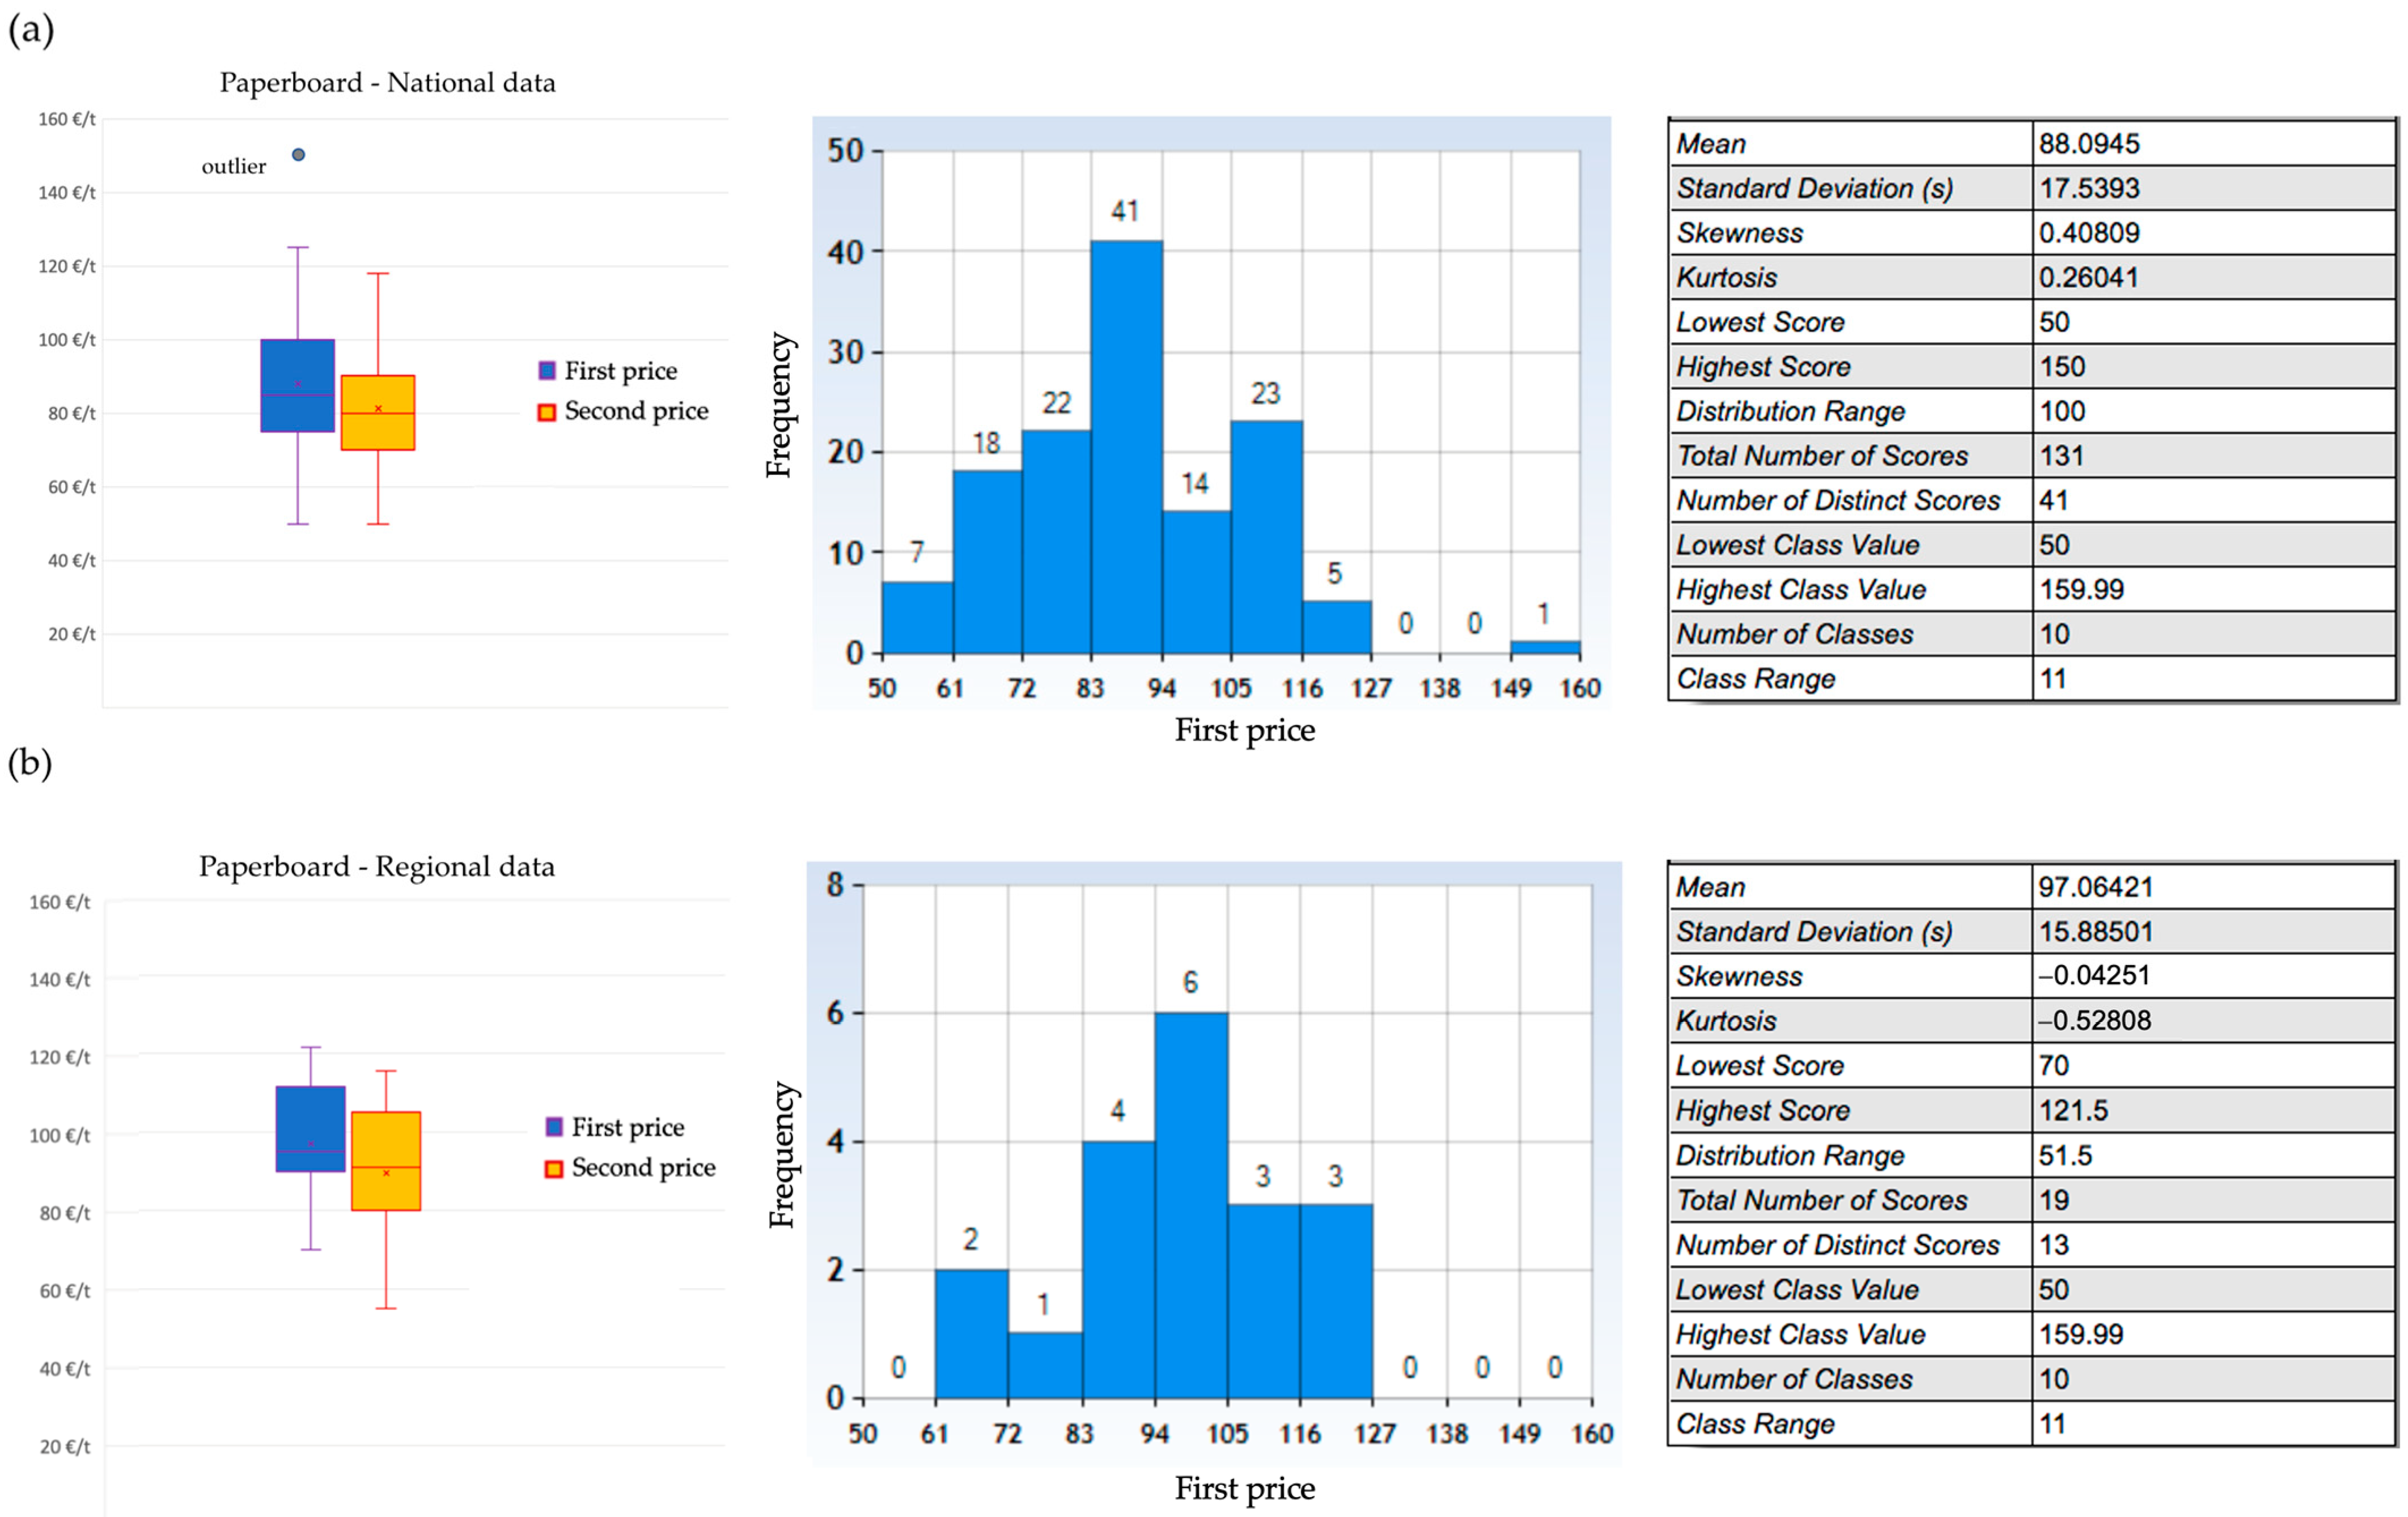
The analysis of Ecoembes’ national auction prices for paperboard in 2012 (
Figure 15a) revealed a distribution similar to a Gaussian distribution for winning bids (skewness = 0.408; kurtosis = 0.260). This is consistent with the findings for BRIK. However, one outlier with a high bid (150 €/t) was identified. Including all the data in the analysis resulted in an average price of 88.09 €/t. The minimum and maximum winning bids ranged from 50 €/t to 150 €/t.
The shape of the distribution function of winning bids for paperboard Ecoembes auctions in the Valencian Community (
Figure 15b) exhibited a high degree of similarity to the distribution observed in the national data analysis. However, the average price in the Valencian Community (97.06 €/t) was substantially higher (more than 10%) compared to the national average (88.09 €/t). In contrast to the national data, the winning bids in the Valencian Community displayed a narrower range, with values ranging from a minimum of 70 €/t to a maximum of 121.50 €/t. This difference in the range suggests a lower degree of price variability in the Valencian Community compared to the national market.
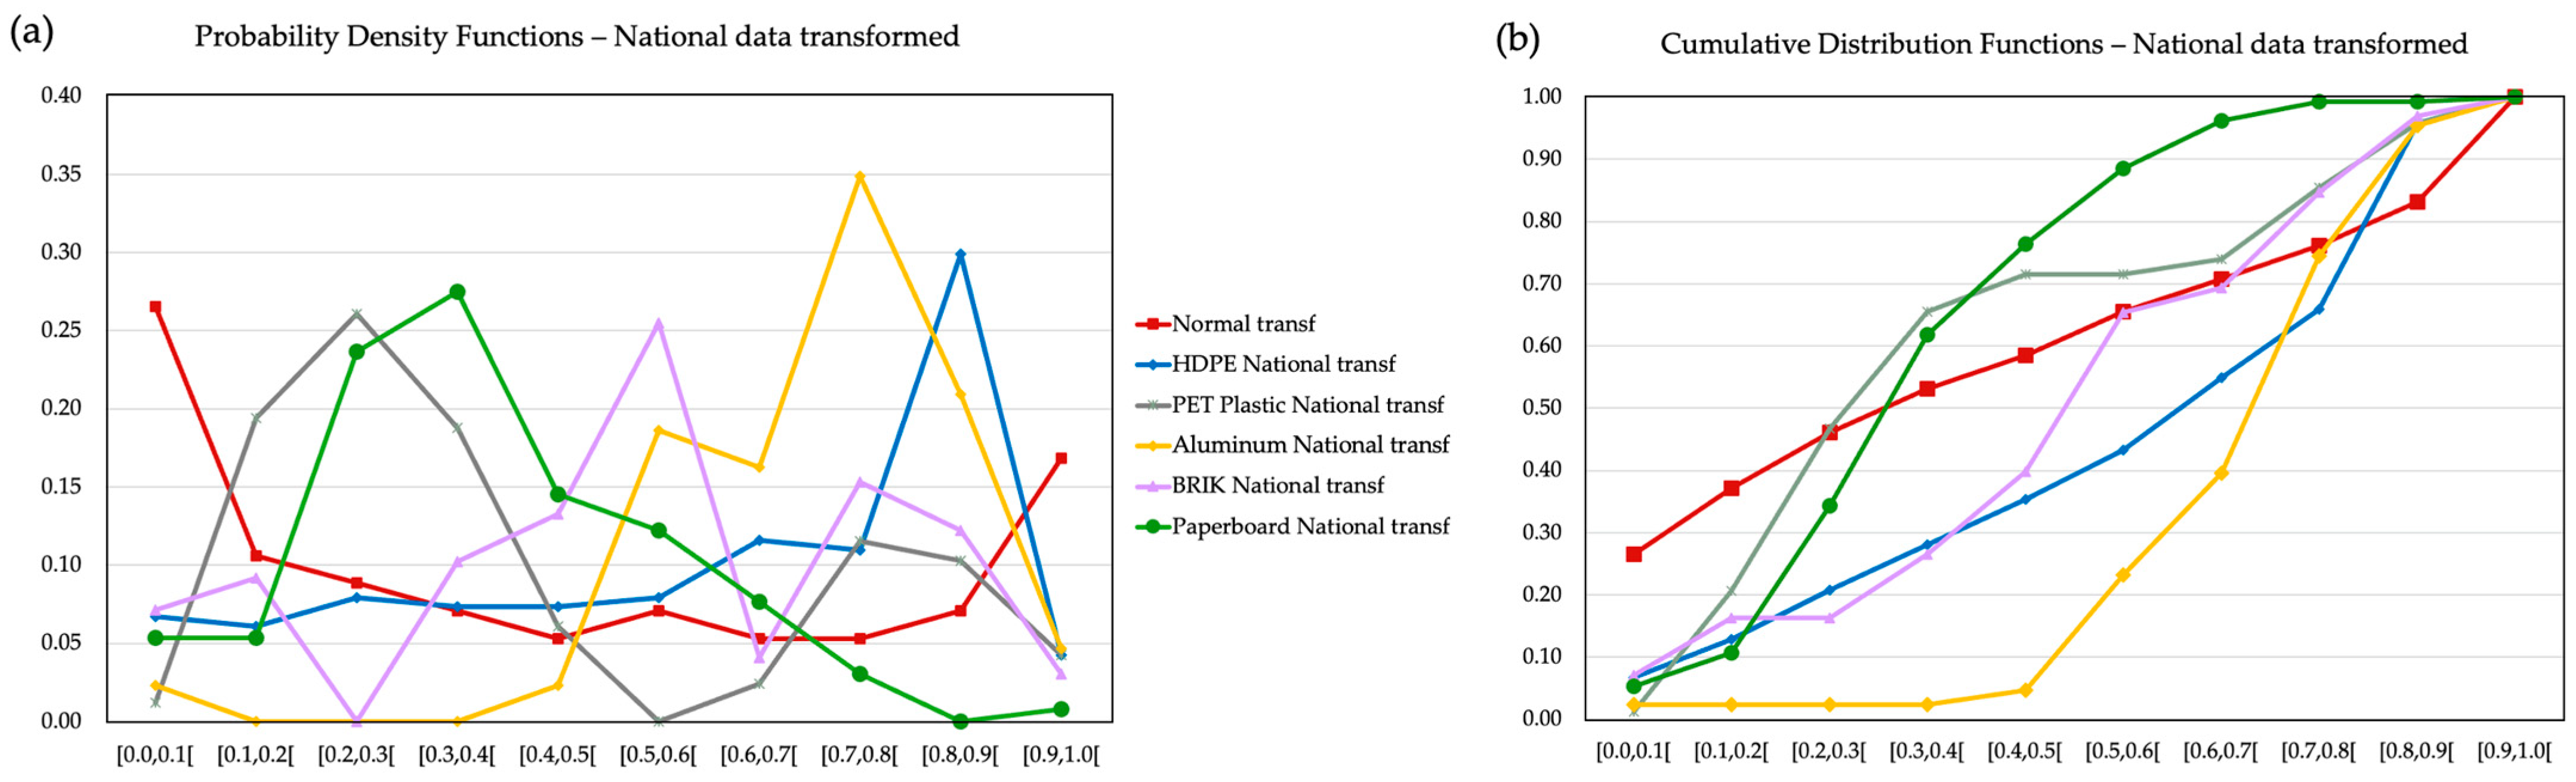
To facilitate comparisons between the price distributions of the different byproducts, a linear transformation of the available data was performed to adjust them to the range [0, 1]. The linear transformation used is shown in Equations (3)–(5):
where:
Y: transformed variable to the range [0, 1]
X: original variable
Xmax: maximum value of variable X
Xmin: minimum value of variable X.
By applying these linear transformations, the prices of all three byproducts are scaled to fall within the range of 0 to 1, enabling direct comparisons of their distributions. This standardization allows for a more nuanced understanding of the relative price distribution patterns across the different byproducts.
Figure 16a presents a comparison of the probability density functions (PDFs) for the national data of all five byproducts. These PDFs were calculated using ten classes with a width of 0.1, ranging from 0 to 1. Each of the five byproducts has its own independent PDF. A manual calibration process was conducted to identify a transformed Gaussian distribution that best fits the observed PDFs. This resulted in a Gaussian distribution with a mean (average) of 0 and a standard deviation of 2 (shown in red in
Figure 16a). It can be observed in
Figure 16a that only the BRIK PDF exhibits a slight resemblance to this Gaussian distribution.
Figure 16b displays the corresponding cumulative distribution functions (CDFs) for the national transformed data. The interpretation of these CDFs aligns with the observations from
Figure 16a. The CDFs for HDPE bottles, PET plastic, aluminum, and paperboard deviate significantly from the transformed Gaussian distribution. Once again, only the BRIK CDF demonstrates an approximate fit to the normal distribution.
In order to statistically evaluate whether the national data follows a normal distribution (Gaussianity), the Shapiro–Wilk test [
38] was applied to the national datasets for each of the five byproducts.
Table 7 summarizes the results of the Shapiro–Wilk test. In
Table 7, W is the Shapiro–Wilk statistic, and a significance level of 5% was chosen.
Therefore, for all the national data of the five subproducts, the Null Hypothesis has been rejected, as the calculated W is less than the critical value of W. None of them shows a Gaussian distribution.
5. Conclusions
Acquiring accurate price data for byproducts generated from waste treatment processes can be a challenging endeavor. Traditional methods often rely on information from public auctions, such as those conducted by Ecoembes in Spain. However, these auctions might not cover all byproducts, leaving gaps in the data. Additionally, factors like regional variations and the presence of outliers within the auction data can complicate the calculation of representative average prices.
Byproduct prices are not static and can fluctuate due to several factors. Shifts in demand are a key driver, as an increased need for a specific byproduct material can push prices up. Conversely, if new technologies reduce reliance on that byproduct, its value might fall. Supply chain disruptions caused by trade issues or logistical bottlenecks can also temporarily affect prices, causing spikes or dips depending on the severity and availability of alternative sources. Technological advancements can play a double role: creating new, more efficient ways to extract valuable materials from waste, potentially lowering prices by increasing supply; or creating new applications for byproducts, increasing demand and driving prices higher.
As seen in this research, government policies, such as subsidies for recycled materials or taxes on virgin resources, can also influence the market value of byproducts. Besides, the price of a byproduct can sometimes be linked to the price of a related product—for example, the price of plastic scrap might rise alongside the price of virgin plastic if it becomes a more attractive substitute.
This study employed statistical methods to determine the average sales prices in 2012 for the various byproducts recovered at EMTRE’s MBT plants. Data originated from Ecoembes auctions, both at the national level and specifically within the Valencian Community. For byproducts lacking Ecoembes auction data, the analysis relied on information provided by several other waste treatment plants located in the Valencian Community.
The statistical distribution of average prices obtained from Ecoembes auction data in the Valencian Community follows the same pattern as the corresponding distribution for average prices calculated from auctions conducted in other Spanish autonomous communities. There were no significant differences detected in price distribution between the Valencian Community and the rest of Spain for any of the analyzed byproducts. None of the auction price distributions exhibited a normal (Gaussian) distribution.
This research strengthens the scientific understanding of the challenges in pricing recycled materials from MBT plants. As previously discussed, in the case of EMTRE plants in the Valencian Community, the economic relationships between the administration (EMTRE) and the concessionaire companies depend largely on the prices of recycled materials at the beginning of the concession, which in this case was in 2010. The impact of setting these prices extends over the 20 years of the concession, as established by the contract conditions.
This work highlights the limitations of relying solely on public auctions conducted during a short period (2012 in the case presented) and the complexities arising from regional variations and outliers. Furthermore, the study emphasizes the dynamic nature of byproduct prices, influenced by various economic and technological factors. The non-normal distribution of byproduct prices suggests the need to consider alternative contract models that incorporate periodic updates of byproduct prices based on ongoing analysis of real market price trends. Further research could explore the development of more sophisticated economic models that could account for both regional variations and outliers, as well as occasional price fluctuations that do not respond to average market trends.
Understanding the factors influencing byproduct prices can inform policy decisions to promote recycling. This could include targeted subsidies for recycled materials, taxes on virgin resources, or regulations that encourage the development of new markets for byproducts. Predicting future price development is inherently challenging due to the dynamic nature of the market. However, researchers can develop informed forecasts for specific byproducts by monitoring historical price trends, analyzing current market forces (supply and demand), and considering potential technological advancements.
While this study provides a valuable foundation for understanding the complexities of pricing recycled materials from MBT plants, it also highlights the need for further research in several areas. Firstly, a more comprehensive analysis of price fluctuations over time is needed. This would require gathering data from a broader range of sources and over a longer period to capture the full spectrum of market dynamics. Additionally, a deeper investigation into the regional variations in byproduct pricing is warranted. This would involve examining factors such as local supply and demand patterns, transportation costs, and regulatory differences.
Furthermore, research is needed to explore the impact of specific economic and technological factors on byproduct prices. This could include analyzing the influence of government policies, such as subsidies or taxes, on the market value of recycled materials. Additionally, examining the role of technological advancements in both the production and utilization of byproducts could provide valuable insights into future price trends.
By addressing these research directions, a more comprehensive understanding of the dynamics of byproduct pricing can be achieved. This knowledge would be invaluable for stakeholders in the waste management industry, enabling them to develop more effective strategies for pricing, marketing, and utilizing recycled materials. Ultimately, this could contribute to a more efficient and sustainable waste management system that promotes circular economy principles.


