1. Introduction
Shrimp farming has emerged as a vital sector in Bangladesh’s economy, contributing substantially to the nation’s export earnings [
1,
2,
3]. Quality management practices are crucial for ensuring the safety, integrity and overall quality of shrimp throughout the supply chain, from harvesting to transportation to the processing center [
1,
4]. Maintaining the quality of shrimp products is imperative to sustain market competitiveness and adhere to international standards [
1].
Over the past five decades, the Bangladesh Government has promoted a market-based export-oriented development policy by supporting the aquaculture of brackish water shrimp (
Penaeus monodon) and freshwater prawn (
Macrobrachium rosenbergii) in coastal areas. Bangladesh is a relatively small player in the complex international seafood trading system. In 2021–2022, the country produced 287,497 metric tons of shrimp [
5]. The majority of this output (60%) came from farming brackish water shrimp on 191,057 hectares of coastal land, with an average yield of 358 kg/ha [
6]. The second-highest production was from the freshwater prawn, which has seen rapid growth over the last decade. This species accounted for 31% of the production on 71,923 hectares of low-lying floodplain areas, mostly in the southwest region, with an average yield of 714 kg/ha [
6]. The remaining 9% are wild shrimp varieties.
Once the second-highest export, Bangladesh shrimp slipped to seventh place since 2014–2015. After eight years of decline, exports have surged. In 2021–2022, Bangladesh exported 30,571 metric tons of shrimp, valued at USD 407 million, primarily to the European Union (EU) countries [
5,
7]. Bangladesh now contributes 1.76% of the global shrimp exports [
8].
In recent years, the shrimp industry in Bangladesh has achieved significant advancements, driven by good aquaculture practices, cluster farming approach, government support, and increased global demand [
9]. In 2022, brackish water shrimp achieved the Geographical Indication (GI) Registration Certificate as ‘Bangladesh Tiger Shrimp’ [
6,
9]. This recognition protects the unique qualities, reputation, and origin of this shrimp, ensuring its authenticity and enhancing its market value both domestically and internationally. The expansion of freshwater prawn farming has diversified the industry, contributing to overall growth.
Infrastructure improvements, such as modernized processing facilities, appropriate technology, and establishing three internationally accredited laboratories, have enhanced product quality and marketability [
6]. Regulatory reforms aligning with the EU standards, strengthening competent authorities, and adopting international food safety and traceability standards have bolstered Bangladesh’s reputation in the global market [
10]. Despite these advancements, the industry faces challenges including the declining trend in shrimp export quantities, climate change, disease outbreaks, and fluctuating international market prices. However, the sector has shown resilience through improved practices and policies.
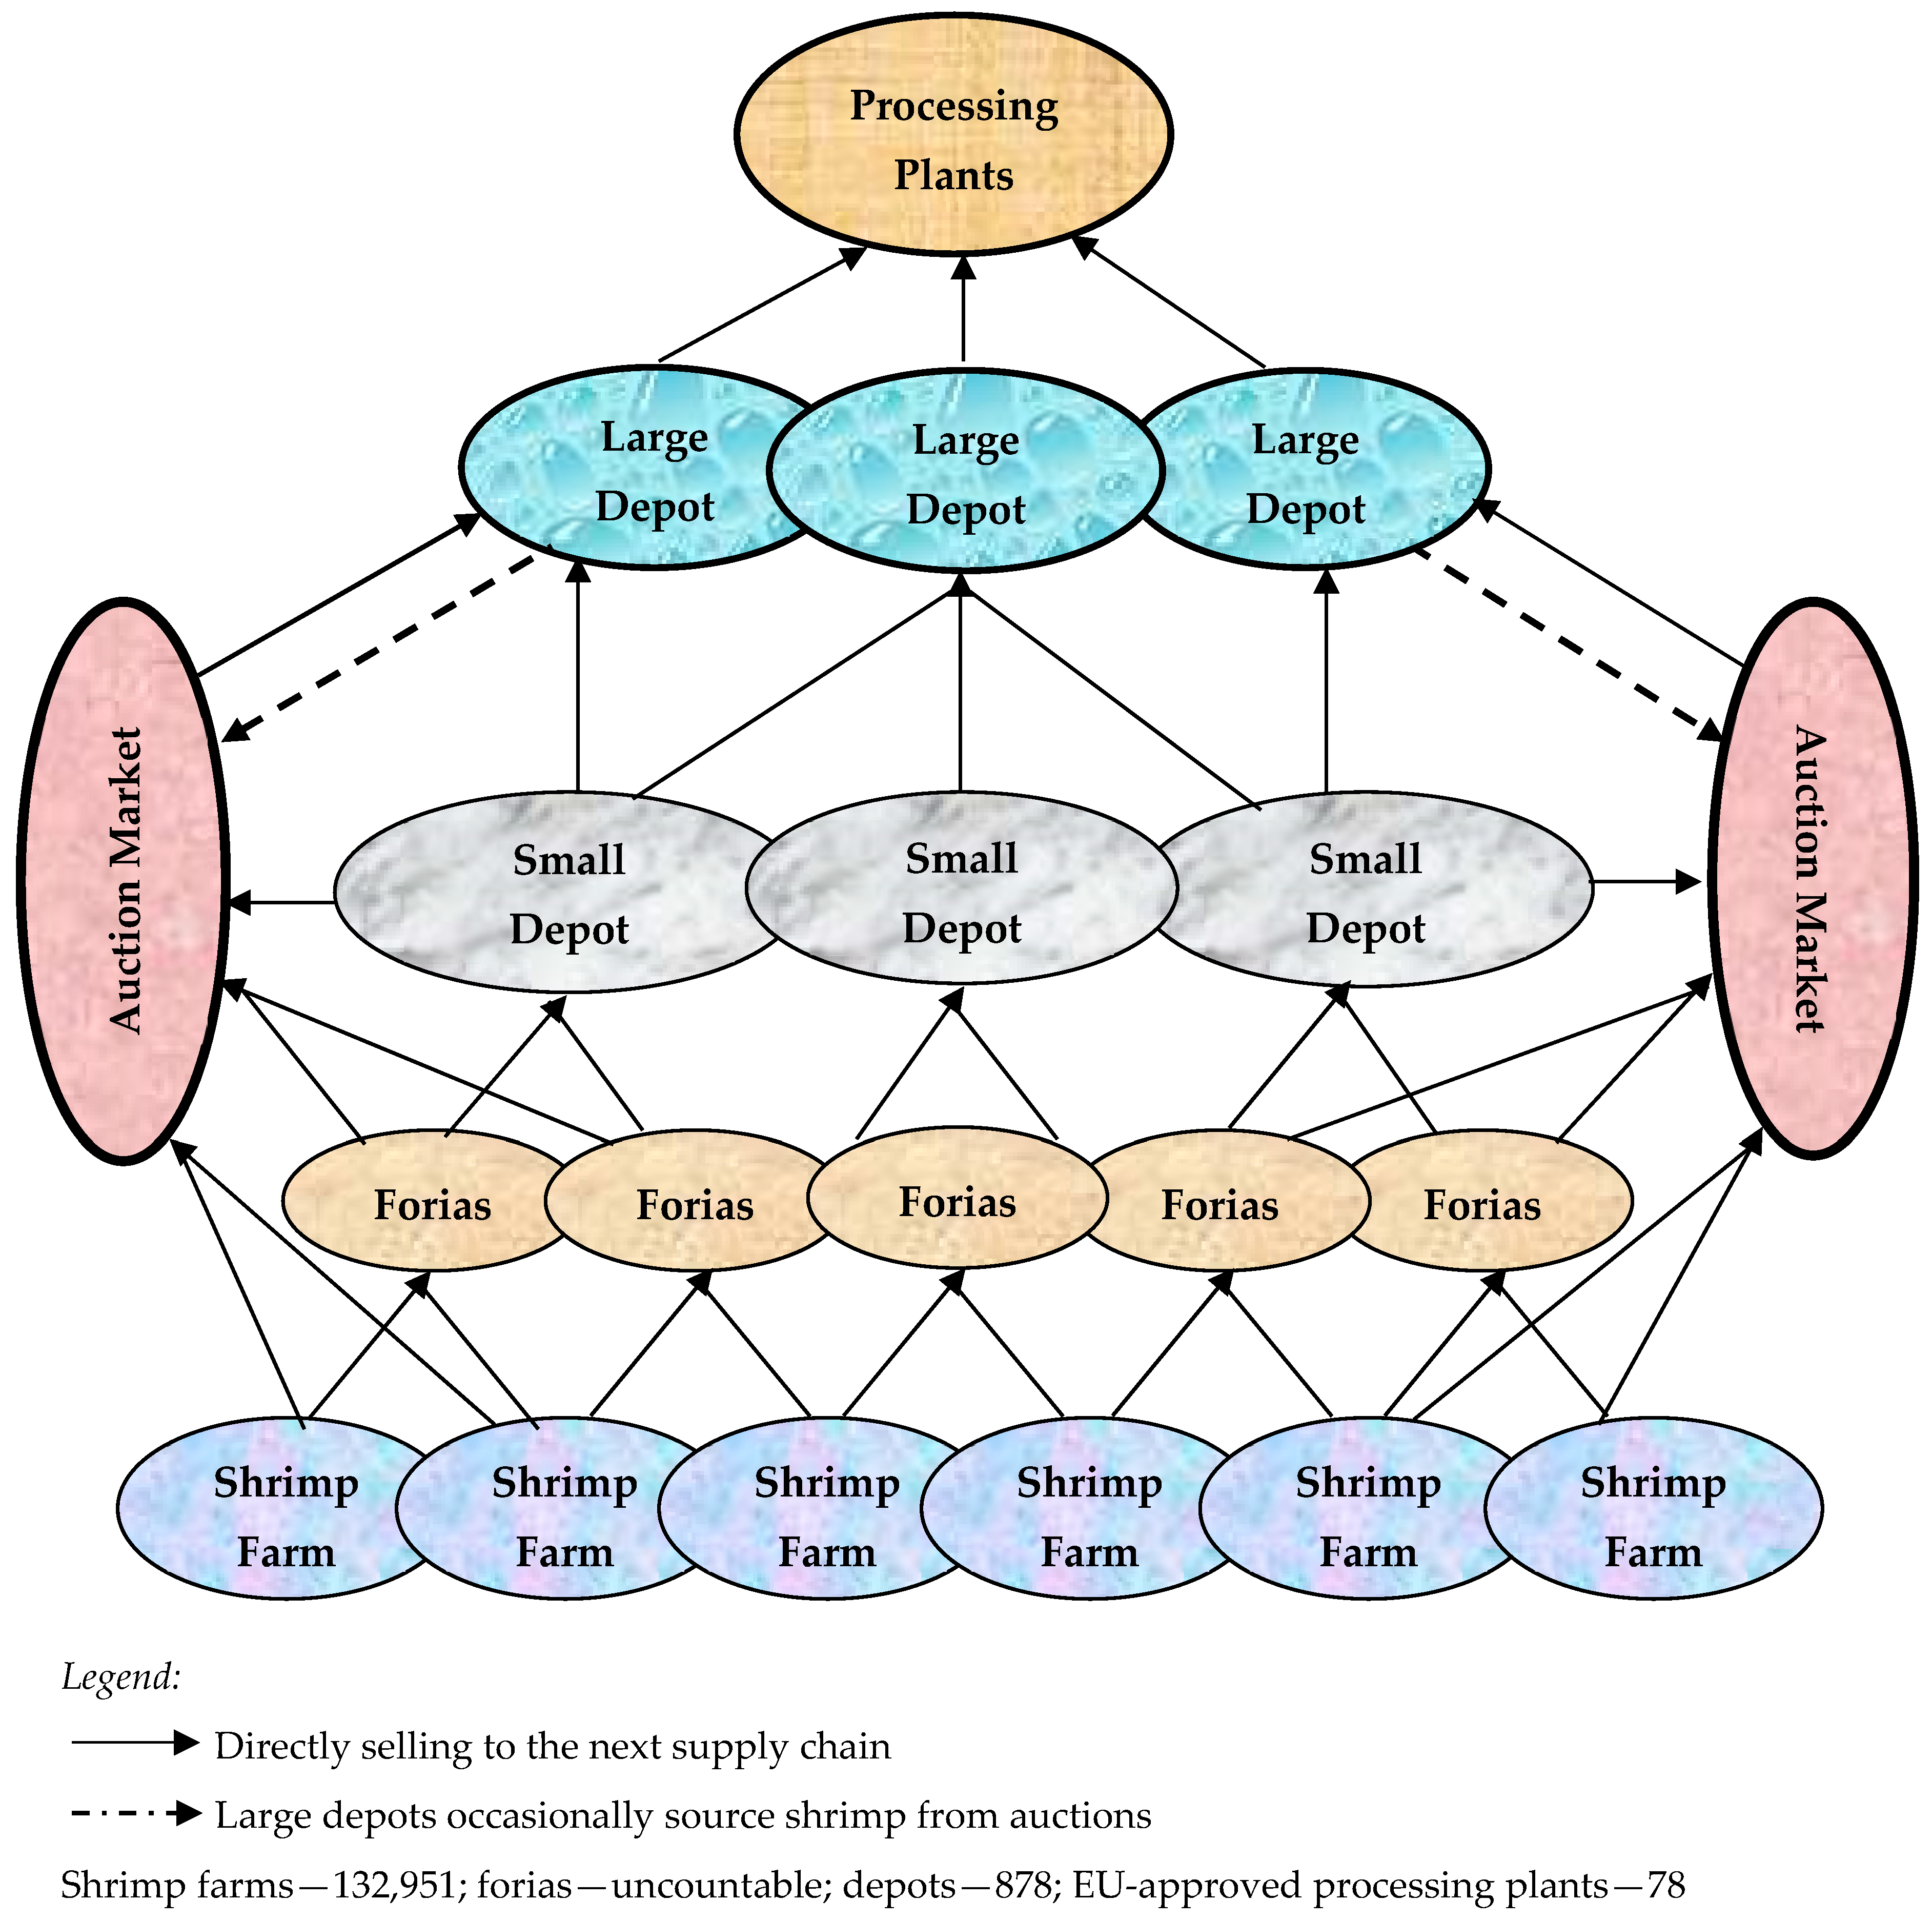
The farmed shrimp supply chain involves a large number of intermediaries engaged in activities from broodstock collection to exporting processed shrimp and shrimp products [
11]. The key stakeholders in this supply chain include 89 hatcheries, 132,951 farms, 878 depots, and 78 processing plants [
6]. An unaccountable number of forias (Foria acts as a middleman in the shrimp supply chain, purchasing small volumes of shrimp from remote farmers and selling them to small depot owners. Operating casually, foria has no fixed establishment or location for these transactions) operated between farms and depots, serving as the primary suppliers of shrimp. As part of a broader effort to upgrade the shrimp sector, the government has constructed 21 modern shrimp landings and service centers to ensure postharvest safety and quality [
11].
A key subsector of the domestic supply chain in shrimp industry in Bangladesh is the shrimp depot. These are largely rural private establishments where shrimp are purchased through a complex network of intermediaries. The shrimp are then sorted, cleaned, graded, iced and packaged before being transferred to processing plants through commission agents [
11]. Small depot owners, typically local residents, buy shrimp from forias or directly from shrimp farms and then sell it to larger depots. They often provide ‘dadon’ (Dadon in Bangladesh refers to a conditional loan provided to small-scale farmers or fishermen by middlemen or traders. This advance payment is typically repaid with future produce, often at disadvantageous terms, creating a cycle of dependency and debt) to farmers and forias under the condition that shrimp are sold to them at prices 5–10% lower than market rates [
11]. In turn, the depots take credit from commission agents who sell to processing plants.
Before the 1997 EU ban, these depots added value to shrimp through de-heading and peeling. However, this activity ceased completely because of the ban, and these processes were transferred to the processing plants [
11,
12]. Bamboo baskets, polythene sheets, or aluminum pots were used in depots to hold shrimp with generally poor icing arrangements. The working conditions were substandard, and many depots did not have proper product markings for traceability. Many depots, especially in remote areas, struggle with access to clean water, leading to poor sanitation practices. The disposal of shrimp head wastes directly into the environment caused pollution and unpleasant odors [
11].
Depots were required to upgrade their premises and improve hygiene and sanitation standards to receive a license from the Department of Fisheries (DOF) in accordance with the Fish and Fish Products (Inspection and Quality Control) Rules, 1997 [
13]. Upgrades included installing running water systems, concrete floors, walls (tiles/mosaic), standardized stainless steel grading tables, hand washing basins, sanitary toilets, plastic storage containers, changing rooms, and staff uniforms [
11,
12]. These upgrades were expensive, costing between USD 2000 and USD 5000 per depot. Many depot owners had to finance these improvements through personal funds, relatives, friends, and local moneylenders [
11].
The journey towards sustainability in shrimp depots faces significant challenges. Many depots suffer from inadequate infrastructure, substandard working conditions, and sanitation issues, which compromise both product quality and environmental integrity [
14]. Consequently, it is imperative to enhance the quality management systems within these depots to mitigate the risks of contamination, spoilage, and non-compliance with regulatory standards [
15,
16,
17].
Despite the economic importance of the shrimp industry in Bangladesh, the literature on their specific quality management practices remains scarce. Previous studies have primarily focused on shrimp farming techniques and economics, environmental impacts, and market trends, leaving a significant gap in understanding depot operations [
1,
14]. This study explores quality management in shrimp depots, focusing on quality testing during procurement, product management, source identification, and improvements in hygiene and sanitation. By addressing these gaps, stakeholders can enhance quality control practices, promoting sustainable growth in the shrimp industry.
2. Material and Methods
The study was conducted through face-to-face interviews with a structured questionnaire and on-site observations and sought to evaluate the efficacy of current quality control measures in selected shrimp depots. The study was carried out between February and May 2022 on 57 shrimp depots across three locations in Bangladesh: 17 depots in Paikgacha, 20 in Dacope, and 20 in Chokoria (
Figure 1).
The sample of 57 depots from three locations is representative of the 878 small and large depots in Bangladesh due to these locations being central hubs for shrimp selling. These areas are strategically significant in the shrimp supply chain, capturing the diversity and operational dynamics of the broader market. Small depots are classified based on criteria such as storage capacity, operational scale, and logistical needs. Typically, small depots operate at the upazila (The upazilas are the second-lowest tier of regional administration in Bangladesh. The government administrative structure is composed of eight divisions, 64 districts, 495 upazilas, and numerous union parishads) level and have limited storage and processing capacities compared to large depots, which are situated at district or divisional levels. The capacity and operational scope of small depots are usually less extensive, focusing on local distribution, whereas large depots handle larger volumes and broader logistical operations. This study specifically examines the characteristics and operations of small depots.
The survey locations, Paikgacha and Chokoria, were chosen in the southwest and southeast parts of Bangladesh, respectively, for their familiarity and accessibility by various transport means. In contrast, Dacope was selected due to its remote position in the far southwest region of Bangladesh, where transport facilities are limited. The depots within each hub were chosen through random selection, which mitigates selection bias reflecting the varied practices and conditions across depots. This approach provides a robust snapshot of the industry, enabling comprehensive analysis and insights that are applicable to the national context.
The questionnaire was designed based on the standards and conditions outlined in the Fish and Fish Products (Inspection and Quality Control) Rules, 1997. It included both close-ended and open-ended questions, organized into four parts. Part A covered general information about the interviewees, depot profiles, including employee details, storage capacity, and buying and selling procedures. Part B focused on shrimp quality and transportation methods. Part C addressed product management, including the use of water and ice, process control, waste management, and hazard analysis. Part D examined quality assurance systems, improvements in depot quality assurance, current conditions, traceability, and record-keeping. In total, the survey comprised 78 questions with 230 variables. The detail information on the questionnaire is provided in the
Supplementary Materials.
All collected information was accumulated, grouped, and interpreted according to the research objectives. Data were analyzed using Microsoft Excel version 2019 and Statistical Package for Social Science (SPSS) version 16.0. The qualitative data analysis process involved coding the responses to open-ended questions and grouping them according to the generated themes. Descriptive statistics, such as mean, frequency distribution, cross-tabulation, and charts were used for quantitative data analysis and presentation.
3. Results
3.1. Profile of the Surveyed Shrimp Depots
The surveyed depots were established between the 1980s and 2000s, with 11 (19.29%) set up during the 1980s, 28 (49.12%) during the 1990s, and 18 (31.57%) during the 2000s. The depots established before 2000 have undergone the most restructuring and upgrades to comply with the EU hygiene and sanitation legislation. All surveyed depots were individually owned. Among the owners, thirty-five (61%) had less than a Secondary School Certificate (SSC) education, eleven (19%) attained SSC level education, and five (9%) achieved a Higher Secondary Certificate education. Six (11%) interviewees completed a bachelor’s degree.
Each depot was typically operated by at least three to four persons, depending on its size and capacity. The owner acted as a manager, supervising the activities and maintaining connections with both upstream and downstream stakeholders of the supply chain. The cashier handled daily transaction accounts, while the grader sorted and graded shrimp by size. During the peak season, the grader was often assisted by additional workers, and some large depots employed a weigher to handle the shrimp before and after grading. In small depots, the owner performed multiple roles. There was no standardized salary scale for all depot workers, and payments varied based on the volume of work and complexity of the tasks. Graders played a crucial role in ensuring the appropriate grade and quality of shrimp and were compensated to secure their trust and commitment.
3.2. Storage Capacity in the Depots
Generally, depots had two separate storage areas for shrimp and ice. The storage capacity varied greatly across the surveyed depots. Shrimp were stored in various containers, including insulated boxes, plastic drums, wooden boxes, and concrete houses. On average, these containers had a storage capacity of 1143 kg. All surveyed depots in Paikgacha and Chokoria had at least one insulated box, with capacities ranging from 100 to 5000 kg. In contrast, only two depots in Dacope had insulated boxes. Notably, two depots in Chokoria each had five insulated boxes, with a storage capacity between 1500 and 5000 kg. Additionally, eight depots in Paikgacha used wooden boxes for storing shrimp. Overall, the depots in Chokoria boasted the largest average storage capacity at 1952 kg while Dacope had the lowest at 321.50 kg.
Table 1 provides detailed information on the shrimp storage capacities of the surveyed depots.
The surveyed depots had separate ice storage capacity ranging from 451 to 1247 kg, with an average capacity of 901.75 kg. The ice was stored in a variety of containers, including insulated boxes, plastic drums, wooden boxes, and built-in concrete houses. In Chokoria, all surveyed depots had insulated boxes with a mean ice storage capacity of 1040 kg. In Paikgacha, nine depots had insulated boxes but with a lower mean capacity of 122.22 kg. No insulated boxes were found in Dacope.
Plastic drums were commonly used in all depots in Paikgacha, with a mean ice storage capacity of 455.88 kg. Wooden boxes were predominantly used in 13 depots in Paikgacha, with an average capacity of 153.84 kg. Built-in concrete houses were primarily used in Paikgacha and Dacope, with mean capacities of 617.65 kg and 464.21 kg, respectively. Overall, depots in Paikgacha had the largest capacity at 1247.06 kg, followed by Chokoria at 1059.00 kg and Dacope at 451.00 kg.
Table 2 provides detailed information on the ice storage capacities of the surveyed depots.
3.3. Sources of Procuring Shrimp
The depots obtained shrimp from several sources, including independent farmers with no strong ties to the depot, contracted farmers who sometimes received conditional loans from depot owners, and primary suppliers (forias). In Paikgacha, all depots purchased shrimp directly from independent farmers at the farm gates. In Dacope, nineteen (95%) depots followed this practice, while in Chokoria, only two (10%) depots did so. Chokoria depots primarily relied on primary suppliers (95%) and contracted farmers (80%) to procure shrimp. In Paikgacha, 70.6% of depots sourced shrimp from primary suppliers (forias).
In addition, some depots acquired shrimp from nearby auction markets. These markets served farmers with small quantities of shrimp, forias, and small depot owners who lacked direct sales agreements with buyers. Typically, small depots brought shrimp to these markets, while larger depots purchased shrimp for resale.
Figure 2 illustrates the shrimp procurement chain used by depots.
3.4. Procurement of Ice
The icing of shrimp began at the depot, where shrimp were sorted, cleaned, graded according to buyer specifications, and iced. Arrangements were then made for their transportation to processing plants. Depots usually procured block ice from local ice factories. Generally, depots did not assess the quality of purchased ice, nor did they send samples to laboratory for quality checks. During transportation, it was observed that ice buyers used local tricycle vans without any coverings or any safety measures, exposing the ice to dust and other contaminants. Ice was crushed either in local ice crushing shops or manually at the depots.
One of the visited ice crushing shops in Paikgacha was in a dilapidated state, with limited space, a roof made from ‘gol pata’ (Gol pata, found in the Sundarbans of Bangladesh, is a type of Nypa palm. Its leaves are widely used for thatching roofs, making mats, and other purposes.) and an old, rusted crushing machine. During the crushing process, rusted metal fragments fell into the ice and were not removed. The staff dressed casually, and hygiene and sanitary practices were almost non-existent.
3.5. Competing for Shrimp
Competition for collecting shrimp was prevalent throughout the supply chain. Key points of competition included securing broodstock supplies, finding buyers for post-larvae, identifying depots willing to purchase shrimp from farmers, and selling shrimp to processing plants. The competition was particularly intense among depots due to the shortage of shrimp at the farm level. To secure shrimp supply, depot owners sometimes compromised on quality by selling contaminated or under-weight shrimp. They were under considerable pressure to maintain a stable supply, as they received conditional loans from commission agents contingent on supplying an agreed-upon quantity of shrimp. Depot owners also provided conditional loans to small-scale traders in exchange for certain quantities of shrimp.
To measure the intensity of competition at the depot level, a competitive intensity index was constructed. The index consisted of three indicators: whether depot owners preferred to source shrimp from areas known for uncontaminated shrimp, whether they offered prices above the market price, and whether they stocked a variety of shrimp sizes to respond flexibility to demand from processing plants.
Table 3 provides details on these indicators.
Table 3 reveals that depot owners in the three locations primarily competed by offering higher prices for shrimp. In addition to price competition, depot owners in Chokoria and Paikgacha also focused on sourcing shrimp from preferred growing areas and maintaining a variety of shrimp sizes and grades. Some depot owners enhanced their competitiveness through cooperative practices, such as sharing ice, money, and auctioned shrimp, and allowing forias to supply shrimp to any depot of their choice. This cooperation often relied on pre-existing kinship ties or long-term relationships within the same business and place.
3.6. Quality Control in Purchased Shrimp
Depot owners assessed the quality of purchased shrimp based on the aesthetic appearance, freshness, and degree of spoilage. This evaluation was conducted through visual and tactile inspections by experienced depot staff. At harvest, shrimp exhibited specific compositional and structural characteristics such as appearance, odor, and texture, which were used to gauge the quality. Body spots and softness were assessed by pressing the head and shell with fingers. The three main criteria for judging quality were color (96.4%), size (87.5%), and softness (71%). Less important criteria included checking for spots (35%) and smell (17.9%). Cleanliness (7.1%) and ice cover (1.8%) were minor factors in the quality assessment.
All depots used multiple criteria to judge the shrimp quality at the time of purchase.
Figure 3 illustrates some of the criteria used by the depots in three locations. Due to the absence of government or buyer requirements for more rigorous quality tests, depots relied on basic tactile and visual techniques for assessing the quality.
3.7. Hazards in Shrimp
Shrimp received in the depots showed evidence of contamination with various foreign materials, including glass, wood, metal, weed, and a substance known as ‘push’. The term ‘push’ had become widely used in shrimp trading areas to refer to adulterated shrimp. To increase the weight and thereby boost profit, some traders inject shrimp with a variety of foreign particles collectively known as ‘push.’ These methods include the following:
Dipping shrimp into melted ice water, alum, or ionized water to increase weight.
Injecting fluid rice gruel or a solution of sago into the veins of the shrimp.
In the past, shrimp had nails injected into them. Nowadays, marble stones are employed to evade metal detectors during packaging in processing plants.
Using a sticky solution extracted from okra to give shrimp a natural color.
The most common form of contamination was ‘push’, found in 87% of the cases, followed by wood at 52% and metal at 46%. All surveyed depots in Paikgacha and 95% of those in Dacope received or purchased shrimp showing evidence of push. In contrast, no evidence of pushed shrimp was found in Chokoria. Regarding wood contaminants, 90% of Dacope depots had received shrimp contaminated with loose wood pieces, compared with 71% in Chokoria and none in Paikgacha.
Figure 4 illustrates the types of hazards found in shrimp across three locations. None of the surveyed depots had any equipment to detect contamination and relied solely on visual observation.
3.8. Product Management
All depots required water for sorting, cleaning, grading, icing, and packing shrimp. In Paikgacha, all depots used tube-well water, as did 13 (65%) depots in Dacope and 18 (90%) depots in Chokoria. In Dacope, seven (35%) depots used pond water, while in Chokoria, two (10%) depots used saltwater from a nearby river. None of the depots conducted any water quality tests prior to using the water.
The use of ice for preserving shrimp varied between 1 and 2 kg of ice per kg of shrimp. All the depots in Paikgacha, 16 (80%) depots in Dacope, and 10 (50%) depots in Chokoria used a 1:1 ice-to-shrimp ratio. Higher ice-to-shrimp ratios were observed in four (20%) depots in Dacope and ten (50%) depots in Chokoria (
Figure 5). In Paikgacha and Dacope, the depots placed ice between each layer of shrimp, while in Chokoria, ice was scattered over the shrimp.
All depots used purchased ice blocks, which were crushed either in wooden boxes at the depot or by an ice crushing shop. The depots were unaware of the quality of the ice they purchased and conducted no quality checks.
The shrimp holding periods varied widely across the surveyed depots, ranging from one to fifteen hours. In Chokoria, 14 (70%) depots held shrimp for the shortest period of one to five hours. In contrast, 10 (59%) depots in Paikgacha and 12 (60%) depots in Dacope held shrimp for 6 to 10 h. Longer holding periods of 11 to 15 h were observed in eight (40%) depots in Dacope and one (5%) depot in Chokoria.
Figure 6 illustrates the shrimp holding periods across the three locations.
3.9. Actions Taken for Poor Quality Shrimp
Depot owners were asked under what conditions they would reject shrimp supplied to them. They responded that they would reject shrimp if they were mishandled, had deteriorated due to irregular electric supply, were not iced for sufficient time, or were damaged. They were also asked about their rejection rates. In Dacope, the average rejection rate was 2.15%, followed by Chokoria at 0.78% and Paikgacha at 0.54%.
Table 4 summarizes the actions taken by most of the surveyed depots when evidence of poor quality, other than from pushed shrimp, was detected.
3.10. Hygiene and Sanitary Conditions
The government standards provided were general and lacked specific detail, leaving it up to inspectors to translate these standards into specific protocols for each depot. For example, one standard stated that the platforms for grading fish should be reasonably high without specifying the exact height. To understand the application of these standards at particular depots, the researcher developed an assessment tool that included government requirements.
The judgment criteria for assessing standards were divided into three levels: satisfactory, needs improvement, and unsatisfactory. Each criterion was measured using a three-point scale (1, 2, and 3) to determine the level of compliance. In some areas, standards were simply assessed as either present or absent.
Table 5 presents the detailed quality assessment of sanitary, hygiene, and safety conditions in the surveyed depots across the three locations.
Table 5 shows that floor construction materials met national standards, with 32 (56.1%) depots having mosaic tiles and 25 (43.9%) depots having cemented floors. Mosaic floors were common in Paikgacha (94.1%), while cemented floors were more prevalent in Chokoria (65%) and Dacope (55%). Overall, floor conditions in the three locations were of good quality, with 91.1% meeting standards and only five (8.9%) depots having ruptured floors.
Contact surfaces were found to be most satisfactory in Paikgacha (100% compliance) and Dacope (95%), while in Chokoria, 50% of the depots needed improvement. Toilet facilities were found 100% satisfactory in Paikgacha, but in Chokoria, 60% of depots were unsatisfactory.
The depot surroundings were 100% satisfactory in Paikgacha, 90% in Dacope, and only 15% in Chokoria. The provision of staff uniforms was inadequate in all three locations, with only four (7.4%) depots having staff in clean uniforms. In Chokoria, 14 (70%) depots had staff wearing poor-quality uniforms, while in Paikgacha, staff at 14 (87.5%) depots wore dirty uniforms.
Evidence of rodents and other pests was found in 25 (46.3%) depots, with the highest level of intensification in Chokoria (70%) and the lowest in Dacope (15%). Additionally, 41 (71.9%) depots did not have a first aid box. Instances of spitting and smoking were high in Dacope (57.9%) but absent in Paikgacha.
In summary, the highest overall compliance was observed in areas of concerns 1, 2, 3, 4, 5, and 8. Variable compliance was found in categories 6, 7, 9, 10, 11, 12, and 13. The lowest compliance was observed in Chokoria depots.
3.11. Source Identification and Record Maintenance
No depots in Paikgacha and Chokoria could specify the exact sources of all purchased shrimp. However, when selling to processing plants, depots could provide information on bulk amounts purchased from a contracted farmer or a reliable foria. Typically, forias purchased shrimp from numerous farms in different locations and mixed them, making it impossible to trace specific shrimp back to individual farms by the time they reached the depots.
Almost all depots kept records of their shrimp sources, documenting the names of forias and buyers, usually processing plants. Among the surveyed depots in Dacope, nine (45%) could identify the source of 40% of their purchased shrimp, while only three (15%) depots could identify the source of 50 to 70% of their shrimp. Depots maintained records of purchases either in written form (65%) or oral (35%), detailing the seller’s name and address, prices per kg, and amounts bought. In addition, depot owners kept the following records in a register book as shown in
Table 6.
The table indicates that records on sanitation schedules were inadequately maintained, and no records were kept on hazard identification or technical assistance received from various agencies, such as DOF and the Bangladesh Frozen Foods Exporters Association. This lack of documentation suggests poor monitoring of records by the competent authorities.
4. Discussion
The findings reveal a complex network of shrimp procurement in the surveyed areas, involving multiple sources and practices. The depots sourced shrimp from independent farmers, contracted farmers, and primary suppliers (forias), with variations in procurement methods across locations. Paikgacha primarily relied on primary suppliers, while Chokoria engaged both primary suppliers and contract farmers, indicating regional differences in procurement strategies. Moreover, the practice of buying shrimp from nearby auction markets added another dimension to the procurement chain, with small depots acting as intermediaries between farmers and larger buyers [
11,
18].
The quality of procured shrimp is crucial for both market competitiveness and consumer safety. However, the study highlights several challenges in ensuring shrimp quality throughout the procurement process. While the depot owners employed visual and tactile inspections to assess the shrimp quality, the reliance on subjective measures leaves room for errors and inconsistencies. Moreover, the presence of contaminants such as glass, wood, metal, and ‘push’ (adulterated shrimp) underscores the need for stricter quality control measures [
14].
The problem of adulterated shrimp, or ‘push’ shrimp, in Bangladesh has become a significant concern within the seafood industry. This fraudulent practice involves enhancing shrimp by injecting substances such as water, gelatin, or other harmful substances to artificially increase their weight and volume [
11,
18]. Research indicates that food adulteration is a severe violation of fundamental human rights, often occurring with impunity [
19]. This practice not only reduces the nutritional value of the shrimp but also poses serious health risks due to potential contamination with harmful pathogens and chemicals [
20,
21].
The adulteration process typically occurs during the handling stages by unscrupulous traders, where such deceptive practices often go unchecked. This not only compromises the quality of the shrimp but also damages Bangladesh’s reputation in international markets, leading to economic losses for exporters. Despite efforts by law enforcement agencies and the Fisheries Department over the past few years to curb shrimp adulteration, dishonest traders continue their unscrupulous practices unabated [
11]. Addressing this issue requires stricter regulations, better enforcement, and increased awareness among producers and consumers to ensure the integrity of shrimp products.
Competitive pressures within the supply chain further complicate quality assurance efforts. Depot owners, under pressure to maintain a stable shrimp supply, may compromise on quality to meet quantity demands. The competitive intensity index illustrates varying competitive strategies among depots, with price offering being a primary competitive factor. However, factors like preferred shrimp growing areas and size/grade variety also influence competitiveness, highlighting the multifaceted nature of competition in the shrimp procurement market [
16].
The study also sheds light on the hygiene and sanitary conditions in shrimp depots, revealing significant gaps in compliance with government standards. While some aspects, such as floor construction and cleanliness of contact surfaces, met national standards in most depots, others, including water purity, handwashing facilities, and pest control, exhibited considerable deficiencies. The presence of pests in nearly half of the surveyed depots poses serious concerns for food safety and hygiene. Similar findings were revealed in other studies [
4,
17,
22], which identified poor-quality non-chlorinated water, lack of personal hygiene maintenance, inadequate drainage and sanitation systems, unscientific holding systems, and poor-quality of ice and ice–shrimp ratios at depots. The discovery of
Salmonella risks from consuming aquaculture-produced shrimp [
23] and the subsequent identification of both
Salmonella and
Escherichia coli in the depots highlight significant issues with infrastructure, sanitation, and contamination at these facilities [
15].
Shrimp was found to be adequately iced in almost all locations. In Dacope, half of the depot holders used a shrimp-to-ice ratio of 2:1, and most depots used block ice, which was crushed into pieces. However, one study observed that some depot holders used minimal ice, maintaining a shrimp-to-ice ratio of 5:1 [
14]. The quality of shrimp purchased from the forias remains a concern, as depot owners instructed their forias or farmers, who had taken credits, not to use ice, believing that adding ice would increase the weight [
11]. As a result, primary suppliers kept the shrimp overnight without ice before delivering them to the depots the next morning. Most of the post-harvest losses, quality deterioration, and product contamination occurred during this period. The extended duration before icing and greater exposure to ambient temperatures led to increased bacterial activity in shrimp muscles [
16]. Delayed icing after harvest resulted in the reduced shelf life for fish and shrimp [
24].
Record-keeping practices in depots play a crucial role in traceability and accountability within the supply chain. Most depot owners documented the sources and quantities of shrimp they purchased from the forias, as well as maintained records of their subsequent sales. The depots faced challenges in tracing the precise origins of the purchased shrimp due to the practice of forias acquiring small quantities from various shrimp farms, amalgamating them, and subsequently distributing them through depots [
11]. In addition, deficiencies were noted in the sanitation schedules and hazard identification protocols. These shortcomings in hygiene practices and hazard recognition could potentially compromise the quality and safety of the shrimp supply chain.
Between 2006 and 2009, a paper-based traceability system was developed, which the Bangladesh government approved for nationwide implementation in the shrimp supply chain [
25]. A coding system was developed to identify individual farms based on a hierarchy of the administrative area. However, the paper-based system faced numerous challenges, including frequent changes in farm ownership, small and fragmented ponds with minimal yield [
25], numerous small suppliers, a complex intermediary network, excessive paperwork [
8], information loss [
26], and insufficient official oversight due to manpower shortages [
25]. In 2016, a computer-based e-traceability system was enhanced using a cluster approach to maintain a comprehensive record of the shrimp supply chain [
27]. The 2023 EU inspection and audit report confirms that Bangladesh’s shrimp supply chain has effective and frequent checks in place. This ensures that the shrimp can be traced and meets EU certification standards from the farm to export [
28].
The sustainability of shrimp depots in Bangladesh is essential for the enduring success of the country’s shrimp industry. Currently, these depots face significant challenges, including inadequate infrastructure, poor sanitation, and high contamination levels. Around 90–95% of shrimp procurement is carried out through supply chain intermediaries, such as foria, small and large depots, auctioneers, and commission agents [
8,
11]. The long chain of intermediaries delays the product from reaching consumers, which harms its quality. Most processors buy shrimp through intermediaries and do not use contract farming, resulting in poor quality control and traceability [
8]. Traceability systems hold producers accountable and help consumers make informed choices about their food [
29]. To achieve sustainability, it is crucial to invest in modernizing depot facilities and implementing stringent hygiene protocols. This includes upgrading storage systems and implementing rigorous hygiene standards. Moreover, training depot workers in best practices for handling and storing shrimp can reduce contamination risks and improve product quality. Adopting sustainable practices such as effective waste management systems and regular health inspections can significantly reduce environmental impact and enhance product safety.
Furthermore, collaboration with governmental and international organizations can provide the necessary resources and expertise. A multifaceted approach that combines infrastructure upgrades, education, and regulatory support will ensure consumer health and safety and bolster the global market competitiveness of Bangladesh’s shrimp industry.
5. Conclusions
The study contributes to sustainability by identifying key areas for improvement in quality management, hygiene, resource management, traceability, and competitive practices within shrimp depots. The findings underscore the importance of enhancing quality control practices to ensure higher quality shrimp, reduce waste, and foster a more sustainable supply chain. Addressing contaminants like adulterated shrimp, wood, and metal improves food safety and also promotes environmental sustainability. Moreover, understanding the competitive landscape and stabilizing shrimp supplies is vital for sustainable economic growth in the industry. Improved hygiene standards, traceability, and record-keeping practices are essential for both environmental and public health sustainability.
By identifying areas for improvement, this research lays the groundwork for strategies to enhance market competitiveness and foster a more sustainable shrimp industry in Bangladesh, benefiting environmental sustainability, economic stability, and public health. Addressing these challenges requires collaborative efforts among stakeholders, including government agencies, depot owners, and farmers, to ensure the sustainability and integrity of the shrimp supply chain.


