Article

Nonlinear Dynamic Analysis of High-Strength Concrete Bridges under Post-Fire Earthquakes Considering Hydrodynamic Effects

1
School of Geomatics and Municipal Engineering, Zhejiang University of Water Resources and Electric Power, Hangzhou 310018, China
2
State Key Laboratory of Coastal and Offshore Engineering, Dalian University of Technology, Dalian 116024, China
3
Institute of Earthquake Engineering, School of Infrastructure Engineering, Dalian University of Technology, Dalian 116024, China
*
Author to whom correspondence should be addressed.
Sustainability 2024, 16(15), 6486; https://doi.org/10.3390/su16156486
Submission received: 18 June 2024 / Revised: 13 July 2024 / Accepted: 23 July 2024 / Published: 29 July 2024

Abstract

:
This study employed the linear interpolation method to ascertain the curve relationship between the elastic modulus and stress of high-strength concrete C60 with temperature, and the nonlinear dynamic analysis of high-strength concrete bridge structures subjected to post-fire earthquake action at varying water levels was subsequently evaluated. It was established that both the hydrodynamic effects and the temperature effects have a considerable impact on the structural dynamic response of bridges. The presence of water has been observed to increase the dynamic response of pier structures. At water levels of 0 m and 10 m, the temperature effect results in a reduction in the fundamental frequencies of acceleration and displacement responses by 73.68% and a decrease in the fundamental frequency of stress responses by 83.33%. At a water level of 20 m, the fundamental frequencies of the acceleration, displacement, and stress responses decrease by 53.49%. In consideration of the acceleration and displacement at the pier top and stress at the pier base at a water depth of 10 m, the superposition of temperature effects and hydrodynamic effects results in an increase of 59.06% in acceleration, 25.93% in displacement, and 49.53% in stress than combination effects, respectively. At a water depth of 20 m, the superposition of temperature and hydrodynamic effects results in an increase of 92.82%, 100%, and 127.85% in acceleration, displacement, and stress, respectively. The combined effects of hydrodynamic and temperature effects cannot be described merely as a linear superposition of the two single actions. The research findings provide a significant theoretical basis for understanding the impact of multiple disasters, such as fires and earthquakes, on bridge structures.

1. Introduction

A bridge is a lifeline project and plays a significant role as a transportation hub [1,2]. However, bridges are often located in extremely complicated circumstances and affected by extreme disasters such as earthquakes and fires [3]. The seismic performance and resistance to collapse of bridge structures have consistently been a subject of research interest [4], with a particular focus on the effects of corrosion [5], fire, and hydrodynamic effects on the seismic performance of bridge structures.
The bridge consists of superstructures and substructures. The pier structure, which is a crucial part of the substructure and whose seismic performance has been extensively investigated [6], is affected by the hydrodynamic effects in the surrounding water. Earthquakes lead to hydrodynamic effects that alter the dynamic characteristics of bridge structures on the basis of structural dynamic response and seismic analysis [7]. Wu et al. [8] studied the seismic performance of deep-water bridge structures and found that the presence of water significantly influences the seismic resistance of bridge structures. Liaw et al. [9] evaluated horizontal earthquakes that led to hydrodynamic effects that influenced the vibration period of a tower. Wang et al. [10,11,12] employed a progressive model, a simplified added mass method, and simplified expressions to evaluate the hydrodynamic pressure on the earthquake response of a column. Liang et al. [13] employed a simplified added mass model to evaluate the effect of hydrodynamic pressure on a hollow pier structure under earthquake action. Guo et al. [14] utilized the simplified added mass method and the Morrison equation to investigate the earthquake response of hydrodynamic pressure in a cylinder. In addition, the influences of hydrodynamic effects under earthquake action on the dynamic analysis of bridge structures have been evaluated via an underwater shaking table [1,2,15,16,17].
The bridge deck structure is subject to fire accidents [18]. Fire has a significant effect on the performance of structural materials. The impact of fire on the static and dynamic behavior of bridge structures is significant [19], and it leads to a series of adverse effects [20]. Temperature changes alter the physical quantities of the linear model [21]. High temperature tests have been carried out on high-performance concrete, and investigations have demonstrated that high temperatures reduce the seismic performance of high-performance concrete shear walls [22]. Seismic analysis of base-isolated structures affected by fire reveals that the occurrence of fire clearly increases the ductility requirements of the structure, which means that the seismic performance of the structure decreases [23]. A dynamic analysis of an office building frame structure in the absence of a fire and after a fire revealed that when the structure is exposed to wind and an earthquake after a fire, the dynamic response of the structure increases [24]. Buildings can be damaged because of the negative effect of fire on the seismic performance of the structure. The seismic performance of simplified reinforced concrete walls after fire exposure was evaluated via correction coefficients. In addition, a thermal analysis of the wall section and a post-fire seismic analysis were combined and analyzed via the SAFIR software and OpenSees software, respectively, and a combined post-fire seismic analysis method for reinforced concrete structural walls was proposed. The test data verified the correctness of the simulation method [25,26,27]. The reinforced concrete frame samples were tested and examined under normal temperature and fire conditions. The performance of the reinforced concrete frame itself decreased after fire, indicating that fire affected the seismic performance of the reinforced concrete structural frame [28]. The changes in the parameters of the concrete-filled double-skin steel pipe columns after fire exposure were examined experimentally, and the seismic performance of the columns after fire exposure was evaluated [29]. The test method was employed to examine the deformation of the concrete-filled steel tubular columns, and the results revealed that the deformation parameters of the concrete-filled steel tubular columns did not change significantly after the fire, but the strength of the steel concrete decreased significantly after the fire. By employing the test method, the correctness of the finite element analysis model was verified, and the post-fire seismic performance of concrete-filled steel tubular columns after fire exposure was examined via the finite element method [30]. For bridge structures, the temperature affects the bridge superstructure, the cables of the bridge, the reinforced concrete deck, etc. [31,32,33]. In addition, the temperature changes the elastic modulus of the bridge material, thereby affecting the frequency of the bridge structure [34]. Fire and earthquakes are two important factors leading to the failure of bridge structures [35].
To date, many current studies have focused on post-earthquake fire resistance and the hydrodynamic effects of bridges. The impact of alterations to the constitutive model of high-strength concrete bridges following a fire on their seismic resilience remains under-researched. This study uses linear interpolation to delineate the evolution of the constitutive model of C60 high-strength concrete after a fire. Subsequently, the study considers varying water levels and investigates the nonlinear dynamic response changes in bridge structures after modifying the constitutive model. The study found that both fire and hydrodynamic effects influence bridges, with hydrodynamic effects having a greater impact than fire effects. The combined effects of the two cannot simply be linearly superimposed. This investigation provides a significant reference for monitoring the seismic performance and health of bridge structures in actual deep-sea engineering environments.

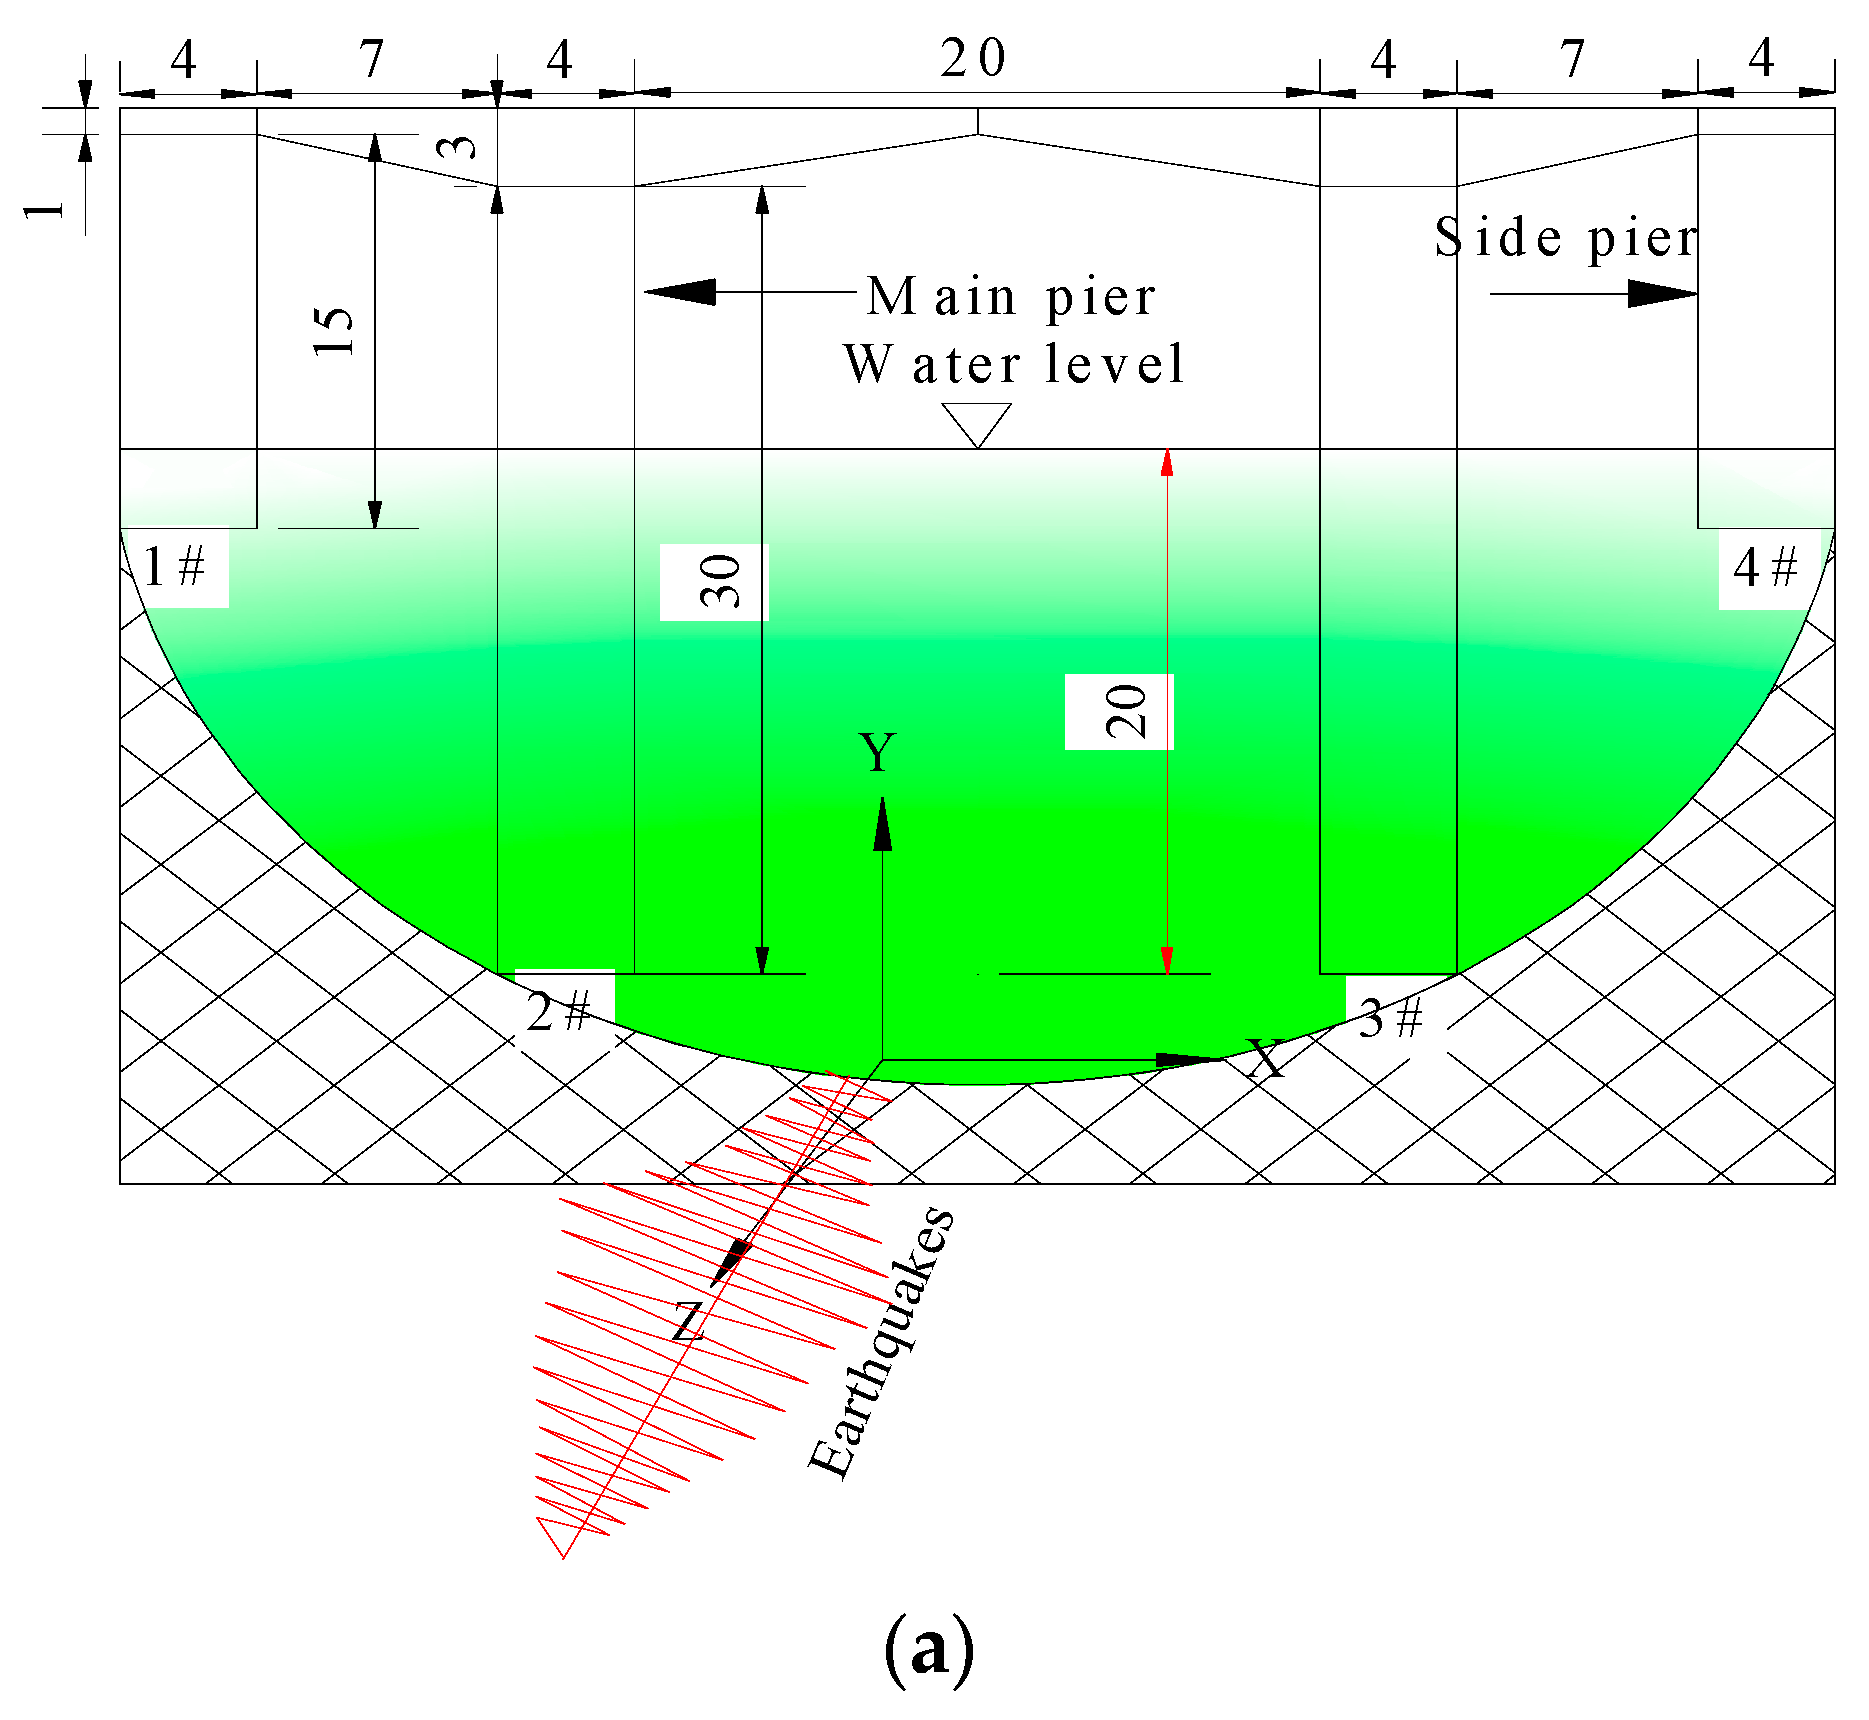
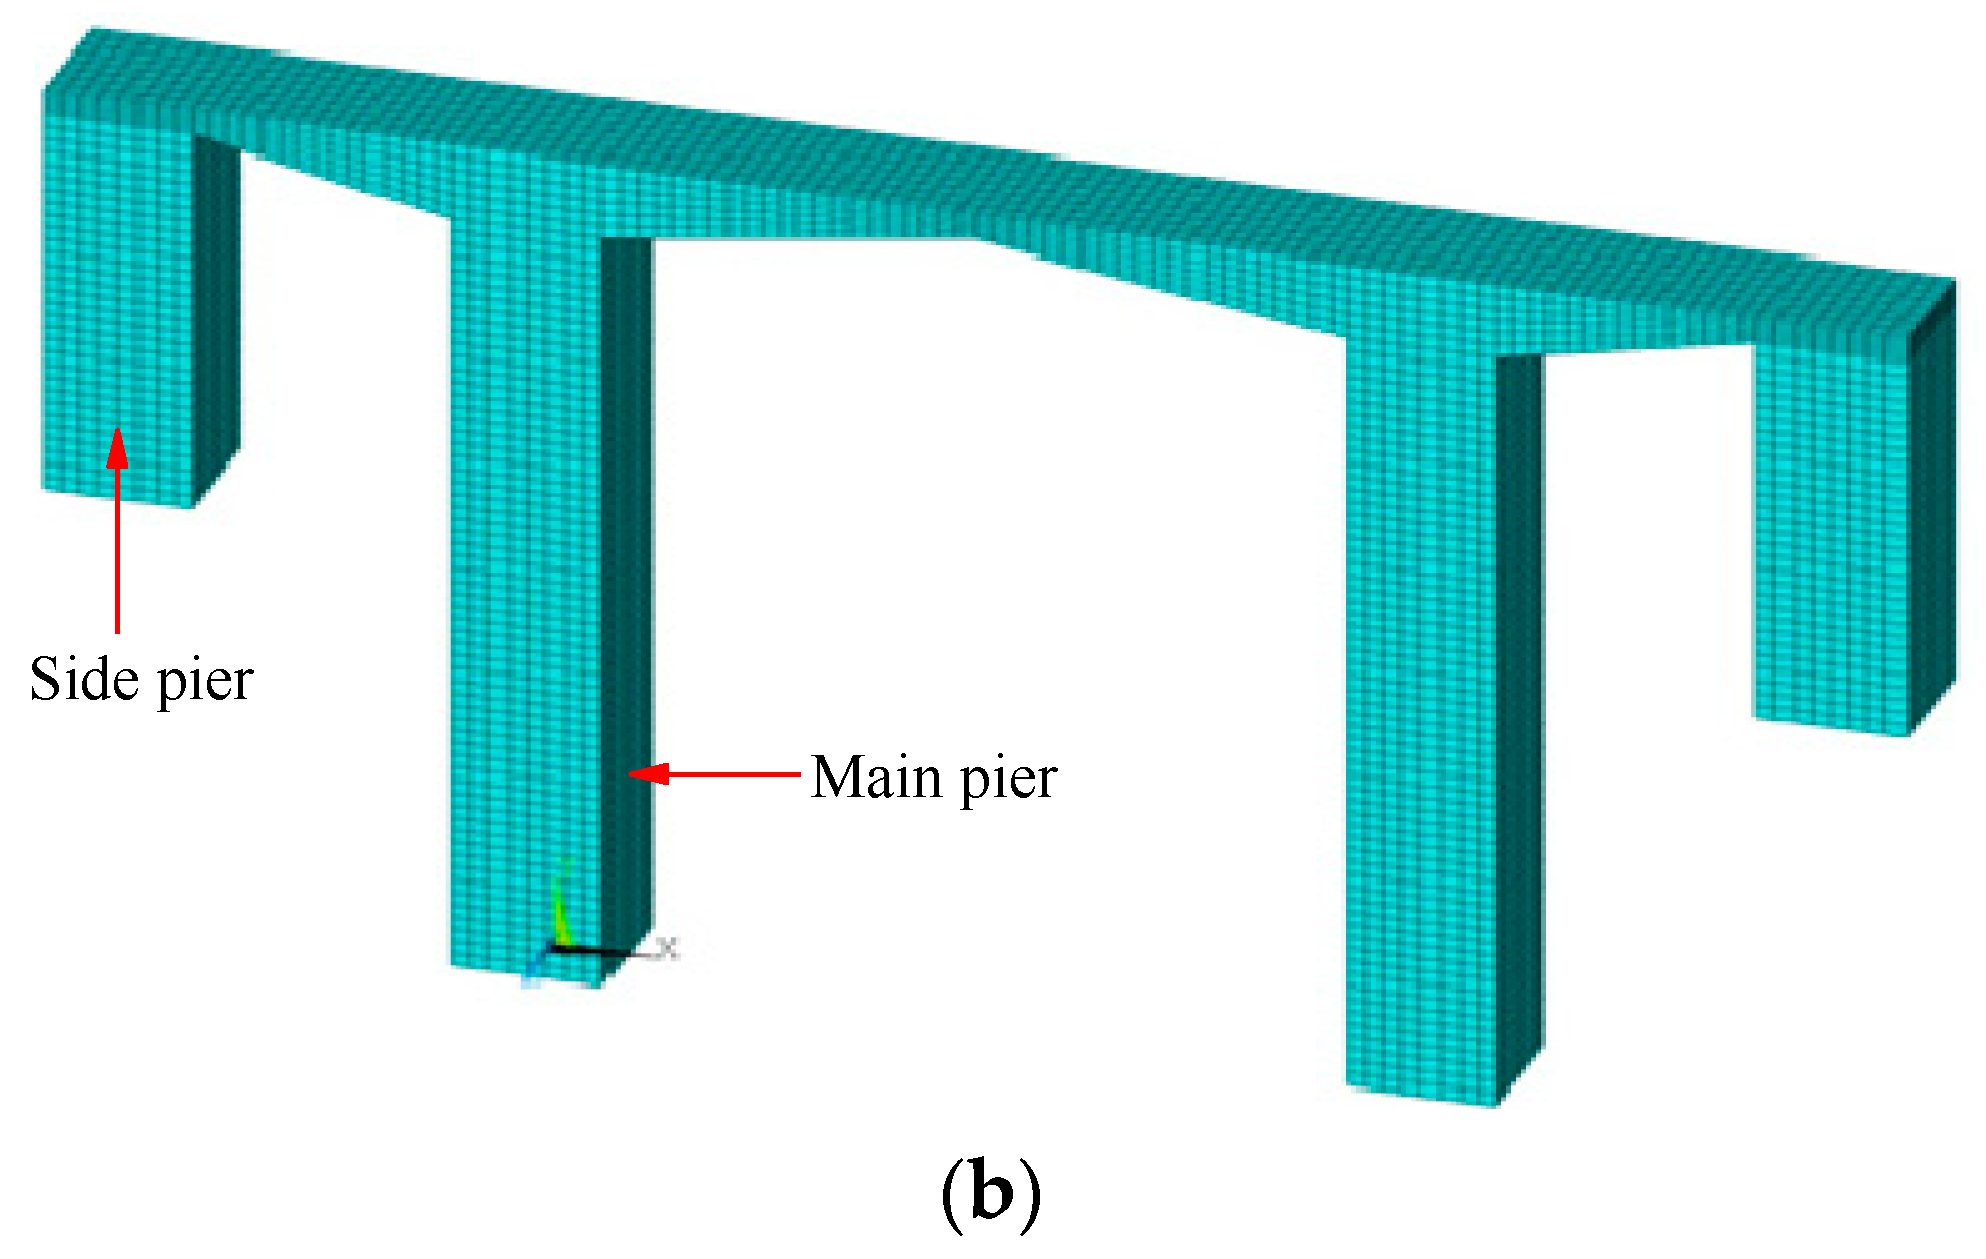
2. Engineering Conditions

The bridge model is adopted for a single fixed bridge with a three-span, cantilever frame. The length of the bridge is 50 m, the height of the main piers is 30 m, and the height of the side piers is 15 m. The total pier section is 4 m × 4 m, and the width of the beam is 13 m. The normal water level is 20 m, the shallow water level is 10 m, and the dry-season water level is 0 m. The bridge uses high-strength C60 concrete. The elastic modulus of the high-strength concrete is 3.6 × 10¹⁰ N/m2; the density is 2500 kg/m3; Poisson’s ratio is 0.2; and the damping ratio is 0.05 [2].
In this investigation, the ANSYS 17 finite element software was used for modeling and calculation, and the SOLID45 element was used to simulate the concrete structure. The bridge finite element model mesh size is 0.2 m, divided into hexahedral elements, with 21,195 nodes and 16,512 elements. Boundary conditions constrain all degrees of freedom at the bottom of the bridge piers. The planar diagram and finite element model diagram of the bridge structure are shown in Figure 1 [2]. This approach utilizes the stress–strain curves of concrete structures; many data points are employed to approximate the input; and the multilinear isotropic strengthening model MISO is utilized to simulate. MISO uses piecewise linear stress–strain curves but employs the isotropic hardening Mises yield criterion. It is typically employed for proportional loading and plastic strain, encompassing multiple temperature curves and stress–strain curves suitable for material nonlinear analysis [36].

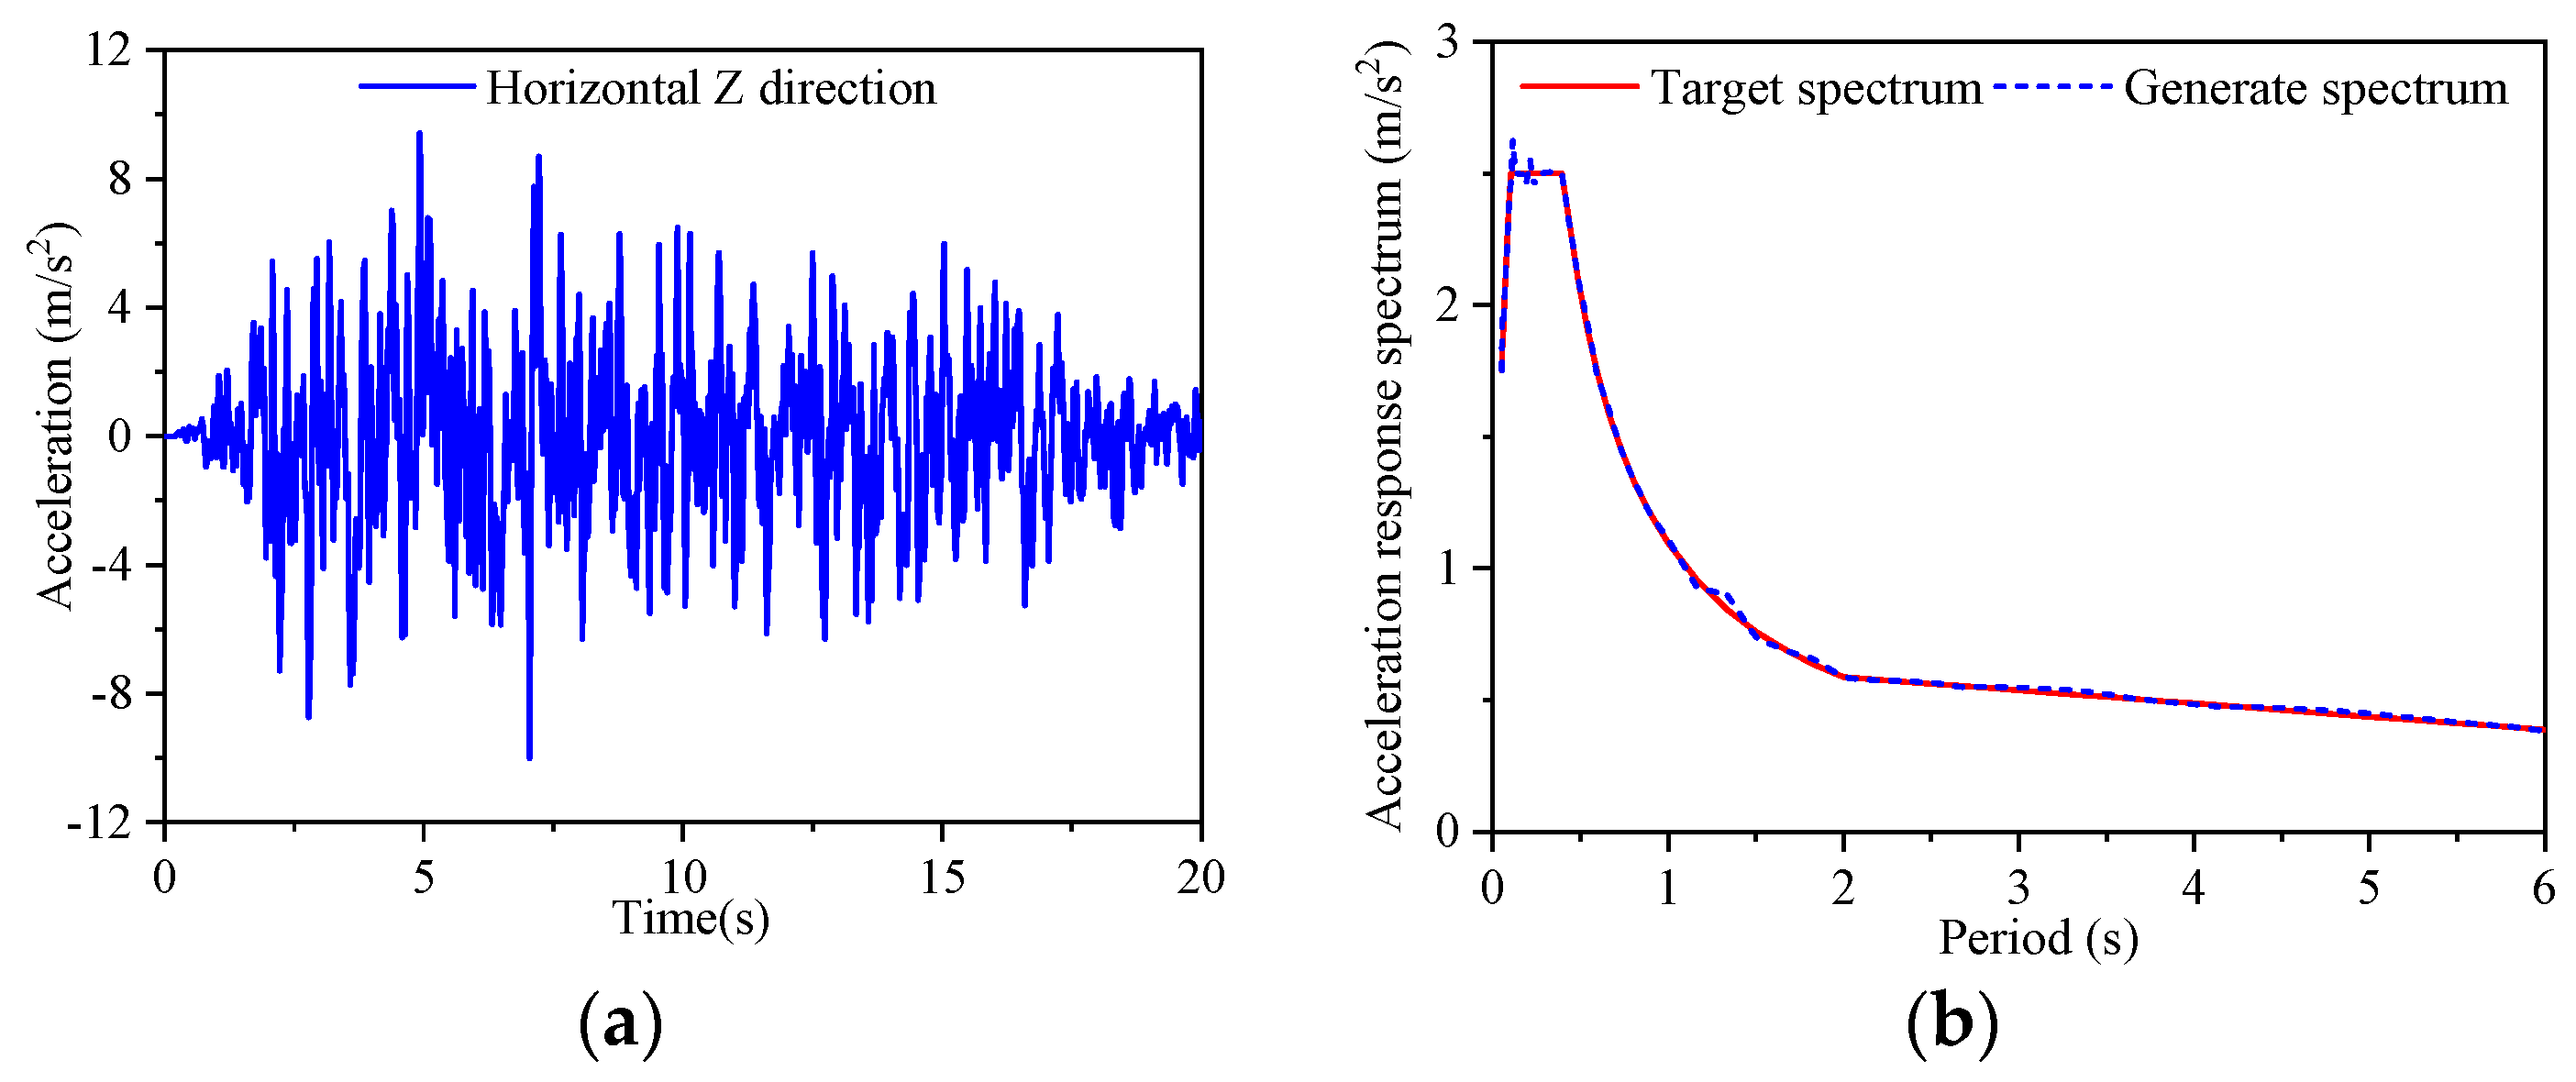
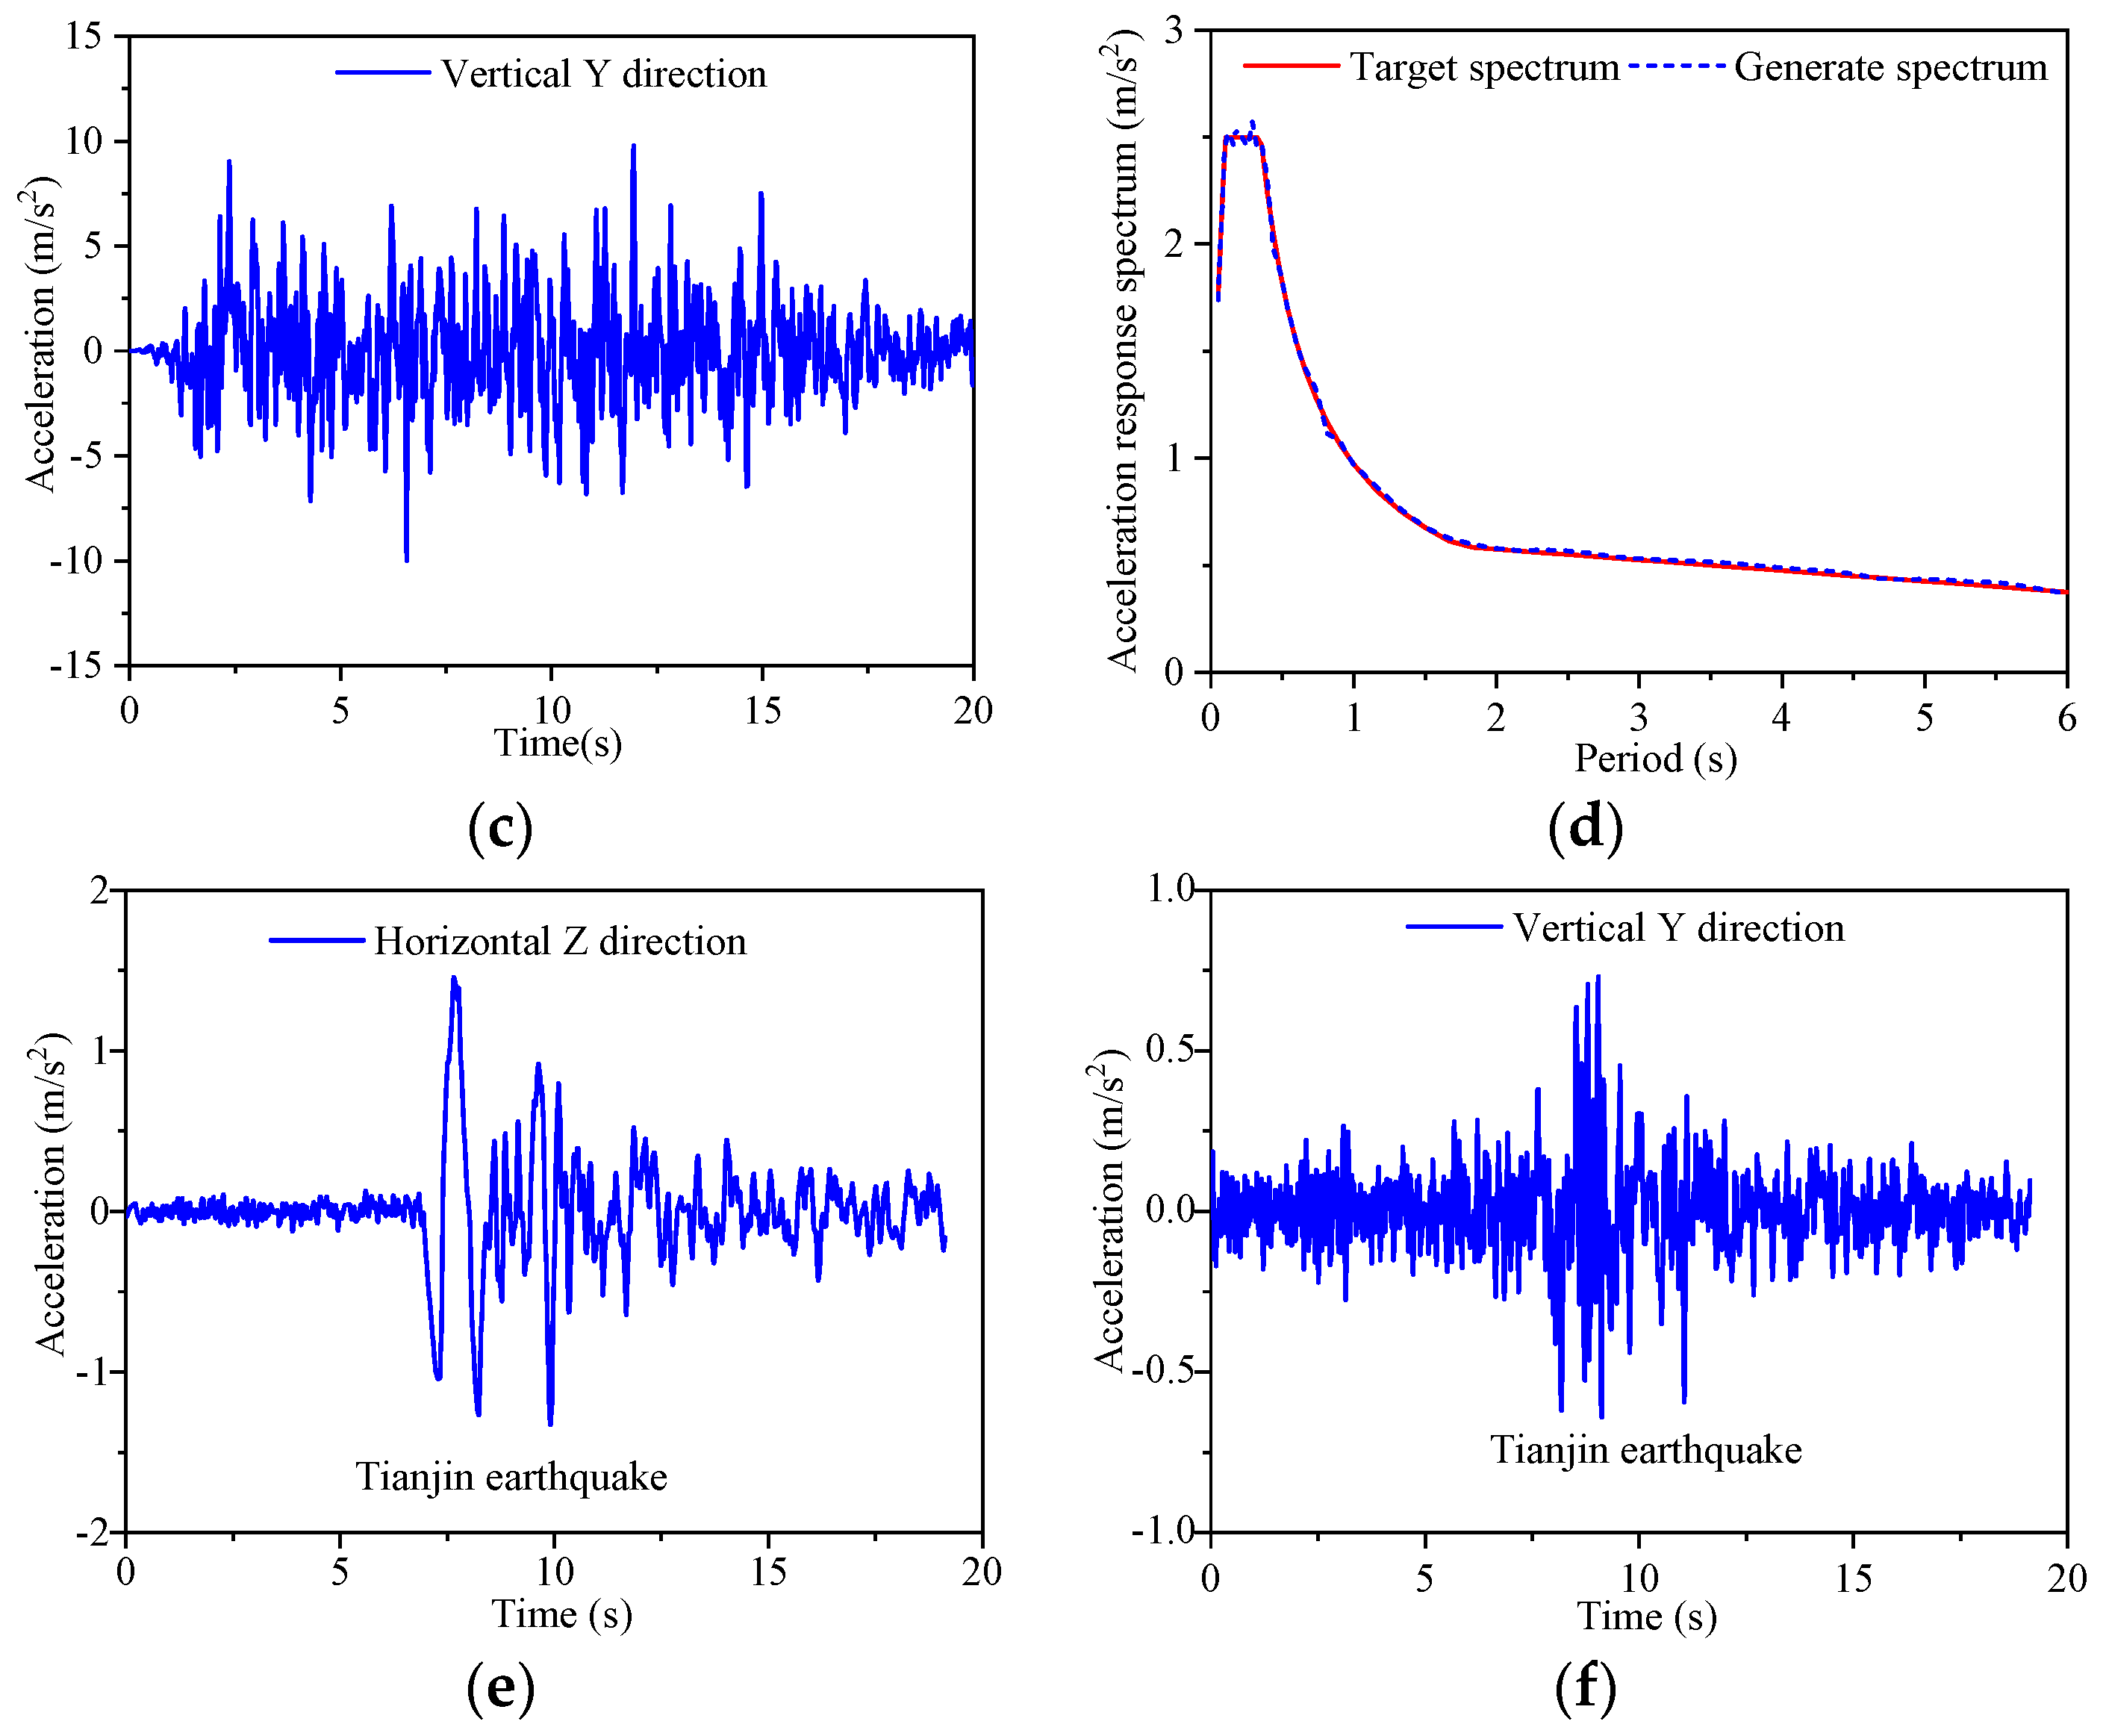
3. Earthquake Selection

This study uses GB 18306-2015 as the target spectrum [37]. The EQSignal software [38,39,40] was used to synthesize earthquakes with a peak acceleration of 10 m/s2, and the earthquakes were input in the horizontal and vertical directions of the bridge model; thus, the horizontal Z direction and vertical Y direction are the input directions as shown in Figure 1. Reference is made to the specification of the amplitude modulation method. The amplitude modulation method is to keep the spectral characteristics and duration of seismic waves unchanged and change the peak values of acceleration of seismic waves [41]. The amplitude-modulated peaks of the two earthquake waves are 4 m/s2 and 2.6 m/s2, respectively. The two earthquake waves are denoted E1 and E2. The characteristics of the input earthquake waves are given in Table 1.
Earthquake wave E1 uses time domain fitting. The mean error of fitting the target spectrum and the response spectrum is 1.94%, and the maximum error is 6.68%. Earthquake wave E2 uses time domain fitting. The mean error between the target spectrum and the response spectrum is 2.07%, and the maximum error is 4.97%. Figure 2 shows the time history and response spectrum of the input earthquakes, as shown in Figure 2b,d, The target spectrum and the generated spectrum are in favorable agreement, indicating that the two synthesized earthquake waves meet the requirements. Figure 2a,c are artificial earthquake waves, and Figure 2e,f are Tianjin earthquake waves, which are the real ground motions [42].

4. Theory of Hydrodynamic Temperature Effects

4.1. Theory of the Hydrodynamic Effects

The hydrodynamic added mass is generally calculated via the Morison equation [43]. The Morison equation is convenient and efficient for calculating the hydrodynamic added mass, which is suitable for small diameter columns. The Morison equation can be simplified to obtain the hydrodynamic pressure per unit length of the cylinder [44,45,46,47,48]:
F = 1 2 C D ρ D | u ˙ x ˙ 0 | ( u ˙ x ˙ 0 ) + ( C M 1 ) ρ π D 2 4 ( u ¨ x ¨ 0 ) + ρ π D 2 4 u ¨
where C D represents the viscous friction resistance coefficient; C M represents the inertia coefficient; ρ represents the density of water; D represents the diameter of the column in the surrounding water; x ˙ 0 and x ¨ 0 represents the structure particle velocities and accelerations, respectively; and u ˙ , u ¨ represent the water particle velocities and accelerations, respectively.
Since earthquake action is short-term motion, the velocity of water can be ignored relative to the vibration velocity of the structure. That is, the water is assumed to be still, therefore, u ˙ and u ¨ are 0.
Then, Formula (1) becomes [44,49,50]:
F = 1 2 C D ρ D | x ˙ 0 | ( x ˙ 0 ) ( C M 1 ) ρ π D 2 4 ( x ¨ 0 )
The hydrodynamic added mass is as follows:
M = ( C M 1 ) ρ π D 2 4
The expression of the hydrodynamic added mass is generally derived from the cylindrical structure, and the hydrodynamic added mass of the rectangular section needs to be obtained by the section correction coefficient. Yang et al. [44,45,49,50] proposed the correction coefficient for the rectangular sections through experimental and theoretical examines:
K c = 1.51 ( D / B ) 0.17
where D is the length of the rectangular section in the identical direction as the earthquake action; and where B is the length of the rectangular section in another direction.
The hydrodynamic added mass per unit height of the rectangular section isas follows:
m = K c ρ π D 2 4
Substituting Formula (4) into (5) yields the hydrodynamic added mass of the rectangular section per unit height:
m = 1.51 ( D / B ) 0.17 ρ π D 2 4
Then, the hydrodynamic effect can be expressed as:
R i = R i w a t e r R i a i r R i a i r × 100 %
where R represents the dynamic response, R i w a t e r represents the surrounding, R i a i r represents the surrounding air, and i represent the acceleration, displacement, shear stress, bending moment, etc. The temperature effect are identical.

4.2. Theory of the Temperature Effect

The temperature effect is heat conduction, assuming that the concrete material is uniform, continuous and isotropic [51]. According to Fourier’s law and the law of conservation of energy, the differential equation of heat conduction is expressed as [51,52]:
λ ( 2 T x 2 + 2 T y 2 + 2 T z 2 ) + ϕ = ρ c o n c T t
where λ represents the thermal conductivity coefficient (W/(m × °C)), T represents the temperature (°C), x , y , and z represent the spatial coordinates, ρ c o n represents the density of the concrete (kg/m3), c represents the specific heat (J/(kg × °C)), t represents the time (s), and ϕ represents the heat generated by the internal heat source per unit volume per unit time.
The thermal conductivity partial differential equation establishes the spatiotemporal relationship of the internal temperature of the structure, then the temperature field can be expressed as [52]:
T ( x , y , z , t ) | t = 0 = T 0 ( x , y , z )

5. Results

Recently, there has been less research on high-strength concrete with increasing temperature. Wu et al. [53] used tests to evaluate C70 and C85 high-strength concrete, evaluated the performance changes after firing, and compared the performance of common concrete at high temperatures. According to the research results of Wu et al. [53], the mean strength losses of C70 and C85 high-strength concrete at 500 °C are 63.2% and 49.2%, respectively [53]. The linear interpolation method was used to calculate the mean strength loss of C60 high-strength concrete at 500 °C, which was 74.4%. The material properties of C60 high-strength concrete were calculated according to the formula proposed by Wu et al. According to the literature [53,54], this study proposes that the peak stress of C60 high-strength concrete with temperature change is as follows:
f c ( T ) f c = { 0.05848 ( T 100 ) + 1.00248 ( 20   ° C T 400   ° C ) 0.51256 ( T 100 ) + 2.8188 ( 400   ° C T 500   ° C )
where f c ( T ) represents the peak stress after the temperature change, and where f c represents the peak stress before the temperature change.
The expression of the elastic modulus of C60 high-strength concrete with temperature change is as following:
E c ( T ) E c = { 0.07842 ( T 100 ) + 1.01352 ( 20   ° C T 400   ° C ) 0.513672 ( T 100 ) + 2.77236 ( 400   ° C T 500   ° C )
where E c ( T ) represents the elastic modulus after the temperature changes, and where E c represents the elastic modulus before the temperature changes.
Wu et al. [55] conduct tests on C40 and C60 concrete and obtain the expression of the elastic modulus of C40 and C60 with temperature change:
E c ( T ) E c = 1.027 1.335 ( T 1000 ) ( T 200   ° C )
When T = 30 °C, from Equation (11), the following can be obtained: E c ( T ) E c = 0.989994, from Equation (12), E c ( T ) E c = 0.98695; the error of the two formulas is 0.308%; and the errors of Equations (11) and (12) are extremely small, which proves the accuracy of the derived Equation (11).
Li et al. [56] experimentally derived the expression of the elastic modulus of common concrete with temperature change:
E c ( T ) E c = { 1 ( 20   ° C T 60   ° C ) 0.83 0.0011 T ( 60   ° C T 700 ° C )
Chang et al. [57], according to the test, the expressions of the elastic modulus and compressive strength of common concrete with respect to temperature change are as follows:
E c ( T ) E c = { 0.00165 T + 1.033 ( 20   ° C T 125   ° C ) 1 1.2 + 18 ( 0.0015 T ) 4.5 ( 125   ° C T 800   ° C )
f c ( T ) f c = { 0.00055 T + 1.01 ( 20   ° C T 200   ° C ) 0.00125 T + 1.15 ( 200   ° C T 800   ° C )
Figure 3 demonstrates the relationship between the concrete properties and temperature.
As illustrated in Figure 3a, in Equations (13) and (14), the modulus of elasticity shows a certain decreasing trend with increasing temperature, which is a linear relationship. In Equation (11), when the temperature is 0–400 °C, the modulus of elasticity shows a linear relationship with the increase in temperature, and when the temperature exceeds 400 °C, the modulus of elasticity decreases sharply with increasing temperature, indicating that before the critical temperature, the decrease rate of the modulus of elasticity of common concrete is greater than that of high-strength concrete, and that, after the critical temperature is exceeded, the decrease rate of the modulus of elasticity of high-strength concrete is significantly greater than that of common concrete. As shown in Figure 3b, the change in the peak stress of the concrete with temperature is consistent with the change in the elastic modulus with temperature. The main reason is that the material of the concrete structure itself has been determined, and the elastic modulus is related to the composition of the material. As the temperature increases, owing to the thermal expansion properties of the material, the internal structure of the concrete and the volume occupied by each material change, and the structural properties of the concrete also change. When the temperature is low, the microscopic change in the material has less of an effect on the performance, and as the temperature increases, the internal structure of the material changes more obviously, and the change in performance of the concrete material becomes more obvious [58].
Figure 4 shows the relationship among the stress–strain curves of the concrete materials at different temperatures. As illustrated in Figure 4, when the temperature is 30 °C, the stress–strain relationship curve is almost identical to that at 0 °C, indicating that at low temperatures, the mechanical properties of the structural material are less affected. When the temperature is 500 °C, the difference between the stress and strain curves at 0 °C is greater, which is significantly smaller than the stress at 0 °C, indicating that when the temperature is higher, the mechanical properties of the structural material have a greater effect.

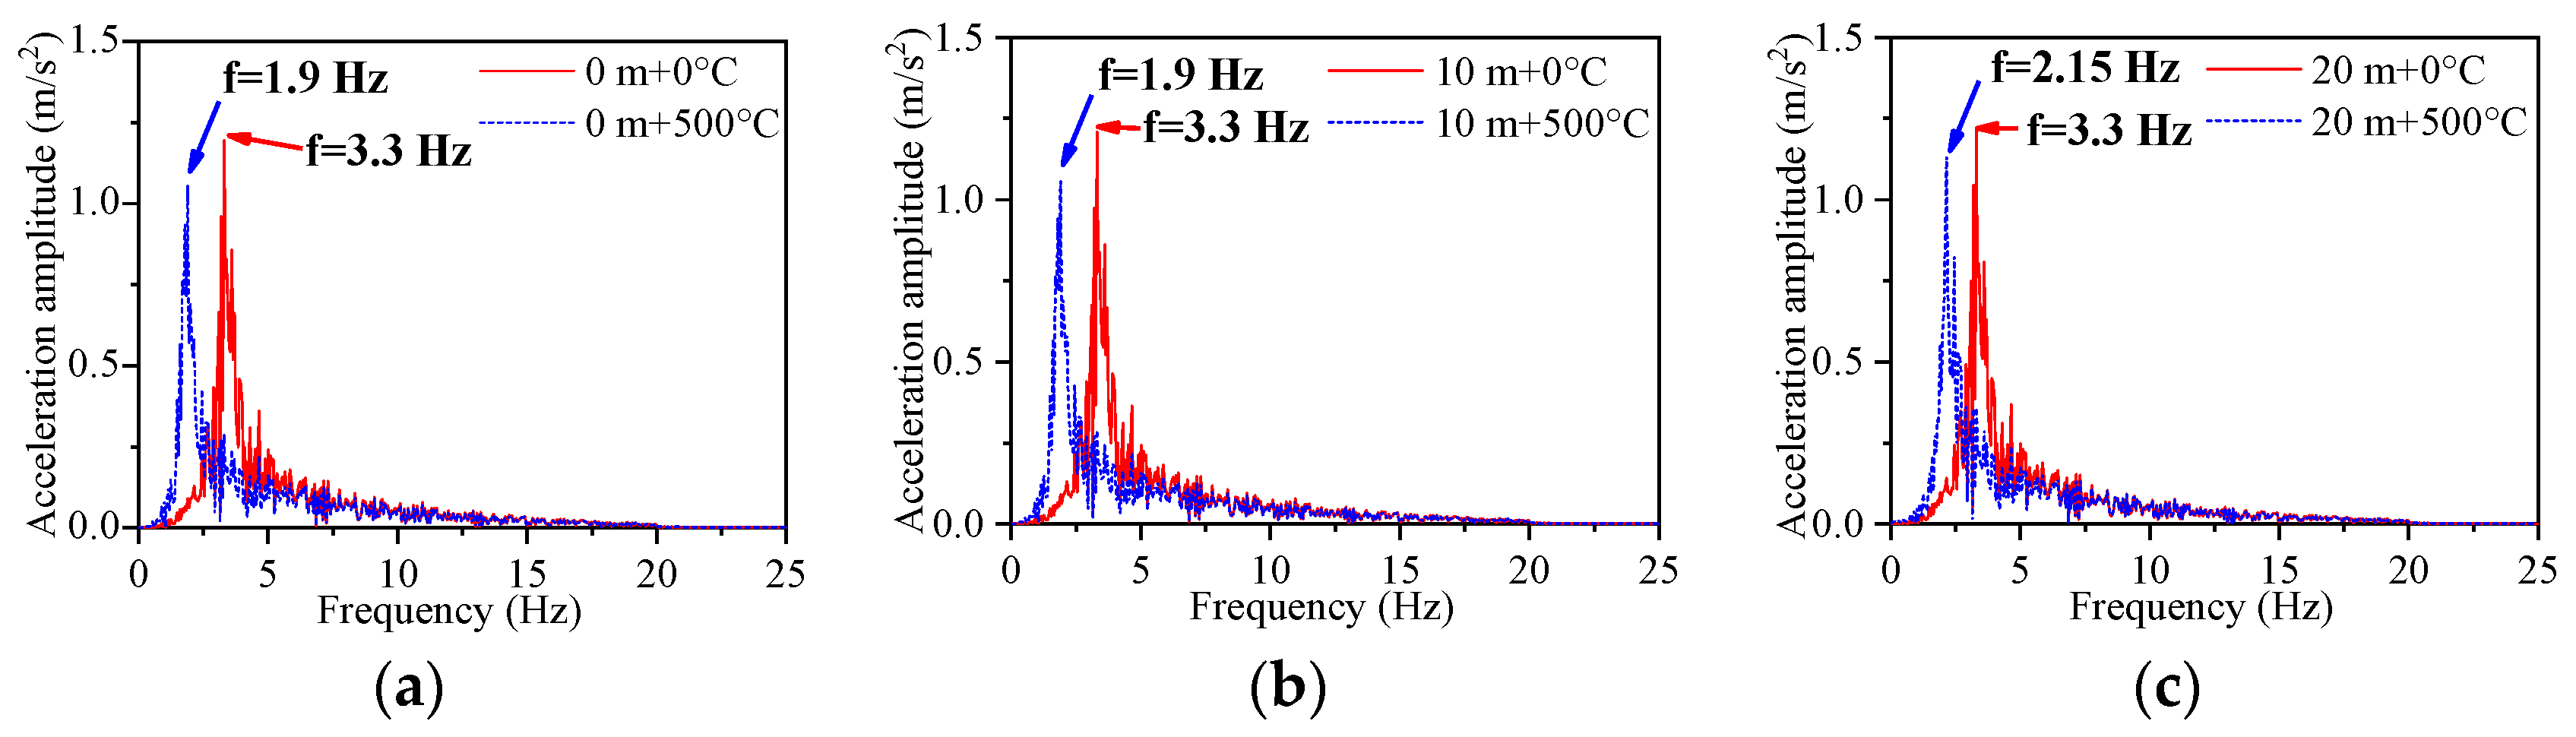
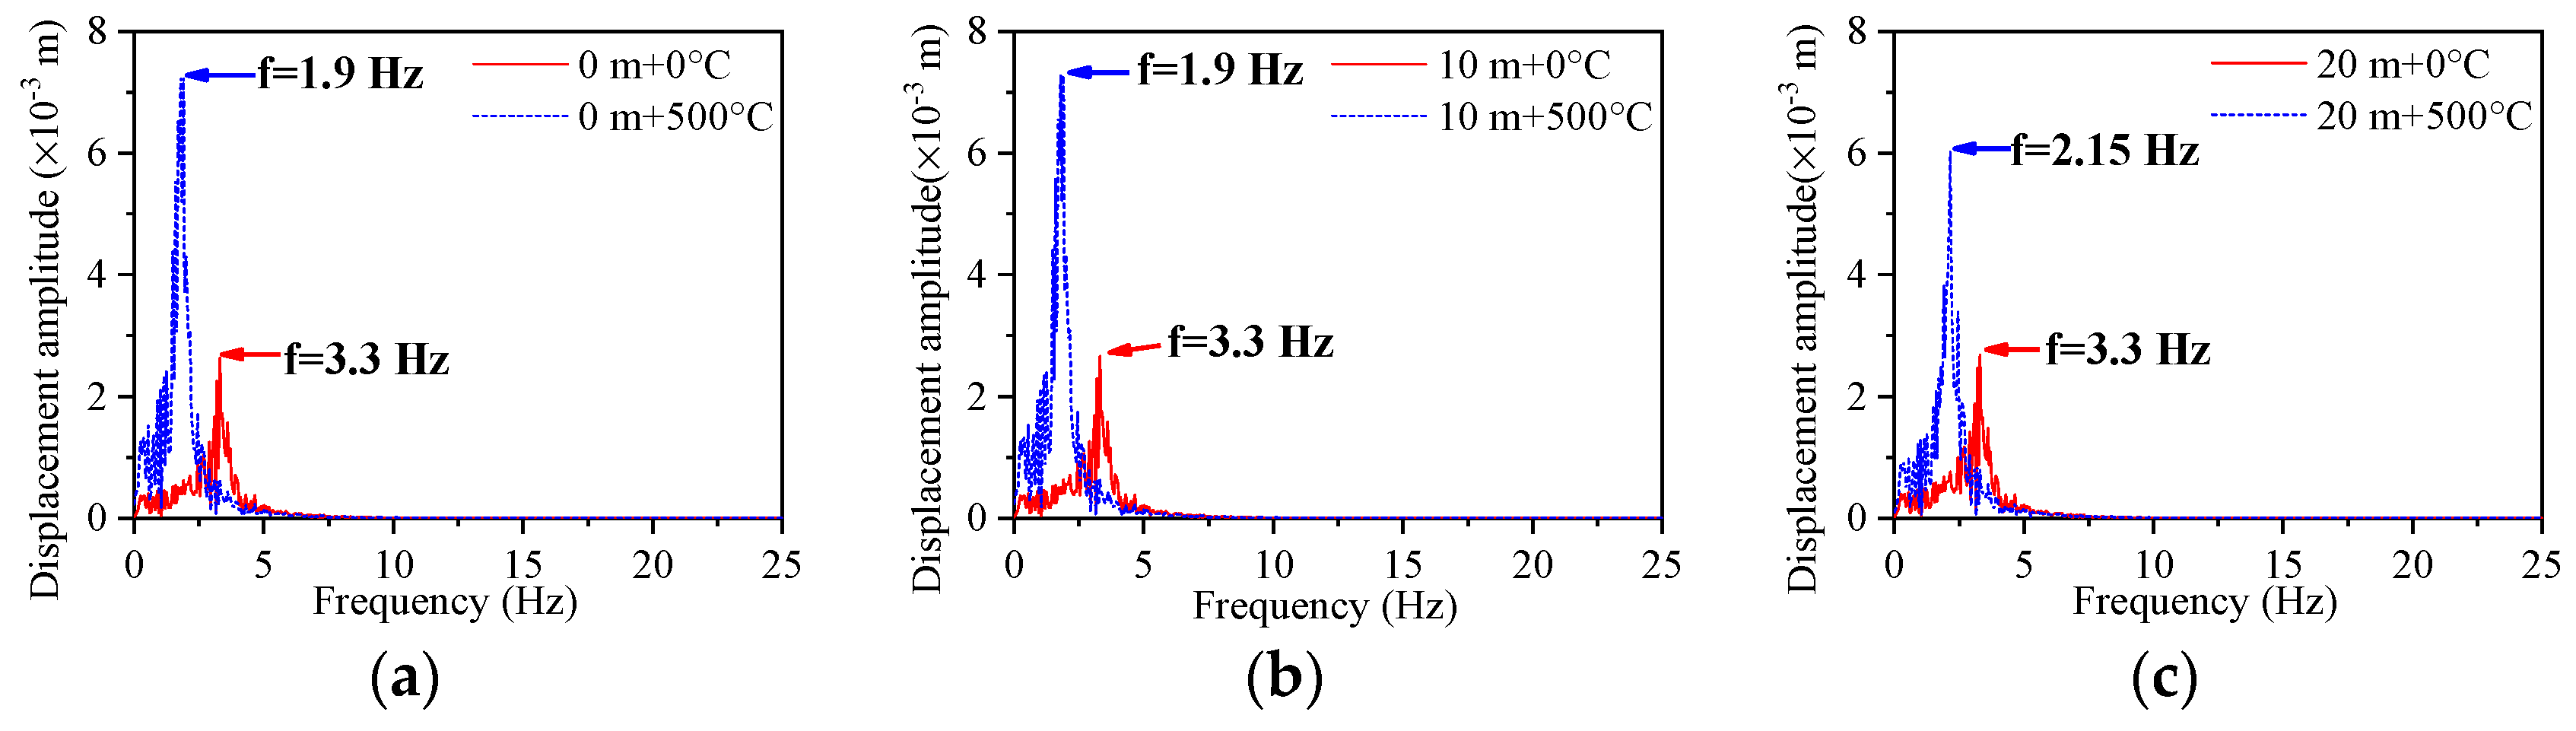
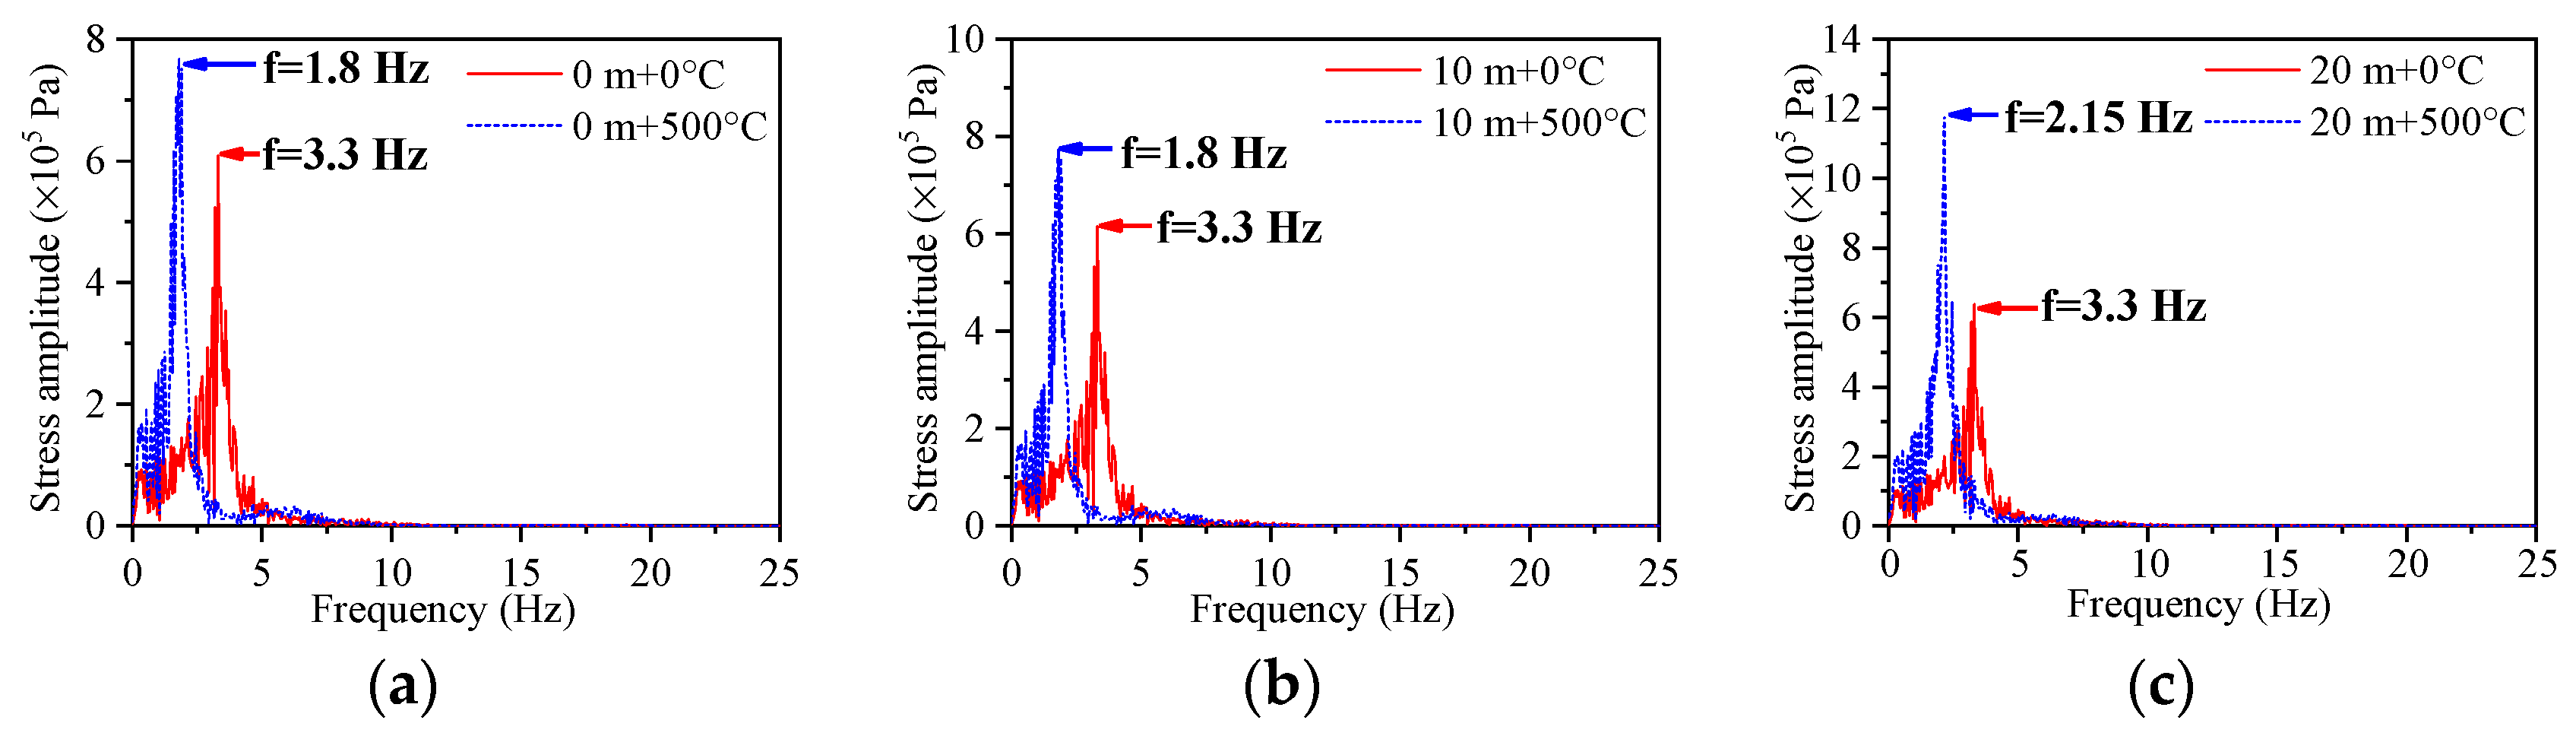
5.1. The Frequency Analysis

Figure 5 demonstrates the frequency of the bridge at various water depths and temperatures. The order refers to the number of eigenvalues; ordering the eigenvalues from smallest to largest is the order.
As illustrated in Figure 5, when the temperature is between 0 °C and 30 °C, regardless of the depth of the water, the frequency values and change laws of 0 °C and 30 °C are identical. The frequency of the 20 m water level is lower than that of the 0 m and 10 m water levels. At a temperature of 500 °C, the frequency of the 20 m water level is greater than that of the 0 m and 10 m water levels. The frequencies at 0 °C and 30 °C are significantly higher than those at 500 °C. Water and temperature clearly affect the dynamic performance of a bridge pier. This is complicated because the presence of water and temperature affect the dynamic analysis of a bridge. If the temperature is high, the stiffness of the bridge pier structure is significantly affected, and the dynamic characteristics of the bridge pier structure are subsequently affected. Various water levels possess different effects on the dynamic performance of a bridge pier structure.

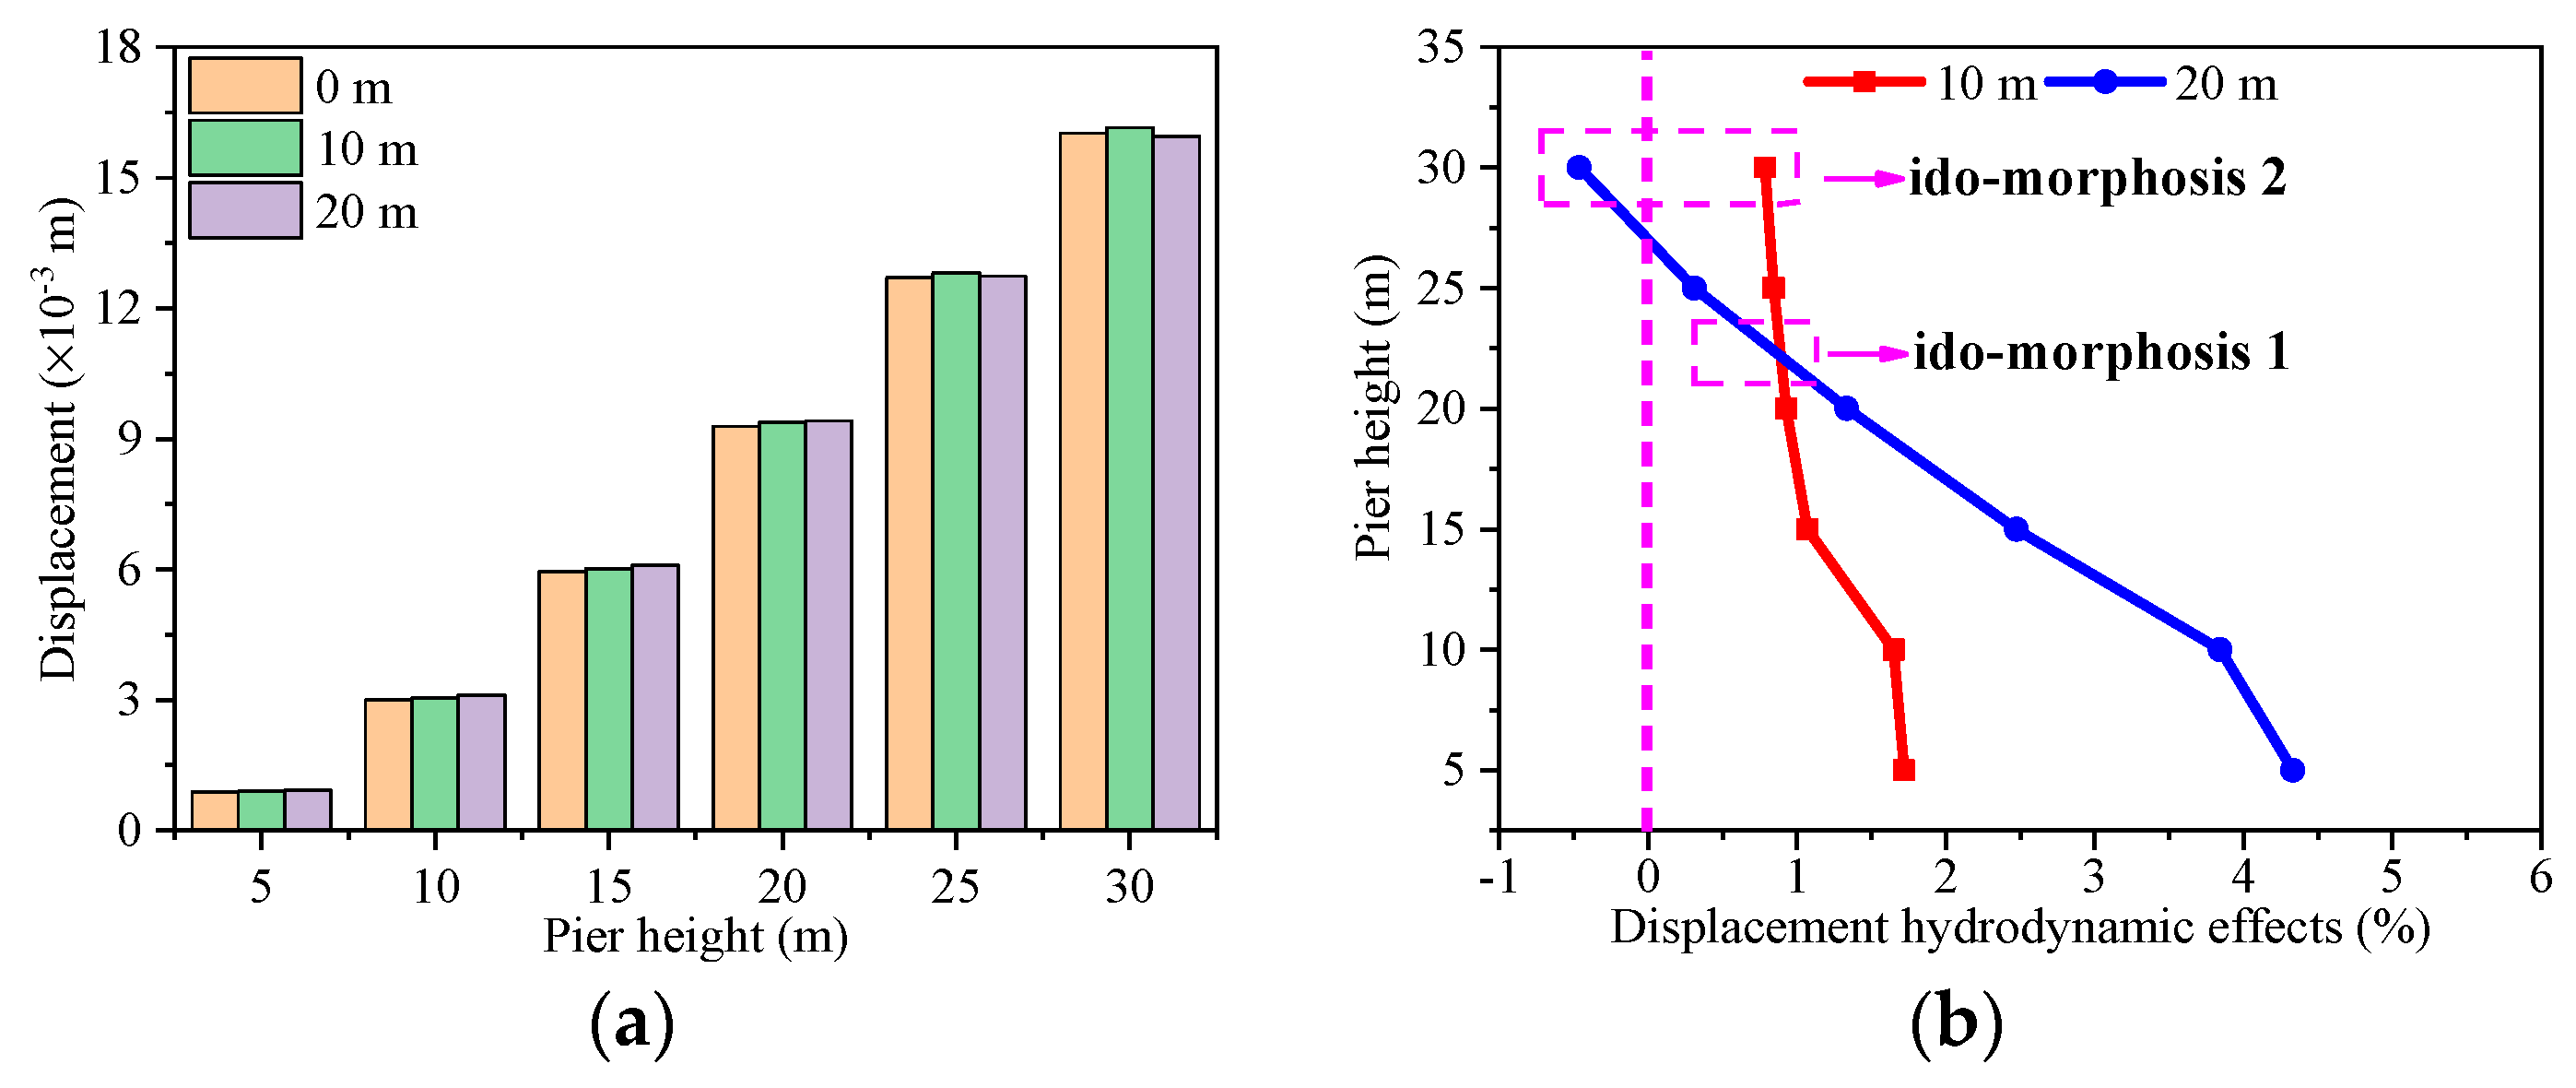
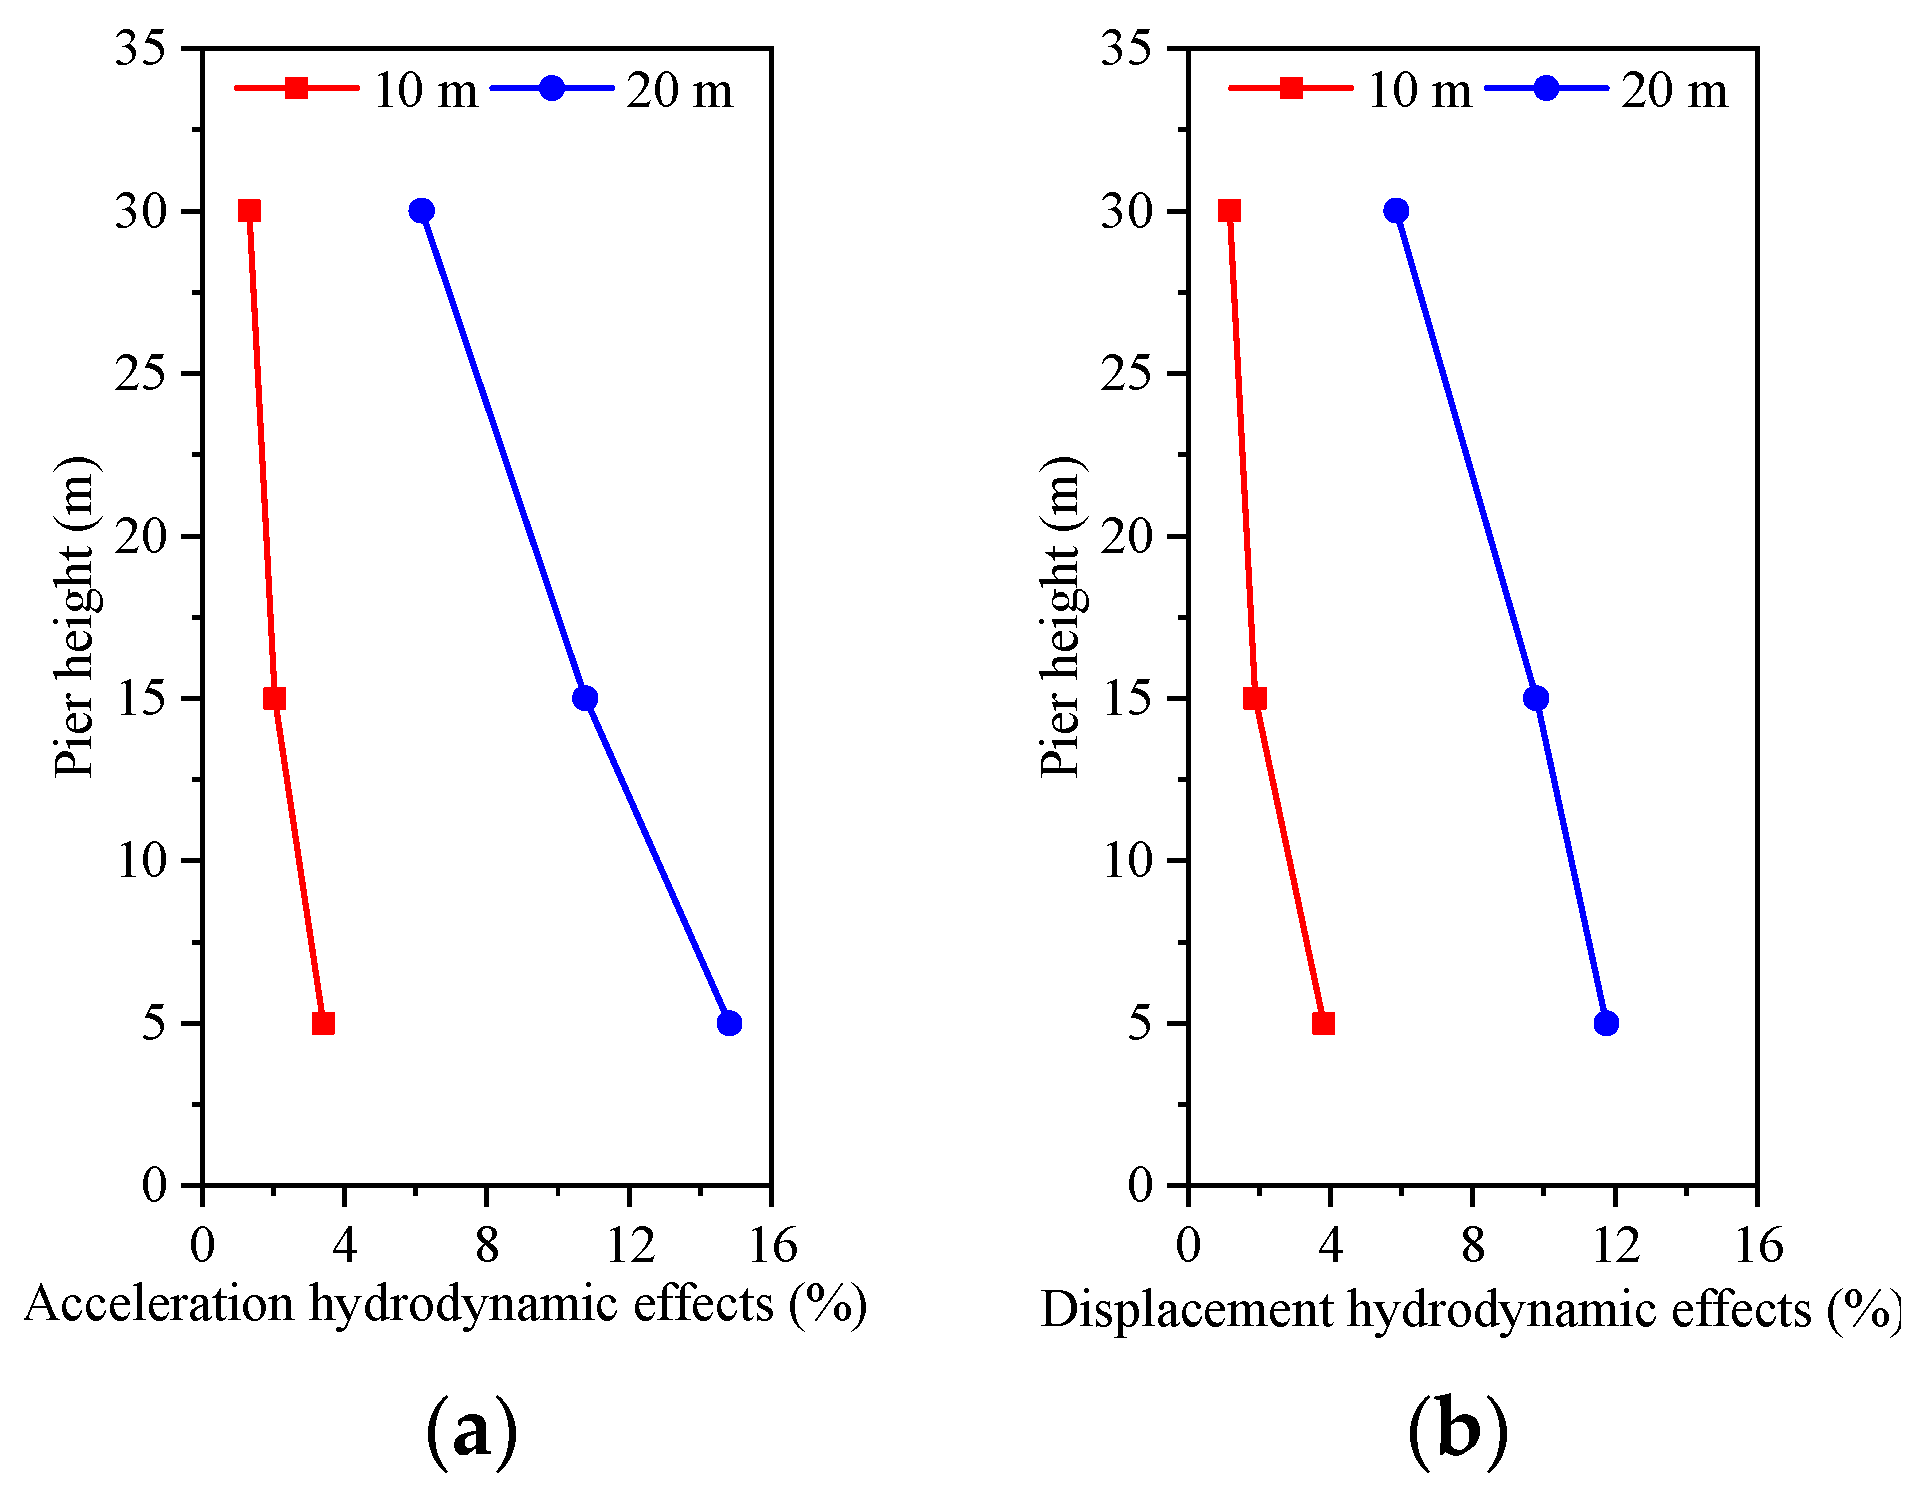
5.2. The Hydrodynamic Effects Analysis

Figure 6 and Figure 7 show the histograms and hydrodynamic effect diagrams of the acceleration and displacement of the side piers under artificial earthquake waves, respectively.
As shown in Figure 6, the acceleration value of the side pier increases with the height of the bridge pier. The acceleration value extracted from the 10 m water level is greater than that extracted from the 20 m water level and the 0 m water level. The presence of the surrounding water increases the acceleration value of the bridge-side pier structure. As illustrated in Figure 7, the displacement value of the bridge side pier increases with the height of the bridge side pier, and the displacement value obtained from the 10 m water level is greater than that obtained from the 20 m water level and the 0 m water level. The presence of the water surroundings at the 10 m water level increases the displacement value of the bridge side pier structure, but the presence of the water surroundings at the 20 m water level reduces the displacement values of the bridge side pier structure. Except for the bottom of the side pier, the hydrodynamic effect of water on the acceleration and displacement of the side pier is a vertical linear distribution with the increasing height of the bridge pier, and the values of the hydrodynamic effect produced by the water on the side pier structure still increase with increasing pier height. The different locations are all close to each other.
Figure 8 and Figure 9 illustrate the acceleration values and displacement values of the main pier at different water levels under artificial earthquake waves, respectively.
As illustrated in Figure 8, the acceleration response values of the main pier increase as the height of the pier increases. The acceleration response values at the 10 m water level are greater than those at the 0 m water level and 20 m water level. When the main pier height is 20 m, the acceleration response values at the 20 m water level are greater than those at the 10 m water level. The acceleration value illustrates that the water exerts an external force on the bridge pier structure at a water level of 20 m. The hydrodynamic effect of the acceleration decreases with increasing height of the bridge pier, which is extremely separate from the change law of the side pier. At the top of the main bridge pier, the acceleration values at the 20 m water level are the lowest, which is less than at the 0 m water level and 10 m water level. At the 0 m and 20 m water levels, the acceleration time history curves of the central part of the main pier are close.
As illustrated in Figure 9, the displacement response of the main pier increases as the pier height increases. When the pier height is 0–20 m, the displacement-dynamic response of the 20 m water level is greater than that of the 0 m and 10 m water levels. When the main pier height exceeds 20 m, the displacement response values at the water level of 20 m decrease, and the displacement response values of the water level of less than 10 m at the beginning and at the top of the pier are considerably less than the displacement response of the 0 m water level. The hydrodynamic effect of the horizontal displacement decreases with increasing height of the main pier, which is extremely separate from the variation law of displacement of the side piers. The displacement time history curves of the 0 m water level and the 20 m water level are identical.
The main reason is that the effect of water on the structure is predominantly inertial force and damping force. When the water level is low, the damping force plays a limited role, predominantly because of the effects of the inertial force, increasing the dynamic analysis of the bridge structure. When the water level is deep, the damping force will be effective, and the damping force generated by the water will be even greater than the inertial force generated, thereby reducing the dynamic value of the bridge structure and inevitably affecting the top of the bridge pier. In addition, the dynamic value analysis law of the bridge structure is relevant to the performance of the bridge structure and the input earthquake wave spectrum characteristics. Therefore, the impact of hydrodynamic effects on the dynamic value analysis of the bridge structure is extremely complicated [1].
Figure 10 illustrates the acceleration values and displacement values of the hydrodynamic effects of the bridge main pier at different water levels under Tianjin earthquake wave action.
As illustrated in Figure 10, the dynamic response of acceleration and displacement increases as the water level increases, indicating that the water always acts as an inertial force under the Tianjin wave action. Compared with Figure 8b and Figure 9b, the results obtained by artificial earthquake waves are inconsistent. These findings indicate that different earthquake waves act on bridge structures and that different spectral characteristics result in different hydrodynamic effects. The law of hydrodynamic effects obtained from artificial earthquake waves is extremely complicated, whereas the law of hydrodynamic effects obtained from Tianjin earthquake waves is relatively simple.

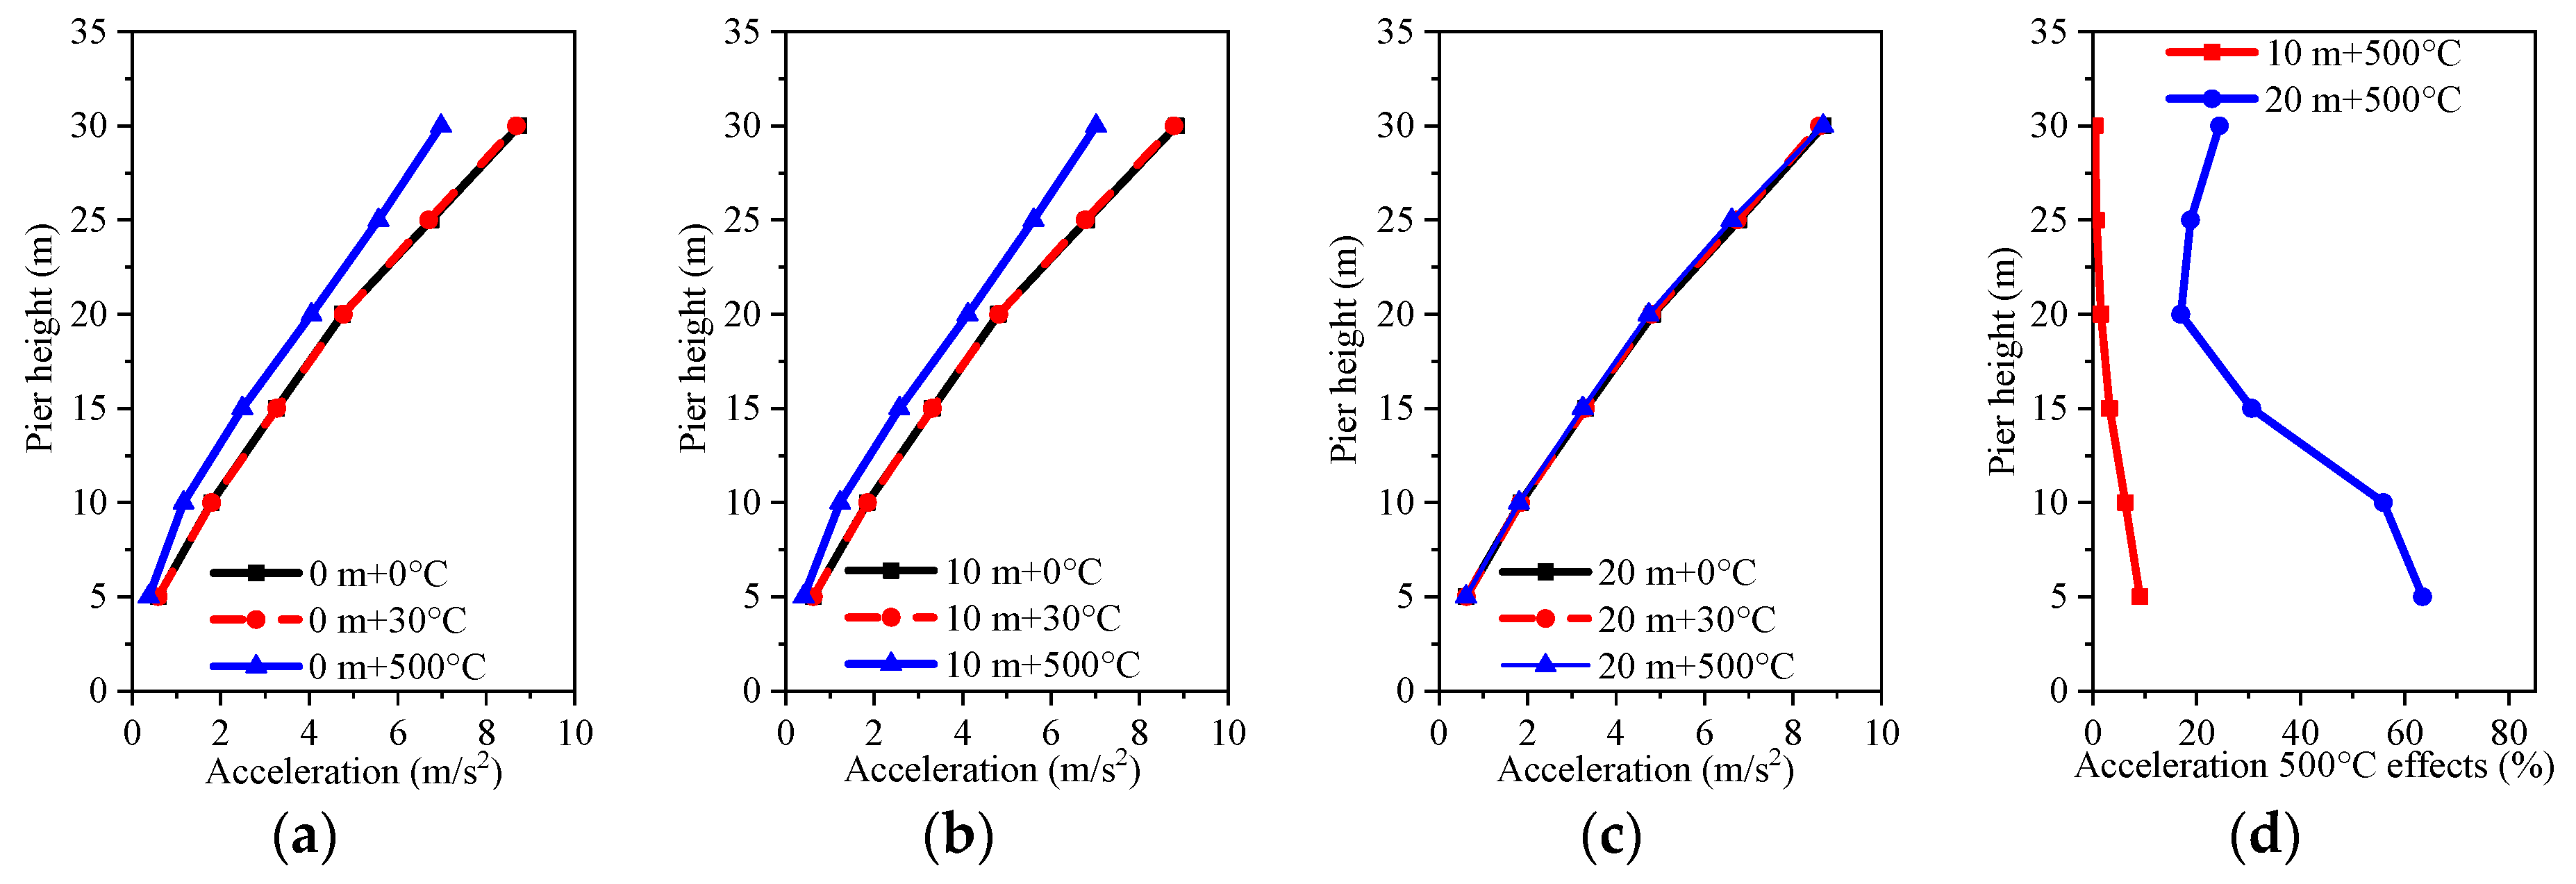
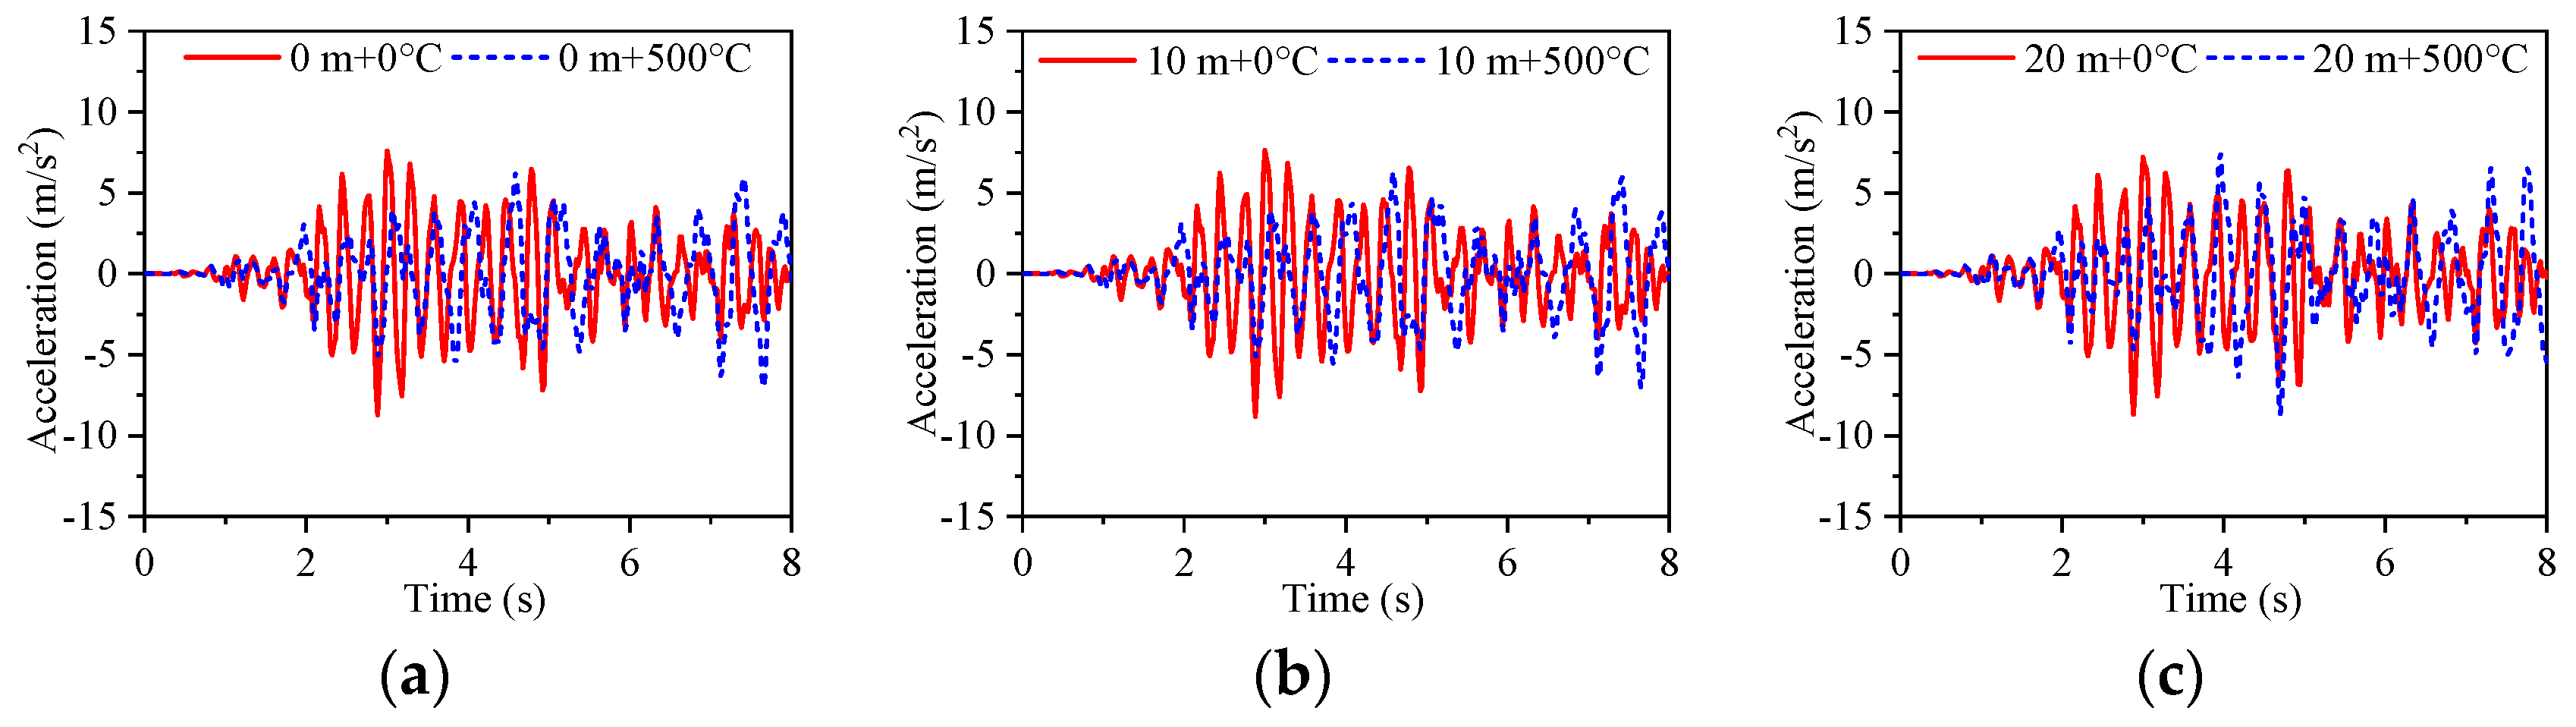
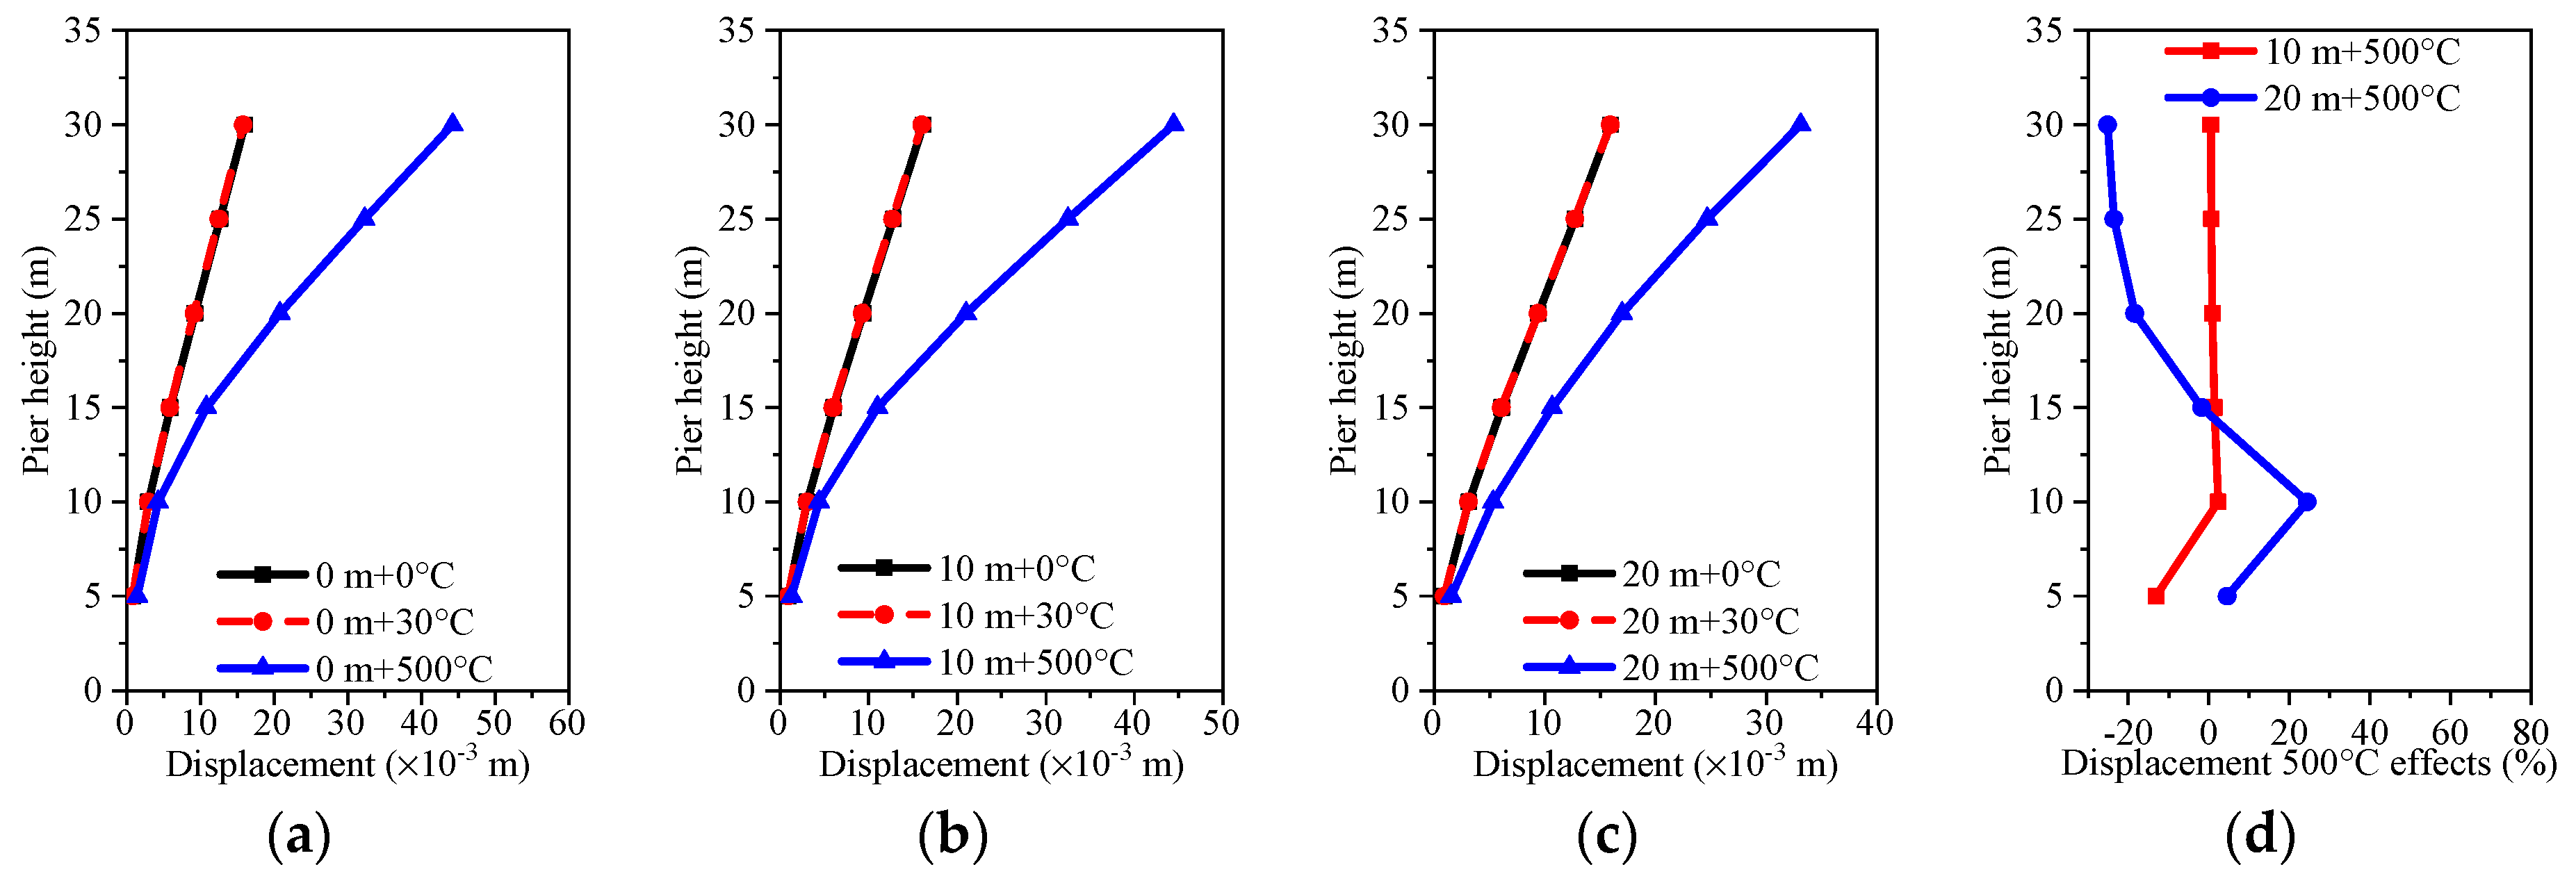
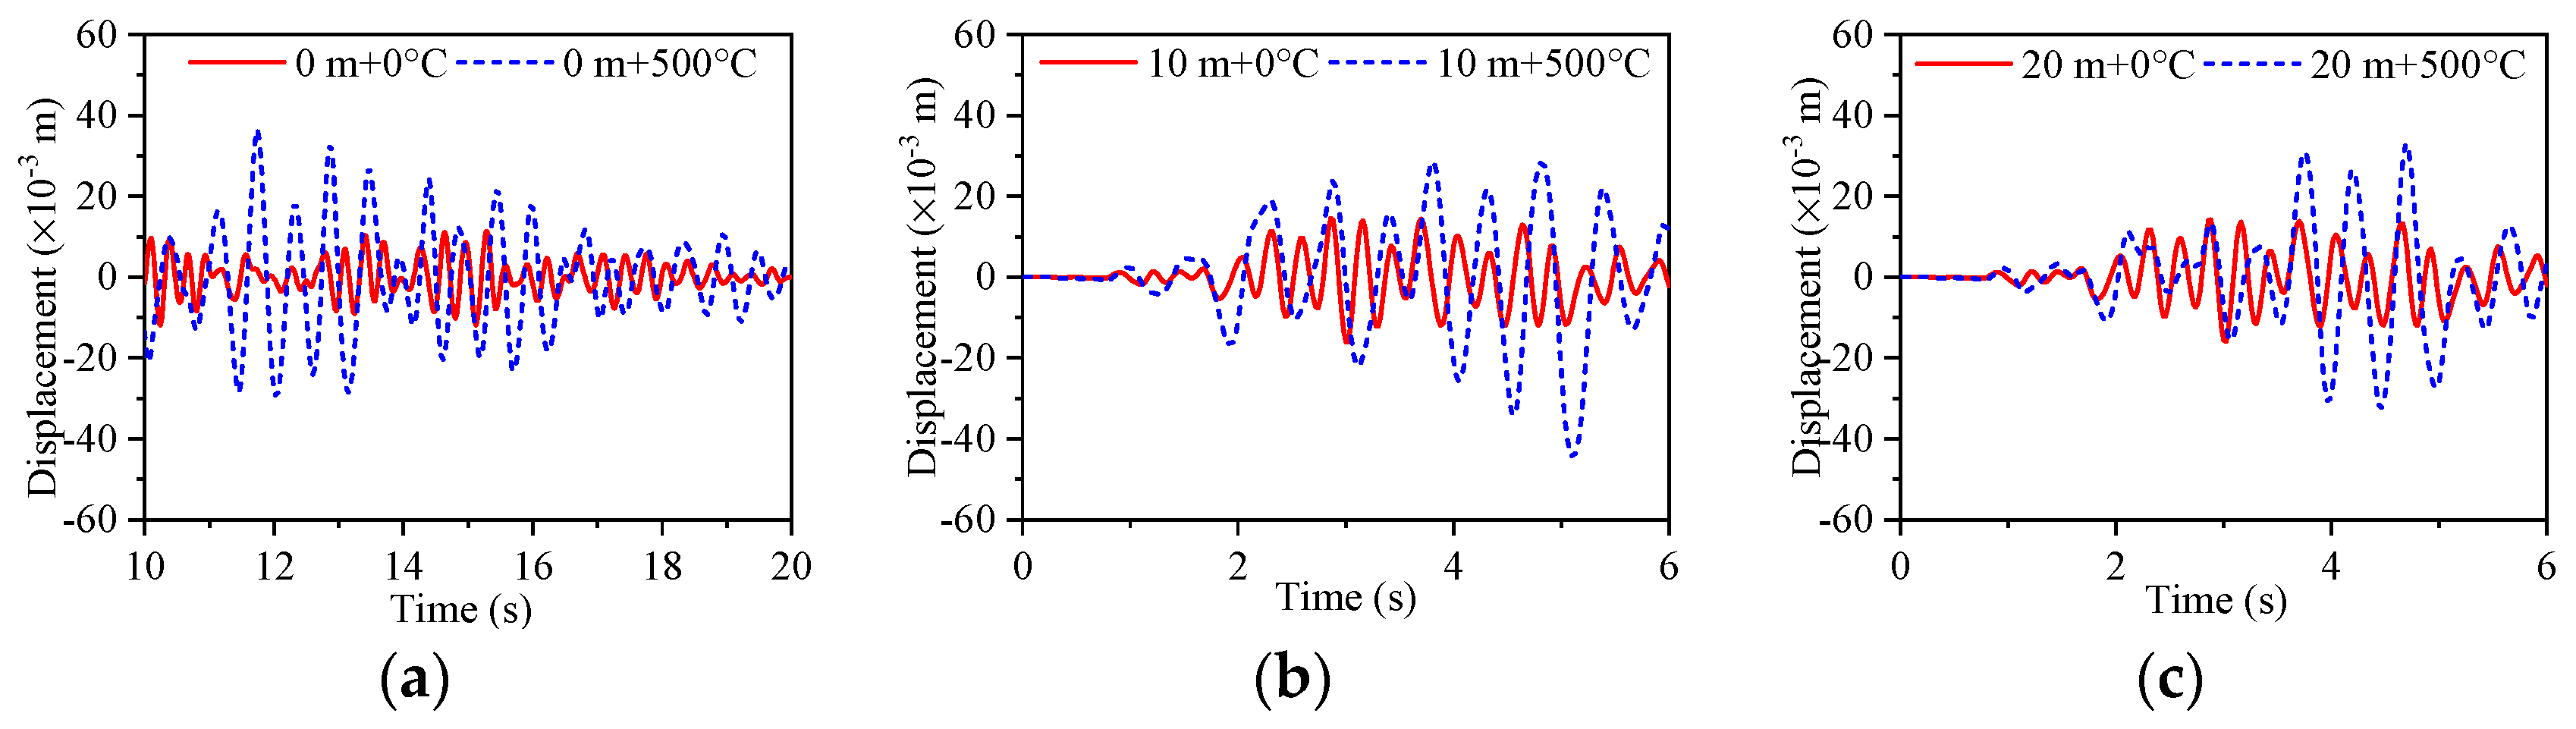
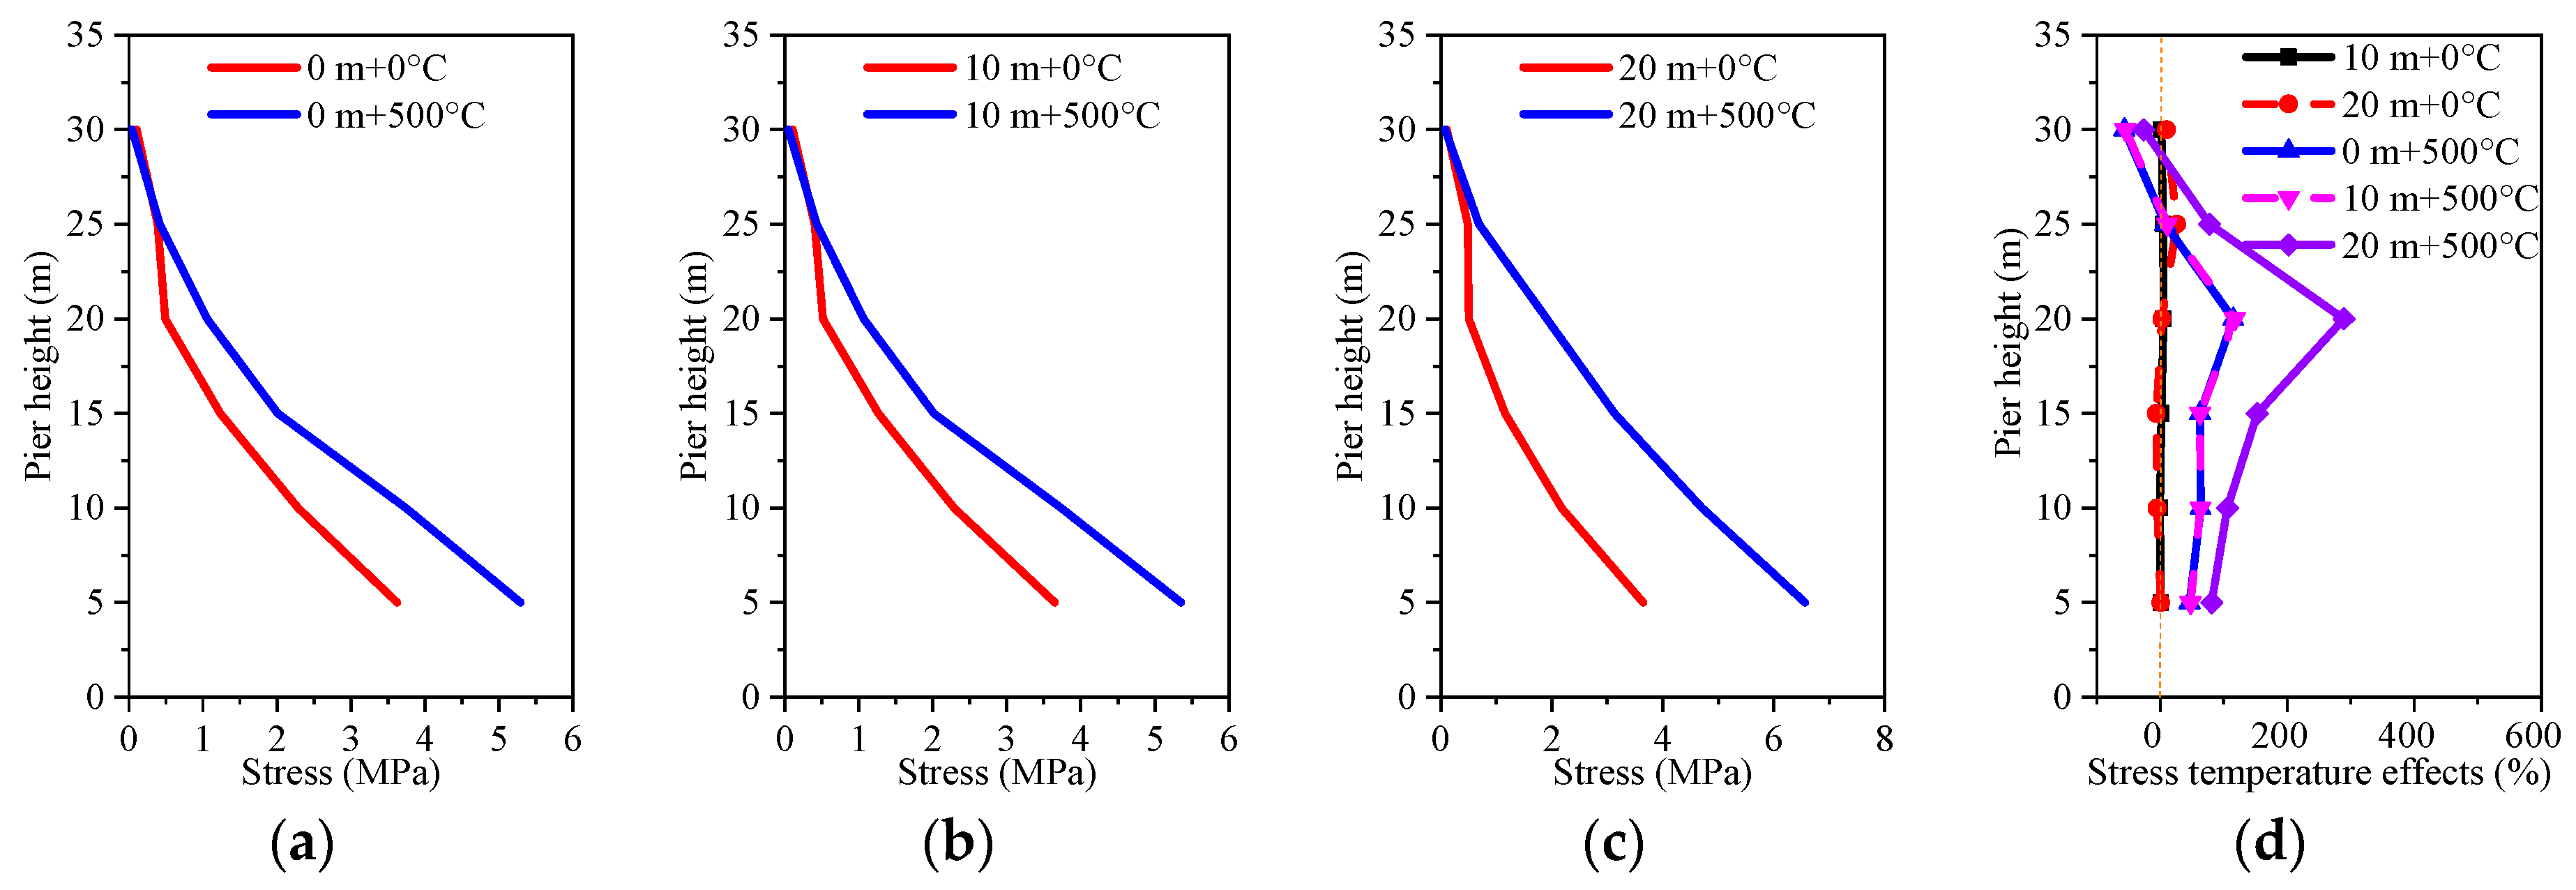
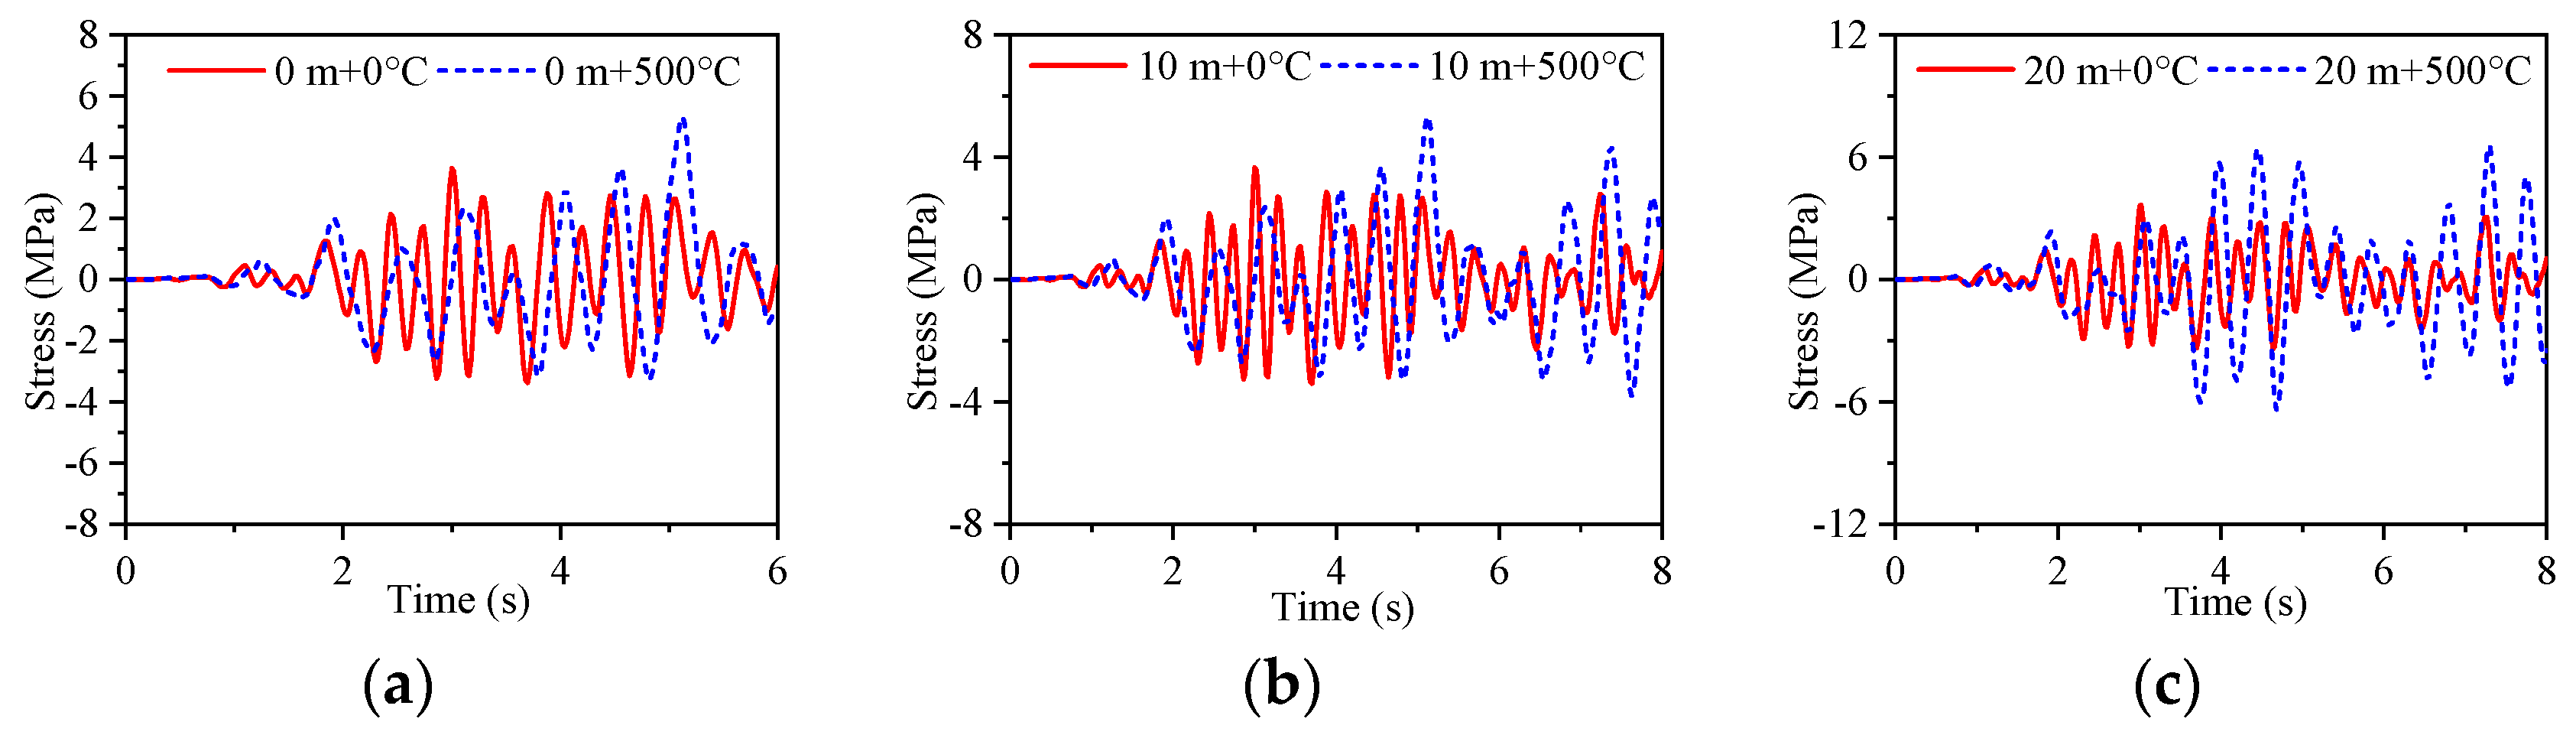
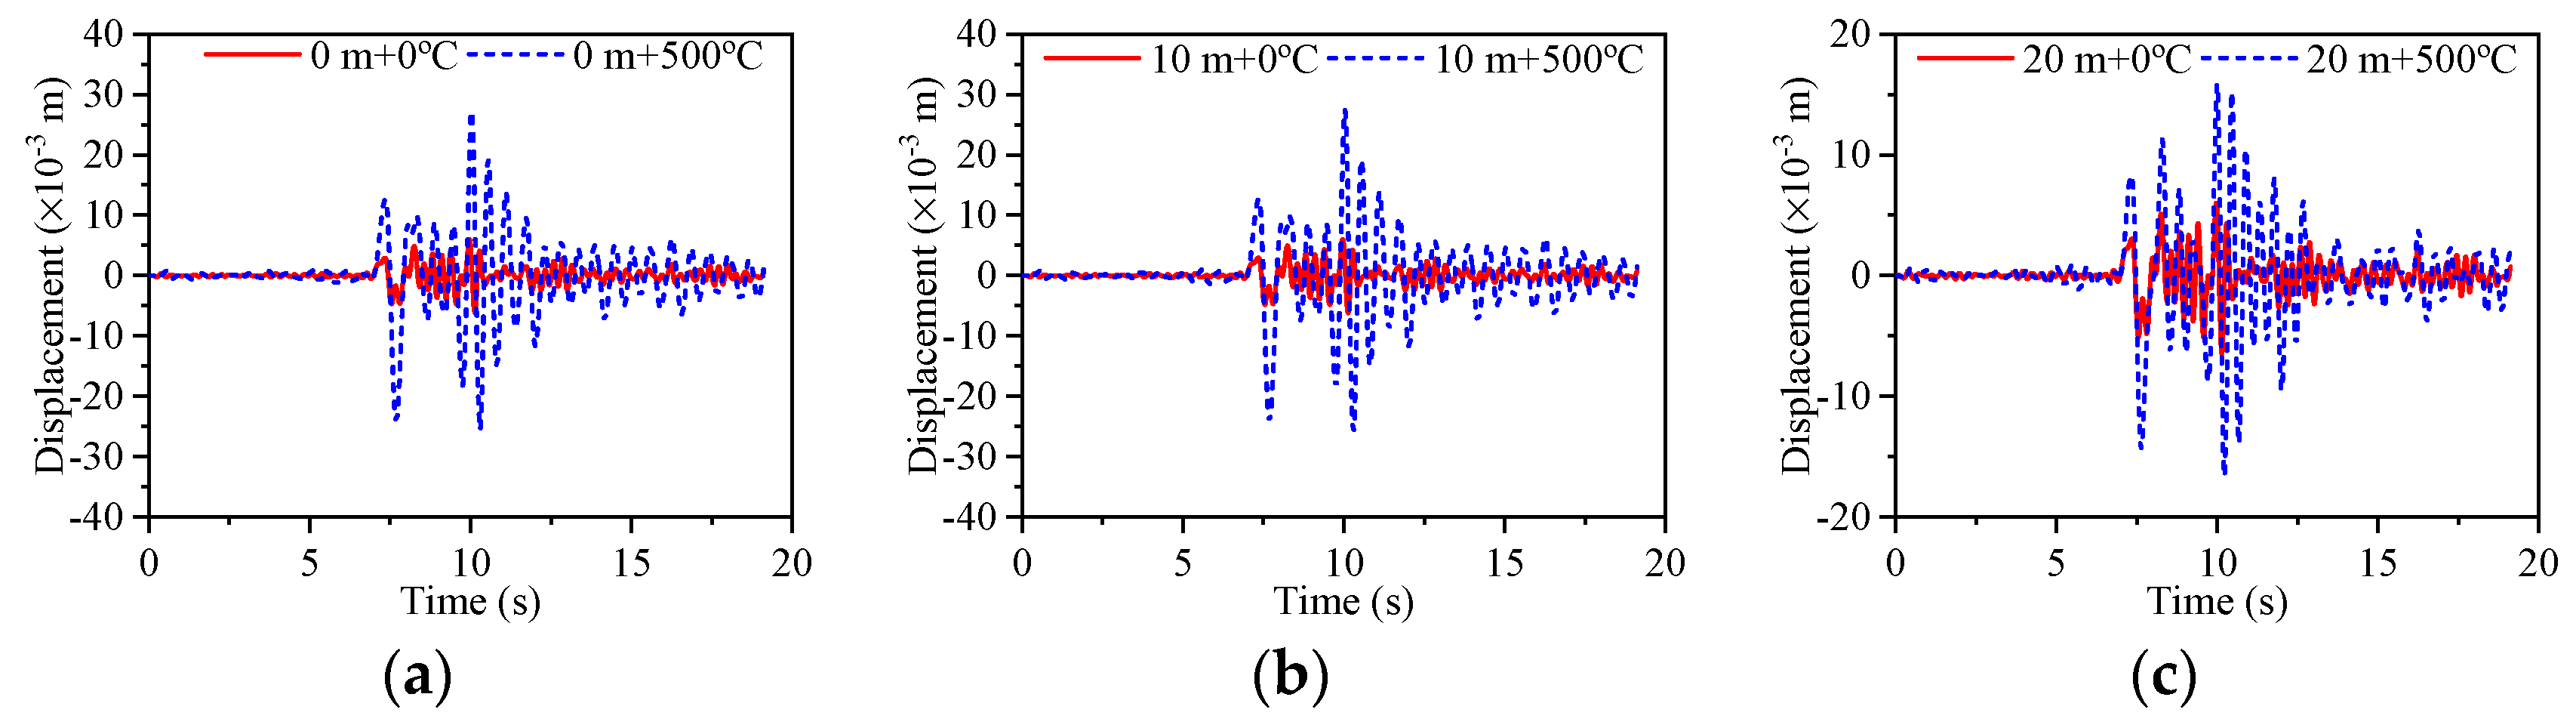
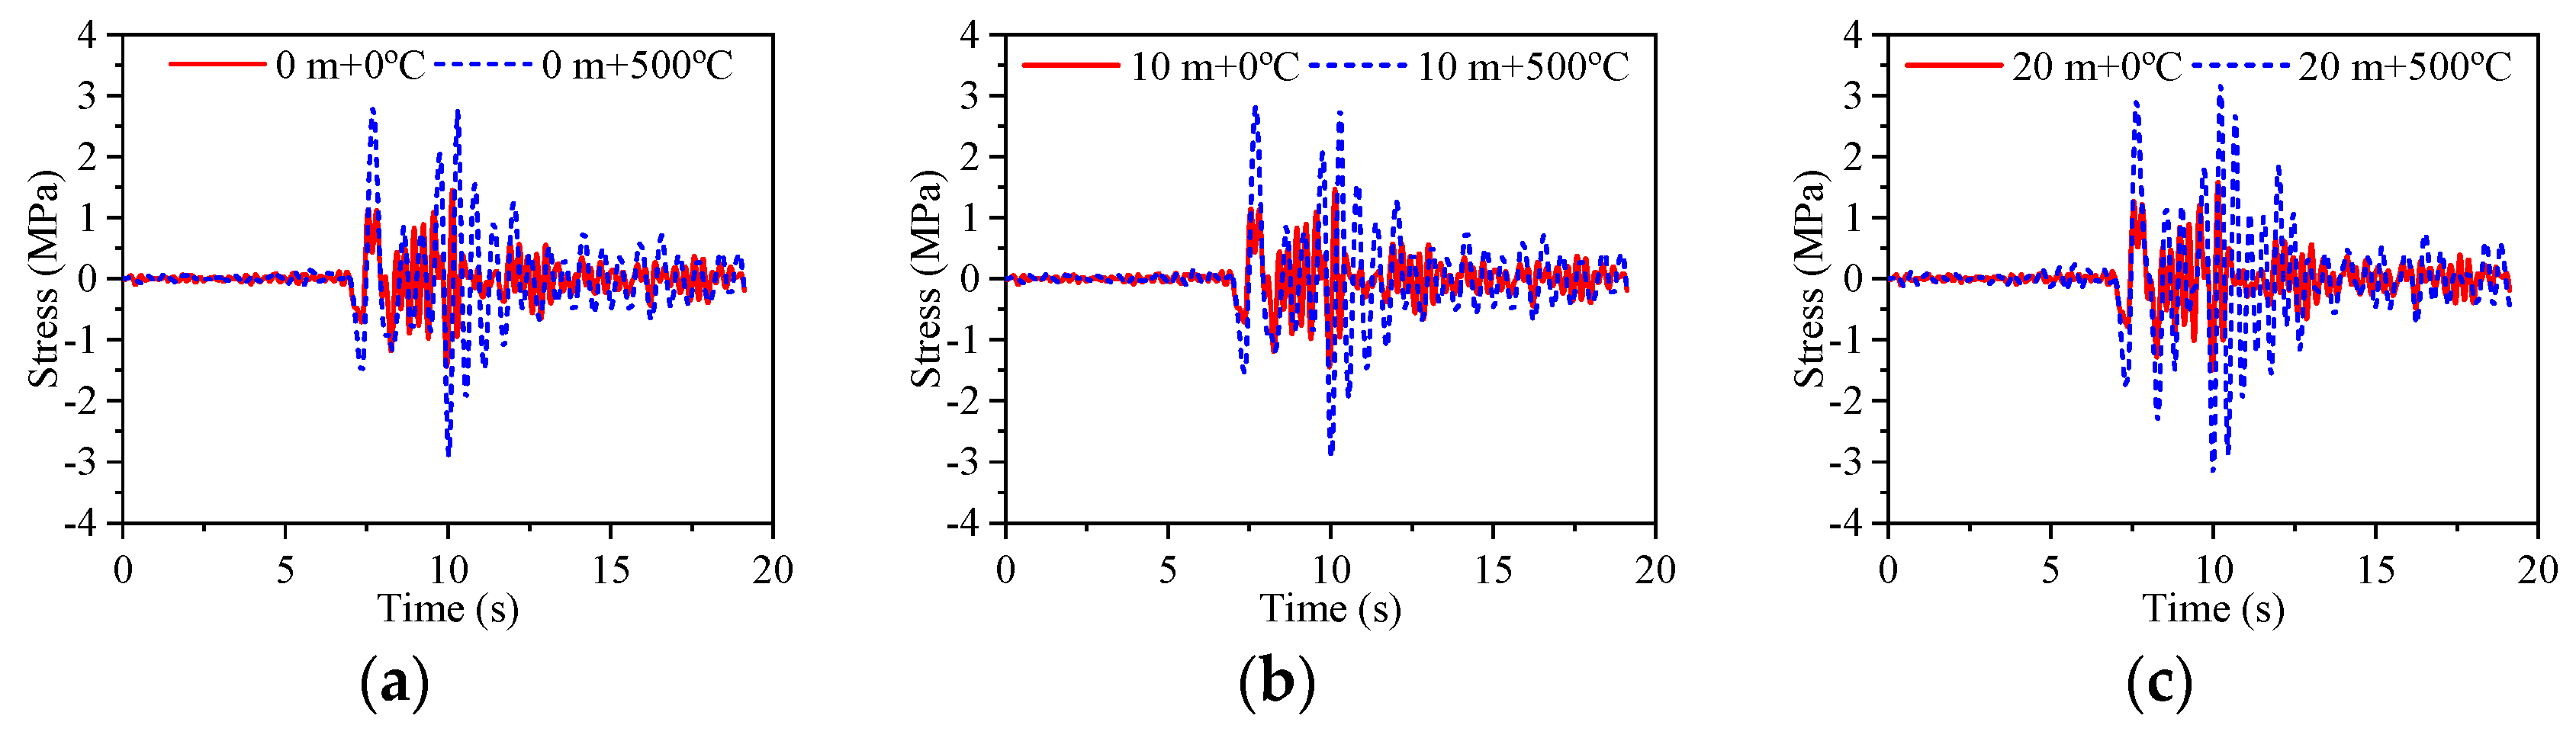
5.3. Analysis of the Temperature Effects

The temperature effect changes the material properties of the concrete structure, which in turn affects the dynamic properties of the structure. Considering the hydrodynamic effect, the seismic response of high-strength concrete materials after exposure to high temperatures is evaluated. When the temperature effect without ambient water is evaluated, the standard temperature propagation stops at 10 m from the bottom of the bridge pier (exceeding 400 °C).
Figure 11 shows the curves of the acceleration of various water levels and temperatures under artificial earthquake action. Figure 12 shows the time history curves of the acceleration of various water levels and temperatures at the pier top under artificial earthquake action. Figure 13 shows the acceleration frequency domain of various water levels and temperatures at the pier top under artificial earthquake action.
As shown in Figure 11a,b, the acceleration response values increase as the stress rate increases. When the water level is 0 m and 10 m at identical water lines, the trend lines of the acceleration values at 0 °C and 30 °C coincide, indicating that the lower temperature has a marginal effect on the performance of high-strength concrete structural materials, but it is greater than the acceleration value at a temperature of 500 °C. As shown in Figure 11c, when the water level is 20 m, the acceleration trend lines of the three temperatures coincide, and then the acceleration value increases as the water level increases. As shown in Figure 11d, when the temperature is 500 °C, the peak acceleration of the 20 m water level is greater than the peak acceleration of the 0 m and 10 m water levels. This law is extremely separate from the one obtained in Figure 6. This illustrates that the hydrodynamic effects and temperature effects influence the dynamic values of the bridge pier structure and that the laws of the dynamic values obtained by considering the single effect and the combined effects of the hydrodynamic effects and the temperature effects are different.
As illustrated in Figure 12, at identical water levels, the acceleration time history spectrum characteristics of the bridge pier obtained at various temperatures are extremely different, which profoundly verifies the material properties of the temperature-affected bridge structure. When the water level is between 0 m and 10 m, the peak acceleration at 0 °C is greater than the peak acceleration at 500 °C, and when the water level is 20 m, the peak acceleration value at 0 °C is close to the peak acceleration value at 500 °C.
As shown in Figure 13, at identical water levels, the amplitude of the acceleration values corresponding to 0 °C is greater than the amplitude of the acceleration values corresponding to 500 °C, and the fundamental frequency corresponding to 0 °C is also greater than the fundamental frequency corresponding to 500 °C; the error is 73.68%. At a temperature of 0 °C, the fundamental frequencies of the three water levels are identical. At a temperature of 500 °C, the fundamental frequency of the 20 m water level is greater than the fundamental frequency of the 0 m water level and the 10 m water level, the error is 13.16%. In summary, the temperature effect alters the dynamic performance of the bridge pier structure, and when combined with the hydrodynamic effect and the effect of the temperature effect on the bridge structure, the effect of the temperature effect on the analysis of the acceleration values of the bridge main pier structure is greater than the hydrodynamic effect.
Figure 14 shows the curves of the displacement values with respect to the pier height at various water levels and temperatures. Figure 15 shows the time history curves of the displacement of various water levels and temperatures at the pier top. Figure 16 shows the frequency domain of the displacement of various water levels and temperatures at the pier top.
As illustrated in Figure 14, the displacement response values increase with the height of the pier, with the largest values occurring at the top of the pier. At identical water levels, the displacement response at 500 °C is greater than the displacement response at 0 °C and 30 °C, the displacement trend lines at 0 °C and 30 °C coincide, and the change laws and values are close, indicating that the effect on the displacement response is small at low temperatures. When the temperature is 500 °C, the displacement response at the 0 m and 10 m water levels is greater than the displacement response at the 20 m water level, especially at pier heights ranging from 15 m to 30 m.
As shown in Figure 15, for the identical water levels, the spectral characteristics of the time history of the pier top displacement at 0 °C and 500 °C are extremely separate, and the peak displacement at 500 °C is larger than that at 0 °C.
As illustrated in Figure 16, the fundamental frequencies of the three water levels are identical at 0 °C. At a temperature of 500 °C, the fundamental frequency of the 20 m water level is greater than the fundamental frequency of the 0 m and 10 m water levels, but the displacement amplitude of the 20 m water level is smaller than the displacement amplitude of the 0 m and 10 m water levels. The impact of the temperature effect on the displacement value of the pier structure is greater than the hydrodynamic effect. When the height of the main pier is less than 15 m, the displacement value of the 20 m water level is greater than that of the 0 m and 10 m water levels, and when the height of the pier exceeds 15 m, the displacement values of the 20 m water level are less than those of the 10 m and 0 m water levels, which is close to the law when only the hydrodynamic effect is considered (Figure 9b).
Figure 17 shows the curves of stress with respect to the pier height at various water levels and temperatures under artificial earthquake action. Figure 18 shows the time history of the stress at various water levels and temperatures at the pier top under artificial earthquake action. Figure 19 shows the frequency domain of the stress at various water levels and temperatures at the pier top under artificial earthquake action.
As illustrated in Figure 17a–c, the stress in the pier decreases as the height of the pier increases. At identical water levels, the stress at the temperature of 500 °C is greater than the stress at the temperature of 0 °C, and the difference between the temperature of 0 °C and 500 °C at the top of the pier is small, and the difference between the temperature of 0 °C and 500 °C at the bottom of the pier is larger. As illustrated in Figure 17d, the hydrodynamic effect has an extremely small effect on the stress of the bridge pier and is significantly smaller than the temperature effect. At a temperature of 500 °C, the peak stress of the pier at the 20 m water level is greater than that at the 0 m and 10 m water levels, and the stress is greatest at the bottom of the pier, but the stress effect is greatest at the height of the pier at 20 m.
As shown in Figure 18, at the identical water levels, the spectrum characteristics of the stress time history curves at the top of the pier at 0 °C and 500 °C are significantly different, and the peak stress at the top of the pier at 500 °C is greater than that at 0 °C.
As shown in Figure 19, at identical water levels, the stress amplitude at 500 °C is greater than that at 0 °C. When the temperature is 0 °C, the dominant frequency of the three water levels is 1.8 Hz, and the dominant frequency is identical. When the temperature is 500 °C, the dominant frequency of the 20 m water level is 2.15 Hz, which is greater than that of the 10 m and 0 m water levels. The influence of the temperature effect on the stress is greater than that of the hydrodynamic effect.
Figure 20 shows the acceleration time history of various water levels and temperatures at the pier top under the action of the Tianjin earthquakes. Figure 21 shows the displacement time history of various water levels and temperatures at the pier top under the Tianjin earthquake action. Figure 22 shows that the displacement time history of various water levels and temperatures at the pier height is 5 m under the Tianjin earthquake.
As illustrated in Figure 20, Figure 21 and Figure 22, regardless of the water level, the temperature is 500 °C, which significantly changes the dynamic response values of the bridge main pier structure. Compared with that at 0 °C, the dynamic response of the structure has obviously increased at 500 °C. When the water level is 20 m, the acceleration response values and displacement response values of the bridge main pier structure are smaller than those when the water levels are 0 m and 10 m; however, the stress response of the bridge main pier structure is greater than that when the water levels are 0 m and 10 m. Compared with Figure 10, the dynamic response value analysis of the bridge main pier structure shows that the temperature effect induced by the fire is significantly larger than the hydrodynamic effect induced by the water. The dynamic response law obtained for Tianjin earthquake waves is consistent with the dynamic response law obtained for artificial earthquake waves.

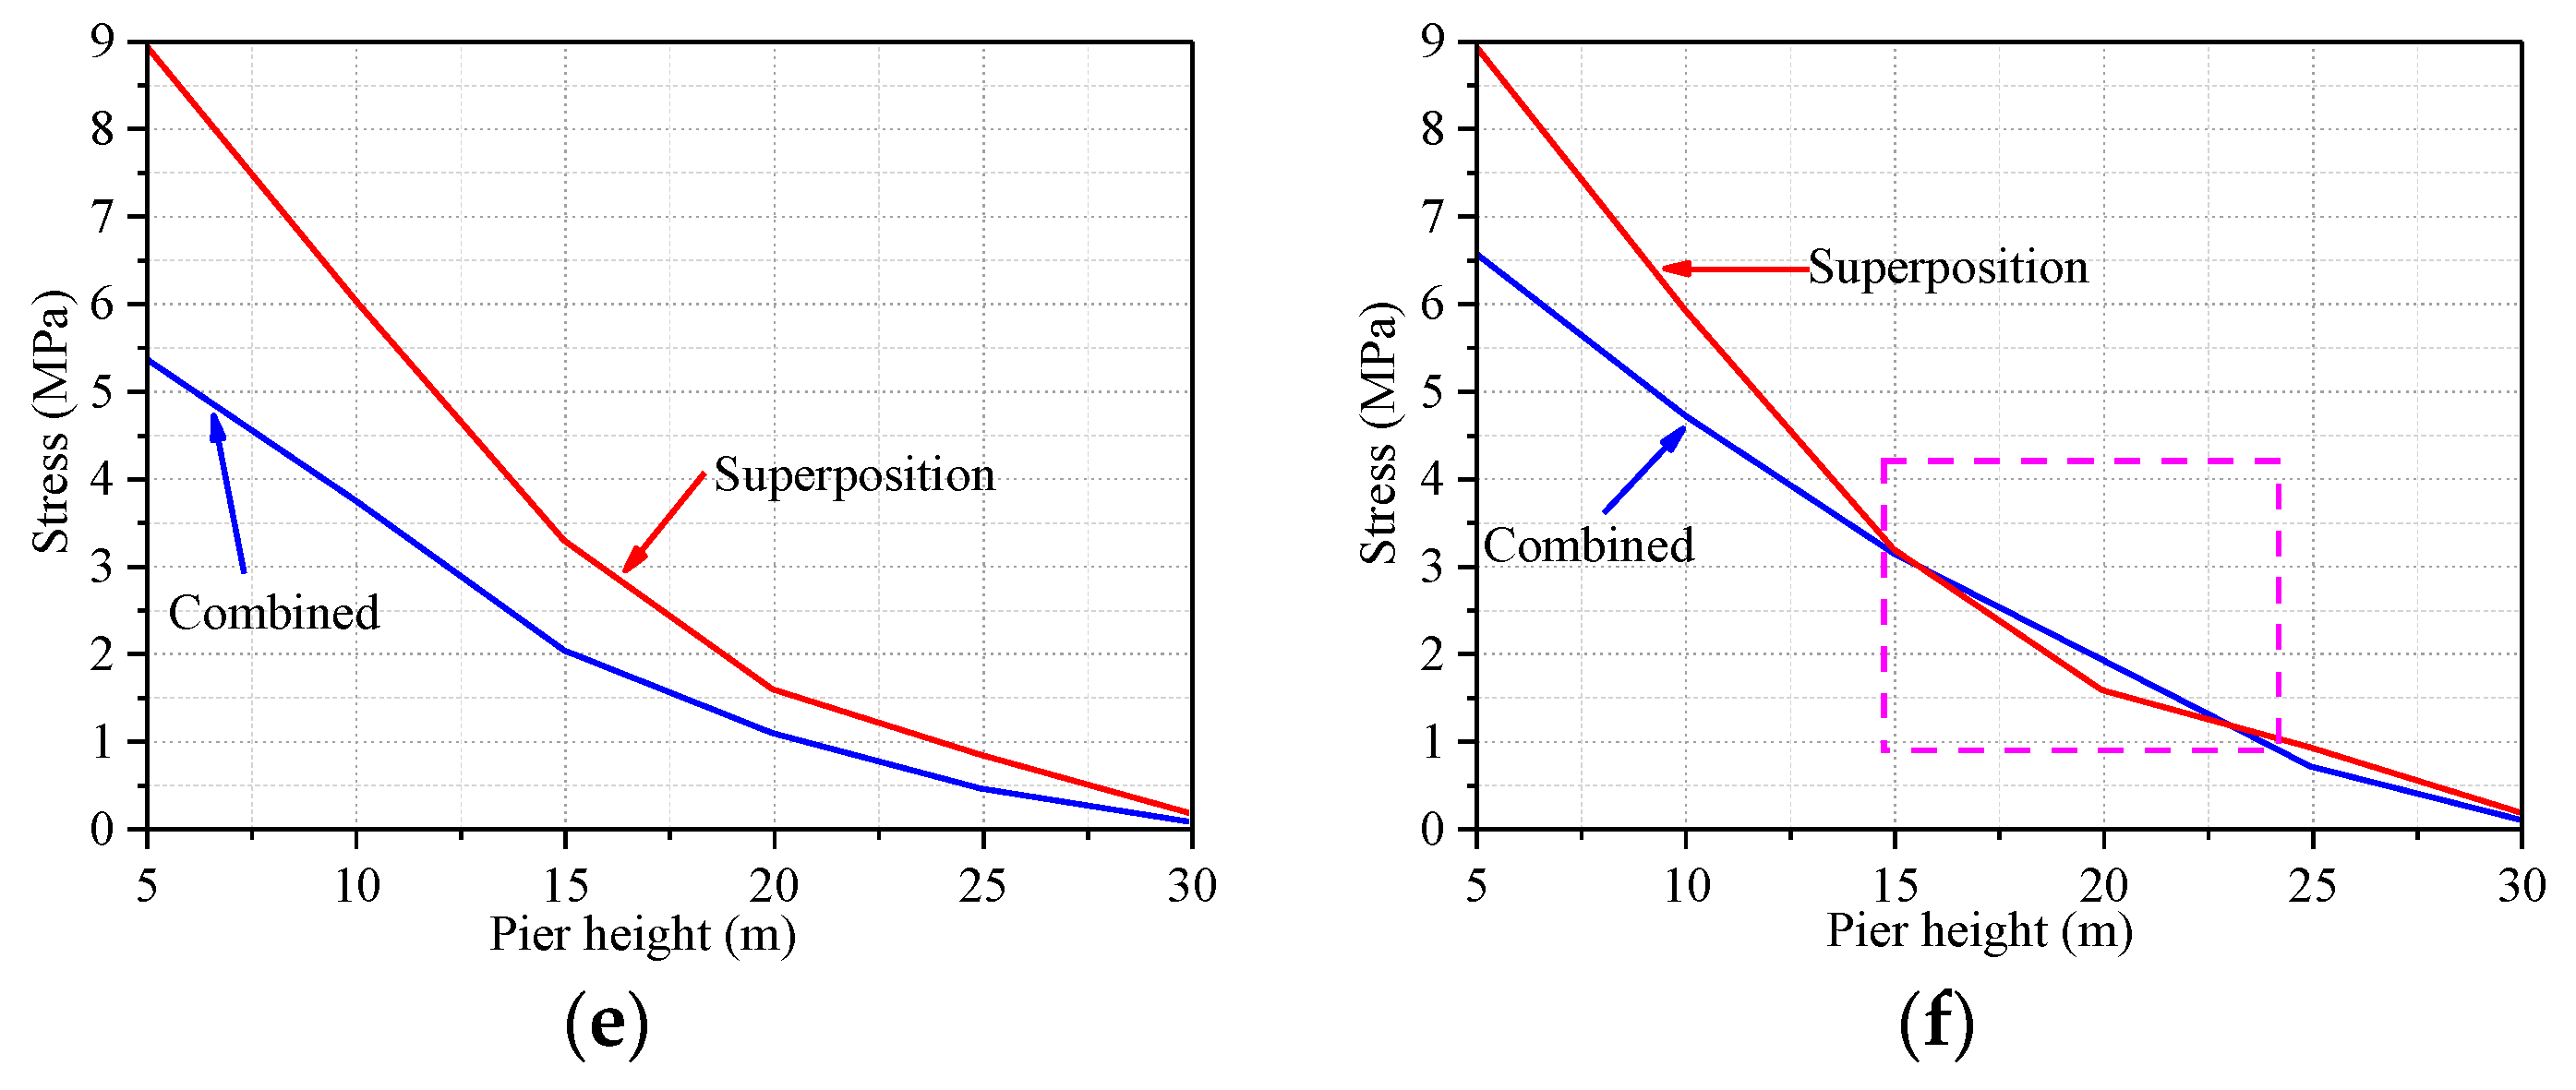
5.4. Superposition and Combined Action of Hydrodynamic Effects and Temperature Effects

Figure 23 shows a comparison of the dynamic response of the superposed and combined effects of artificial earthquake waves.
As shown in Figure 23a–d, the acceleration response and displacement response obtained via the linear superposition of the hydrodynamic effect and temperature effect are greater than those obtained via the combined effect of the hydrodynamic effect and temperature effect. As shown in Figure 23e,f, when the water level is 10 m, the stress response obtained via the linear superposition of the hydrodynamic effects and temperature effects is greater than that obtained via the combined effects of the hydrodynamic effects and temperature effects. When the water level is 20 m, the pier height is between 15 m and 25 m, and the stress response obtained via the linear superposition of hydrodynamic effects and temperature effects is smaller than that obtained via the combined effects of hydrodynamic effects and temperature effects. When the pier height is between 0 and 15 m and 25–30 m, the stress response obtained via the linear superposition of the hydrodynamic effect and the temperature effect is greater than the stress response obtained via the combined effects of the hydrodynamic effect and the temperature effect.
Figure 24 shows the comparison of the dynamic response of the under-superposition and combined Tianjin earthquake wave action. Taking the top acceleration and displacement of the bridge pier, as well as the stress at the bottom of the pier, as the research objects, Table 2 provides the combined and joint action values of the dynamic responses of temperature effects and hydrodynamic effects.
As illustrated in Figure 24 and Table 2, the linear superposition of the dynamic responses of the hydrodynamic effect and the fire-induced temperature effect is greater than that of the combined effect. This is consistent with the law of acceleration and displacement values derived from artificial earthquake waves. When the water level is 20 m, the stress response law under the linear superposition and combined action of artificial earthquake waves is more complicated than that of Tianjin earthquake waves.
The hydrodynamic effects and the temperature effects affect the dynamic characteristics and dynamic response analysis of the bridge pier structure. The hydrodynamic effects provide an external force that affects the dynamic value analysis of the bridge structure, whereas the temperature effects affect the dynamic value analysis of the bridge main structure by changing the properties of the concrete material. When the structure is affected by hydrodynamic effects and temperature effects, the dynamic value analysis of the structure cannot simply be considered a linear superposition of the hydrodynamic effects and the temperature effects alone. The temperature effect has a more significant impact on the dynamic analysis of the bridge structure than does the hydrodynamic effect. In fact, the hydrodynamic effects and the temperature effects interact with and influence each other. The interaction between the hydrodynamic effect and the temperature effect is extremely complicated.

6. Conclusions and Discussion

In this study, nonlinear dynamic value analysis of high-strength concrete deep-water bridge structures under the impacts of hydrodynamic effects and temperature effects is evaluated, and the following conclusions are drawn:
(1)
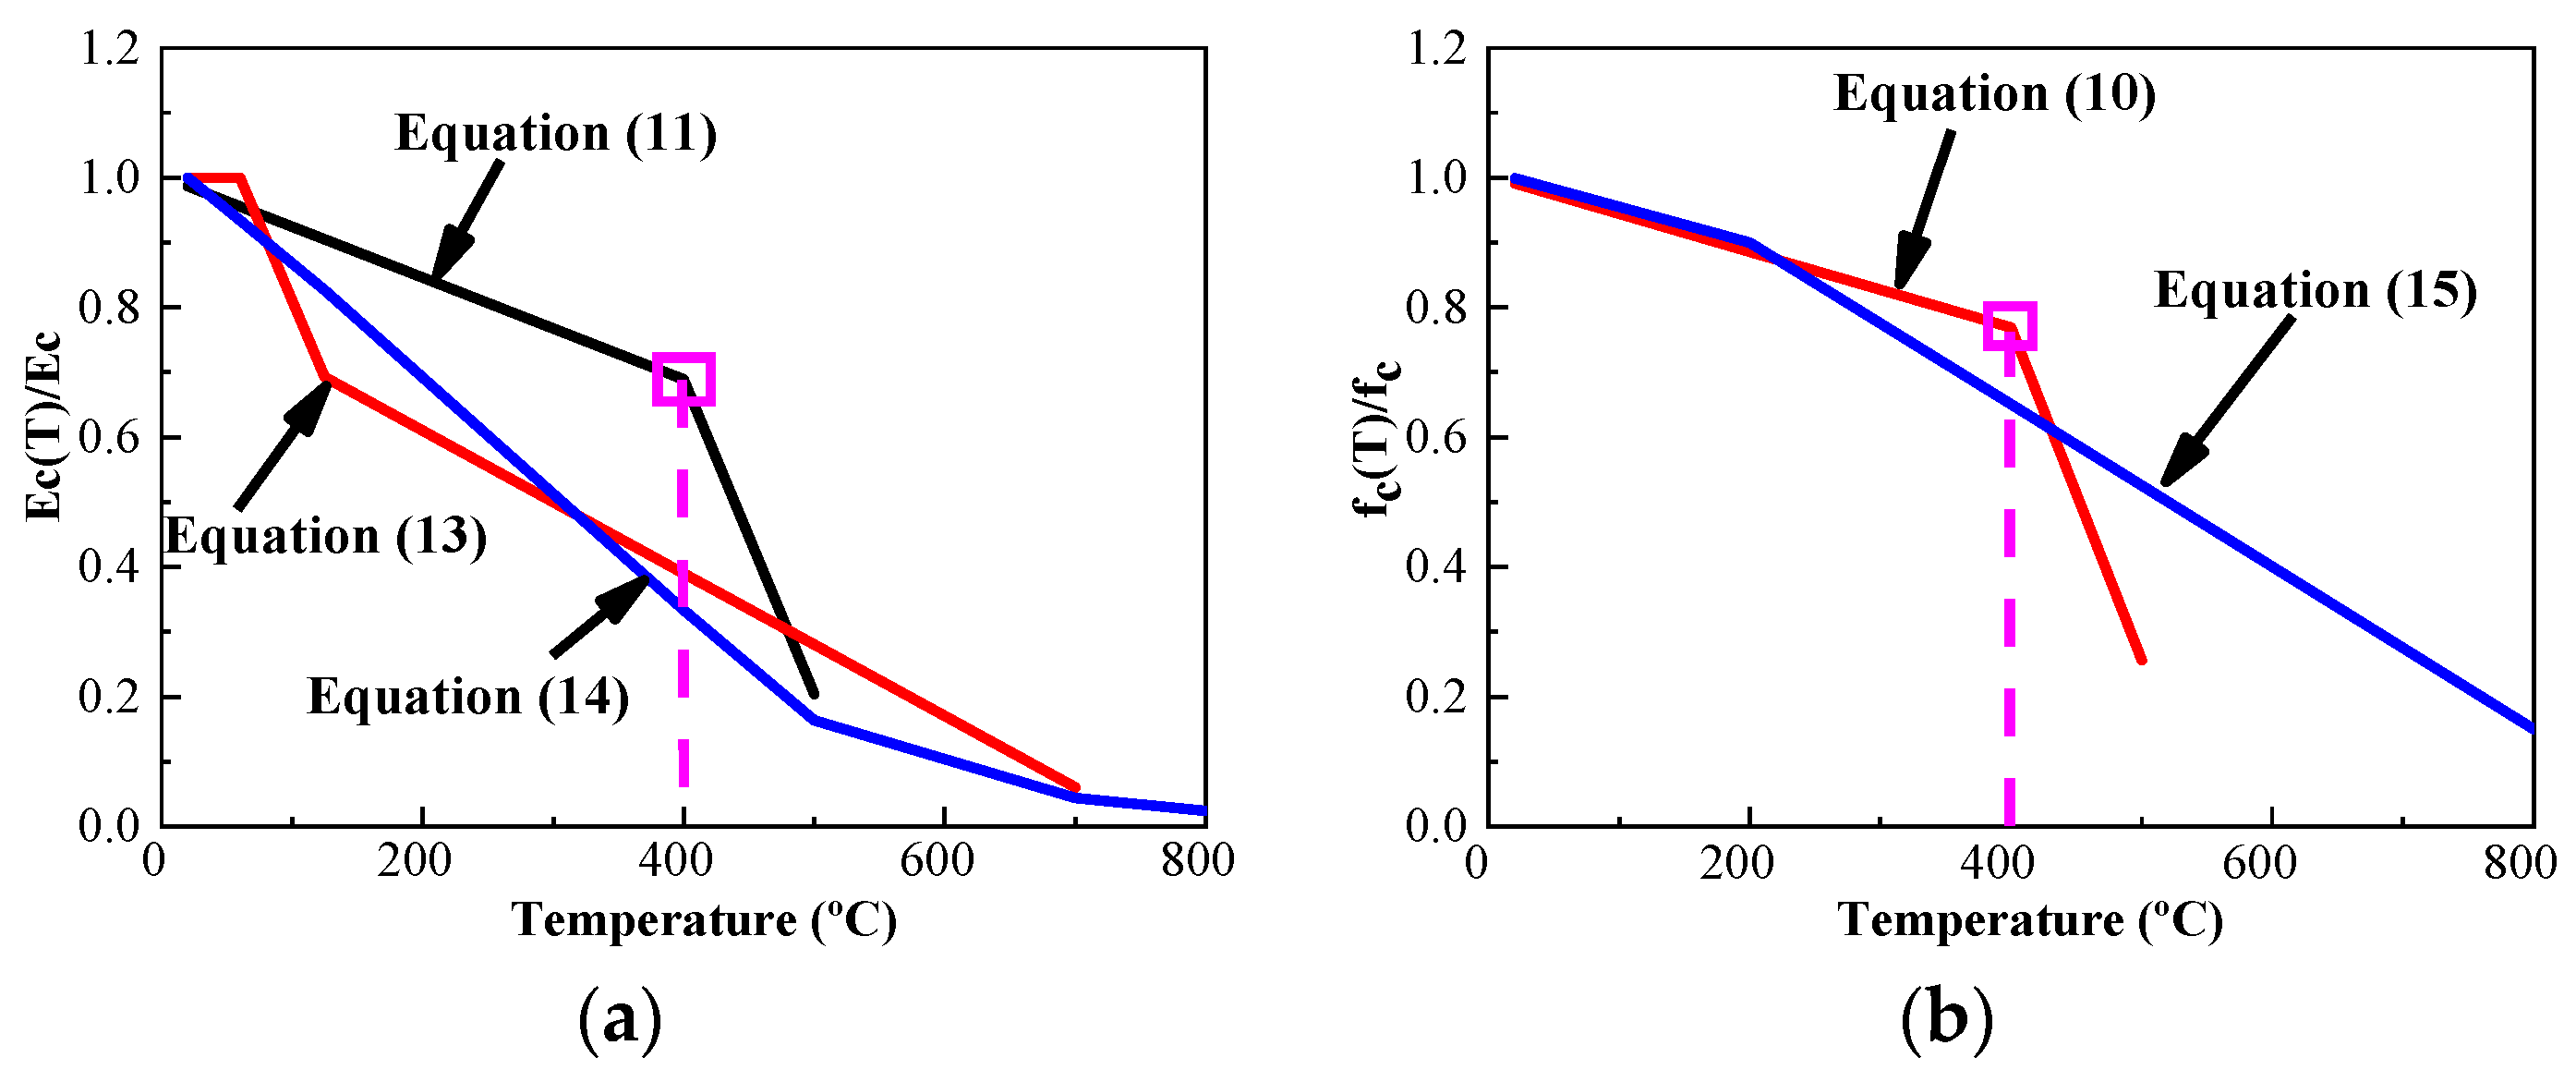
The mechanical properties of high-strength concrete and common concrete differ with respect to temperature. Before the critical temperature is reached, the rate of reduction in the strength and elastic modulus of common concrete with increasing temperature changes is greater than that of high-strength concrete. When the critical temperature is exceeded, the reduction rate of common concrete is significantly lower than that of high-strength concrete.
(2)
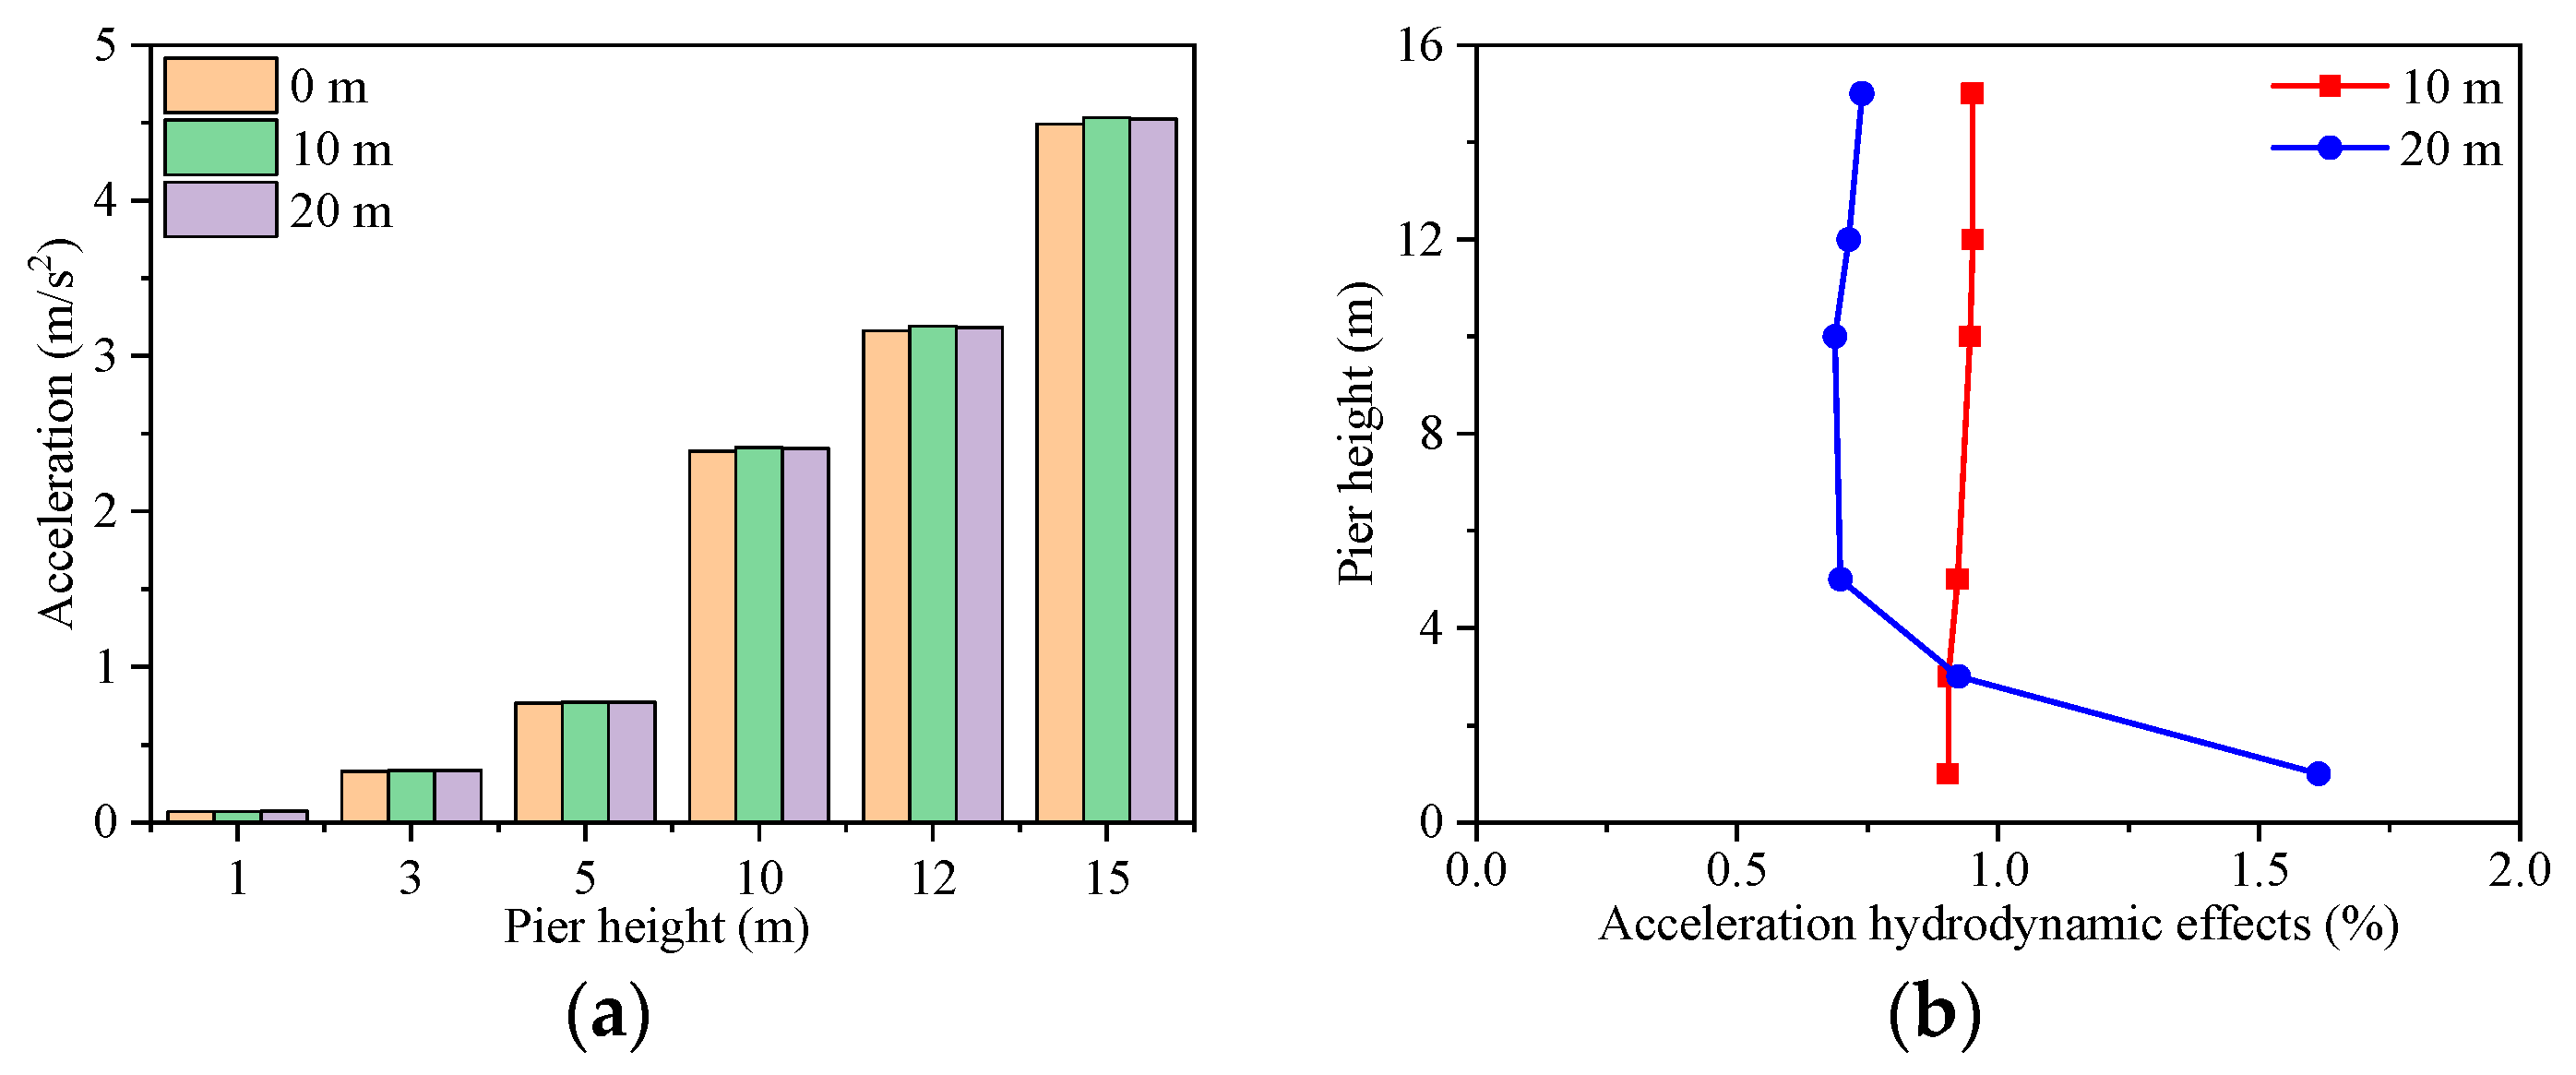
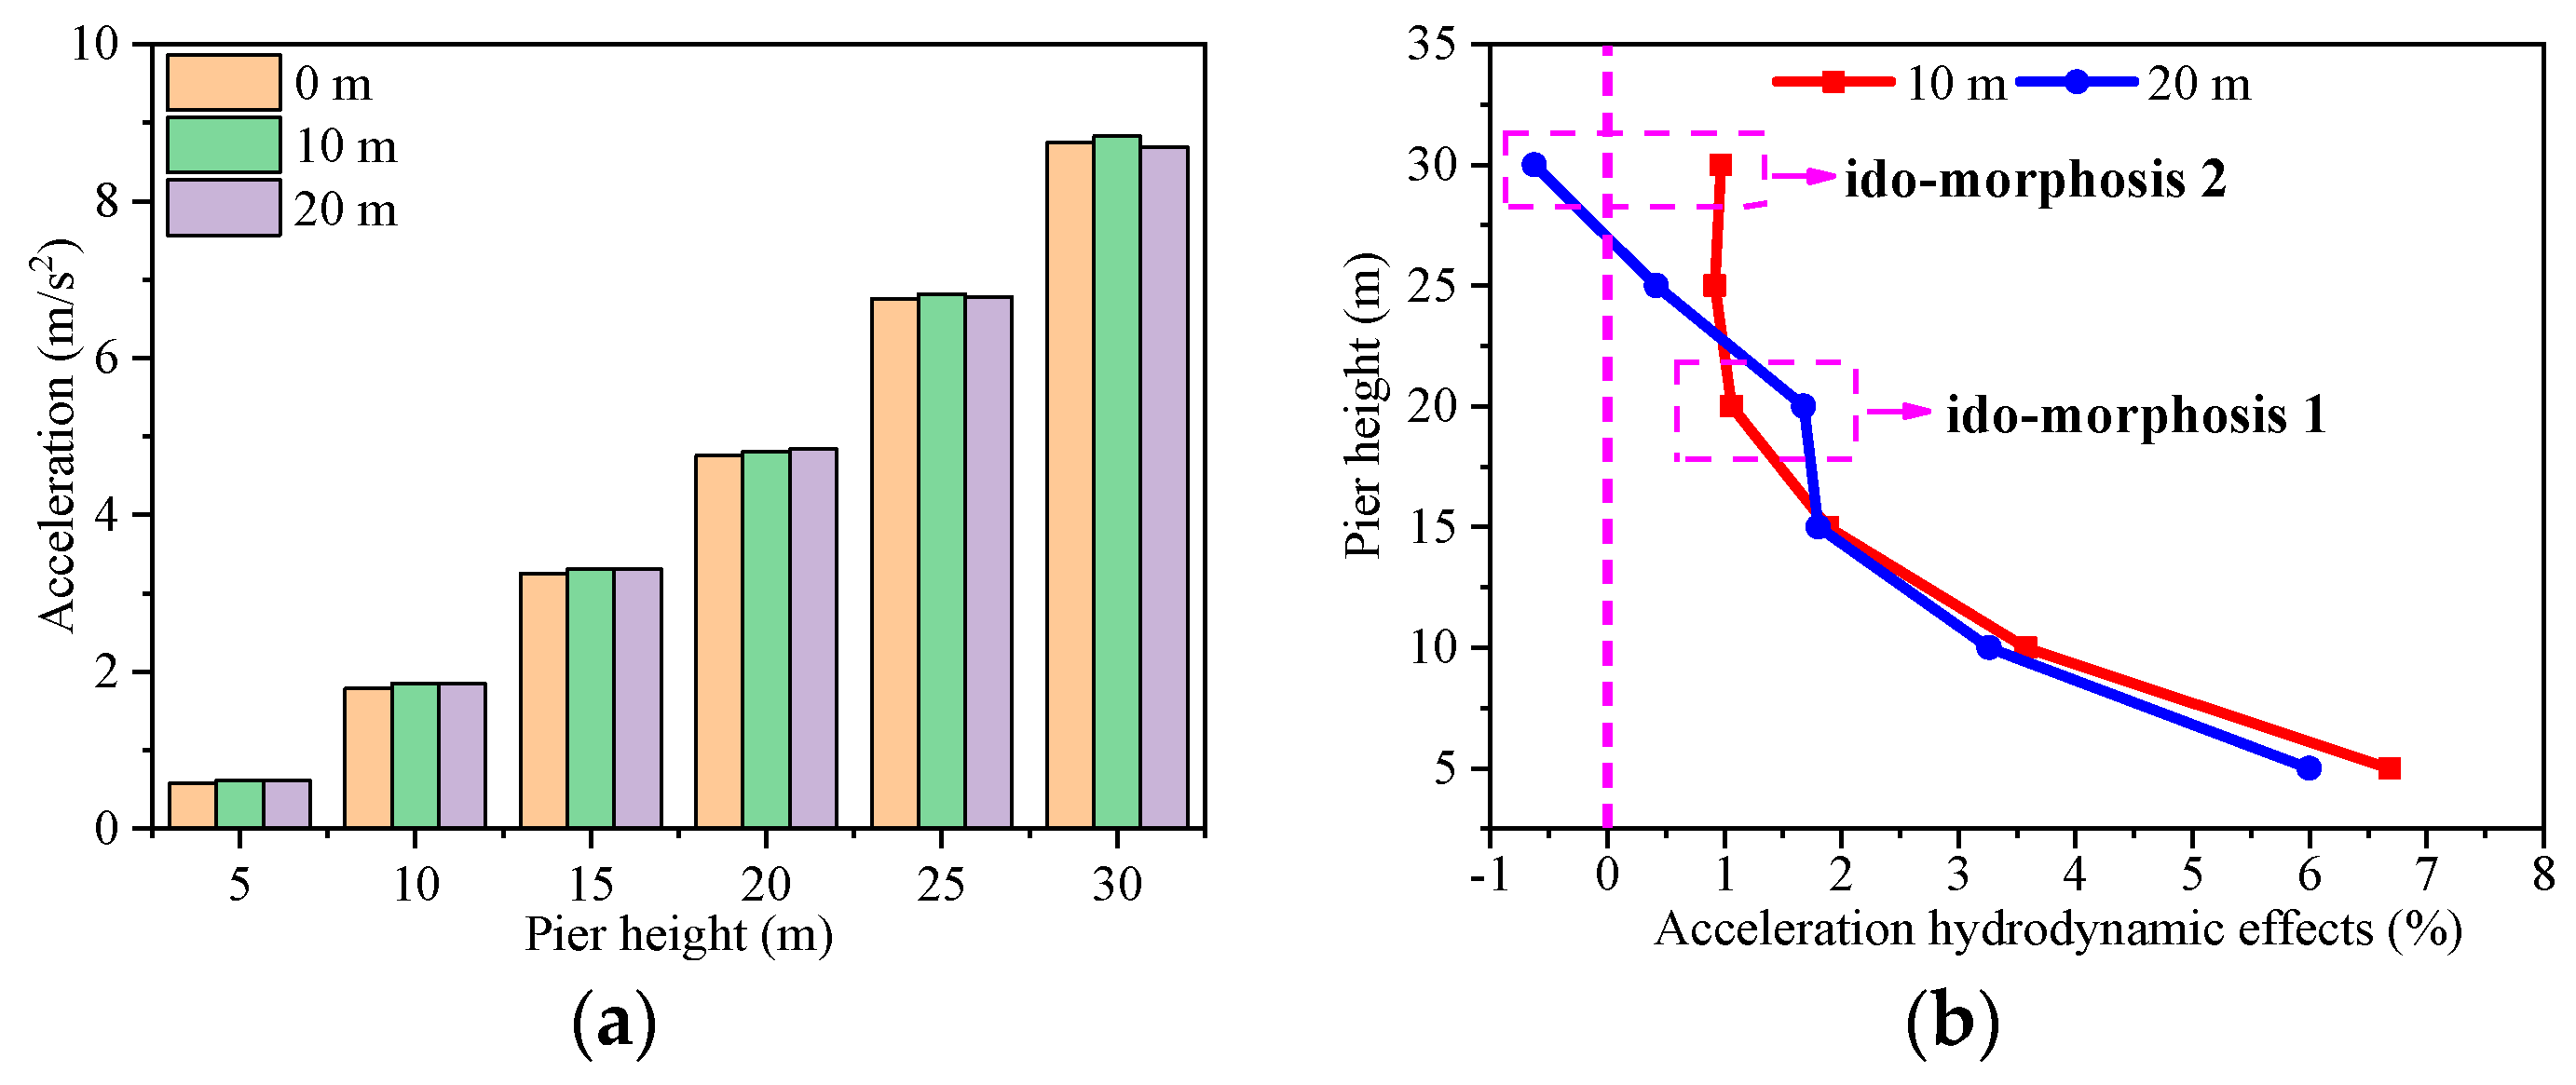
The various water levels and earthquake waves have different influences on the dynamic characteristics and dynamic response of the bridge structure.
(3)
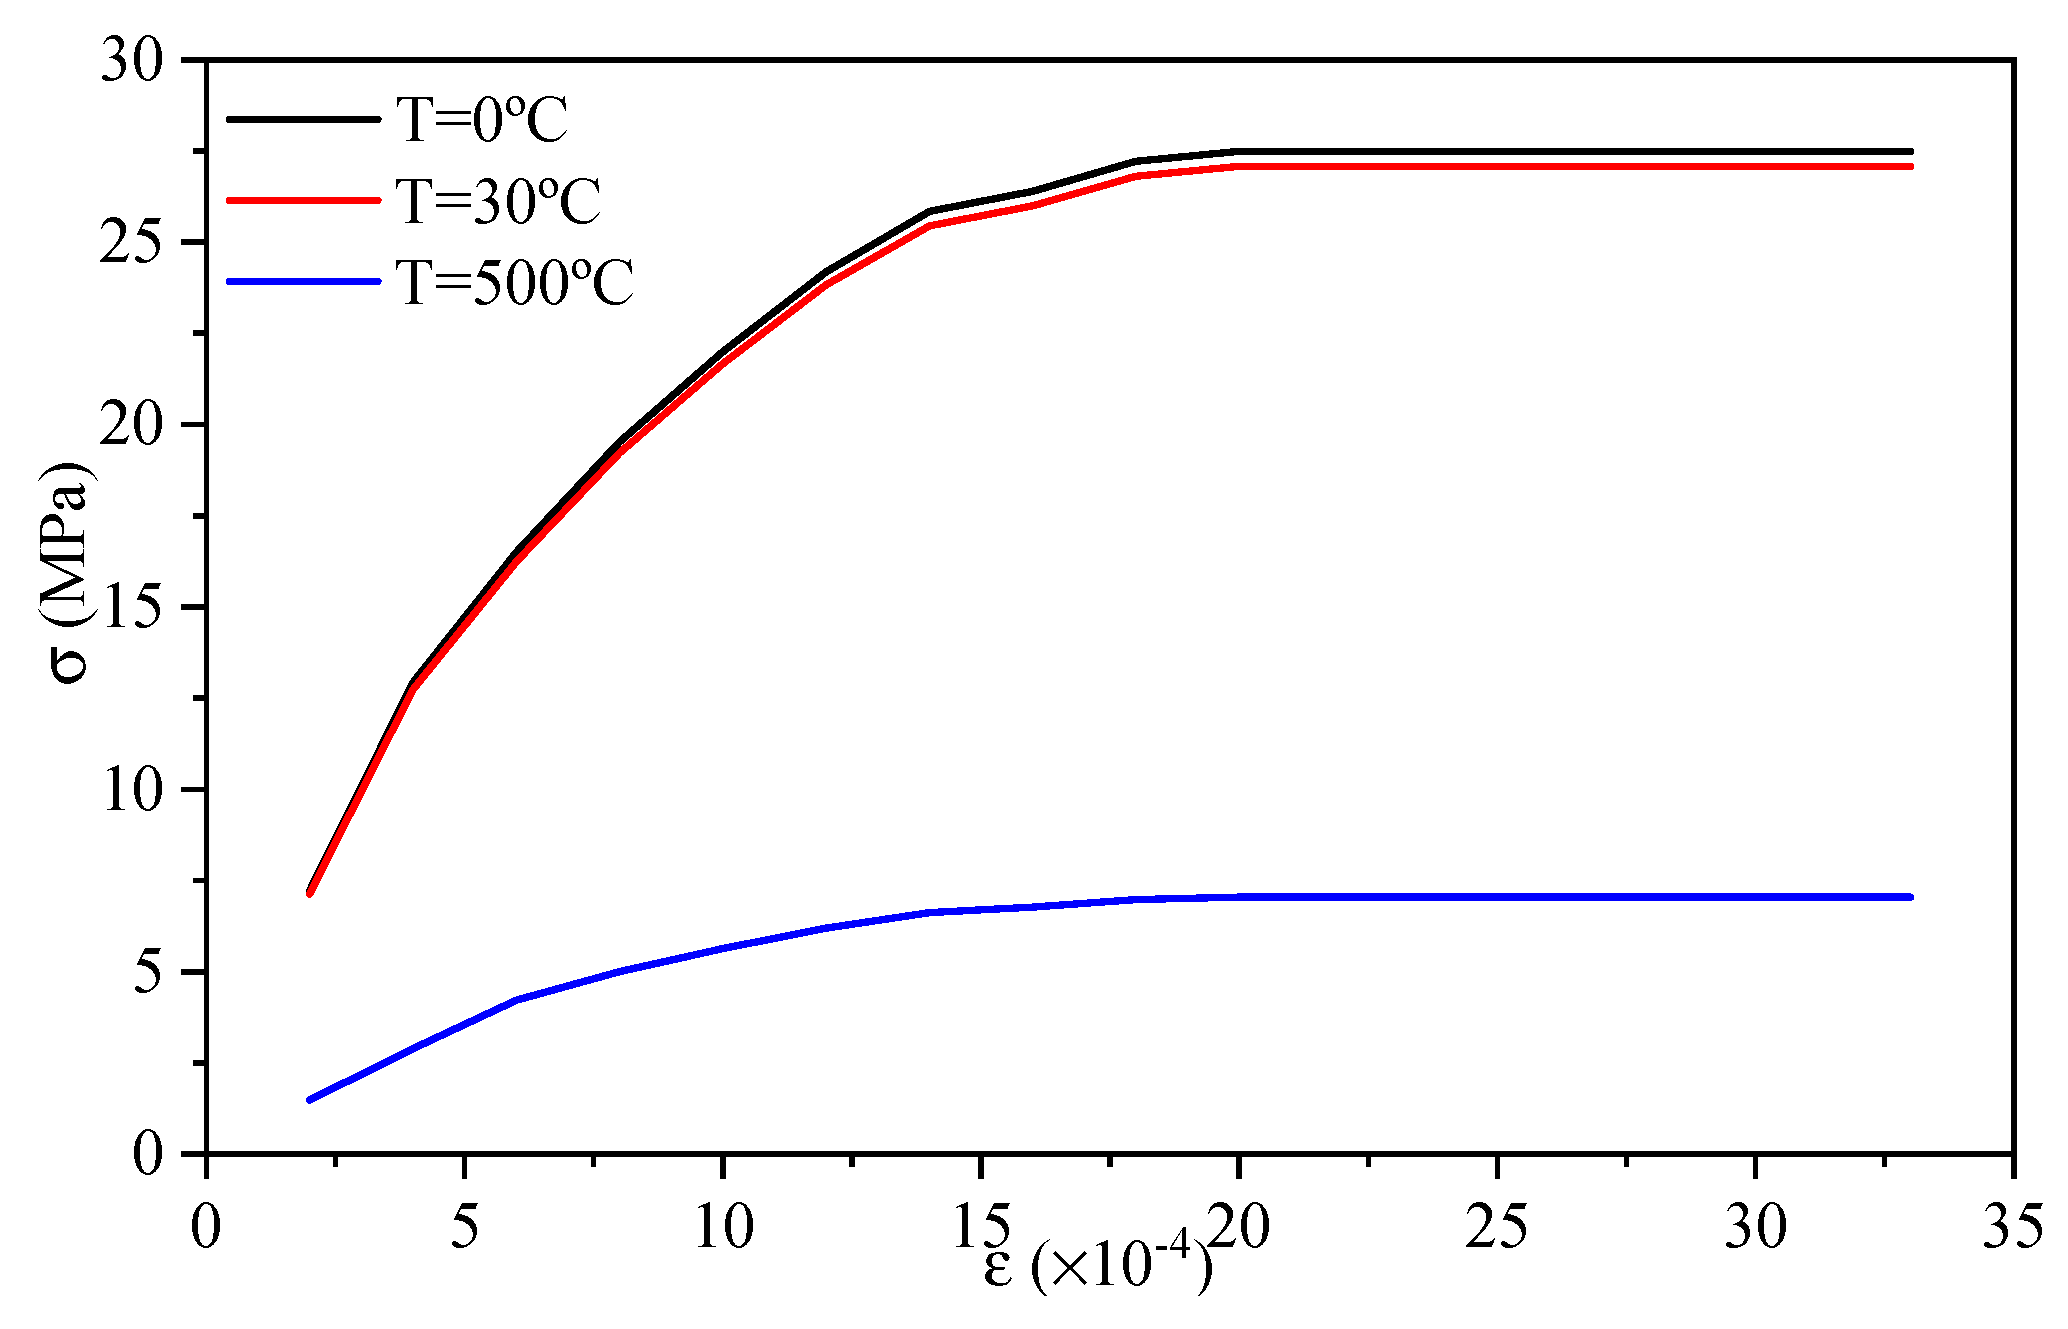
When the temperature is between 0 °C and 30 °C, the temperature effect has less of an effect on the dynamic value analysis of the bridge structure. When the temperature is 500 °C, the acceleration response value decreases, but the displacement response value and stress response value of the pier structure increase. The temperature effect changes the influence law of the hydrodynamic effect on the structure at different water levels. At water levels between 0 m and 10 m, the temperature effect reduces the fundamental frequency of acceleration and displacement responses by 1.4 Hz, and decreases the fundamental frequency of stress responses by 1.5 Hz. At a water level of 20 m, the temperature effect lowers the fundamental frequency of acceleration, displacement, and stress responses by 1.15 Hz. The temperature effect on the structure is greater than the hydrodynamic effect.
(4)
When under the action of the Tianjin earthquake, taking the acceleration and displacement at the pier top and stress at the pier base as examples, at a 10 m water level, the superposition effects of temperature and hydrodynamic effects increase the acceleration, displacement, and stress by 2.3172 m/s2, 0.007 m, and 1.4443 MPa, respectively, compared to the combined effects. At a 20 m water level, compared to the combined effects of temperature and hydrodynamic effects, these values increase by 3.0577 m/s2, 0.017 m, and 4.0721 MPa, respectively. When the hydrodynamic effect and the temperature effect combine on the bridge structure, it cannot simply be considered a linear superposition when the hydrodynamic effect and temperature effect act separately. The interaction between the hydrodynamic effect and the temperature effect is extremely complicated.
This study can combine the temperature effects caused by fires with the hydrodynamic effects induced by earthquakes, providing a profound understanding of the combined impact of fire and earthquake disasters on bridge structures. It aims to provide theoretical and practical insights to enhance the resilience of bridges against such disasters. However, the study focuses primarily on the hydrodynamic effects caused by earthquakes on bridge structures after a fire. This is aimed at certain extreme disaster scenarios, such as significant fires occurring in the upper parts of bridges where temperatures exceed 400 °C. These fires alter the material properties of the concrete structures because of their high temperatures.
Fire leads to a change in concrete constitutive, and the study of its seismic performance is helpful to study the durability of concrete. It is required that the concrete reduce the environmental impact to prolong its service life and meet the design and performance requirements, so to seek new materials, new formulations, and improve the construction technology. Therefore, the sustainability studied in this paper is to reduce the environmental impact, improve the efficiency of resource utilization, and prolong the service life of structures, and promote the sustainability of buildings and infrastructure.
The reinforced concrete structures are not only affected by fire disasters but also by corrosion. In practical engineering, the bridge is located in complex environments. Corrosion is one of the main causes of damage to reinforced concrete structures. In addition to the earthquake effects, bridges located in marine environments are also under wave and current action. Currently, there is no research on the dynamic response of corroded bridge pier structures to multiple hazards, such as combined earthquakes, waves, and current actions.

Author Contributions

G.Y. wrote the main manuscript text and prepared figures and tables. C.L. contributed to supervision, project administration, funding acquisition. All authors reviewed the manuscript. All authors have read and agreed to the published version of the manuscript.

Funding

The authors gratitude for the National Natural Science Foundation of China (Grant No. 51678107) and Nanxun Program for Young Scholars of ZJWEU (Grant No. RC2023021212) having charge of the finance work to assist with the project.

Institutional Review Board Statement

Not applicable.

Informed Consent Statement

Not applicable.

Data Availability Statement

The original contributions presented in the study are included in the article, further inquiries can be directed to the corresponding author.

Conflicts of Interest

The authors declare no conflict of interest.

References

  1. Yun, G.; Liu, C. Shaking table tests on a deep-water high-pier whole bridge under joint earthquake, wave and current action. Appl. Ocean Res. 2020, 103, 102329. [Google Scholar] [CrossRef]
  2. Yun, G.; Liu, C. A model for underwater shaking table tests on the basis of different similar criteria. Appl. Ocean Res. 2022, 118, 103010. [Google Scholar] [CrossRef]
  3. Kodur, V.; Naser, M.Z. Fire hazard in transportation infrastructure: Review, assessment, and mitigation strategies. Front. Struct. Civ. Eng. 2021, 15, 46–60. [Google Scholar] [CrossRef]
  4. Crespi, P.; Zucca, M.; Valente, M. On the collapse evaluation of existing RC bridges exposed to corrosion under horizontal loads. Eng. Fail. Anal. 2020, 116, 104727. [Google Scholar] [CrossRef]
  5. Crespi, P.; Zucca, M.; Valente, M.; Longarini, N. Influence of corrosion effects on the seismic capacity of existing RC bridges. Eng. Fail. Anal. 2022, 140, 106546. [Google Scholar] [CrossRef]
  6. Wang, Z.; Ge, J.; Wei, H. Seismic performance of precast hollow bridge piers with different construction details. Front. Struct. Civ. Eng. 2014, 8, 399–413. [Google Scholar] [CrossRef]
  7. Huang, M.; Guo, W.; Zhu, H.; Li, L. Dynamic test and finite element model updating of bridge structures based on ambient vibration. Front. Archit. Civ. Eng. China 2008, 2, 139–144. [Google Scholar] [CrossRef]
  8. Wu, K.; Ma, J.; Chen, Y.; Huang, X.; Qi, L.; Li, C. Study on the hydrodynamic added mass of rectangular pier under sine wave actions. Structures 2023, 54, 1371–1380. [Google Scholar] [CrossRef]
  9. Liaw, C.Y.; Chopra, A.K. Dynamics of towers surrounded by water. Earthq. Eng. Struct. Dyn. 1974, 3, 33–49. [Google Scholar] [CrossRef]
  10. Wang, P.; Zhao, M.; Li, H.; Du, X. An accurate and efficient time-domain model for simulating water-cylinder dynamic interaction during earthquakes. Eng. Struct. 2018, 166, 263–273. [Google Scholar] [CrossRef]
  11. Wang, P.; Zhao, M.; Du, X. Simplified Formula for Earthquake-Induced Hydrodynamic Pressure on Round-Ended and Rectangular Cylinders Surrounded by Water. J. Eng. Mech. 2019, 145, 04018137. [Google Scholar] [CrossRef]
  12. Wang, P.; Zhao, M.; Du, X.; Liu, J. Dynamic Response of Bridge Pier under Combined Earthquake and Wave–Current Action. J. Bridge Eng. 2019, 24, 04019095. [Google Scholar] [CrossRef]
  13. Liang, F.; Liang, X.; Wang, C. Simplified Added-Mass Model for Evaluating the Response of Rectangular Hollow Bridge Piers under Earthquakes. J. Bridge Eng. 2021, 26, 04021076. [Google Scholar] [CrossRef]
  14. Guo, J.; Zhao, M.; Wang, P.; Zhang, N. Comparative assessment of simplified methods for hydrodynamic force on cylinder under earthquakes. Ocean Eng. 2021, 234, 109219. [Google Scholar] [CrossRef]
  15. Liu, C.; Zhang, S.; Hao, E. Joint earthquake, wave and current action on the pile group cable-stayed bridge tower foundation: An experimental study. Appl. Ocean Res. 2017, 63, 157–169. [Google Scholar] [CrossRef]
  16. Ding, Y.; Ma, R.; Shi, Y.; Li, Z. Underwater shaking table tests on bridge pier under combined earthquake and wave-current action. Mar. Struct. 2018, 58, 301–320. [Google Scholar] [CrossRef]
  17. Qi, Q.; Shao, C.; Wei, W.; Xiao, Z.; He, J. Seismic performance of railway rounded rectangular hollow tall piers using the shaking table test. Eng. Struct. 2020, 220, 110968. [Google Scholar] [CrossRef]
  18. Nariman, N.A. Thermal fluid-structure interaction and coupled thermal-stress analysis in a cable stayed bridge exposed to fire. Front. Struct. Civ. Eng. 2018, 12, 609–628. [Google Scholar] [CrossRef]
  19. Zheng, X.; Jian, J.; Liu, L.; Sun, B.; Zhang, K.; Gao, H. Static and dynamic performance analysis of cable-stayed bridges with cables damaged fire. Buildings 2024, 14, 884. [Google Scholar] [CrossRef]
  20. Paya-Zaforteza, I.; Zmigrodzki, S.; Stochino, F. From flames to resilience: New perspectives for the design of structures against fire hazards. Struct. Eng. Int. 2023, 33, 547. [Google Scholar] [CrossRef]
  21. Sohn, H.; Dzwonczyk, M.; Straser, E.G.; Kiremidjian, A.S.; Law, K.H.; Meng, T. An experimental study of temperature effect on modal parameters of the Alamosa Canyon Bridge. Earthq. Eng. Struct. Dyn. 1999, 28, 879–897. [Google Scholar] [CrossRef]
  22. Xiao, J.-Z.; Li, J.; Jiang, F. Research on the seismic behavior of HPC shear walls after fire. Mater. Struct. 2004, 37, 506–512. [Google Scholar] [CrossRef]
  23. Mazza, F. Effects of near-fault vertical earthquakes on the nonlinear incremental response of r.c. base-isolated structures exposed to fire. Bull. Earthq. Eng. 2015, 14, 433–454. [Google Scholar] [CrossRef]
  24. Mazza, F. Wind and earthquake dynamic responses of fire-exposed steel framed structures. Soil Dyn. Earthq. Eng. 2015, 78, 218–229. [Google Scholar] [CrossRef]
  25. Ni, S.; Birely, A.C. Local and global response data from post-fire earthquake simulations of RC structural walls. Data Brief 2018, 19, 1650–1657. [Google Scholar] [CrossRef] [PubMed]
  26. Ni, S.; Birely, A.C. Simulation procedure for the post-fire seismic analysis of reinforced concrete structural walls. Fire Saf. J. 2018, 95, 101–112. [Google Scholar] [CrossRef]
  27. Ni, S.; Birely, A.C. A simplified model for the post-fire earthquake flexural response of reinforced concrete walls with boundary elements. Eng. Struct. 2018, 175, 721–730. [Google Scholar] [CrossRef]
  28. Li, L.; Liu, X.; Yu, J.-T.; Lu, Z.-D.; Su, M.-N.; Liao, J.-H.; Xia, M. Experimental study on seismic performance of post-fire reinforced concrete frames. Eng. Struct. 2019, 179, 161–173. [Google Scholar] [CrossRef]
  29. Li, W.; Wang, T.; Han, L.-H. Seismic performance of concrete-filled double-skin steel tubes after exposure to fire: Experiments. J. Constr. Steel Res. 2019, 154, 209–223. [Google Scholar] [CrossRef]
  30. Li, S.; Han, L.-H.; Wang, F.-C.; Hou, C.-C. Seismic behavior of fire-exposed concrete-filled steel tubular (CFST) columns. Eng. Struct. 2020, 224, 111085. [Google Scholar] [CrossRef]
  31. Wei, X.; Ngeljaratan, L.; Bruneau, M. Low-Cycle Fatigue of Buckling Restrained Braces in Bidirectional Ductile End Diaphragms Due to Temperature-Change Effect on Bridge Superstructure. J. Bridge Eng. 2019, 24, 04019014. [Google Scholar] [CrossRef]
  32. Bayane, I.; Mankar, A.; Brühwiler, E.; Sørensen, J.D. Quantification of traffic and temperature effects on the fatigue safety of a reinforced-concrete bridge deck based on monitoring data. Eng. Struct. 2019, 196, 109357. [Google Scholar] [CrossRef]
  33. Sernizon Costa, R.; Lavall, A.C.C.; da Silva, R.G.L.; dos Santos, A.P.; Viana, H.F. Cable structures: An exact geometric analysis using catenary curve and considering the material nonlinearity and temperature effect. Eng. Struct. 2022, 253, 113738. [Google Scholar] [CrossRef]
  34. Sun, L.; Zhou, Y.; Min, Z. Experimental Study on the Effect of Temperature on Modal Frequencies of Bridges. Int. J. Struct. Stab. Dyn. 2018, 18, 1850155. [Google Scholar] [CrossRef]
  35. Tran, H.; Robert, D.; Gunarathna, P.; Setunge, S. Estimating cost of bridge closure for bridge network rehabilitation priorities. J. Constr. Eng. Manag. 2024, 150, 04024071. [Google Scholar] [CrossRef]
  36. Wang, X. Ansys Numerical Analysis of Engineering Structures; China Communications Press: Beijing, China, 2007. (In Chinese) [Google Scholar]
  37. GB 18306-2015; National Standards of People’s Republic of China. Seismic Ground Motion Parameters Zonation Map of China. China Standard Press: Beijing, China, 2015. (In Chinese)
  38. Pan, C.; Zhang, R. A Useful Tool to Process and Generate Earthquake Signals [CP/OL]. Available online: www.eqsignal.com (accessed on 1 January 2022).
  39. Pan, C.; Zhang, R.; Luo, H.; Shen, H. Baseline correction of vibration acceleration signals with inconsistent initial velocity and displacement. Adv. Mech. Eng. 2016, 8, 1687814016675534. [Google Scholar] [CrossRef]
  40. Pan, C.; Zhang, R.; Luo, H.; Shen, H. Target-based algorithm for baseline correction of inconsistent vibration signals. J. Vib. Control 2017, 24, 2562–2575. [Google Scholar] [CrossRef]
  41. Former Ministry of Urban and Rural Building Environmental Protection of the People’s Republic of China. Code for Seismic Design of Building; China Construction Industry Press: Beijing, China, 2010. (In Chinese) [Google Scholar]
  42. Yun, G.; Liu, C. Nonlinear dynamic analysis of the deep-water bridge piers under combined earthquakes and wave actions. Ocean Eng. 2022, 261, 112076. [Google Scholar] [CrossRef]
  43. Morison, J.R.; Johnson, J.W.; Schaaf, S.A. The force exerted by surface waves on piles. J. Pet. Technol. 1950, 2, 149–154. [Google Scholar] [CrossRef]
  44. Li, Q.; Yang, W. An improved method of hydrodynamic pressure calculation for circular hollow piers in deep water under earthquake. Ocean Eng. 2013, 72, 241–256. [Google Scholar] [CrossRef]
  45. Yang, W.; Li, Q. The expanded Morison equation considering inner and outer water hydrodynamic pressure of hollow piers. Ocean Eng. 2013, 69, 79–87. [Google Scholar] [CrossRef]
  46. Yang, W.; Li, A.; Feng, X.; Deng, L.; Li, F. Calculation method of hydrodynamic force on one column of the twin columns under earthquake. Ocean Eng. 2020, 197, 106874. [Google Scholar] [CrossRef]
  47. Penzien, J.; Kaul, M.K.; Berge, B. Stochastic response of offshore towers to random sea waves and strong motion earthquakes. Comput. Struct. 1972, 2, 733–756. [Google Scholar] [CrossRef]
  48. Penzien, J.; Kaul, M.K. Response of offshore towers to strong motion earthquakes. Earthq. Eng. Struct. Dyn. 1972, 1, 55–68. [Google Scholar] [CrossRef]
  49. Song, B.; Zheng, F.; Li, Y. Study on a Simplified Calculation Method for Hydrodynamic Pressure to Slender Structures Under Earthquakes. J. Earthq. Eng. 2013, 17, 720–735. [Google Scholar] [CrossRef]
  50. Pang, Y.; Cai, L.; He, W.; Wu, L. Seismic assessment of deep water bridges in reservoir considering hydrodynamic effects using endurance time analysis. Ocean Eng. 2020, 198, 106846. [Google Scholar] [CrossRef]
  51. Huang, L. Great span concrete bridge temperature effect formula summary. China Water Transp. Theor. Ed. 2007, 5, 46–47. (In Chinese) [Google Scholar]
  52. Xiang, S.; Wang, D.; Yang, L.; Tan, B. Study on the life cycle simulation method of the temperature field and temperature effect of a steel–concrete composite bridge deck system. Meas. Control 2021, 54, 1068–1081. [Google Scholar] [CrossRef]
  53. Wu, B.; Yuan, J.; Wang, G. Experimental study on mechanical properties of high strngth concrete after high temperature. Chin. Civ. Eng. J. 2000, 33, 8–12+34. (In Chinese) [Google Scholar]
  54. Xiao, J.; König, G. Study on concrete at high temperature in China—An overview. Fire Saf. J. 2004, 39, 89–103. [Google Scholar] [CrossRef]
  55. Wu, B.; Ma, Z.; Ou, J. Experimental Research on Deformation and Constitutive Relationship of Concrete Under Axial Loading and High Temperature. J. Build. Struct. 1999, 20, 42–49. (In Chinese) [Google Scholar]
  56. Li, W.; Guo, Z. Experimental investigation of strength and deformation of Concrete at elevated temperature. J. Build. Struct. 1993, 14, 8–16. (In Chinese) [Google Scholar]
  57. Chang, Y.F.; Chen, Y.H.; Sheu, M.S.; Yao, G.C. Residual stress–strain relationship for concrete after exposure to high temperatures. Cem. Concr. Res. 2006, 36, 1999–2005. [Google Scholar] [CrossRef]
  58. Jing, R.; Kang, J.; Jiang, Y. Influence of temperature rising by 20 °C to 50 °C on concrete elastic modulus. Bull. Chin. Ceram. Soc. 2016, 35, 4207–4211. (In Chinese) [Google Scholar]
Figure 1. Diagram of the bridge structure. (a) Planar graphs; (b) finite element model. (unit: m).
Sustainability 16 06486 g001aSustainability 16 06486 g001b
Figure 2. The time history and response spectrum of the input earthquakes. (a) E1 time history, (b) the response spectrum of E1, (c) E2 time history, (d) response spectrum of E2, (e) Tianjin earthquake horizontal Z direction time history, PGA = 1.4505 m/s2, (f) Tianjin earthquake horizontal Y direction time history, PGA = 0.7314 m/s2.
Sustainability 16 06486 g002aSustainability 16 06486 g002b
Figure 3. Relationship of concrete properties with temperature change. (a) elastic modulus, (b) compressive strength.
Sustainability 16 06486 g003
Figure 4. Stress–strain curves of concrete materials at various temperatures.
Sustainability 16 06486 g004
Figure 5. Frequency of the bridge at various water depths and temperatures. (a) Frequency curves, (b) Frequency columns.
Sustainability 16 06486 g005
Figure 6. Acceleration values of the side piers with different water levels under artificial earthquake wave action. (a) Acceleration histogram (b) Acceleration hydrodynamic effects.
Sustainability 16 06486 g006
Figure 7. Displacement values of the side pier at different water levels under artificial earthquake wave action. (a) Displacement histogram (b) Displacement hydrodynamic effects.
Sustainability 16 06486 g007
Figure 8. The acceleration values of the main pier of different water levels under artificial earthquake waves action. (a) Acceleration histogram; (b) Acceleration hydrodynamic effect curves.
Sustainability 16 06486 g008
Figure 9. Displacement values of the bridge main pier at various water levels under artificial earthquake wave action. (a) Displacement histogram; (b) Displacement hydrodynamic effect curves.
Sustainability 16 06486 g009
Figure 10. The acceleration and displacement hydrodynamic effects of the main pier of different water levels under Tianjin earthquake wave action. (a) Acceleration; (b) Displacement.
Sustainability 16 06486 g010
Figure 11. Acceleration curves of different water levels and temperatures under artificial earthquake action. (a) Water level = 0 m, (b) water level = 10 m, (c) water level = 20 m, (d) acceleration temperature effects.
Sustainability 16 06486 g011
Figure 12. Time history curves of the acceleration of various water levels and temperatures at the pier top under artificial earthquake action. (a) Water level = 0 m, (b) water level = 10 m, (c) water level = 20 m.
Sustainability 16 06486 g012
Figure 13. Acceleration frequency domain of various water levels and temperatures at the pier top under artificial earthquake action. (a) Water level = 0 m, (b) water level = 10 m, (c) water level = 20 m.
Sustainability 16 06486 g013
Figure 14. Curves of the displacement with respect to the pier height at various water levels and temperatures under artificial earthquake action. (a) Water level = 0 m, (b) water level = 10 m, (c) water level = 20 m, (d) displacement temperature effects.
Sustainability 16 06486 g014
Figure 15. Time history curves of the displacement of various water levels and temperatures of the pier top under artificial earthquake action. (a) Water level = 0 m, (b) water level = 10 m, (c) water level = 20 m.
Sustainability 16 06486 g015
Figure 16. The frequency domain of the displacement of various water levels and temperatures at the pier top under artificial earthquake action. (a) Water level = 0 m, (b) water level = 10 m, (c) water level = 20 m.
Sustainability 16 06486 g016
Figure 17. Curves of the stress with respect to the pier height at different water levels and temperatures under artificial earthquake action. (a) Water level = 0 m, (b) water level = 10 m, (c) water level = 20 m, (d) hydrodynamic and temperature effects of the stress.
Sustainability 16 06486 g017
Figure 18. The time history of the stress of different water levels and temperatures at the pier top under artificial earthquake action. (a) Water level = 0 m, (b) water level = 10 m, (c) water level = 20 m.
Sustainability 16 06486 g018
Figure 19. The frequency domain of the stress of various water levels and temperatures at the pier top under artificial earthquake action. (a) water level = 0 m, (b) water level = 10 m, (c) water level = 20 m.
Sustainability 16 06486 g019
Figure 20. The acceleration time history of various water levels and temperatures at the pier top under the action of the Tianjin earthquakes. (a) Water level = 0 m, (b) water level = 10 m, (c) water level = 20 m.
Sustainability 16 06486 g020
Figure 21. Displacement time history of various water levels and temperatures at the pier top under the action of Tianjin earthquakes. (a) Water level = 0 m, (b) water level = 10 m, (c) water level = 20 m.
Sustainability 16 06486 g021
Figure 22. The stress time history of various water levels and temperatures under the Tianjin earthquake action (pier height = 5 m). (a) Water level = 0 m, (b) water level = 10 m, (c) water level = 20 m.
Sustainability 16 06486 g022
Figure 23. Comparison of the dynamic response of the under superposition and combined artificial earthquake wave action. (a) Acceleration, water level = 10 m; (b) acceleration, water level = 20 m; (c) displacement, water level = 10 m; (d) displacement, water level = 20 m; (e) stress, water level = 10 m; (f) stress, water level = 20 m.
Sustainability 16 06486 g023aSustainability 16 06486 g023b
Figure 24. Comparison of the dynamic response of the under-superposition and combined Tianjin earthquake wave action. (a) Acceleration, water level = 10 m; (b) acceleration, water level = 20 m; (c) displacement, water level = 10 m; (d) displacement, water level = 20 m; (e) stress, water level = 10 m; (f) stress, water level = 20 m.
Sustainability 16 06486 g024
Table 1. Characteristic of the earthquake waves.
EarthquakesCharacteristic PeriodAmplification FactorDamping RatioFitting Tolerance
E10.402.500.050.02
E20.352.500.050.02
Table 2. Combined and joint action values of the dynamic responses of temperature effects and hydrodynamic effects.
Dynamic
Response
ConditionsWater Levels (m)
1020
Acceleration
(m/s2)
Combined3.92313.2943
Superposition6.24036.3520
Error59.06%92.82%
Displacement (m)Combined0.02700.0170
Superposition0.03400.0340
Error25.93%100%
Stress
(MPa)
Combined2.91593.1851
Superposition4.36027.2572
Error49.53%127.85%
Error = (Dsup − Dcom) × 100%/Dcom.
Disclaimer/Publisher’s Note: The statements, opinions and data contained in all publications are solely those of the individual author(s) and contributor(s) and not of MDPI and/or the editor(s). MDPI and/or the editor(s) disclaim responsibility for any injury to people or property resulting from any ideas, methods, instructions or products referred to in the content.

