Article

Research on the Mechanism of Collaborative Innovation in Green Technology among Supply Chain Enterprises Based on Cost Sharing and Market Competition

1
School of Economics and Management, China University of Geosciences, Beijing 100083, China
2
Key Laboratory of Carrying Capacity Assessment for Resource and Environment, Ministry of Natural Resources, Beijing 100083, China
*
Author to whom correspondence should be addressed.
Sustainability 2024, 16(15), 6295; https://doi.org/10.3390/su16156295
Submission received: 20 June 2024 / Revised: 18 July 2024 / Accepted: 21 July 2024 / Published: 23 July 2024

Abstract

:
Supply chain green technology collaborative innovation is an important means for enterprises to improve the greenness of their products. This paper takes supply chain green technology innovation collaboration as the research object and constructs a stochastic differential game model, which not only provides reference for enterprises to choose the optimal type of technology innovation by combining with their own characteristics, but also provides a reference for their innovation decision-making in different market competition environments. The study shows the following: (1) in green product innovation, the formation of the cost-sharing contract is less affected by the intensity of competition in the green market when the market preference for greenness is relatively low. Therefore, government subsidies become an important tool to effectively guide the market mechanism to achieve the desired goal. As market competition intensifies, manufacturers’ incentives to suppliers will shift from reducing costs to increasing demand. (2) In green process innovation, when the intensity of green competition is low and suppliers’ process innovation efficiency is high, manufacturers should bear more costs; when the market preference for greenness is low, the market competition is intense, and the suppliers’ process innovation efficiency is low, the suppliers should bear more costs to help the manufacturers gain more market shares. (3) When retailers’ preference for greenness is relatively low, the government subsidy becomes an important tool to effectively guide the market mechanism to achieve the desired goal. (4) When the retailer’s green promotion performance is higher than the manufacturer’s, the manufacturer should bear more green promotion costs; conversely, the retailer should bear more green promotion costs. (5) Over time, the marginal increase in price over the marginal increase in greenness helps stabilise price volatility, considering consumer preferences. Conversely, it helps to increase the average value of prices.

1. Introduction

With the aggravation of global environmental problems, green technology innovation has become an important way for enterprises to realize sustainable development. Green technology innovation can not only reduce environmental pollution but also improve the efficiency of resource utilization. However, green technology innovation often faces high initial costs and requires the cooperation of upstream and downstream enterprises in the whole supply chain [1].
Government policies play a leading role in the early stages of enterprise green technology innovation [2,3]. In response to environmental requirements, enterprises are forced to adjust their production processes and adopt green technologies to comply with policy regulations [4]. Enterprises reduce emissions to meet policy requirements [5], suppliers at the upstream of the supply chain are the first to face cost pressures [6], and manufacturers carry out green technological innovations with more emphasis on the balance between economic and environmental benefits [7]. Therefore, enterprises in the supply chain are more inclined to cooperative innovation [8]. With the improvement of consumers’ environmental awareness, enterprises not only to comply with policy requirements, but also to enhance market competitiveness to green technology innovation [9]. At this stage, enterprises in the supply chain need to adopt different cost-sharing strategies based on the intensity of market competition and consumer preferences [10].
According to the different innovation objects, it can be divided into green product innovation and green production process innovation [11]. Green product innovation refers to the development of products with environmental benefits and high resource utilization [11]. Green production process innovation adopts environmentally friendly and efficient process technologies to reduce energy consumption and realize the environmental friendliness of the production process [11]. Manufacturers, suppliers, and retailers often adopt different cost-sharing strategies in different green technology innovations. In the process of green product innovation, manufacturers are often willing to share a portion of suppliers’ innovation costs and retailers’ promotion costs, taking into account brand image and product uniqueness [12]. For example, when Tesla developed its new energy electric car, it not only bore the huge R&D costs alone, but also co-financed with its component suppliers to assist in the development of green innovations. In the process of green process innovation, suppliers and manufacturers usually work together to optimize processes and share the costs of innovation [12]. For example, Siemens focuses on process innovation and fosters cooperation in the R&D process by joining forces with suppliers to research and improve production processes and adopt more efficient energy technologies and methods to reduce production waste [13].
Early studies focused on the concept of green supply chain management [8] and its impact on environmental performance [14]. With the promotion of the green development concept, research on the influencing factors [15] and optimization strategies [16] of the green supply chain implementation chain has gradually increased. On the one hand, studies have explored the role mechanisms of government subsidies [17,18], channel power structure [19,20] and blockchain technology [21,22,23,24] in green supply chains, and on the other hand, studies have focused on the innovation cooperation model [7,25] and performance evaluation [26] of green supply chains, and found that collaborative relationships among supply chain partners had a positive effect on promoting green technological innovation [27], and improved product greenness [11,28]. In terms of cost sharing, some studies investigated the cooperation between manufacturers and suppliers [29], and its impact on product greenness [30] by constructing a game model and found that the cost sharing strategy can effectively improve the environmental performance and competitiveness of the supply chain [31,32]. In terms of market competition, brand competition and market share make enterprises pay more attention to green technology innovation [33]. With the fierce market competition, enterprises are more inclined to invest in green technology innovation to increase their market share and consumer satisfaction [6,34,35]. In this process, enterprises with weaker competition are more susceptible to the influence of the market [36]. In terms of market greenness preference, consumer preference for green products helps to increase green product market share and corporate profits, which in turn motivates enterprises to pursue green technological innovation and improve product greenness [37,38,39]. In terms of innovation efficiency, the study analyzed the spatial and temporal differences in green technology innovation efficiency [40] and the impacting factors [41,42], and found that green technology innovation efficiency affects the profits of suppliers, manufacturers, and retailers, which in turn affects their decision-making [19].
Although existing studies have paid attention to the impact of many factors on green technological innovation, such as cost-sharing mechanisms, the degree of market competition, market greenness preference and innovation efficiency, they have not adequately considered the complex interactions among market-driven green technological innovations and their impact on greenness. There is still a lack of in-depth discussion on the specific impacts of different types of green technological innovation (e.g., product innovation, process innovation) and the intensity of competition in the green market on the supply chain cooperation model and cost-sharing mechanism. There is relatively limited research on how to formulate effective cooperation strategies for green technological innovation in different market competition environments and innovation types under the three-tier supply chain framework. Meanwhile, dynamic games are often used to study environmental pollution control problems. Differential games are a combination of continuous-time dynamic optimization methods (optimal control, dynamic programming) and game theory. Compared with differential games, stochastic differential games can better portray the variability and uncertainty. In stochastic differential games, individuals need to repeat their interactions over time instead of standard repetitions, and they optimize their conflicting objectives, pursue the optimal strategies of dynamic evolution, and achieve Nash equilibrium. In traditional dynamic optimization methods, the study is mostly about a single individual, but in supply chain green technology innovation, the state variable values are jointly driven by the control variables of multiple individuals. The stochastic differential game model can dynamically analyze and control the strategic decision-making behaviours of participants under the consideration of time continuity and uncertainty [43]. It helps to analyze issues such as the conditions for the formation of cost-sharing contracts under different innovation modes, the mechanism of the role of the cost-sharing ratio on the greenness of the product, and the mechanism of the influence of the intensity of market competition and the green preference of consumers on the pricing strategy of the product. Thus, it provides a comprehensive framework to understand and predict the mechanism of green technology co-innovation in supply chains under the interaction of multiple complex factors.
This paper examines supply chain green technology innovation cooperation by constructing a stochastic differential game model that considers different innovation types and market competition environments. It differentiates the cost-sharing modes and the formation of product greenness across various innovation types. The study explores the conditions for establishing cost-sharing contracts and the mechanisms by which cost-sharing ratios improve product greenness in different innovation modes. Additionally, it investigates the influence of product characteristics and market competition environments on product pricing. This research aims to contribute to the theoretical framework of supply chain green technology innovation and provide theoretical guidance for upstream and downstream enterprises in the supply chain when making decisions on green technology innovation.
The rest of this paper is organized as follows. In Section 2, the two types of green technology co-innovation in supply chains are described in terms of the problem and the basic assumptions of the model are presented. In Section 3, the model is constructed and solved based on the aforementioned assumptions. The evolutionary characteristics of product greenness are also analyzed. In Section 4, the mechanism of innovation cost-sharing ratio and publicity cost in different innovation models is explored. The impact of market competition on price volatility is investigated. In Section 5, a numerical example is conducted to validate the model. In Section 6, the conclusions of the paper are presented.

2. Problem Description and Basic Assumptions

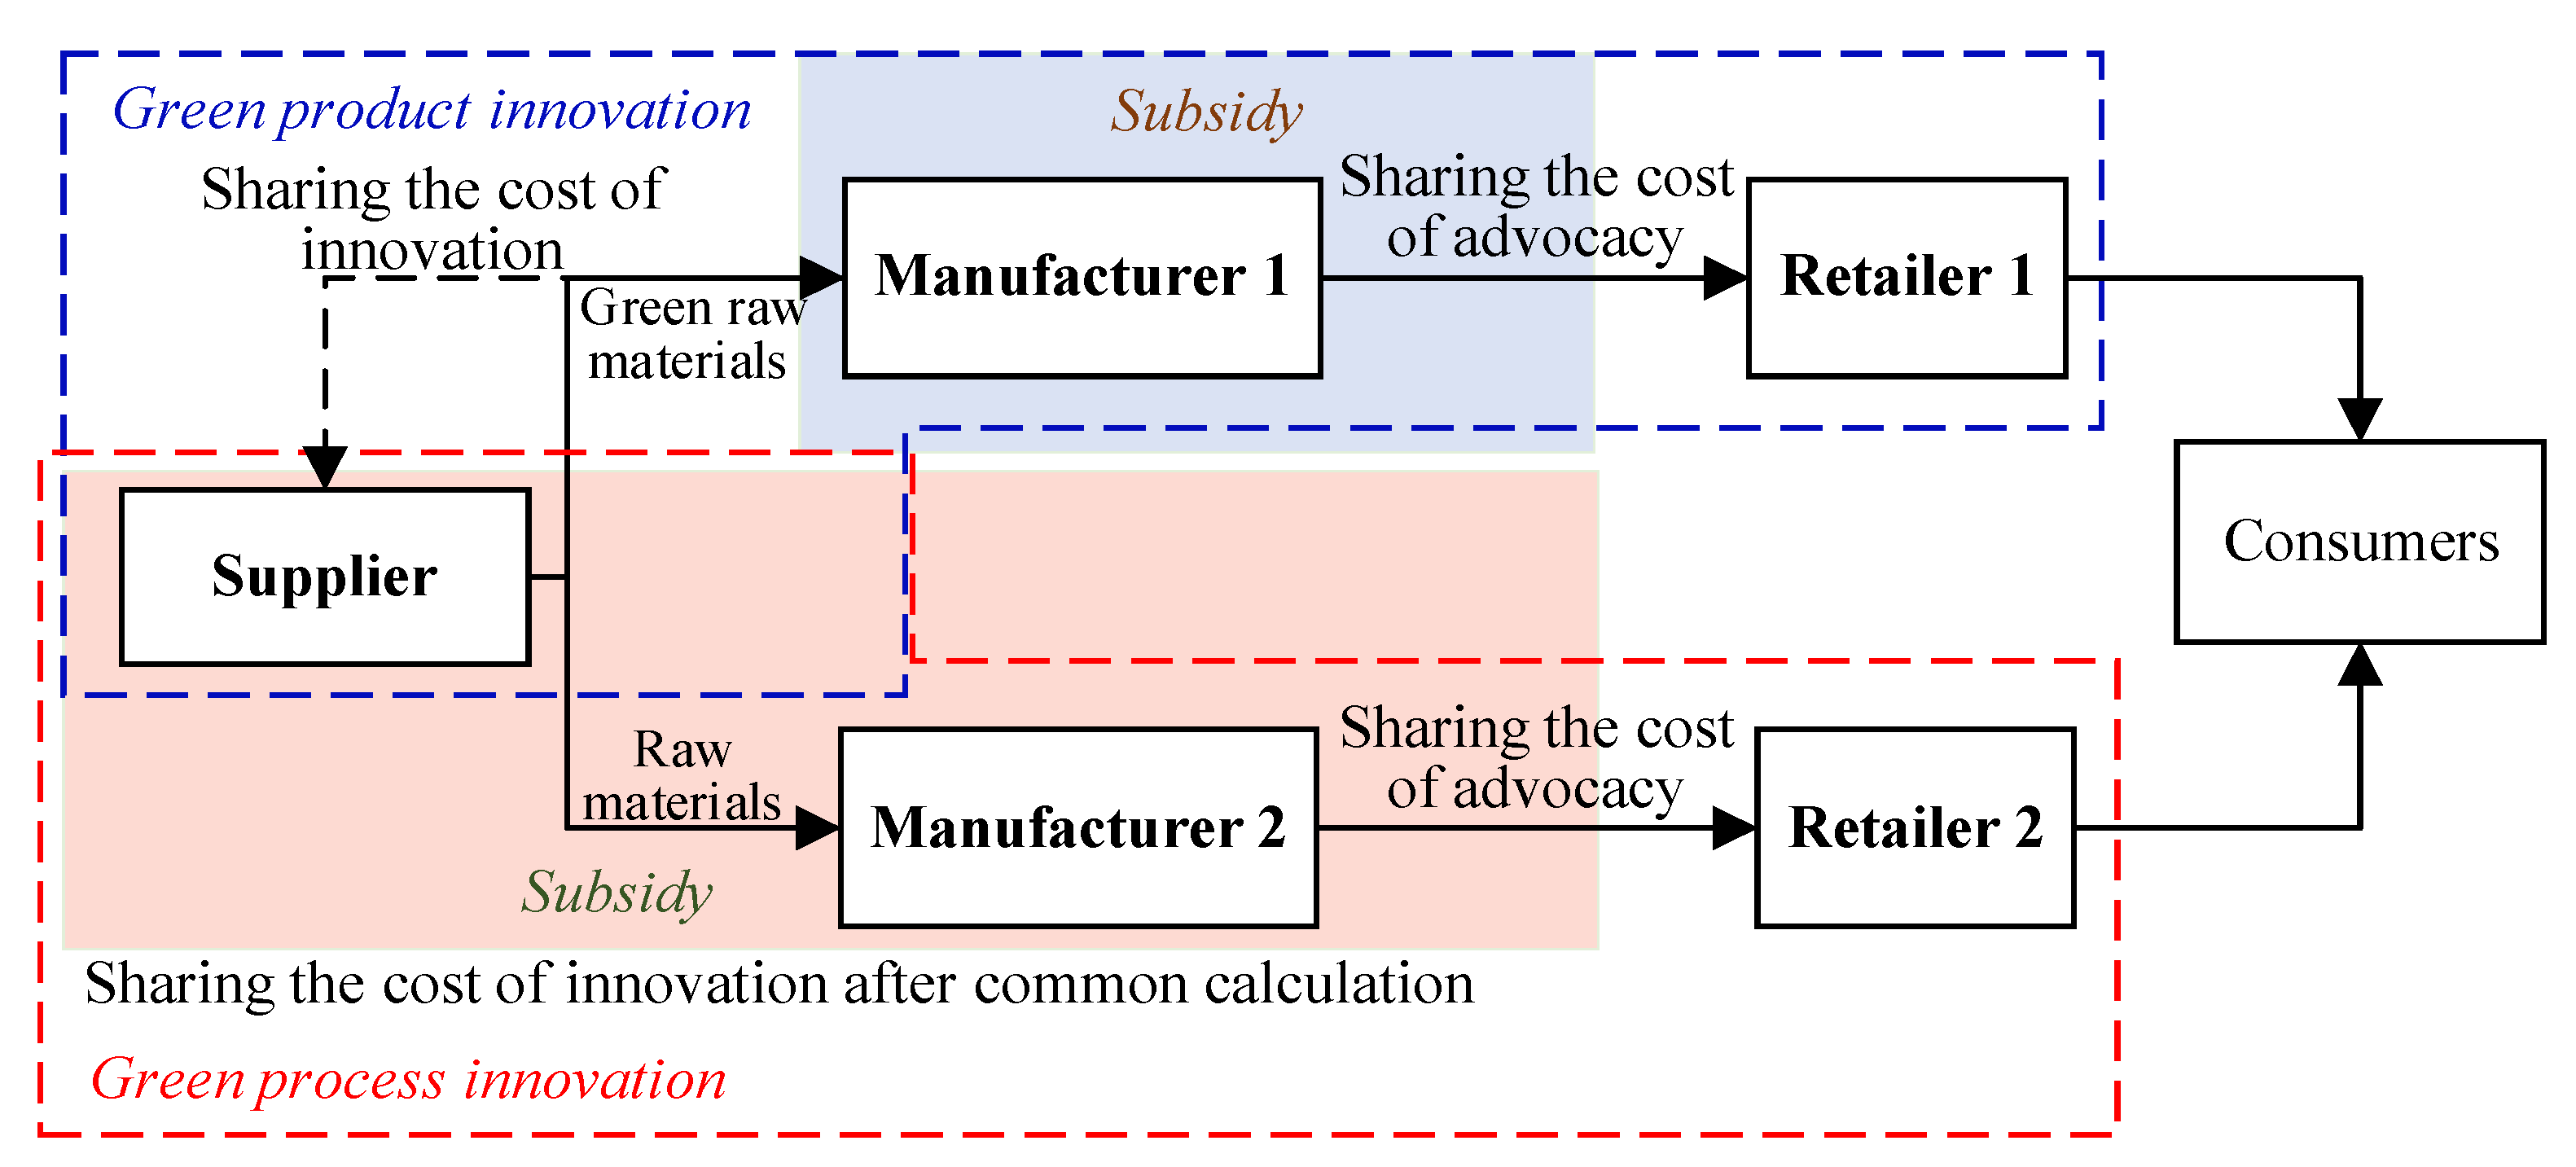
2.1. Problem Description

Manufacturers play a central role in the supply chain system. Typically, suppliers are responsible for producing and supplying basic raw materials and key components, while manufacturers handle the processing and production of final products. Retailers focus on the promotion and sale of these products. Although the products produced by manufacturers are functionally similar, the greenness of these products varies due to different green technology innovation strategies implemented during production. Additionally, long-established cooperative relationships within the supply chain mean that changing suppliers incurs significant switching costs for manufacturers. In the early stages of green technology innovation, there are fewer suppliers in the market that meet green standards. As a result, manufacturers actively seek to collaborate with suppliers to enhance green technology innovation across the entire supply chain.
To clarify the different impact mechanisms of product and process innovation, this study constructs a supply chain model comprising a shared supplier, two manufacturers, and two retailers. The key subjects and main processes involved in the process are shown in Figure 1. Specifically, Manufacturer 1 develops green products through a product innovation strategy, which requires emphasizing sustainability at the raw material selection stage. Consequently, suppliers innovate in the provision of raw materials to meet green product criteria. Product innovation is not only about key aspects such as product design and market positioning but also about Manufacturer 1’s core competencies and brand influence. Typically, Manufacturer 1 bears the R&D costs of product innovation alone to ensure its dominant position and maintain market competitiveness. Additionally, Manufacturer 1 partially covers the R&D costs of suppliers to incentivize proactive green product innovation. Retailer 1 promotes and sells these green products, enhancing consumer perceptions of product greenness through effective marketing activities. As the core enterprise, Manufacturer 1 also publicizes the green products and shares some of the green publicity costs with Retailer 1.
Manufacturer 2 enhances product greenness through process innovation strategies. This approach focuses on promoting resource recycling and reducing resource consumption and emissions by deepening supplier management and optimizing production processes. Within this strategy, Manufacturer 2 collaborates closely with suppliers to jointly calculate innovation costs and negotiate their respective cost-sharing ratios based on the specific needs of the collaborative project. Manufacturer 2 also collaborates with Retailer 2 on the greenness promotion and marketing strategy, sharing part of Retailer 2’s promotion costs and providing financial support to enhance the marketing of green products.
Spillover effects from green technology innovation can discourage enterprises from innovating. To counter this, governments provide financial support to reduce R&D costs and incentivize increased innovation investment. Given the reality of government subsidies for green factories and green supply chains, this study hypothesizes that the government will provide subsidies based on innovation outcomes. Specifically, subsidies will be granted solely to manufacturers for product innovations, while both suppliers and manufacturers will receive subsidies for process innovations.

2.2. Basic Assumptions

2.2.1. Cost Assumptions

The output of an enterprise’s activity is related to the inputs and also depends on the efficiency with which the inputs are utilized [44]. Most studies set the relationship between cost and effort level as a convex function [43,45]. In this paper, it is assumed that the innovation cost coefficient is η  when the input is f . If innovation cooperation arises, the efficiency of the cooperation between the two parties is v , and the output of the activity can be expressed as o = 1 2 v η f 2 . The corner notation below denotes m  for the manufacturer, s  for the supplier, and r  for the retailer, and 1 and 2 denote the different manufacturers and retailers, and the green innovation cost of each subject in the supply chain is shown in Table 1.
Assumption 1.
In green product innovation, the green innovation cost generated by the supplier is assumed to be  C s 1 t = 1 2 η s 1 f s 1 2 t , where  f s 1 t  is the level of green product innovation effort paid by the supplier and  η s 1  is the supplier’s green product innovation cost coefficient. The green innovation cost generated by Manufacturer 1 is a convex function of its innovation input,  C m 1 t = 1 2 η m 11 f m 11 2 t , where  f m 11 t  is the level of green product innovation effort paid by Manufacturer 1, and  η m 11  is the coefficient of green product innovation cost of Manufacturer 1, and the larger the  η m 11 , the higher the cost of innovation and the lower the efficiency of innovation. Efficiency is also lower. Based on the product innovation cost of Manufacturer 1, the government will subsidize the green product innovation with a subsidy ratio of  ξ m 1  and  0 < ξ m 1 < 1  , i.e., the government bears part of the innovation cost of Manufacturer 1. At the same time, the supply chain coordination between suppliers and Manufacturer 1 is realized through the cost-sharing contract, and Manufacturer 1 shares a certain proportion of the  θ s 1  green innovation cost for suppliers. After considering the cost-sharing contract and the government subsidy, the green product innovation cost of the supplier is  1 θ s 1 C s 1 , and the green product innovation cost of Manufacturer 1 is  1 ξ m 1 C m 1 + θ s 1 C s 1 . Manufacturer 1 and Retailer 1 share the cost of green publicity, and the total cost of publicity is  C m r 1 t = 1 2 ν 1 η m 12 f m 12 2 t + η r 1 f r 1 2 t , where  f m 12 t  is the level of green publicity effort paid by Manufacturer 1,  f r 1 t  is the level of green publicity effort paid by Retailer 1,  η m 12  is the coefficient of green publicity cost for Manufacturer 1, and  η r 1  is the cost coefficient of green publicity for Retailer 1.  ν 1  is the cost coefficient of cooperation between Manufacturer 1 and Retailer 1, where  0 < ν 1 < 1 , and the smaller  ν 1  is, the more efficient their cooperation is. The proportion of the total cost of publicity borne by Manufacturer 1 and Retailer 1 is  θ r 1  and  1 θ r 1 , respectively. At this point, the total cost of green product innovation and green publicity for Manufacturer 1 is  1 ξ m 1 C m 1 + θ s 1 C s 1 + θ r 1 C m r 1 , and that of green publicity for Retailer 1 is  1 θ r 1 C m r 1 .
In green process innovation, it is assumed that the green process innovation cost generated by the supplier is  C s 2 t = 1 2 ν 2 η s 2 f s 2 2 t , where  f s 2 t  is the level of the supplier’s green process innovation effort and  η s 2  is the supplier’s green process innovation cost coefficient. The green process innovation cost generated by Manufacturer 2 is  C m 2 t = 1 2 ν 2 η m 21 f m 21 2 t  , where  f m 21 t  (t) is the green process innovation effort level of Manufacturer 2 and  η m 21  is the green process innovation cost coefficient of Manufacturer 2.  ν 2  is the cost coefficient of supplier and Manufacturer 2 cooperation. Based on the cost of supplier and Manufacturer 2 process innovation, the government subsidizes the process innovation with a subsidy ratio of  ξ m 2  and  0 < ξ m 2 < 1  , i.e., the government bears part of the innovation cost of supplier and Manufacturer 2. At the same time, Manufacturer 2 cooperates with suppliers to improve equipment and production processes through green process innovation, alleviate the pressure of environmental regulation, reduce the cost of pollution control, and obtain price advantages. In this process, Manufacturer 2 bears a certain percentage  θ s 2  of the green process innovation cost. Considering the cost-sharing contract and government subsidy, the green process innovation cost of the supplier is  1 θ s 2 1 ξ m 2 C s 2  , and that of the Manufacturer 2 is  1 ξ m 2 θ s 2 C s 2 . The total cost of green publicity, which is shared by Manufacturer 2 and Retailer 2, is  C m r 2 t = 1 2 ν 3 η m 22 f m 22 2 t + η r 2 f r 2 2 t , where  f m 22 t  is the level of green publicity effort paid by Manufacturer 2,  f r 2 t  is the level of green publicity effort paid by Retailer 2,  η m 22  is the coefficient of green publicity cost of Manufacturer 2;  η r 2  is the cost coefficient of green publicity of Retailer 2.  ν 3  is the cost coefficient of cooperation between Manufacturer 2 and Retailer 2, where  0 < ν 3 < 1 . The proportion of the total cost of publicity to be borne by Manufacturer 2 and Retailer 2 is  θ r 2  and  1 θ r 2 , respectively. At this time, the total cost of green process innovation and green publicity for Manufacturer 2 is  1 ξ m 2 θ s 2 C s 2 θ r 2 C m r 2 , and that of green publicity for Retailer 2 is  1 θ r 2 C m r 2 .
In addition, for simplicity, other costs of daily production are not considered.
Based on the above assumptions, the cost of green innovation for suppliers, manufacturers and retailers after the introduction of cost-sharing contracts and government subsidies is shown in Table 2.

2.2.2. Product Greenness Assumptions

The development of product greenness is a stochastic process in which the suppliers’ choice of raw materials, the manufacturers’ production processes and the retailers’ promotional and sales strategies are all key factors influencing product greenness.
Assumption 2.
In green product innovation, the supplier first determines the level of green product innovation effort and the greenness of the raw material based on its greenness transformation effect. Next, as Manufacturer 1 processes and produces green products using the green raw materials provided by the suppliers, there is a multiplier effect on greenness due to the combined innovation efforts of both parties. Consequently, the greenness of the products produced by Manufacturer 1 is jointly determined by the innovation efforts and greenness transformation effects of both the suppliers and Manufacturer 1. Finally, Manufacturer 1 and Retailer 1 collaboratively promote the greenness of the green product innovation and determine the greenness of the promoted product based on its transformation effect. The greenness  g 1 t  of the product that undergoes product innovation is obtained by the joint efforts of the supplier, Manufacturer 1 and Retailer 1 [46,47], and the greenness  g 1 t  of the product produced by the green product innovation at moment  t  is as follows:
d g 1 t = φ s 1 f s 1 t 1 + φ m 11 f m 11 t + φ m 12 f m 12 t + φ r 1 f r 1 t δ g 1 t d t + σ g 1 t d W t
where  φ s 1  is the coefficient of effect of converting supplier’s green product innovation effort level into greenness,  φ m 1  is the coefficient of effect of converting Manufacturer 1’s green product innovation effort level into greenness,  φ r 1  is the coefficient of effect of converting Retailer 1’s green publicity effort level into greenness,  δ  denotes the natural rate of attenuation,  W t  is the Wiener process, and  σ  is the noise parameter.
In green process innovation, the supplier and Manufacturer 2 negotiate the level of their respective green process innovation efforts and determine the greenness of the product based on its conversion effect. At the same time, Manufacturer 2 and Retailer 2 jointly promote the green process innovation and determine the greenness of the promoted product based on its conversion effect. The greenness  g 2 t  of the product for which the process innovation is carried out is obtained by the joint efforts of the supplier, Manufacturer 2 and Retailer 2, and the greenness  g 2 t  of the product produced by the green process innovation at time  t  is as follows:
d g 2 t = φ s 2 f s 2 t + φ m 21 f m 21 t + φ m 22 f m 22 t + φ r 2 f r 2 t δ g 2 t d t + σ g 2 t d W t
where  φ s 2  is the coefficient of the effect of converting the supplier’s green process innovation effort into greenness,  φ m 2  is the coefficient of the effect of converting Manufacturer 2’s level of green process innovation effort into greenness, and  φ r 2  is the coefficient of the effect of converting Retailer 2’s level of green promotion effort into greenness.

2.2.3. Market Assumptions

Assumption 3.
There is a competitive relationship between the two types of products in the sales market, and this competitive relationship is represented by the market demand function. Competition is categorized into price competition and non-price competition; assuming that non-price competition depends on consumers’ preference for the greenness of the product, the market demand function  D m i t  for the product produced by manufacturer i is as follows:
D m 1 t = D 01 ( x m 1 ) + γ g g 1 t χ ζ g 2 t g 1 t + 1 ζ x m 1 x m 2 D m 2 t = D 02 x m 2 + γ g g 2 t χ ζ g 1 t g 2 t + 1 ζ x m 2 x m 1
D 0 i x m i  denotes the potential market demand for the product, which is related to the product price  x m i  and  D 0 i x m i < 0 .  γ g > 0  denotes the coefficient of the effect of product greenness on the market demand, i.e., the coefficient of the green preference of consumers. Assuming that  0 < ζ 1  is the degree of importance that product greenness occupies in market competition, then  1 ζ  is the degree of importance that price occupies in market competition. For ease of calculation, price is assumed to be a random variable, and further analysis will be carried out later. Therefore, the supplier’s supply price  x s i  to manufacturer i is assumed to be a random variable with a probability density function of  f x s i . Manufacturer i’s price  x m i  to retailer i is a random variable whose probability density function is  f x m i . The price  x r i  at which retailer i sells its product is a random variable whose probability density function is  f x r i . The incremental price of green product innovations tends to be higher than the incremental price of green process innovations due to the higher positioning of green product market demand. Green product innovations are revolutionary and green process innovations are incremental, and the former tend to require larger cost inputs that need to be compensated by higher prices, so it is assumed that  x r 1 > x r 2 ,  x s 1 > x s 2 , and  x m 1 > x m 2 .
The notation of the relevant parameters involved in the model is shown in Table 3.

3. Stochastic Differential Game Modeling

3.1. Model Construction

According to the previous assumptions, the supplier gains 0 P s 1 D m 1 x s 1 f x s 1 d x s 1  from selling the raw materials to Manufacturer 1, and gains 0 P s 2 D m 2 x s 2 f x s 2 d x s 2  from selling them to Manufacturer 2. The supplier’s cost of green product innovation shared by Manufacturer 1 is 1 θ s 1 C s 1 , the supplier’s cost of green process innovation incurred by collaborative innovation with Manufacturer 2 is 1 θ s 2 1 ξ m 2 C s 2 , and ρ  is the discount factor. Therefore, the supplier’s objective generalized function is as follows:
J s = m a x f s ( t ) E 0 T e ρ t 0 P s 1 D m 1 x s 1 f x s 1 d x s 1 + 0 P s 2 D m 2 x s 2 f x s 2 d x s 2 1 θ s 1 C s 1 1 θ s 2 1 ξ m 2 C s 2 d t
Manufacturer 1 sells products to Retailer 1 for revenue 0 P m 1 D m 1 x m 1 f x m 1 d x m 1 , and pays for ordering from supplier 0 P s 1 D m 1 x s 1 f x s 1 d x s 1 . The cost incurred for green product innovation after the government subsidizes Manufacturer 1 is 1 ξ m 1 C m 1 . Manufacturer 1 shares the green product innovation cost θ s 1 C s 1  for the supplier and bears part of the green publicity cost θ r 1 C m r 1  for Retailer 1. Therefore, the objective generalized function of Manufacturer 1 is as follows:
J m 1 = m a x f m 1 E 0 T e ρ t 0 P m 1 D m 1 x m 1 f x m 1 d x m 1 0 P s 1 x s 1 f x s 1 d x s 1 1 ξ m 1 C m 1   θ s 1 C s 1 θ r 1 C m r 1 d t
Manufacturer 2 earns revenue 0 P m 2 D m 2 x m 2 f x m 2 d x m 2  by selling products to Retailer 2 and pays 0 P s 2 D m 2 x s 2 f x s 2 d x s 2  by ordering products from the suppliers. Manufacturer 2 incurs a process innovation cost of θ s 2 1 ξ m 2 C s 2  for collaborative innovation with suppliers and bears a portion of the green propaganda cost of θ r 2 C m r 2  for Retailer 2. Thus, the objective generalization function for Manufacturer 2 is as follows:
J m 2 = m a x f m 2 E 0 T e ρ t 0 P m 2 D m 2 x m 2 f x m 2 d x m 2 0 P s 2 x s 2 f x s 2 d x s 2 θ s 2 1 ξ m 2 C s 2   θ r 2 C m r 2 d t
Retailer 1 sells the product to gain revenue 0 P r 1 D m 1 x r 1 f x r 1 d x r 1 , pays the cost of purchasing the product from Manufacturer 1 0 P m 1 D m 1 x m 1 f x m 1 d x m 1 , and the cost of green propaganda after Manufacturer 1’s share is 1 θ r 1 C m r 1 . Therefore, the objective generalization function of Retailer 1 is as follows:
J r 1 = m a x f r 1 E 0 T e ρ t 0 P r 1 D m 1 x r 1 f x r 1 d x r 1 0 P m 1 x m 1 f x m 1 d x m 1 1 θ r 1 C m r 1 d t
Retailer 2 sells the product to gain revenue 0 P r 2 D m 2 x r 2 f x r 2 d x r 2 , pays the cost of purchasing the product from Manufacturer 2 0 P m 2 D m 2 x m 2 f x m 2 d x m 2 , and the cost of green propaganda after Manufacturer 2’s share is 1 θ r 2 C m r 2 . Therefore, the objective generalization function of Retailer 2 is as follows:
J r 2 = m a x f r 2 E 0 T e ρ t 0 P r 2 D m 2 x r 2 f x r 2 d x r 2 0 P m 2 x m 2 f x m 2 d x m 2 1 θ r 2 C m r 2 d t

3.2. Solutions

The goal of suppliers, manufacturers and retailers is to maximize expected revenues. Unlike process innovation, product innovation decisions between suppliers and manufacturers are sequential. Based on the product plan proposed by the manufacturer, the supplier first makes a green product innovation effort, and then the manufacturer makes a decision on the green product innovation effort based on the actual green raw materials provided by the supplier.
Proposition 1.
The optimal level of green product innovation effort for the supplier is as follows:
f s 1 * = Φ φ s 1 η m 11 1 ξ m 1 1 θ s 1 η s 1 η m 11 1 ξ m 1 2 Ψ Φ φ s 1 φ m 11 2
where
Φ = V s 1 = x 1 = γ g 0 P s 1 x s 1 f x s 1 d x s 1 + χ ζ 0 P s 1 x s 1 f x s 1 d x s 1 0 P s 2 x s 2 f x s 2 d x s 2 ρ + δ , Ψ = V m 11 = y 1 = γ g + χ ζ 0 P m 1 x m 1 f x m 1 d x m 1 0 P s 1 x s 1 f x s 1 d x s 1 ρ + δ .
The optimal level of green process innovation effort for the supplier is as follows:
f s 2 * = Θ φ s 2 1 θ s 2 1 ξ m 2 η s 2 ν 2
where
Θ = V s 2 = x 2 = γ g 0 P s 2 x s 2 f x s 2 d x s 2 + χ ζ 0 P s 2 x s 2 f x s 2 d x s 2 0 P s 1 x s 1 f x s 1 d x s 1 ρ + δ .
The optimal level of green product innovation effort for Manufacturer 1 is as follows:
f m 11 * = Ψ Φ φ m 11 φ s 1 2 1 θ s 1 η s 1 η m 11 1 ξ m 1 2 Ψ Φ φ s 1 φ m 11 2
The optimal level of green promotional effort for Manufacturer 1 is as follows:
f m 12 * = Ψ φ m 12 θ r 1 ν 1 η m 12
The optimal level of green process innovation effort for Manufacturer 2 is as follows:
f m 21 * = Γ φ m 21 θ s 2 1 ξ m 2 η m 21 ν 2
where
Γ = V m 22 = z 2 = γ g + χ ζ 0 P m 2 x m 2 f x m 2 d x m 2 0 P s 2 x s 2 f x s 2 d x s 2 ρ + δ .
The optimal level of green promotional effort for Manufacturer 2 is as follows:
f m 22 * = Γ φ m 22 θ r 2 ν 3 η m 22
The optimal level of green promotional effort for Retailer 1 is as follows:
f r 1 * = Ξ φ r 1 1 θ r 1 ν 1 η r 1
where
Ξ = V r 11 = m 1 = γ g + χ ζ 0 P r 1 x r 1 f x r 1 d x r 1 0 P m 1 x m 1 f x m 1 d x m 1 ρ + δ .
The optimal level of green promotional effort for Retailer 2 is as follows:
f r 2 * = Λ φ r 2 1 θ r 2 η r 2 ν 3
where
Λ = V r 22 = n 2 = γ g + χ ζ 0 P r 2 x r 2 f x r 2 d x r 2 0 P m 2 x m 2 f x m 2 d x m 2 ρ + δ .
Proof. 
See Appendix A. □

3.3. Evolution of Product Greenness

To reflect the effect of optimal green innovation effort level on product greenness, the statistical properties of product greenness are indicated.
Proposition 2.
The expected value of product greenness is as follows:
E g * = N i δ + e δ t g 0 N i δ
where  N 1 = φ s 1 f s 1 1 + φ m 11 f m 11 + φ m 12 f m 12 + φ r 1 f r 1 , N 2 = φ s 2 f s 2 + φ m 21 f m 21 + φ m 22 f m 22 + φ r 2 f r 2 .
The variance is as follows:
D g * = e 2 δ t g 0 N i δ + e δ t N i δ 2 e δ t N i δ g 0 2 N i + σ 2 δ 2 e 2 δ t g 0 2 + N i δ g 0 2 N i + σ 2 δ 2 N i 2 N i + σ 2 2 δ 2 + N i 2 N i + σ 2 2 δ 2
Proof. 
See Appendix B. □
Equation (17) can be rewritten as shown below:
E g * = 1 e δ t N i δ + e δ t g 0
From Equation (19), it can be seen that product greenness is gradually affected by the level of innovation effort over time, which also means that inappropriate behaviour will generate more losses.
Equation (18) can be rewritten as shown below:
D g * = 2 4 e δ t δ 2 N i 2 + 4 g 0 e δ t δ σ 2 e 2 δ t + e δ t + 1 2 δ 2 N i + g 0 σ 2 e 2 δ t + e δ t δ
From Equation (20), let 8 g 0 δ e δ t σ 2 e 2 δ t + e δ t + 1 16 e δ t 8 = N 0 , t 0 = ln 2 δ . (1) t < t 0 , N i  and D g *  have an inverted U-shaped relationship. When N i < N 0 , N i  increases as D s *  increases. At the beginning of the innovation period, corporate innovation is highly sensitive to external factors and there is a lot of trial and error and exploration. As the innovation investment increases and the growth rate accelerates, the level of innovation effort of the enterprise will have a greater impact. When N i > N 0 , N i  decreases as D g *  increases. As innovation activities are carried out and innovations form a scale, enterprises gradually identify green strategies and technologies, and uncertainty decreases. (2) When t > t 0 , N i  and D g *  have a U-shaped relationship. When N i < N 0 , N i  decreases as D g *  increases. Over time, the technology matures and the enterprises’ input effort only needs to be maintained at a lower level to achieve a stable output of innovation. When N i > N 0 , N i  increases as D g *  increases. In the later stages of innovation as the proportion of inputs increases, innovation spillovers are severe and uncertainty increases.

4. Discussions

4.1. Mechanisms of Innovation Cost-Sharing Ratios in Different Innovation Models

4.1.1. Green Product Innovation Decisions

Let p m 1 = 0 P m 1 x m 1 f x m 1 d x m 1 , p s 1 = 0 P s 1 x s 1 f x s 1 d x s 1 , p s 2 = 0 P s 2 x s 2 f x s 2 d x s 2 , Δ p m s 1 = p m 1 p s 1 , Δ p s 12 = p s 1 p s 2 , and χ g = χ ζ , which indicates the intensity of market competition in terms of greenness.
Corollary 1.
A cost-sharing contract between Manufacturer 1 and a supplier requires the following conditions to be met:
(1)
p s 12 > η s 1 η m 11 1 ξ m 1 ρ + δ 2 2 φ s 1 φ m 11 2 Δ p m s 1 , 0 < γ g < η s 1 η m 11 1 ξ m 1 ρ + δ 2 2 φ s 1 φ m 11 2 Δ p m s 1 p s 1 , 0 < χ g < χ g 1 ,
where
χ g 1 = γ g p s 1 + Δ p s 12 + γ g p s 1 + Δ p s 12 γ g 2 4 Δ p s 12 γ g 2 p s 1 η s 1 η m 11 1 ξ m 1 ρ + δ 2 2 φ s 1 φ m 11 2 Δ p m s 1 2 Δ p s 12 .
(2)
p s 12 < η s 1 η m 11 1 ξ m 1 ρ + δ 2 2 φ s 1 φ m 11 2 Δ p m s 1 ,
and
0 < γ g < γ g 1 ,   0 < χ g < 1
or
γ g 1 < γ g < η s 1 η m 11 1 ξ m 1 ρ + δ 2 2 φ s 1 φ m 11 2 Δ p m s 1 p s 1 ,   0 < χ g < χ g 1 ,
where
γ g 1 = p s 1 + Δ p s 12 + p s 1 + Δ p s 12 2 4 p s 1 Δ p s 12 η s 1 η m 11 1 ξ m 1 ρ + δ 2 2 φ s 1 φ m 11 2 Δ p m s 1 2 p s 1 .
Proof. 
The cost-sharing contract between Manufacturer 1 and suppliers needs to fulfil the conditions. Through Equations (9) and (11), the conditions under which suppliers and Manufacturer 1 can engage in green product innovation efforts are as follows:
θ s 1 < 1 2 φ s 1 φ m 11 2 γ g p s 1 + χ g Δ p s 12 γ g + χ g Δ p m s 1 η s 1 η m 11 1 ξ m 1 ρ + δ 2
Since θ s 1 > 0 , the following equation needs to be satisfied:
Δ p s 12 χ g 2 + γ g p s 1 + Δ p s 12 χ g + γ g 2 p s 1 η s 1 η m 11 1 ξ m 1 ρ + δ 2 2 φ s 1 φ m 11 2 Δ p m s 1 < 0
Let
f χ g = Δ p s 12 χ g 2 + γ g p s 1 + Δ p s 12 χ g + γ g 2 p s 1 η s 1 η m 11 1 ξ m 1 ρ + δ 2 2 φ s 1 φ m 11 2 Δ p m s 1
Equation (23) can be viewed as a quadratic equation with x as an unknown and x 0 , 1 . So,
Δ = γ g 2 p s 1 Δ p s 12 2 + 4 Δ p s 12 η s 1 η m 11 1 ξ m 1 ρ + δ 2 2 φ s 1 φ m 11 2 Δ p m s 1 > 0
Therefore, the equation has two solutions. Since Δ p s 12 > 0  and γ g p s 1 + Δ p s 12 > 0 , one of the solutions is less than zero by the root formula. Combined with a quadratic function, the right-hand side of the equation has an endpoint greater than zero to satisfy the inequality condition, as shown below.
χ g 1 = γ g p s 1 + Δ p s 12 + γ g p s 1 + Δ p s 12 γ g 2 4 Δ p s 12 γ g 2 p s 1 η s 1 η m 11 1 ξ m 1 ρ + δ 2 2 φ s 1 φ m 11 2 Δ p m s 1 2 Δ p s 12 > 0
i.e.,
0 < γ g < η s 1 η m 11 1 ξ m 1 ρ + δ 2 2 φ s 1 φ m 11 2 Δ p m s 1 p s 1
Further, we compare the relationship between the magnitudes of χ g 1  and 1 to determine the range of χ g . Assuming χ g 1 < 1 , we obtain the following:
η s 1 η m 11 1 ξ m 1 ρ + δ 2 2 φ s 1 φ m 11 2 Δ p m s 1 < 1 + γ g Δ p s 12 + γ g p s 1
From Equation (26), we know that the value of γ g  will not exceed η s 1 η m 11 1 ξ m 1 ρ + δ 2 2 φ s 1 φ m 11 2 Δ p m s 1 p s 1 , so if γ g = η s 1 η m 11 1 ξ m 1 ρ + δ 2 2 φ s 1 φ m 11 2 Δ p m s 1 p s 1 , that the following expression can be obtained:
η s 1 η m 11 1 ξ m 1 ρ + δ 2 2 φ s 1 φ m 11 2 Δ p m s 1                                                           < η s 1 η m 11 1 ξ m 1 ρ + δ 2 2 φ s 1 φ m 11 2 Δ p m s 1 + η s 1 η m 1 1 ξ m 1 ρ + δ 2 2 φ s 1 φ m 1 z m 1 2 Δ p m s 1 p s 1 p s 1 + Δ p s 12                                                           + Δ p s 12
Thus, when γ g = η s 1 η m 11 1 ξ m 1 ρ + δ 2 2 φ s 1 φ m 11 2 Δ p m s 1 p s 1 , χ g 1 < 1 . However, when γ g = 0 , we are not sure if χ g 1  is greater than 1. If χ g 1 < 1  and   γ g = 0 , then Δ p s 12 > η s 1 η m 11 1 ξ m 1 ρ + δ 2 2 φ s 1 φ m 11 2 Δ p m s 1 , and 0 < χ g < χ g 1 . However, if χ g 1 1 ; Δ p s 12 < η s 1 η m 11 1 ξ m 1 ρ + δ 2 2 φ s 1 φ m 11 2 Δ p m s 1 , so that χ g 1 > 1 , we can obtain the following:"
p s 1 γ g 2 + p s 1 + Δ p s 12 γ g + Δ p s 12 η s 1 η m 11 1 ξ m 1 ρ + δ 2 2 φ s 1 φ m 11 2 Δ p m s 1 < 0
Let
f γ g = p s 1 γ g 2 + p s 1 + Δ p s 12 γ g + Δ p s 12 η s 1 η m 11 1 ξ m 1 ρ + δ 2 2 φ s 1 φ m 11 2 Δ p m s 1 < 0
According to the rooting formula, Δ = p s 1 Δ p s 12 2 + 4 p s 1 η s 1 η m 11 1 ξ m 1 ρ + δ 2 2 φ s 1 φ m 11 2 Δ p m s 1 , and therefore Equation (30) has two solutions, and one of them is less than zero, and the other solution is
γ g 1 = p s 1 + Δ p s 12 + p s 1 + Δ p s 12 2 4 p s 1 Δ p s 12 η s 1 η m 11 1 ξ m 1 ρ + δ 2 2 φ s 1 φ m 11 2 Δ p m s 1 2 p s 12
Since η s 1 η m 11 1 ξ m 1 ρ + δ 2 2 φ s 1 φ m 11 2 Δ p m s 1 > Δ p s 12 , γ g 1 > 0 . Thus, when 0 < γ g < γ g 1 , 0 < χ g < 1 , i.e., χ g  does not affect whether or not one should establish a cost-sharing contract. In this scenario, consumers have low green preferences, which means that there is a lack of market incentives for green product innovation in the supply chain, leading to low overall efficiency of green product innovation in the supply chain. As a result, the formation of cost-sharing compacts is mainly influenced by price factors rather than the intensity of competition in the green market. In this case, the government should increase subsidies to improve innovation efficiency and guide the market to play a dominant role in the decision-making of innovation agents. □
Corollary 2.
The relationship between  θ s 1  and  χ g  is when both  f s 1  and  f m 11  are maximal, as shown below:
θ s 1 1 2 φ s 1 φ m 11 2 γ g p s 1 + χ g Δ p s 12 γ g + χ g Δ p m s 1 η s 1 η m 11 1 ξ m 1 ρ + δ 2
Proof. 
From Equation (9) and Equation (11), we obtain f s 1 θ 1 > 0  and f m 11 θ 1 > 0 . The two conditions of maximum f s 1  and maximum f m 11  do not contradict each other so the greenness of the product is the highest when both conditions are at their maximum.
Equation (9) and Equation (11) can be rewritten as
f s 1 * = φ s 1 η m 11 1 ξ m 1 1 θ s 1 η s 1 η m 11 1 ξ m 1 Φ 2 Ψ φ s 1 φ m 11 2
and
f m 11 * = φ m 11 φ s 1 2 1 θ s 1 η s 1 η m 11 1 ξ m 1 Φ Ψ 2 φ s 1 φ m 11 2
When both f s 1  and f m 11  are maximal, the relationship between θ s 1  and χ g  is as follows:
θ s 1 1 2 φ s 1 φ m 11 2 γ g p s 1 + χ g Δ p s 12 γ g + χ g Δ p m s 1 η s 1 η m 11 1 ξ m 1 ρ + δ 2
Equations (32)–(34) show that χ g  acts on θ 1  and f s 1 *  (or f m 1 * ) in opposite ways. When χ g  increases, Manufacturer 1 increases its investment in innovation to improve the greenness of its products and to gain market share. As a result, Manufacturer 1 decreases θ s 1  and the supplier’s incentives shift from cost reduction to demand increase. When χ g  decreases, increasing θ s 1  or government subsidies can achieve the optimal decision. This not only helps to incentivize the level of green product innovation efforts of suppliers and manufacturers but also helps to maintain equilibrium in a competitive environment. When χ g  increases, it relies more on the spontaneous regulation of the market to maximize the decision variable (i.e., price). Although the contract can be maintained by reducing government subsidies or θ s 1 , it produces an unstable impact, which may reduce the level of green product innovation efforts of suppliers and manufacturers 1. □

4.1.2. Green Process Innovation Decisions

If p m 2 = 0 P m 2 x m 2 f x m 2 d x m 2 , Δ p m s 2 = p m 2 p s 2 , Δ p s 21 = p s 2 p s 1 , then Δ p s 21 < 0 .
Corollary 3.
(1)  g 2  increases with  θ s 2  when the following conditions are satisfied:
1 2 < θ s 2 < 1 ,   χ g > γ g p s 2 η m 21 φ s 2 2 Δ p m s 2 φ m 21 2 η s 2 Δ p m s 2 φ s 2 2 η m 21 Δ p s 21 η s 2 φ m 21 2 ,   p m 2 p s 2 < 1 + φ s 2 2 η m 21 φ m 21 2 η s 2
(2)  g 2  decreases with decreasing  θ s 2  when the following conditions are satisfied:
0 < θ s 2 < 1 2 ,   χ g > γ g p s 2 η m 21 φ s 2 2 Δ p m s 2 φ m 21 2 η s 2 Δ p m s 2 φ s 2 2 η m 21 Δ p s 21 η s 2 φ m 21 2 ,
and
p m 2 p s 2 > 1 + φ s 2 2 η m 21 φ m 21 2 η s 2 ,
or
p m 2 p s 2 < 1 + φ s 2 2 η m 21 φ m 21 2 η s 2 ,   γ g > Δ p m s 2 φ s 2 2 η m 21 Δ p s 21 η s 2 φ m 21 2 p s 2 η m 21 φ s 2 2 Δ p m s 2 φ m 21 2 η s 2 .
Proof. 
From Equations (10) and (13), it can be observed that θ s 2  (or χ g ) acts on f m 21  and f s 2  in opposite directions. Therefore, while increasing f s 2  by increasing θ s 2  (or χ g ), it leads to a decrease in f m 2 . Pricing of green product innovations is higher, and as green competition in the market increases, rational suppliers will tend to invest in green product innovations and reduce their investment in process innovations. Manufacturer 2 will increase its process innovation efforts to capture market share and enhance collaboration with suppliers. The goal of increasing the level of green process innovation efforts is to maximize product greenness, i.e., to maximize Equation (35).
φ s 2 f s 2 * + φ m 2 f m 21 * = γ g p s 2 + χ g Δ p s 21 φ s 2 2 η m 21 η s 2 γ g + χ g Δ p m s 2 φ m 21 2 θ 2 + η s 2 γ g + χ g Δ p m s 2 φ m 21 2 θ s 2 1 θ s 2 1 ξ m 2 η s 2 η m 21 ν 2 ρ + δ
(1) Through Equation (35), it can be seen that when γ g p s 2 + χ g Δ p s 21 φ s 2 2 η m 21 + η s 2 γ g + χ g Δ p m s 2 φ m 21 2 > 0  and 1 2 < θ s 2 < 1 , θ s 2  increases with the increase in g 2 . Δ p m s 2 φ s 2 2 η m 21 Δ p s 21 η s 2 φ m 21 2 > 0 , so the following expression can be obtained:
χ g < γ g p s 2 η m 21 φ s 2 2 Δ p m s 2 φ m 21 2 η s 2 Δ p m s 2 φ s 2 2 η m 21 Δ p s 21 η s 2 φ m 21 2
Since χ g > 0 , 0 P s 2 x s 2 f x s 2 d x s 2 φ s 2 2 η m 21 η s 2 Δ p m s 2 φ m 21 2 > 0 , and thus the following can be obtained:
p m 2 p s 2 < 1 + φ s 2 2 η m 21 φ m 21 2 η s 2
In this case, the intensity of competition in the green market is lower, Manufacturer 2 has a price advantage, and the overall efficiency of supplier process innovation is higher. On the one hand, it is easier for Manufacturer 2 to maintain market share and profitability, so it will be more inclined to bear more innovation costs to attract consumers and build brand loyalty. On the other hand, to incentivize suppliers to better participate in innovation and increase their investment, Manufacturer 2 will also choose to bear more process innovation costs.
(2) Through Equation (35), it can be seen that when γ g p s 2 + χ g Δ p s 21 φ s 2 2 η m 21 + η s 2 γ g + χ g Δ p m s 2 φ m 21 2 < 0  and 0 < θ s 2 < 1 2 , θ s 2  decreases with the increase of g 2 . Δ p m s 2 φ s 2 2 η m 21 Δ p s 21 η s 2 φ m 21 2 > 0 , so there is:
χ g > γ g p s 2 η m 21 φ s 2 2 Δ p m s 2 φ m 21 2 η s 2 Δ p m s 2 φ s 2 2 η m 21 Δ p s 21 η s 2 φ m 21 2
Since χ g < 1 ,
γ g p s 2 η m 21 φ s 2 2 Δ p m s 2 φ m 21 2 η s 2 < Δ p m s 2 φ s 2 2 η m 21 Δ p s 21 η s 2 φ m 21 2
① If p s 2 η m 21 φ s 2 2 Δ p m s 2 φ m 21 2 η s 2 > 0 , then
γ g < Δ p m s 2 φ s 2 2 η m 21 Δ p s 21 η s 2 φ m 21 2 p s 2 η m 21 φ s 2 2 Δ p m s 2 φ m 21 2 η s 2
i . e . ,   p m 2 p s 2 < 1 + φ s 2 2 η m 21 φ m 21 2 η s 2
In this case, the market has lower green preferences and the intensity of competition is reflected more in prices. Manufacturer 2 has lower profit margins, market demand gives incentive signals to suppliers, and suppliers sharing more of the cost of innovation can enable manufacturers 2 to maintain their price advantage.
② If p s 2 η m 21 φ s 2 2 Δ p m s 2 φ m 21 2 η s 2 < 0 , Equation (39) holds. Therefore,
p m 2 p s 2 > 1 + φ s 2 2 η m 21 φ m 21 2 η s 2
In this case, the market has a higher intensity of green competition and suppliers are less efficient in innovating and therefore deserve to share more of the costs of innovation. □

4.2. Cost-Sharing and Optimal Decision-Making

Let p r 1 = 0 P r 1 x r 1 f x r 1 d x r 1 , p r 2 = 0 P r 2 x r 2 f x r 2 d x r 2 , Δ P r m 1 = p r 1 p m 1 , Δ P r m 2 = p r 2 p m 2 .
Corollary 4.
When retailers’ green performance is higher than manufacturers’ green performance, manufacturers should bear more of the greening costs. When the retailer’s green communication performance is lower than the manufacturer’s green communication performance, the retailer should bear more green communication costs.
Proof. 
From Equations (12) and (14), it can be seen that green propaganda increases the greenness of products, whether it is green product technology innovation or green process technology innovation. The analysis process is similar for both, i.e., maximizing Equation (43) as shown below:
φ m i 2 f m i 2 * + φ r i f r i * = γ g + χ g ν j ρ + δ Δ p m s i φ m i 2 θ r i η m i 2 + Δ P r m i φ r i 1 θ r i η r i = γ g + χ g Δ p m s i φ m i 2 η r i + Δ P r m i φ r i η m i 2 Δ p m s i φ m i 2 η r i θ r i θ r i 1 θ r i η m i 2 η r i ν j ρ + δ
i = 1 ,   2 . When i = 1 , j = 1  and when i = 2 , j = 3 .
Through Equation (43), it can be seen that when Δ P r m i φ r i η m i 2 Δ p m s i φ m i 2 η r i > 0  and 1 2 < θ r i < 1 , θ r i  increases as g i  increases. At this time, Δ P r m i φ r i η r i > Δ p m s i φ m i 2 η m i 2 , i.e., the retailer’s green publicity performance is higher than the manufacturer’s green publicity performance, and at this time, the manufacturer should bear more green publicity costs. When Δ P r m i φ r i η m i 2 Δ p m s i φ m i 2 η r i < 0  and 0 < θ r i < 1 2 , θ r i  decreases as g i  increases. At this time, Δ P r m i φ r i η r i < Δ p m s i φ m i 2 η m i 2 , i.e., the retailer’s green publicity performance is lower than that of the manufacturer, and at this time, the retailer should bear more green publicity costs. □

4.3. Effects of Market Competition on Price Volatility

Price is a random variable, and mean and variance are two important numerical features, but product greenness and market competition will affect the price from different angles. Therefore, the following will take the price of product 1 as an example and analyze it from the perspective of influencing the change in price mean and variance.
The stochastic process for price p t  can be expressed as follows:
d p t = p t g p t ϕ d t + σ p t d W t
where ϕ  is the market price acceptable to consumers and g  is the government’s adjustment factor, g 0 ,   1 .
The evolution of the system is portrayed as follows:
d p t = B A p t d t + σ p t d W ( t )
where A = 1 g , B = g ϕ , and time units t  are omitted below.
Similar to the proof process of Proposition 2, the mean value of the price can be obtained as follows:
E p = B A + e A t p 0 B A
The variance is
D p = e 2 A t p 0 B A + e A t B A 2 e A t B A p 0 2 B + σ 2 A 2 e 2 A t p 0 2 + B A p 0 2 B + σ 2 A 2 B 2 B + σ 2 2 A 2 + B 2 B + σ 2 2 A 2
Equation (46) can be written as E p = g ϕ 1 g 1 e 1 g t + p 0 e 1 g t . Since e 1 g t < 1 , the mean value of the price increases with ϕ . From Equation (21), after long run evolution, l i m t D p = g ϕ 2 g ϕ + σ 2 2 1 g 2 , σ 2 4 g < 0 , and thus D p  increases as ϕ  increases. Reducing the price acceptability of consumers can effectively control the range of price fluctuations because at this point, the market is maturing, the speculative demand accompanying the demand for use is increasing, and the market is highly active. If the price acceptable to consumers is reduced, the variance decreases. Therefore, in addition to the government regulation factor, the consumer’s price acceptance ϕ  plays a key role in the price, and ϕ  can be expressed by the following equation:
ϕ = ϕ 0 + λ g g 1 λ p p 1 p 2
The price that consumers are willing to pay for the product depends on the uniqueness of the product and the price of the competitors, and here the uniqueness of the product is represented by the greenness of the product. ϕ 0  is the initial willingness to pay, λ g  is the coefficient of influence of the greenness of the product on the willingness to pay of the consumers, and λ p  is the coefficient of influence of the price of the competitors on the willingness to pay of the consumers.
As the greenness of the product increases, g 1  increases and p 1  increases, which are defined as Δ g 1  and Δ p 1 , respectively, and the value of the change in ϕ  caused by their changes is Δ ϕ . To stabilize the price increase, it is desirable to achieve Δ ϕ < 0 , i.e., λ g λ p Δ p 1 Δ g 1 . Δ p 1 Δ g 1  denotes the rate of change in price after one unit increase in greenness, and λ g λ p  denotes the sensitivity of consumer preference. The larger λ g λ p  is, the more consumers tend to choose the green product, and the smaller λ g λ p  is, the more consumers tend to be affected by the price. As consumer sensitivity to the greenness of a product increases, the rate of change in price increases. In other words, the marginal increment in price is supposed to be greater than the marginal increment in greenness under the consideration of consumer preferences. On the one hand, the marginal cost of innovation experiences decreases in the first period and will increase in the later period. Therefore, a higher marginal increment in price is needed to compensate for the increase in cost, ensure profitability and maintain price stability. On the other hand, if new technological innovations lead to a surge in costs, this will reduce market share if prices also surge. Therefore, before this happens, companies should utilize the brand premium that green products bring to the company to gain higher pricing space. This not only allows companies to better carry out marketing activities and enhance product market awareness but also in the event of a sudden increase in costs, it can be used as a buffer for the price increase so that companies in the highly competitive market achieve stable price growth. Similarly, to increase the average value of price, λ g λ p Δ p 1 Δ g 1 , that is, consumers prefer to buy more cost-effective products. Therefore, when λ g λ p = Δ p 1 Δ g 1 , it is a relatively stable business strategy for the enterprise.
Therefore, the mean o of the price random variable is made to increase to represent the incentive effect of product greenness and market competition on product prices. A decrease in the variance τ 2  is used to represent its contribution to stabilizing prices. The price can further be noted as follows:
x 0 = m x + n m o
where 0 m 1  and n 1 . n 1  and 1 m  are defined as incentive coefficients for both incentivizing product marketization and stabilizing market prices, respectively. It can be observed that the mean of x 0  is n o , the variance is m 2 τ 2 , and x 0 0 , P 0 .

5. A Numerical Example

5.1. Trajectory of Product Greenness

We can assume that x m i  is a random variable for the interval 0 , P m i , x s i  is a random variable for the interval 0 , P s i , and x r i  is a random variable for the interval 0 , P r i . Let γ g = 0.1 , χ = 0.25 , ζ = 0.8 , ρ = 0.6 , δ = 0.6 , ξ m 1 = 0.1 , ξ m 2 = 0.05 , p m 1 = 350 , p m 2 = 200 , p s 1 = 180 , p s 2 = 100 , p r 1 = 450 , p r 2 = 300 , η m 11 = 4 , η m 12 = 2.5 , η m 21 = 3 , η m 22 = 2 , η s 1 = 3 , η s 2 = 2 , η r 1 = 2.5 , η r 2 = 2 , φ m 11 = 0.1 , φ m 12 = 0.5 , φ m 21 = 0.3 , φ m 22 = 0.8 , φ s 1 = 0.4 , φ s 2 = 0.6 , φ r 1 = 0.5 ; φ r 2 = 0.6 . The optimal product greenness trajectories for products produced by Manufacturer 1 and Manufacturer 2 are shown in Figure 2 and Figure 3, respectively, and the optimal product greenness trajectories for products advertised by Manufacturer 1 and Manufacturer 2 are shown in Figure 4 and Figure 5, respectively.
As can be seen in Figure 2, Manufacturer 1 bears more of the cost of product innovation, and its share increases with increasing greenness. In the process of green product innovation, when the share of Manufacturer 1 increases, suppliers can invest more money and resources to improve the production process and reduce environmental pollution and resource waste. At the same time, with the green raw materials provided by suppliers as the basis of innovation, Manufacturer 1 will develop products with a higher degree of greenness, thus greatly increasing the degree of greenness of products. In addition, Manufacturer 1 can gain a better reputation and attract more environmentally conscious consumers to choose to buy its products, creating further incentives. As can be seen from Figure 3, suppliers bear more process innovation costs, and their share is positively correlated with greenness. Supplier innovation efficiency is lower than that of manufacturers, and suppliers can better improve the overall innovation efficiency of the supply chain by bearing greater costs. At the same time, suppliers invest more money and resources in green process innovation, take stronger measures to reduce the environmental impacts of products during their life cycle and invest more in the use of advanced technologies and materials, so that products have a higher degree of greenness.
As can be seen from Figure 4, Manufacturer 1 bears more of the product promotion costs, and its share increases with increasing greenness. In green product innovation, when Manufacturer 1 shares more green publicity costs, the promotion burden of retailers is reduced; thus, they are more motivated to promote green products. Not only does it increase market awareness, but it also effectively enhances consumer guidance. The market competitiveness and synergistic effect of both parties are enhanced, thus promoting the greenness of products. As can be seen from Figure 5, retailers bear more product promotion costs, and their share increases with the increase in greenness. In green process innovation, when the retailer’s share increases, Manufacturer 2 spends more money on actual green R&D and production improvement. By improving the green attributes of the process chain to show its green value, the greenness of the product is increased. At the same time, in green process innovation, as consumers cannot easily visualize the green attributes brought about by green process innovation changes, the market recognition of green process innovation usually needs to be cultivated over some time, and the market response time tends to be delayed, so the publicity effect of green process innovation is gradually significant at a later stage.

5.2. Product Prices and Innovation Efforts

Considering the relationship between the price of the product and the level of innovation effort of the game subjects, the level of innovation effort of the manufacturer is simulated, as shown in Figure 6 and Figure 7.
As can be seen from Figure 6 and Figure 7, in the later stages of innovation evolution, f  increases with n 1  for a certain m . And for certain n , f  decreases with decreasing 1 m . When both m and n are large, f m i  is the largest. The high selling price motivates the level of innovation effort of the manufacturer, but the price is not stable at this point and it is difficult to maintain this high level in the long run. The levels of green product innovation effort and green process innovation effort plotted based on the initial conditions are f m 10  and f m 20 , respectively. It can be seen from Figure 6 that an increase in the intensity of market competition or the proportion of costs shared by Manufacturers 1 increases the overall level of green product innovation effort. Through Figure 7, it can be seen that an increase in the intensity of market competition or a decrease in the proportion of costs shared by Manufacturer 2 increases the level of the green process innovation effort of Manufacturer 2.

6. Discussion

(1)
In green product innovation, suppliers should collaborate with manufacturers to develop cost-effective solutions when consumer preference for green products is low, aiming to reduce costs and attract more customers. In a competitive market, suppliers should optimize production and supply chain processes to minimize costs and reduce their share of cost-sharing contracts, while enhancing product greenness. Manufacturers should increase investment in green product innovation to gain a larger market share.
(2)
In green process innovation, suppliers and manufacturers should establish a fair cost-sharing mechanism to ensure mutual incentives for process innovation. Manufacturers should attract consumers and build brand loyalty by improving product greenness when bearing greater innovation costs. Suppliers should maintain manufacturers’ price advantage by improving supply chain efficiency when they bear more costs. In less competitive markets, manufacturers should adopt aggressive strategies to improve greenness, while suppliers play a crucial role in supporting manufacturers’ market share in highly competitive environments.
(3)
When a retailer’s green campaign is more effective than the manufacturer’s, the manufacturer should bear greater campaign costs, as the retailer’s success increases market acceptance and benefits the manufacturer. Conversely, if the manufacturer’s campaign is more effective, the retailer should increase investment to capitalize on the established green image and consumer trust.
(4)
Enterprises should adopt flexible pricing strategies to adapt to market changes and consumer preferences. Setting the marginal price increase higher than the marginal greenness increase helps stabilize price differences and compensate for technological innovation costs. Leveraging the brand premium of green products provides more pricing space, enhances market recognition, achieves price stability, and maintains market competitiveness through effective cost management and market positioning.

7. Conclusions and Limitations

7.1. Conclusions

Green technology innovation has a positive effect on enterprises to realize the established emission reduction targets. This paper examines the core issue of green technology co-innovation in supply chains and draws the following conclusions:
(1)
In green product innovation, the formation of cost-sharing contracts hinges on factors such as market competition, consumer green preferences, and supply chain innovation efficiency. When consumer green preferences are low, market incentives diminish, reducing the overall effectiveness of supply chain innovation. In this scenario, price becomes crucial, significantly influencing cost-sharing contracts, while market competition has a limited impact. As market competition intensifies, manufacturers invest more in enhancing product greenness to gain market share, leading them to reduce cost-sharing with suppliers. This shifts supplier incentives from cost reduction to demand expansion. With weak market competition, external interventions, such as increased government subsidies or higher manufacturer cost-sharing ratios, can effectively promote optimal decision-making and green innovation efforts. Conversely, in highly competitive markets, the market mechanism alone can maintain decision equilibrium, allowing for reduced government subsidies and lower manufacturer cost-sharing ratios. Therefore, manufacturers and suppliers should adapt cost-sharing strategies to the intensity of market competition and consumer green preferences, using subsidies and increased manufacturer cost-sharing in low-competition markets to promote green innovation.
(2)
In green process innovation, the cost is shared between suppliers and manufacturers. Enhancing product greenness cannot rely on unilateral actions but requires considering the interaction of overall innovation efficiency, market competition intensity, and cost-sharing ratios. When manufacturers bear more process innovation costs, their higher cost-sharing leads to greener products. Lower competition in greenness gives manufacturers a price advantage and boosts overall supplier innovation efficiency. Manufacturers are likely to maintain market share and profitability, motivating them to invest more in innovation to attract consumers and build brand loyalty. Additionally, manufacturers may cover more innovation costs to encourage supplier participation. When suppliers bear more process innovation costs, their higher cost-sharing also results in greener products. In markets with low preference for green products and price-based competition, manufacturers show higher innovation efficiency but lower profits. Market demand encourages suppliers to bear more costs, aiding manufacturers in maintaining a price advantage. In the case of more intense green competition and less efficient supplier innovation, a larger share of process innovation costs by suppliers can support manufacturers in gaining more market share. Therefore, manufacturers and suppliers should balance cost-sharing based on market conditions and innovation efficiency to collaboratively enhance product greenness and maintain competitive advantage.
(3)
In both green product and process innovation, the goal of green publicity is to enhance product greenness. The share of green publicity costs should correspond to the effectiveness of the publicity. If the retailer’s green publicity performance exceeds the manufacturer’s, the manufacturer should bear more of the costs. Conversely, if the retailer’s performance is lower, the retailer should bear a larger share of the costs. Therefore, manufacturers and suppliers should allocate green publicity costs based on the relative effectiveness of the retailer’s and manufacturer’s performance to maximize the impact of green marketing efforts.
(4)
Over time, the marginal increase in price relative to the increase in greenness helps maintain price differential stability, considering consumer preferences. Initially, as the marginal cost of innovation decreases, a higher price is necessary later to compensate for rising costs, ensuring profitability and price stability. However, if new technological innovations lead to significant cost and price increases, market share may decline. Therefore, businesses should leverage the brand premium of green products for higher pricing flexibility, enhancing marketing efforts, and cushioning against sudden cost increases. This strategy ensures stable price growth amid competition. Conversely, if the marginal price increase is smaller than the marginal greenness increase, meaning consumers prefer cost-effective products, it helps raise the average price. Therefore, manufacturers and suppliers should utilize the brand premium of green products to maintain price stability and profitability, leveraging higher pricing flexibility and enhanced marketing to protect against cost increases and sustain their competitive edge.

7.2. Limitations and Future Direction

This paper explores the mechanisms by which different types of green technology innovations increase the greenness of supply chains. However, other aspects need to be considered in the future. First, we only considered cost-sharing contracts in the supply chain, and future research could include benefit-sharing mechanisms in the same research system. Second, we analyzed price as a random variable, and future research can take price as a decision variable and systematically analyze the factors that affect its decision. Finally, we considered the competitive advantage between green process innovation and green product innovation, and in the future, we could compare more competitive scenarios.

Author Contributions

Conceptualization, Y.Z. and R.S.; methodology, Y.Z.; software, R.S.; validation, Y.Z. and R.S.; formal analysis, Y.Z.; investigation, Y.Z.; data curation, R.S.; writing—original draft preparation, Y.Z.; writing—review and editing, D.H.; visualization, R.S.; supervision, D.H.; funding acquisition, D.H. All authors have read and agreed to the published version of the manuscript.

Funding

This research was funded by the National Natural Science Foundation of China under grant number 42277484.

Data Availability Statement

The raw data supporting the conclusions of this article will be made available by the authors on request.

Conflicts of Interest

The authors declare no conflicts of interest.

Appendix A

Construct continuously differentiable functions that satisfy the following HJB equations, respectively:
ρ V s = 0 P s 1 D m 1 x s 1 f x s 1 d x s 1 + 0 P s 2 D m 2 x s 2 f x s 2 d x s 2 1 θ s 1 1 2 η s 1 f s 1 2 1 θ s 2 1 ξ m 2 1 2 ν 2 η m 21 f m 21 2 + η s 2 f s 2 2 + V s 1 φ s 1 f s 1 1 + φ m 11 f m 11 + φ m 12 f m 12 + φ r 1 f r 1 δ g 1 + V s 2 φ s 2 f s 2 + φ m 21 f m 21 + φ m 22 f m 22 + φ r 2 f r 2 + σ 2 2 g 1 V s 1 + σ 2 2 g 2 V s 2
ρ V m 1 = 0 P m 1 D m 1 x m 1 f x m 1 d x m 1 0 P s 1 D m 1 x s 1 f x s 1 d x s 1 1 ξ m 1 1 2 η m 11 f m 11 2 θ s 1 1 2 η s 1 f s 1 2 θ r 1 1 2 ν 1 η m 12 f m 12 2 + η r 1 f r 1 2 + V m 11 φ s 1 f s 1 1 + φ m 11 f m 11 + φ m 12 f m 12 + φ r 1 f r 1 δ g 1 + V m 12 φ s 2 f s 2 + φ m 21 f m 21 + φ m 22 f m 22 + φ r 2 f r 2 δ g 2 + σ 2 2 g 1 V m 11 + σ 2 2 g 2 V m 12
ρ V m 2 = 0 P m 2 D m 2 x m 2 f x m 2 d x m 2 0 P s 2 D m 2 x s 2 f x s 2 d x s 2 θ s 2 1 ξ m 2 1 2 ν 2 η m 21 f m 21 2 + η s 2 f s 2 2 θ r 2 1 2 ν 3 η m 22 f m 22 2 + η r 2 f r 2 2 + V m 21 φ s 1 f s 1 1 + φ m 11 f m 11 + φ m 12 f m 12 + φ r 1 f r 1 δ g 1 + V m 22 φ s 2 f s 2 + φ m 21 f m 21 + φ m 22 f m 22 + φ r 2 f r 2 δ g 2 + σ 2 2 g 1 V m 21 + σ 2 2 g 2 V m 22
ρ V r 1 = 0 P r 1 D m 1 x r 1 f x r 1 d x r 1 0 P m 1 D m 1 x m 1 f x m 1 d x m 1 1 θ r 1 1 2 ν 1 η m 12 f m 12 2 + η r 1 f r 1 2 + V r 11 φ s 1 f s 1 1 + φ m 11 f m 11 + φ m 12 f m 12 + φ r 1 f r 1 δ g 1 + V r 12 φ s 2 f s 2 + φ m 21 f m 21 + φ m 22 f m 22 + φ r 2 f r 2 δ g 2 + σ 2 2 g 1 V r 11 + σ 2 2 g 2 V r 12
ρ V r 2 = 0 P r 2 D m 2 x r 2 f x r 2 d x r 2 0 P m 2 D m 2 x m 2 f x m 2 d x m 2 1 θ r 2 1 2 ν 3 η m 22 f m 22 2 + η r 2 f r 2 2 + V r 21 φ s 1 f s 1 1 + φ m 11 f m 11 + φ m 12 f m 12 + φ r 1 f r 1 δ g 1 + V r 22 φ s 2 f s 2 + φ m 21 f m 21 + φ m 22 f m 22 + φ r 2 f r 2 δ g 2 + σ 2 2 g 1 V r 21 + σ 2 2 g 2 V r 22
where V m i = d V m i d g i ; V m i = d 2 V m i d g i 2 . V m i  is the expected present value of payment function of manufacturer i. V r i = d V r i d g i ; V r i = d 2 V r i d g i 2 . V r i  is the expected present value of payment function of expected present value of payment function of retailer i. V s = d V s d g i ; V s i = d 2 V s d g i 2 . Vs is the expected present value of payment function of supplier.
Equation (A2) is a concave function on f s 1  with first-order conditions for the decision variable f m 1 , as shown below:
f m 11 * = V m 11 φ s 1 f s 1 φ m 11 1 ξ m 1 η m 11
Equation (A6) is brought into Equation (A1) to find the first-order condition for the decision variable as follows:
f s 1 * = V s 1 φ s 1 η m 11 1 ξ m 1 1 θ s 1 η s 1 η m 11 1 ξ m 1 2 V m 11 V s 1 φ s 1 φ m 11 2
Substitution of Equation (A7) into Equation (A6) produces the following equation:
f m 11 * = V s 1 V m 11 φ m 11 φ s 1 2 1 θ s 1 η s 1 η m 11 1 ξ m 1 2 V m 11 V s 1 φ s 1 φ m 11 2
The first-order conditions for the decision variables f r 1  and f m 12  are shown below:
f r 1 * = V r 11 φ r 1 1 θ r 1 ν 1 η r 1
f m 12 * = V m 11 φ m 12 θ r 1 ν 1 η m 12
The first-order conditions for the decision variables f s 2 , f m 21 , f m 22 , and f r 2  are shown below:
f s 2 * = V s 2 φ s 2 1 θ s 2 1 ξ m 2 η s 2 ν 2
f m 21 * = V m 22 φ m 21 θ s 2 1 ξ m 2 η m 21 ν 2
f m 22 * = V m 22 φ m 22 θ r 2 ν 3 η m 22
f r 2 * = V r 22 φ r 2 1 θ r 2 η r 2 ν 3
Based on the structure of Equations (7)–(14), the following equations can be obtained:
V s g 1 , g 2 = x 1 g 1 + x 2 g 2 + x 3 V m 1 g 1 , g 2 = y 1 g 1 + y 2 g 2 + y 3 V m 2 g 1 , g 2 = z 1 g 1 + z 2 g 2 + z 3 V r 1 g 1 , g 2 = m 1 g 1 + m 2 g 2 + m 3 V r 2 g 1 , g 2 = n 1 g 1 + n 2 g 2 + n 3
where x 1 , x 2 , x 3 , y 1 , y 2 , y 3 , z 1 , z 2 , z 3 , m 1 , m 2 , m 3 , n 1 , n 2 , n 3  are the constants to be solved, which can be solved by the method of determining the coefficients to be determined, and will be substituted into Equations (A1)–(A5), resulting in Equations (A15)–(A20) below:
V s 1 = x 1 = γ g + χ ζ 0 P s 1 x s 1 f x s 1 d x s 1 χ ζ 0 P s 2 x s 2 f x s 2 d x s 2 ρ + δ
V s 2 = x 2 = γ g + χ ζ 0 P s 2 x s 2 f x s 2 d x s 2 χ ζ 0 P s 1 x s 1 f x s 1 d x s 1 ρ + δ
V m 11 = y 1 = γ g + χ ζ 0 P m 1 x m 1 f x m 1 d x m 1 0 P s 1 x s 1 f x s 1 d x s 1 ρ + δ
V m 22 = z 2 = γ g + χ ζ 0 P m 2 x m 2 f x m 2 d x m 2 0 P s 2 x s 2 f x s 2 d x s 2 ρ + δ
V r 11 = m 1 = γ g + χ ζ 0 P r 1 x r 1 f x r 1 d x r 1 0 P m 1 x m 1 f x m 1 d x m 1 ρ + δ
V r 22 = n 2 = γ g + χ ζ 0 P r 2 x r 2 f x r 2 d x r 2 0 P m 2 x m 2 f x m 2 d x m 2 ρ + δ

Appendix B

The evolution of product greenness is further portrayed below:
d s t = N δ s t d t + σ s t d W t
Equation (A21) can be rewritten in the form of a stochastic integral equation as shown below:
s t = s 0 + 0 t N δ s u d u + 0 t σ s u d W u
As the expectation of the Wiener process is zero, the expectation can be obtained as shown below:
E s t = s 0 + 0 t N δ E s u d u
Derivation on both sides of Equation (A23) yields the following:
E s t = N δ E s t
Let, y = N δ y , i.e.,  y + δ y = N , be transformed into an ordinary differential equation, as shown below:
y = e δ t N δ e δ t + c
From the initial condition E s 0 = s 0 , the following can be obtained:
c = s 0 N δ
i . e . ,   E s t = N δ + e δ t s 0 N δ
To solve the variance problem, we can define the stochastic process as Z t = f t , s t = s 2 t . As noted by Ito, the following equation stands:
d f t , s t = f t , s t t + N δ s t f t , s t s + 1 2 σ s t 2 2 f t , s t s 2 t d t + σ s t f t , s t s d W t
Therefore, the process of change of s 2 t  is
d s 2 t = 2 δ s 2 u + 2 N + σ 2 s u d t + 2 σ s t s t d W t
Equation (A29) is integrated on both sides and rewritten in stochastic integral form as shown below:
s 2 t = s 0 2 + 0 t 2 δ s 2 u + 2 N + σ 2 s u d u + 2 0 t σ s u s u d W u
From E W t = 0 , using both sides of Equation (A30) results in the following equation:
E s 2 t = s 0 2 + 0 t 2 δ E s 2 u + 2 N + σ 2 E s u d u
Substituting Equation (A27) into Equation (A31) yields the following equation:
E s 2 t = s 0 2 + 0 t 2 δ E s 2 u + 2 N + σ 2 N δ + e δ t s 0 N δ d u
Derivation of Equation (A32) yields the following differential equation:
d E s 2 t d t = 2 δ E s 2 t + 2 N + σ 2 N δ + e δ t s 0 N δ E s 2 0 = s 0 2
This can be solved using the following equation:
E s 2 t = N 2 N + σ 2 2 δ 2 e M t 2 N + σ 2 N δ s 0 δ 2 + e 2 δ t s 0 2 N 2 N + σ 2 + 2 2 N + σ 2 δ s 0 N 2 δ 2
Using D s t = E s 2 t E 2 s t , the variance can be obtained as Equation (18).

References

  1. Liu, L.; Han, T.; Jin, H. Differential game study of green supply chain based on green technology innovation and manufacturer competition. Chin. J. Manag. 2023, 20, 116–126. (In Chinese) [Google Scholar] [CrossRef]
  2. Yang, D.; Xiao, T. Pricing and green level decisions of a green supply chain with governmental interventions under fuzzy uncertainties. J. Clean. Prod. 2017, 149, 1174–1187. [Google Scholar] [CrossRef]
  3. Arfi, W.B.; Hikkerova, L.; Sahut, J.M. External knowledge sources, green innovation and performance. Technol. Forecast. Soc. Chang. 2018, 129, 210–220. [Google Scholar] [CrossRef]
  4. Ghosh, D.; Shah, J. A comparative analysis of greening policies across supply chain structures. Int. J. Prod. Econ. 2012, 135, 568–583. [Google Scholar] [CrossRef]
  5. Achillas, C.; Bochtis, D.D.; Aidonis, D.; Folinas, D. Green Supply Chain Management; Routledge: London, UK, 2018. [Google Scholar] [CrossRef]
  6. Li, M.; Gao, X. Implementation of enterprises’ green technology innovation under market-based environmental regulation: An evolutionary game approach. J. Environ. Manag. 2022, 308, 114570. [Google Scholar] [CrossRef] [PubMed]
  7. Wang, A.; Hu, S.; Zhu, M.; Wu, M. Customer contagion effects of voluntary environmental regulation: A supplier green innovation perspective. Energy Econ. 2024, 132, 107446. [Google Scholar] [CrossRef]
  8. Wang, M.; Li, Y.; Zhang, H.; Wang, H. Market-oriented driven enterprise green technology innovation model construction and path analysis. Sci. Technol. Prog. Policy 2019, 36, 112–120. (In Chinese) [Google Scholar] [CrossRef]
  9. Kammerer, D. The effects of customer benefit and regulation on environmental product innovation: Empirical evidence from appliance manufacturers in Germany. Ecol. Econ. 2009, 68, 2285–2295. [Google Scholar] [CrossRef]
  10. Xu, G.; Chen, H.; Wu, X.; Zhou, C. Green cost sharing game analysis in competitive supply chains. J. Syst. Sci. Syst. Eng. 2020, 35, 244–256. (In Chinese) [Google Scholar] [CrossRef]
  11. Chen, Y.S.; Lai, S.B.; Wen, C.T. The influence of green innovation performance on corporate advantage in Taiwan. J. Bus. Ethics 2006, 67, 331–339. [Google Scholar] [CrossRef]
  12. Jeong, D.; Lee, J.D. Where and how does a product evolve? Product innovation pattern in product lineage. Technovation 2024, 131, 102958. [Google Scholar] [CrossRef]
  13. Xu, M.; Liu, H. Carbon Neutral Strategy for Siemens Total Value Chain. Enterp. Manag. 2024, 58–62. (In Chinese) [Google Scholar]
  14. Xie, X.; Huo, J.; Zou, H. Green process innovation, green product innovation, and corporate financial performance: A content analysis method. J. Bus. Res. 2019, 101, 697–706. [Google Scholar] [CrossRef]
  15. Zhang, X.; Ma, Z.; Tian, D.; Xue, G. Research on the Influencing Factors of Enterprises’ Green Supply Chain Management Practices—An Exploration Based on Meta-Analytic Approach. Chin. J. Popul. Resour. Environ. 2017, 27, 183–195. (In Chinese) [Google Scholar]
  16. Fernando, Y.; Jabbour, C.J.C.; Wah, W.X. Pursuing green growth in technology firms through the connections between environmental innovation and sustainable business performance: Does service capability matter? Resour. Conserv. Recycl. 2019, 141, 8–20. [Google Scholar] [CrossRef]
  17. Jiang, S.; Fang, P. Research on the effect of government subsidy based on green supply chain. J. Syst. Manag. 2019, 28, 594–601. (In Chinese) [Google Scholar] [CrossRef]
  18. Xie, X.; Huo, J.; Qi, G.; Zhu, K.X. Green process innovation and financial performance in emerging economies: Moderating effects of absorptive capacity and green subsidies. IEEE Trans. Eng. Manag. 2015, 63, 101–112. [Google Scholar] [CrossRef]
  19. Yang, T.; Tian, J. Supply chain pricing and green innovation strategy under different channel power structures. Soft Sci. 2019, 33, 127–132. [Google Scholar] [CrossRef]
  20. Amin-Naseri, M.R.; Azari Khojasteh, M. Price competition between two leader–follower supply chains with risk-averse retailers under demand uncertainty. Int. J. Adv. Manuf. Technol. 2015, 79, 377–393. [Google Scholar] [CrossRef]
  21. Wang, X.; Wang, Y.; Zhang, S.; Wang, X.; Xu, S. Green supply chain emission reduction strategy and smart contract under blockchain technology. J. Front. Comput. Sci. Technol. 2024, 18, 265–278. (In Chinese) [Google Scholar] [CrossRef]
  22. Lin, Q.; Liu, M.; Wang, X. Green supply chain decision making with embedded blockchain messaging functionality. Comput. Integr. Manuf. Syst. 2024, 30, 355–368. (In Chinese) [Google Scholar] [CrossRef]
  23. Sun, R.; He, D.; Su, H. Research on the application of blockchain technology in supply chain finance based on evolutionary game. Chin. J. Manag. Sci. 2024, 32, 125–134. (In Chinese) [Google Scholar] [CrossRef]
  24. Sun, R.; Yan, J.; He, D.; Wang, X. Evolutionary game study of forestry carbon sink project development risk based on blockchain technology. Soft Sci. 2024, 1, 1–19. (In Chinese) [Google Scholar]
  25. Mei, Q.; Er, H.; Liu, S.; Zhang, J. A multi-case study of green supply chain collaborative innovation model for small and medium-sized manufacturing enterprises. Sci. Sci. Manag. 2023, 44, 50–61. (In Chinese) [Google Scholar]
  26. Chan, H.K.; Yee RW, Y.; Dai, J.; Lim, M.K. The moderating effect of environmental dynamism on green product innovation and performance. Int. J. Prod. Econ. 2016, 181, 384–391. [Google Scholar] [CrossRef]
  27. Geng, R.; Mansouri, S.A.; Aktas, E. The relationship between green supply chain management and performance: A meta-analysis of empirical evidences in Asian emerging economies. Int. J. Prod. Econ. 2017, 183, 245–258. [Google Scholar] [CrossRef]
  28. Zhu, Q.; Sarkis, J. Relationships between operational practices and performance among early adopters of green supply chain management practices in Chinese manufacturing enterprises. J. Oper. Manag. 2004, 22, 265–289. [Google Scholar] [CrossRef]
  29. Cai, X.; Chen, J.; Xiao, Y.; Xu, X. Optimization and coordination of fresh product supply chains with freshness-keeping effort. Prod. Oper. Manag. 2010, 19, 261–278. [Google Scholar] [CrossRef]
  30. Liang, Y.; Liang, X.; Wei, H. Differential Game Study of Competitive Green Supply Chain Based on Green Public Technology Innovation and Product Greenness. IEEE Access 2023, 11, 103725–103742. [Google Scholar] [CrossRef]
  31. Hou, Q.; Guan, Y.; Yu, S. Stochastic differential game model analysis of emission-reduction technology under cost-sharing contracts in the carbon trading market. IEEE Access 2020, 8, 167328–167340. [Google Scholar] [CrossRef]
  32. Li, M.; Dong, H.; Yu, H.; Sun, X.; Zhao, H. Evolutionary Game and Simulation of Collaborative Green Innovation in Supply Chain under Digital Enablement. Sustainability 2023, 15, 3125. [Google Scholar] [CrossRef]
  33. Amui, L.B.L.; Jabbour, C.J.C.; de Sousa Jabbour, A.B.L.; Kannan, D. Sustainability as a dynamic organizational capability: A systematic review and a future agenda toward a sustainable transition. J. Clean. Prod. 2017, 142, 308–322. [Google Scholar] [CrossRef]
  34. Abbas, J.; Balsalobre-Lorente, D.; Amjid, M.A.; Al-Sulaiti, K.; Al-Sulaiti, I.; Aldereai, O. Financial innovation and digitalization promote business growth: The interplay of green technology innovation, product market competition and firm performance. Innov. Green Dev. 2024, 3, 100111. [Google Scholar] [CrossRef]
  35. Brandenburg, M.; Govindan, K.; Sarkis, J.; Seuring, S. Quantitative models for sustainable supply chain management: Developments and directions. Eur. J. Oper. Res. 2014, 233, 299–312. [Google Scholar] [CrossRef]
  36. Chen, H.; Peng, C.; Guo, S.; Yang, Z.; Qi, K. A two-stage evolutionary analysis of green technology innovation diffusion based on complex market networks. Chin. J. Manag. Sci. 2024, 32, 135–144. (In Chinese) [Google Scholar] [CrossRef]
  37. Wu, S.I.; Chen, Y.J. The impact of green marketing and perceived innovation on purchase intention for green products. Int. J. Mark. Stud. 2014, 6, 81. [Google Scholar] [CrossRef]
  38. Li, G.; Wang, X.; Su, S.; Su, Y. How green technological innovation ability influences enterprise competitiveness. Technol. Soc. 2019, 59, 101136. [Google Scholar] [CrossRef]
  39. Bai, C.; Sarkis, J.; Dou, Y. Corporate sustainability development in China: Review and analysis. Ind. Manag. Data Syst. 2015, 1151, 5–40. [Google Scholar] [CrossRef]
  40. Wang, Q.; Ren, S. Evaluation of green technology innovation efficiency in a regional context: A dynamic network slacks-based measuring approach. Technol. Forecast. Soc. Chang. 2022, 182, 121836. [Google Scholar] [CrossRef]
  41. Sun, Y.; Chen, S. Spatio-temporal evolution pattern and driving factors of green technology innovation efficiency in the Yangtze River Delta region. Geogr. Res. 2021, 40, 2743–2759. (In Chinese) [Google Scholar] [CrossRef]
  42. Liao, B.; Li, L. Urban green innovation efficiency and its influential factors: The Chinese evidence. Environ. Dev. Sustain. 2023, 25, 6551–6573. [Google Scholar] [CrossRef]
  43. Sun, R.; He, D.; Yan, J. Research on risk mitigation mechanism of forestry carbon sink project development based on stochastic differential game. Syst. Eng. Theory Pract. 2014, 1, 1–31. (In Chinese) [Google Scholar]
  44. Perroni, M.G.; da Costa, S.E.; de Lima, E.P.; da Silva, W.V. The relationship between enterprise efficiency in resource use and energy efficiency practices adoption. Int. J. Prod. Econ. 2017, 190, 108–119. [Google Scholar] [CrossRef]
  45. Liang, Y.; Xin, L.; Hua, W. Differential game study of competitive supply chain based on sustainable innovation of public technology. IEEE Access 2023, 11, 88824–88840. [Google Scholar] [CrossRef]
  46. Wang, D.; Wang, T.; Zhang, B. Differential game of cooperative emission reduction in supply chain under government subsidy. Oper. Res. Manag. Sci. 2019, 28, 46–55. (In Chinese) [Google Scholar]
  47. Liu, L.; Han, T.; Jin, H. Differential game of three-level green supply chain considering brand goodwill under cost sharing mechanism. Control Decis. 2024, 39, 659–668. (In Chinese) [Google Scholar] [CrossRef]
Figure 1. Supply chain model.
Sustainability 16 06295 g001
Figure 2. Trajectory of greenness of products produced by Manufacturer 1.
Sustainability 16 06295 g002
Figure 3. Trajectory of greenness of products produced by Manufacturer 2.
Sustainability 16 06295 g003
Figure 4. Trajectory of greenness of products promoted by Manufacturer 1.
Sustainability 16 06295 g004
Figure 5. Trajectory of greenness of products promoted by Manufacturer 2.
Sustainability 16 06295 g005
Figure 6. The level of green product innovation effort by Manufacturer 1.
Sustainability 16 06295 g006
Figure 7. The level of green process innovation effort by Manufacturer 2.
Sustainability 16 06295 g007
Table 1. Costs of green innovation for suppliers, manufacturers and retailers.
Green Product InnovationGreen Process Innovation
Supplier C s 1 t = 1 2 η s 1 f s 1 2 t C s 2 t = 1 2 ν 2 η s 2 f s 2 2 t
Manufacturer C m 1 t = 1 2 η m 11 f m 11 2 t + 1 2 ν 1 η m 12 f m 12 2 t C m 2 t = 1 2 ν 2 η m 21 f m 21 2 t + 1 2 ν 3 η m 22 f m 22 2 t
Retailer C m r 1 t = 1 2 ν 1 η r 1 f r 1 2 t C m r 2 t = 1 2 ν 3 η r 2 f r 2 2 t
Table 2. Green innovation costs for suppliers, manufacturers and retailers after the introduction of cost-sharing contracts and government subsidies.
Green Product InnovationGreen Process Innovation
Supplier 1 θ s 1 C s 1 1 θ s 2 1 ξ m 2 C s 2
Manufacturer 1 ξ m 1 C m 1 + θ s 1 C s 1 + θ r 1 C m r 1 1 ξ m 2 θ s 2 C s 2 θ r 2 C m r 2
Retailer 1 θ r 1 C m r 1 1 θ r 2 C m r 2
Table 3. Supply chain green technology innovation parameterization.
ParametersHidden Meaning
Green
Product
Innovation
C s 1 Green innovation costs of supplier
η s 1 Green product innovation cost factor for supplier
f s 1 Level of green product innovation effort by supplier
C m 1 Green innovation costs of Manufacturer 1
η m 11 Green product innovation cost factor for Manufacturer 1
f m 11 Level of green product innovation effort by Manufacturer 1
ξ m 1 Percentage of government subsidy
θ s 1 Proportion of costs shared by Manufacturer 1 for supplier
C m r 1 Total cost of publicity for Manufacturer 1 and Retailer 1
η m 12 Green promotion cost factor for Manufacturer 1
f m 12 Level of green advocacy efforts by Manufacturer 1
f r 1 Level of green advocacy efforts by Retailer 1
η r 1 Cost promotion cost factor for Retailer 1
ν 1 Cost factor for cooperation between Manufacturer 1 and Retailer 1
θ r 1 Proportion of advocacy costs borne by Manufacturer 1 for Retailer 1
Green Process Innovation C s 2 Green innovation costs of supplier
η s 2 Green process innovation cost factor for supplier
f s 2 Level of green process innovation effort by supplier
C m 2 Green innovation costs of Manufacturer 2
η m 21 Green process innovation cost factor for Manufacturer 2
f m 21 Level of green process innovation effort by Manufacturer 2
ν 2 Cost factor for cooperation between supplier and Manufacturer 2
ξ m 2 Percentage of government subsidy
θ s 2 Proportion of costs shared by Manufacturer 2
C m r 2 Total cost of publicity for Manufacturer 2 and Retailer 2
η m 22 Green promotion cost factor for Manufacturer 2
f m 22 Level of green advocacy efforts by Manufacturer 2
f r 2 Level of green advocacy efforts by Retailer 2
η r 2 Cost promotion cost factor for Retailer 2
ν 3 Cost factor for cooperation between Manufacturer 2 and Retailer 2
θ r 2 Proportion of advocacy costs borne by Manufacturer 2 for Retailer 2
Disclaimer/Publisher’s Note: The statements, opinions and data contained in all publications are solely those of the individual author(s) and contributor(s) and not of MDPI and/or the editor(s). MDPI and/or the editor(s) disclaim responsibility for any injury to people or property resulting from any ideas, methods, instructions or products referred to in the content.

