
Environmental Health Crises and Public Health Outcomes: Using China’s Empirical Data to Verify the Joint Role of Environmental Regulation and Internet Development


Abstract
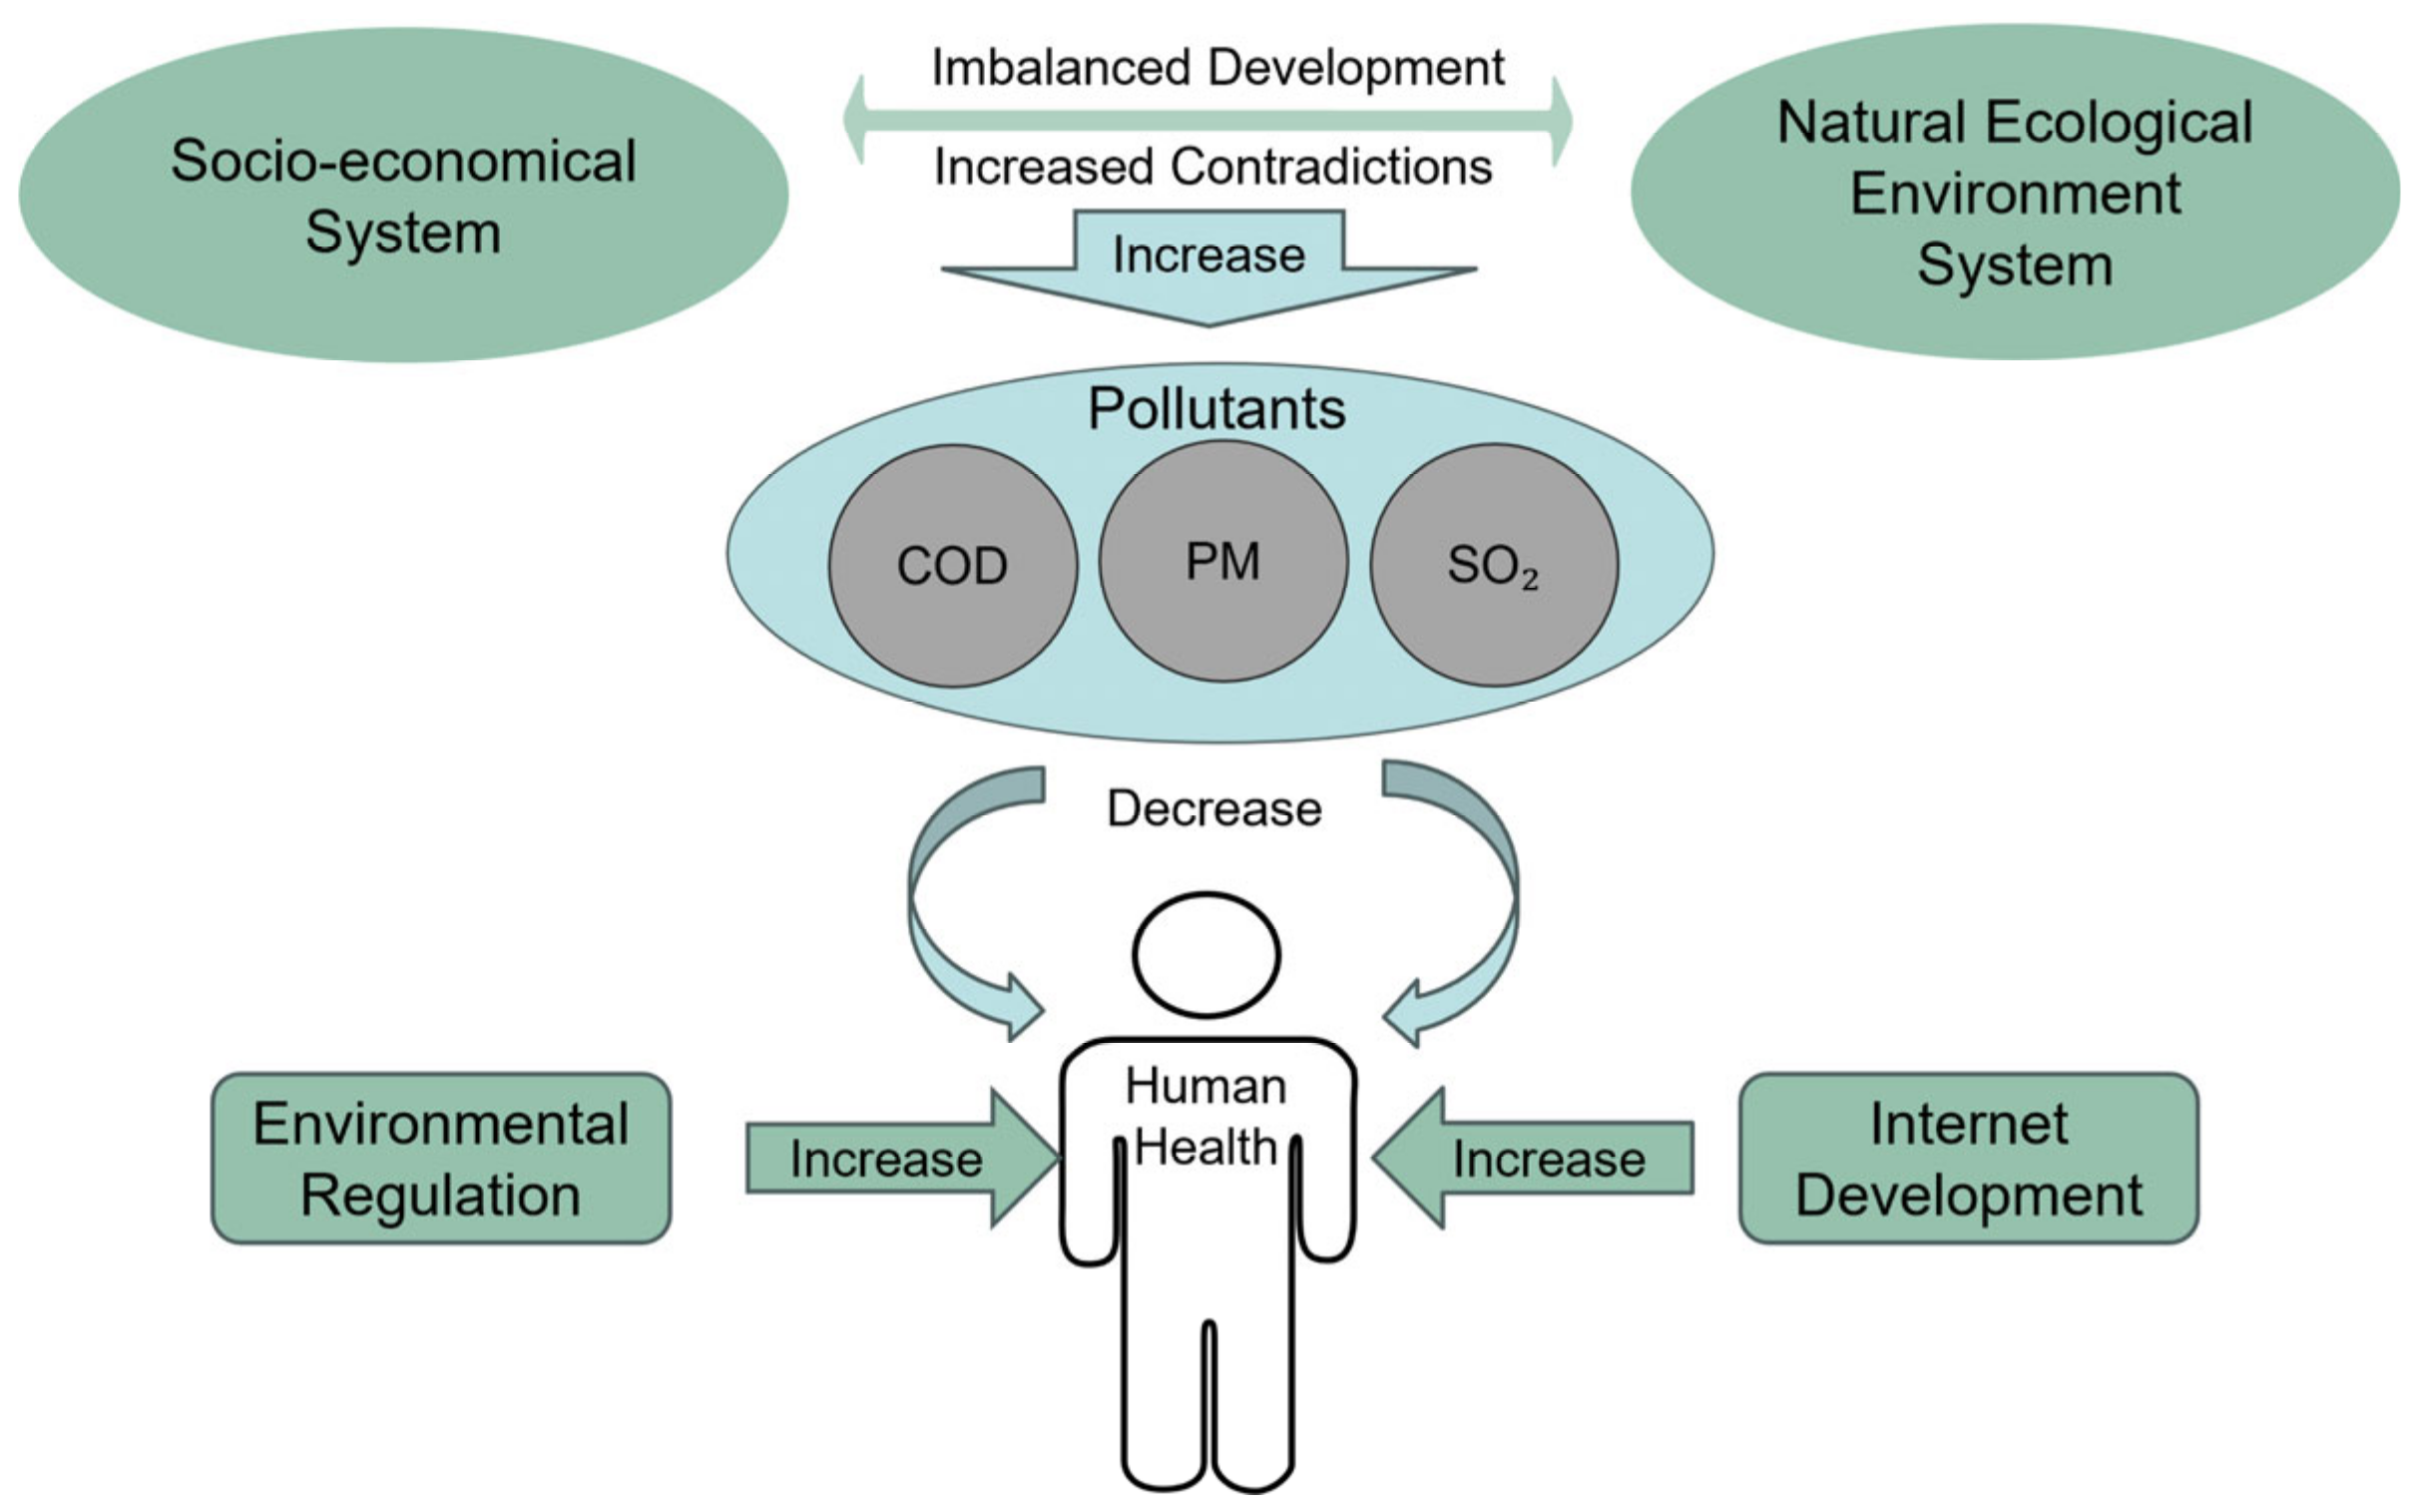
1. Introduction
2. Theoretical Analysis and Research Hypotheses
3. Materials and Methods
3.1. Model Specification
3.2. Variable Selection
3.2.1. Explained Variable
3.2.2. Explanatory Variable
3.2.3. Control Variables
3.3. Data Sources
4. Results
4.1. Benchmark Regression Results
4.2. Moderating Effect Test
4.3. Regression Results for Regional Heterogeneity
4.4. Spatial Effect Test
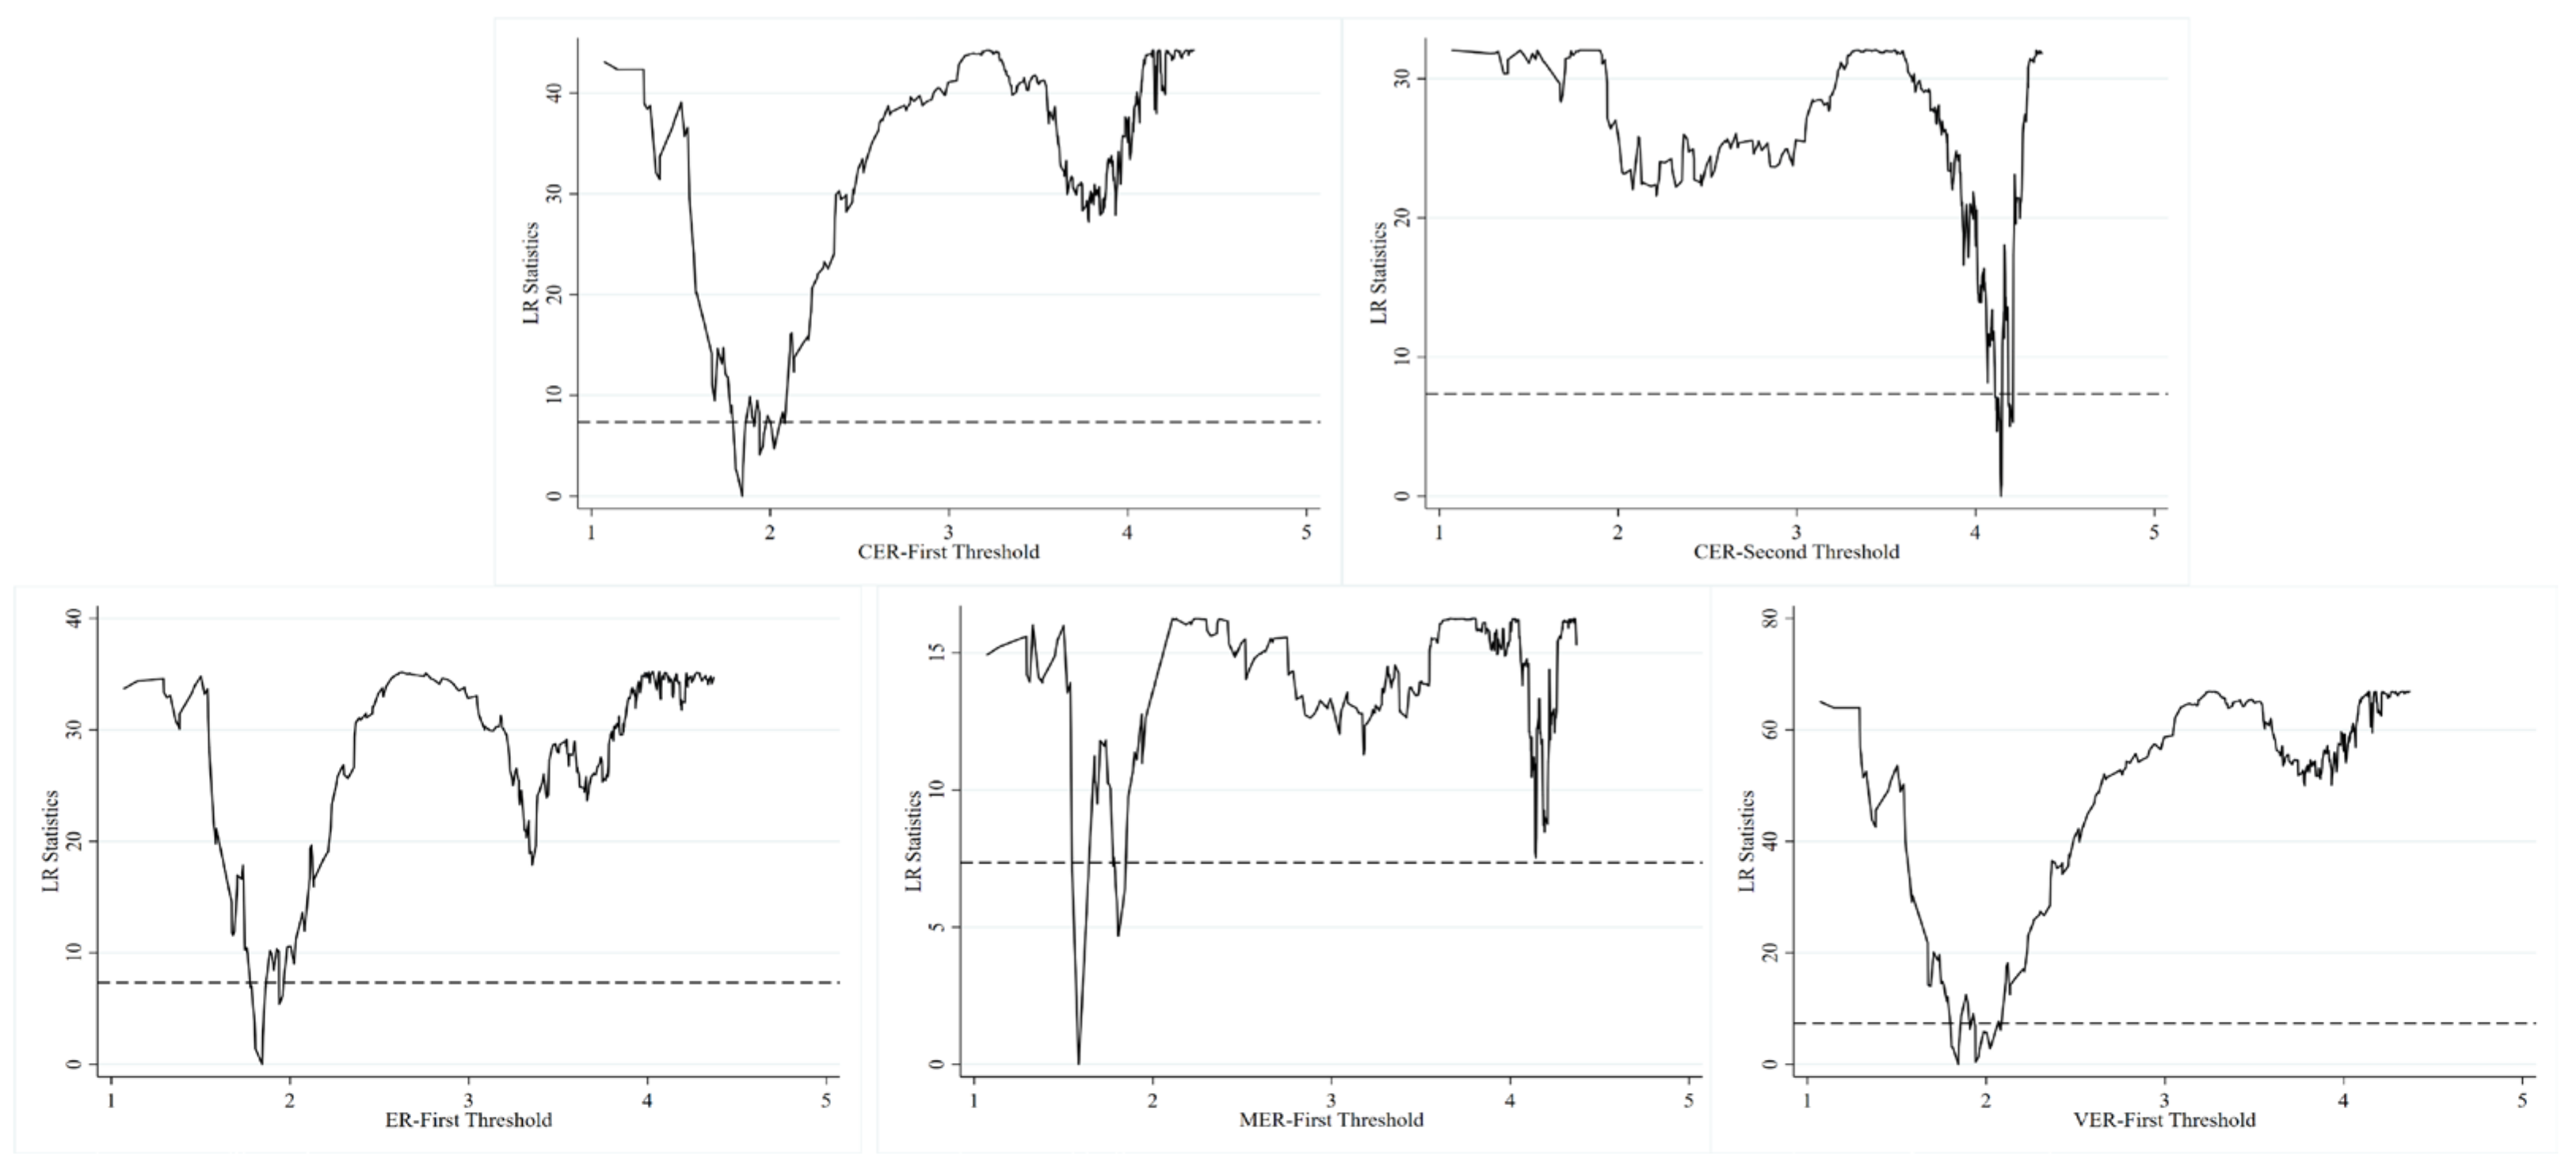
4.5. Threshold Effect Analysis
4.6. Robustness Checks
5. Conclusions and Policy Implications
5.1. Conclusions
- PHO is significantly harmed by EP. The extent of health damage caused by pollution varies according to geographic regions, energy structure, and the level of medical resources. Eastern provinces, provinces with a significant coal share, and provinces with substantial medical resource endowments are more severely affected by pollution’s detrimental effects on public health. ER and ID can effectively mitigate the adverse effects. There is a positive moderating effect.
- PHO benefits directly from ER and ID. The significance of ER’s impact on PHO is consistent with the significance of the health damage of EP under the grouping conditions of geographic region, energy structure, and level of medical resources. Meanwhile, ID has a greater impact on PHO in central and western provinces, and its regional variability in terms of energy structure and medical resource endowment is not apparent.
- ER, ID, and PHO exhibit positive spatial agglomeration. Specifically, there is spatial agglomeration in some provinces at higher levels and spatial agglomeration in some provinces at lower levels. ER has a negative spatial spillover effect on PHO. Its intensity grows in adjacent spatial units, increasing the unit’s public health burden. Conversely, improvements in internet use have a beneficial spatial spillover impact on public health. An increase in its level in neighboring spatial units will help to improve the unit’s public health.
- With an increasing ID level, the impact of both comprehensive ER and heterogeneous regulatory tools on PHO gradually improves. The impact of VER and comprehensive ER on PHO has a single threshold. The influence of their significance increases as ID progresses beyond a certain threshold. There is a double threshold for the public health effects of CER, which is also characterized by an increase in the significance of the effects as the internet develops. Increased internet growth significantly lessens the detrimental consequences of MER on PHO.
5.2. Policy Implications
- Establishing and improving a governance system that synergistically combines multiple types of environmental regulatory tools with regional characteristics. Local governments should optimize the combination and implementation intensity of various regulatory tools to reduce pollutant emissions and environmental health crises for residents. Currently, China’s central government has proposed the goal of “carbon peaking and carbon neutrality”, which puts new demands on environmental regulatory measures. In the new situation, various regulatory measures should be taken to further guide enterprises and the public to participate in the process of environmental health management, such as improving low-carbon transformation regulations, accelerating the establishment of carbon emission trading markets, and creating carbon neutrality special bonds. Meanwhile, local authorities ought to strengthen their support for the clean energy industry and medical care and promote the energy structure’s optimization and the improvement of the supply capacity of medical resources so as to improve the public health situation.
- Further increase internet penetration to improve health resources’ accessibility. The internet has expanded rapidly in China in recent years, largely due to the implementation of the “Broadband China” strategy in 2013. Nevertheless, the extent of internet coverage in western China and rural areas remains limited. Government agencies should speed up the construction of internet infrastructure in favor of less developed regions to narrow the “digital gap” with developed eastern regions. The policy of internet speed-up and cost reduction should be actively promoted to improve the enthusiasm of residents for using the internet, so that the coverage of high-quality health resources will benefit residents in underdeveloped areas. In addition, it should enrich the medical application scenarios of the internet and establish internet medical service platforms such as Alibaba Health Network Hospital to improve the accessibility of medical resources and the convenience of medical insurance reimbursement, so as to provide better medical services and health security for residents.
- Strengthen regional cooperation and improve cross-regional coordination mechanisms for ER and ID. The border pollution problem poses a serious threat to the health of local residents. Uncoordinated ER and poor communication of information are the main reasons for this problem. Local governments should continue to promote the construction of internet platforms to share environmental information and then jointly monitor the overall environmental quality. Based on analyzing environmental information, cross-regional cooperation in environmental enforcement should be actively carried out. Through the construction of industrial internet platforms, Beijing, Tianjin, and Hebei provinces of China have taken collaborative governance measures and achieved positive results in the prevention and control of air pollution. At the same time, regions should encourage the creation of a database that facilitates the sharing of corporate data and enhance the coordination of ER to decrease rent-seeking opportunities for polluting companies and to avoid institutional loopholes resulting from differences in policy intensity, which could lead to the problem of pollution transfer, the shifting of environmental health crises, and the exacerbation of inequalities in population health between regions.
- Actively explore the integrated development path of the internet and ER, and embed the internet into ER tools. We find that ID facilitates the PHO improvement effects of various types of ER. Therefore, the government should accelerate the promotion of internet technology so that it has the basic conditions for integration with ER. It should use the internet as a basis to promote the intelligence and digitization of the application of various environmental regulatory tools, forming an “Internet Plus Regulation” model. Through online channels such as portal websites, microblogs, TikTok, etc., the government should promptly release the policy details of the CER and MER. This will also provide a convenient online channel for the public to report pollution behavior and guide them to use the internet to participate more deeply in environmental governance. Government departments should further use internet technology to analyze public opinion and deal with environmental problems reflected by the public by improving the network response mechanism to strengthen the effect of VER.
5.3. Limitations and Future Research
Supplementary Materials
Author Contributions
Funding
Institutional Review Board Statement
Informed Consent Statement
Data Availability Statement
Conflicts of Interest
Nomenclature
| Acronym | Full Name |
| PHO | Public health outcome |
| ER | Environmental regulation |
| CER | Command-based environmental regulation |
| MER | Market-based environmental regulation |
| VER | Voluntary environmental regulation |
| ID | Internet development |
| EW-T | Entropy weight–TOPSIS |
| SDM | Spatial Durbin model |
| SLM | Spatial lag model |
| SEM | Spatial error model |
| SWM | Spatial weight matrix |
References
- Brook, J.R.; Setton, E.M.; Seed, E.; Shooshtari, M.; Doiron, D.; Hlt, C.C.U.E. The Canadian urban environmental health research consortium—A protocol for building a national environmental exposure data platform for integrated analyses of urban form and health. BMC Public Health 2018, 18, 15. [Google Scholar] [CrossRef] [PubMed]
- Jiang, Q.T.; Xu, Z.C.; Ye, G.Q.; Pahlow, M.; Hu, M.Z.; Qu, S. A systematic scoping review of environmental and socio-economic effects of COVID-19 on the global ocean-human system. Sci. Total Environ. 2022, 849, 157925. [Google Scholar] [CrossRef] [PubMed]
- Orru, K.; Nordin, S.; Harzia, H.; Orru, H. The role of perceived air pollution and health risk perception in health symptoms and disease: A population-based study combined with modelled levels of pm10. Int. Arch. Occup. Environ. Health 2018, 91, 581–589. [Google Scholar] [CrossRef] [PubMed]
- Deryugina, T.; Heutel, G.; Miller, N.H.; Molitor, D.; Reif, J. The mortality and medical costs of air pollution: Evidence from changes in wind direction. Am. Econ. Rev. 2019, 109, 4178–4219. [Google Scholar] [CrossRef] [PubMed]
- Yang, T.; Zhou, K.L.; Ding, T. Air pollution impacts on public health: Evidence from 110 cities in Yangtze River economic belt of China. Sci. Total Environ. 2022, 851, 8. [Google Scholar] [CrossRef] [PubMed]
- Peng, B.; Shen, X. Does Environmental regulation affect circular economy performance? Evidence from China. Sustainability 2024, 16, 4406. [Google Scholar] [CrossRef]
- Cohen, A.J.; Brauer, M.; Burnett, R.; Anderson, H.R.; Frostad, J.; Estep, K.; Balakrishnan, K.; Brunekreef, B.; Dandona, L.; Dandona, R.; et al. Estimates and 25-year trends of the global burden of disease attributable to ambient air pollution: An analysis of data from the global burden of diseases study 2015. Lancet 2017, 389, 1907–1918. [Google Scholar] [CrossRef]
- Feng, D.L.; Hu, M.Z.; Zhao, L.D.; Liu, S. The impact of firm heterogeneity and external factor change on innovation: Evidence from the vehicle industry sector. Sustainability 2022, 14, 6507. [Google Scholar] [CrossRef]
- He, X.; Chen, W. Digital transformation and environmental, social, and governance performance from a human capital perspective. Sustainability 2024, 16, 4737. [Google Scholar] [CrossRef]
- Qiu, L.D.; Zhou, M.H.; Wei, X. Regulation, innovation, and firm selection: The porter hypothesis under monopolistic competition. J. Environ. Econ. Manag. 2018, 92, 638–658. [Google Scholar] [CrossRef]
- Lazzini, S.; Occhipinti, Z.; Parenti, A.; Verona, R. Disentangling economic crisis effects from environmental regulation effects: Implications for sustainable development. Bus. Strateg. Environ. 2021, 30, 2332–2353. [Google Scholar] [CrossRef]
- Li, F.; Lu, C.; Li, T. Air pollution, physical exercise, and physical health: An analysis based on data from the China general social survey. Sustainability 2024, 16, 4480. [Google Scholar] [CrossRef]
- Tang, E.; Liu, F.C.; Zhang, J.J.; Yu, J. A model to analyze the environmental policy of resource reallocation and pollution control based on firms’ heterogeneity. Resour. Policy 2014, 39, 88–91. [Google Scholar] [CrossRef]
- Shapiro, J.S. Pollution trends and us environmental policy: Lessons from the past half century. Rev. Environ. Econ. Policy 2022, 16, 42–61. [Google Scholar] [CrossRef]
- Cai, L.Z.; Guo, L. Environmental decentralization, environmental regulation and environmental pollution: Evidence from China. Pol. J. Environ. Stud. 2023, 32, 2053–2068. [Google Scholar] [CrossRef] [PubMed]
- Kelly, F.J.; Fussell, J.C. Air pollution and public health: Emerging hazards and improved understanding of risk. Environ. Geochem. Health 2015, 37, 631–649. [Google Scholar] [CrossRef] [PubMed]
- Pokharel, A.; Hennessy, D.A.; Wu, F.L.C. Health burden associated with tillage-related pm2.5 pollution in the United States, and mitigation strategies. Sci. Total Environ. 2023, 903, 10. [Google Scholar] [CrossRef] [PubMed]
- Jing, Y.H.; Hu, M.Z.; Zhao, L.D. The effect of heterogeneous environmental regulations on the employment skill structure: The system-GMM approach and mediation model. PLoS ONE 2023, 18, e0290276. [Google Scholar] [CrossRef] [PubMed]
- Peng, J.Y.; Xie, R.; Ma, C.B.; Fu, Y. Market-based environmental regulation and total factor productivity: Evidence from Chinese enterprises*. Econ. Model 2021, 95, 394–407. [Google Scholar] [CrossRef]
- Nie, G.Q.; Zhu, Y.F.; Wu, W.P.; Xie, W.H.; Wu, K.X. Impact of voluntary environmental regulation on green technological innovation: Evidence from Chinese manufacturing enterprises. Front. Energy Res. 2022, 10, 13. [Google Scholar] [CrossRef]
- Shen, N.; Liao, H.L.; Deng, R.M.; Wang, Q.W. Different types of environmental regulations and the heterogeneous influence on the environmental total factor productivity: Empirical analysis of China’s industry. J. Clean. Prod. 2019, 211, 171–184. [Google Scholar] [CrossRef]
- Yu, X.; Wang, P. Economic effects analysis of environmental regulation policy in the process of industrial structure upgrading: Evidence from Chinese provincial panel data. Sci. Total Environ. 2021, 753, 10. [Google Scholar] [CrossRef] [PubMed]
- Denfanapapol, S.; Setthasuravich, P.; Rattanakul, S.; Pukdeewut, A.; Kato, H. The digital divide, wealth, and inequality: An examination of socio-economic determinants of collaborative environmental governance in Thailand through provincial-level panel data analysis. Sustainability 2024, 16, 4658. [Google Scholar] [CrossRef]
- Yin, X.C.; Li, J.; Si, H.Y.; Wu, P. Attention marketing in fragmented entertainment: How advertising embedding influences purchase decision in short-form video apps. J. Retail. Consum. Serv. 2024, 76, 103572. [Google Scholar] [CrossRef]
- Martin, N.; Rice, J. Rebalancing climate change debate and policy: An analysis of online discussions. Environ. Policy Gov. 2014, 24, 338–350. [Google Scholar] [CrossRef]
- Takahashi, Y.; Ohura, T.; Ishizaki, T.; Okamoto, S.; Miki, K.; Naito, M.; Akamatsu, R.; Sugimori, H.; Yoshiike, N.; Miyaki, K.; et al. Internet use for health-related information via personal computers and cell phones in Japan: A cross-sectional population-based survey. J. Med. Internet Res. 2011, 13, 14. [Google Scholar] [CrossRef] [PubMed]
- Lyu, S.J.; Sun, J. Internet use and self-rated health among Chinese older adults: The mediating role of social capital. Geriatr. Gerontol. Int. 2021, 21, 34–38. [Google Scholar] [CrossRef] [PubMed]
- Wu, H.T.; Ba, N.; Ren, S.Y.; Xu, L.; Chai, J.X.; Irfan, M.; Hao, Y.; Lu, Z.N. The impact of internet development on the health of Chinese residents: Transmission mechanisms and empirical tests. Socio-Econ. Plan. Sci. 2022, 81, 15. [Google Scholar] [CrossRef]
- Garrett, B.; Mallia, E.; Anthony, J. Public perceptions of internet-based health scams, and factors that promote engagement with them. Health Soc. Care Community 2019, 27, E672–E686. [Google Scholar] [CrossRef]
- Hatcher, W.; Hunter, L.; Meares, W.; Lizotte, M.K.; Avent-Holt, D. Community-level internet connectivity and mental health: An analysis of united states counties. J. Ment. Health 2019, 28, 490–494. [Google Scholar] [CrossRef]
- Alsamrai, O.; Redel-Macias, M.D.; Pinzi, S.; Dorado, M.P. A systematic review for indoor and outdoor air pollution monitoring systems based on Internet of Things. Sustainability 2024, 16, 4353. [Google Scholar] [CrossRef]
- Dutta, U.P.; Gupta, H.; Sengupta, P.P. ICT and health outcome nexus in 30 selected Asian countries: Fresh evidence from panel data analysis. Technol. Soc. 2019, 59, 101184. [Google Scholar] [CrossRef]
- Omri, A.; Kahouli, B.; Kahia, M. Environmental sustainability and health outcomes: Do ICT diffusion and technological innovation matter? Int. Rev. Econ. Financ. 2024, 89, 1–11. [Google Scholar] [CrossRef]
- Chou, W.Y.S.; Liu, B.M.; Post, S.; Hesse, B. Health-related internet use among cancer survivors: Data from the health information national trends survey, 2003-2008. J. Cancer Surviv.-Res. Pract. 2011, 5, 263–270. [Google Scholar] [CrossRef]
- Zhang, J.P.; Gong, X.M.; Zhang, H. ICT diffusion and health outcome: Effects and transmission channels. Telemat. Inform. 2022, 67, 101755. [Google Scholar] [CrossRef]
- Gong, X.; Zhang, H.; Zhang, J. Digital wallet, happy heart: An analysis based on the economic–social–environmental perspective. J. Theor. Appl. Electron. Commer. Res. 2024, 19, 1222–1242. [Google Scholar] [CrossRef]
- Sinclair, A.J.; Peirson-Smith, T.J.; Boerchers, M. Environmental assessments in the internet age: The role of e-governance and social media in creating platforms for meaningful participation. Impact Assess. Proj. Apprais. 2017, 35, 148–157. [Google Scholar] [CrossRef]
- He, Q.; Deng, X.; Li, C.; Yan, Z.C.; Qi, Y.B. Do internet skills increase farmers’ willingness to participate in environmental governance? Evidence from rural China. Agriculture 2021, 11, 1202. [Google Scholar] [CrossRef]
- Zhang, D.; Sana, U. Towards a green economy in China? Examining the impact of the internet of things and environmental regulation on green growth. Sustainability 2023, 15, 2528. [Google Scholar] [CrossRef]
- Grossman, M. On the concept of health capital and the demand for health. J. Polit. Econ. 1972, 82, 233–255. [Google Scholar] [CrossRef]
- Cropper, M.L. Measuring the benefits from reduced morbidity. Am. Econ. Rev. 1981, 71, 235–240. [Google Scholar] [PubMed]
- Fan, H.C.; Lin, F.Q.; Lin, S. The hidden cost of trade liberalization: Input tariff shocks and worker health in China. J. Int. Econ. 2020, 126, 24. [Google Scholar] [CrossRef]
- Xie, Q.; Feng, J. The health and welfares of environmental regulation. China Econ. Q. 2023, 23, 894–912. [Google Scholar] [CrossRef]
- Ye, W.Q.; Huang, Z.J. The long-term effect of air pollution on health outcomes for the middle-aged and the elderly. J. Huazhong. Univ. Sci. Technol.-Soc. Sci. Ed. 2022, 36, 121–135. [Google Scholar] [CrossRef]
- Yang, X.D.; Wu, H.T.; Ren, S.Y.; Ran, Q.Y.; Zhang, J.N. Does the development of the internet contribute to air pollution control in China? Mechanism discussion and empirical test. Struct. Change Econ. Dyn. 2021, 56, 207–224. [Google Scholar] [CrossRef]
- Li, M.J.; Du, W.J. Can internet development improve the energy efficiency of firms: Empirical evidence from China. Energy 2021, 237, 9. [Google Scholar] [CrossRef]
- Gu, F.; Zhang, W.J.; Guo, J.F.; Hall, P. Exploring “internet plus recycling”: Mass balance and life cycle assessment of a waste management system associated with a mobile application. Sci. Total Environ. 2019, 649, 172–185. [Google Scholar] [CrossRef] [PubMed]
- Hu, M.Z. Multivariate understanding of income and expenditure in united states households with statistical learning. Comput. Stat. 2022, 37, 2129–2160. [Google Scholar] [CrossRef]
- Feng, Y.C.; Wang, X.H.; Du, W.C.; Wu, H.Y.; Wang, J.T. Effects of environmental regulation and FDI on urban innovation in China: A spatial Durbin econometric analysis. J. Clean. Prod. 2019, 235, 210–224. [Google Scholar] [CrossRef]
- Hansen, B.E. Threshold effects in non-dynamic panels: Estimation, testing, and inference. J. Econom. 1999, 93, 345–368. [Google Scholar] [CrossRef]
- Ahmad, N.A.; Ismail, N.W.; Sidique, S.F.A.; Mazlan, N.S. Air pollution, governance quality, and health outcomes: Evidence from developing countries. Environ. Sci. Pollut. Res. 2023, 30, 41060–41072. [Google Scholar] [CrossRef] [PubMed]
- Constant, K.; Davin, M. Pollution, children’s health and the evolution of human capital inequality. Math. Soc. Sci. 2021, 112, 9–25. [Google Scholar] [CrossRef]
- Sanders, B.; Davis, M. Effects of climate change and air pollution on perinatal health. J. Midwifery Women Health 2023, 68, 383–390. [Google Scholar] [CrossRef] [PubMed]
- Chen, H.; Li, L.; Lei, Y.L.; Wu, S.M.; Yan, D.; Dong, Z.Y. Public health effect and its economics loss of PM2.5 pollution from coal consumption in China. Sci. Total Environ. 2020, 732, 8. [Google Scholar] [CrossRef]
- Hu, M.; Zhang, Y.; Dowling, N.M. An analysis of factors predicting memory loss in Alzheimer’s disease prevention. In Proceedings of the 2017 International Joint Conference on Neural Networks (IJCNN), Anchorage, AK, USA, 14–19 May 2017. [Google Scholar] [CrossRef]
- Zhang, K.K.; Xu, D.Y.; Li, S.R. The impact of environmental regulation on environmental pollution in China: An empirical study based on the synergistic effect of industrial agglomeration. Environ. Sci. Pollut. Res. 2019, 26, 25775–25788. [Google Scholar] [CrossRef] [PubMed]
- Li, Y.; Hu, M.Z.; Zhao, L.D. Study on the impact of industrial green development and technological innovation on employment structure. Front. Earth Sci. 2023, 11, 1115476. [Google Scholar] [CrossRef]
- Li, R.; Sun, T. Research on impact of different environmental regulation tools on energy efficiency in China. Pol. J. Environ. Stud. 2020, 29, 4151–4160. [Google Scholar] [CrossRef]
- Zhao, K.; Wu, C.; Liu, J.; Liu, Y. Green finance, green technology innovation and the upgrading of China’s industrial structure: A study from the perspective of heterogeneous environmental regulation. Sustainability 2024, 16, 4330. [Google Scholar] [CrossRef]
- Yang, T.R.; Liu, W.L. Does air pollution affect public health and health inequality? Empirical evidence from China. J. Clean. Prod. 2018, 203, 43–52. [Google Scholar] [CrossRef]
- Shen, W.T.; Yu, X.; Zhong, S.B.; Ge, H.R. Population health effects of air pollution: Fresh evidence from China health and retirement longitudinal survey. Front. Public Health 2021, 9, 12. [Google Scholar] [CrossRef]
- Pei, Y.H.; Chen, H.L.; Liu, Z.H.; Hu, H.Z. Does environmental regulation improve residents’ health? Evidence from China. Front. Public Health. 2023, 11, 11. [Google Scholar] [CrossRef]
- Hou, B.; Li, Y.M.; Wang, H.X. Internet use and health status among older adults: The mediating role of social participation. Front. Public Health 2022, 10, 11. [Google Scholar] [CrossRef]
- Anser, M.K.; Hanif, I.; Vo, X.V.; Alharthi, M. The long-run and short-run influence of environmental pollution, energy consumption, and economic activities on health quality in emerging countries. Environ. Sci. Pollut. Res. 2020, 27, 32518–32532. [Google Scholar] [CrossRef] [PubMed]
- Pu, L.D. Fairness of the distribution of public medical and health resources. Front. Public Health 2021, 9, 14. [Google Scholar] [CrossRef]
- Han, Y.; Zhu, Y.J. Study on the effect of supercritical CFB boiler air preheater and flue gas treatment facilities on sulfur trioxide emission characteristics. Energy Rep. 2022, 8, 926–939. [Google Scholar] [CrossRef]
- Zhao, Z.B.; Shi, X.P.; Cao, Y.; Hu, M.Z. The impact of urban population spatial distribution on CO2 emissions in China from the perspective of individual and interactive effects. Environ. Sci. Pollut. Res. 2023, 30, 117096–117109. [Google Scholar] [CrossRef]
- Wu, F.; Chen, W.; Lin, L.L.; Ren, X.; Qu, Y.N. The balanced allocation of medical and health resources in urban areas of China from the perspective of sustainable development: A case study of Nanjing. Sustainability 2022, 14, 6707. [Google Scholar] [CrossRef]
- Lesage, J.; Pace, R.K. Introduction to Spatial Econometrics; CRC Press: Boca Raton, FL, USA, 2009. [Google Scholar]
- Qu, X.; Lee, L.F. Estimating a spatial autoregressive model with an endogenous spatial weight matrix. J. Econom. 2015, 184, 209–232. [Google Scholar] [CrossRef]
- Qu, X.; Lee, L.F.; Yu, J.H. QML estimation of spatial dynamic panel data models with endogenous time varying spatial weights matrices. J. Econom. 2017, 197, 173–201. [Google Scholar] [CrossRef]
- Sun, J.; Zhai, N.N.; Miao, J.C.; Mu, H.R.; Li, W.X. How do heterogeneous environmental regulations affect the sustainable development of marine green economy? Empirical evidence from China’s coastal areas. Ocean Coastal Manag. 2023, 232, 10. [Google Scholar] [CrossRef]


| Types | Variables | Measurement Indicators |
|---|---|---|
| Explained variable | PHO | Overall mortality rate |
| Perinatal mortality rate | ||
| Maternal mortality rate | ||
| The proportion of children under 5 years old with severe malnutrition | ||
| Class A and B notifiable infectious illness incidence rates | ||
| Core explanatory variables | ER | Number of environmental administrative penalties issued during the year (CER) |
| Ratio of completed investment in industrial pollution control to industrial value added (MER) | ||
| Average years of education completed by the general population (VER) | ||
| ID | Internet penetration rate | |
| Auxiliary explanatory variable | EP | Industrial sulfur dioxide emissions per CNY 10,000 of GDP |
| Industrial wastewater discharge per CNY 10,000 of GDP | ||
| Industrial particulate matter emissions per CNY 10,000 of GDP | ||
| Industrial chemical oxygen demand emissions per CNY 10,000 of GDP | ||
| Control variables | Urban | The percentage of the population living in urban areas |
| Popul | The proportion of the total population to the administrative province | |
| Aging | The percentage of people over 65 in relation to the overall population | |
| Indust | The proportion of the tertiary sector’s production value to that of the secondary sector | |
| GDPP | The ratio of GDP to the total population |
| Variables | Model (1) | Model (2) | ||
|---|---|---|---|---|
| (1) | (2) | (3) | ||
| EP | −0.1194 *** (−4.30) | |||
| ER | 0.1704 *** (4.05) | 0.1228 *** (2.95) | ||
| lnID | 0.0389 *** (6.48) | 0.0353 *** (5.81) | ||
| lnUrban | 0.1709 *** (5.80) | 0.1895 *** (6.67) | 0.1133 *** (3.62) | 0.1044 *** (3.35) |
| lnPopul | 0.1884 *** (4.97) | 0.1686 *** (4.41) | 0.1128 *** (2.90) | 0.1070 *** (2.77) |
| Aging | −0.0170 *** (−10.97) | −0.0165 *** (−10.50) | −0.0173 *** (−11.49) | −0.0166 *** (−10.91) |
| Indust | 0.0122 (1.47) | 0.0094 (1.13) | 0.0093 (1.14) | 0.0071 (0.89) |
| lnGDPP | 0.1334 *** (5.12) | 0.1363 *** (5.23) | 0.0271 (0.88) | 0.0347 (1.13) |
| Constant | −2.0551 *** (−7.49) | −2.1141 *** (−7.74) | −0.5563 (−1.48) | −0.5869 (−1.57) |
| R2 | 0.6991 | 0.7249 | 0.6884 | 0.7043 |
| F | 105.71 *** | 105.00 *** | 113.98 *** | 100.35 *** |
| Hausman | 81.15 *** | 67.47 *** | 43.86 *** | 39.87 *** |
| Variables | Model (3) | Model (4) |
|---|---|---|
| EP | −0.2527 *** (−3.71) | −0.3472 *** (−5.46) |
| ER | 0.0232 (0.34) | |
| EP × ER | 0.5397 ** (2.36) | |
| lnID | 0.0197 *** (2.76) | |
| Ep × lnID | 0.0768 *** (4.22) | |
| Controls | Yes | Yes |
| Constant | −1.9701 *** (5.12) | −0.1936 (−0.15) |
| R2 | 0.5581 | 0.5872 |
| F | 83.99 *** | 94.59 *** |
| Variables | Grouping Dimension (1) | Grouping Dimension (2) | Grouping Dimension (3) | |||
|---|---|---|---|---|---|---|
| Eastern Provinces | Central and Western Provinces | High Coal Proportion | Low Coal Proportion | High Medical Resource Endowment | Low Medical Resource Endowment | |
| EP | −0.1885 *** (−4.46) | −0.0875 ** (−2.47) | −0.1520 *** (−4.72) | −0.1180 ** (−2.50) | −0.1464 *** (−3.20) | −0.0658 ** (−2.14) |
| Controls | Yes | Yes | Yes | Yes | Yes | Yes |
| Constant | −1.9187 *** (−4.72) | −2.2458 *** (−4.71) | −0.9531 * (−1.94) | −3.2796 *** (−6.96) | −2.4165 *** (−6.68) | −1.8008 *** (−4.49) |
| R2 | 0.6186 | 0.5708 | 0.6227 | 0.5434 | 0.5950 | 0.5576 |
| F | 51.90 *** | 74.46 *** | 72.63 *** | 52.36 *** | 64.65 *** | 55.47 *** |
| Variables | Grouping Dimension (1) | Grouping Dimension (2) | Grouping Dimension (3) | |||
|---|---|---|---|---|---|---|
| Eastern Provinces | Central and Western Provinces | High Coal Proportion | Low Coal Proportion | High Medical Resource Endowment | Low Medical Resource Endowment | |
| ER | 0.2376 *** (4.90) | 0.0947 * (1.74) | 0.1709 *** (2.82) | 0.1067 * (1.85) | 0.1624 *** (2.81) | 0.1295 ** (2.34) |
| lnID | 0.0202 *** (2.75) | 0.0570 *** (6.95) | 0.0369 *** (4.18) | 0.0291 *** (3.37) | 0.0371 *** (4.28) | 0.0327 *** (3.88) |
| Controls | Yes | Yes | Yes | Yes | Yes | Yes |
| Constant | −0.8074 (−1.34) | −0.6875 (−1.40) | −0.7867 (−1.48) | −1.5357 ** (−2.35) | −1.1671 ** (−2.46) | 0.0740 (0.12) |
| R2 | 0.6395 | 0.6322 | 0.6402 | 0.5593 | 0.6276 | 0.5853 |
| F | 48.40 *** | 82.26 *** | 66.84 *** | 47.69 *** | 63.33 *** | 53.03 *** |
| Year | PHO | ER | lnID | |||
|---|---|---|---|---|---|---|
| Moran’s I | Z-Value | Moran’s I | Z-Value | Moran’s I | Z-Value | |
| 2003 | 0.487 *** | 5.460 | 0.179 *** | 2.271 | 0.248 *** | 3.037 |
| 2004 | 0.467 *** | 5.298 | 0.263 *** | 3.170 | 0.303 *** | 3.594 |
| 2005 | 0.441 *** | 5.024 | 0.184 *** | 2.317 | 0.315 *** | 3.696 |
| 2006 | 0.448 *** | 5.137 | 0.196 *** | 2.435 | 0.322 *** | 3.742 |
| 2007 | 0.401 *** | 4.663 | 0.230 *** | 2.786 | 0.294 *** | 3.453 |
| 2008 | 0.335 *** | 3.973 | 0.291 *** | 3.461 | 0.228 *** | 2.741 |
| 2009 | 0.341 *** | 4.051 | 0.290 *** | 3.435 | 0.247 *** | 2.939 |
| 2010 | 0.303 *** | 3.629 | 0.325 *** | 3.813 | 0.285 *** | 3.316 |
| 2011 | 0.262 *** | 3.173 | 0.238 *** | 2.967 | 0.230 *** | 2.751 |
| 2012 | 0.211 *** | 2.661 | 0.213 *** | 2.780 | 0.226 *** | 2.713 |
| 2013 | 0.196 *** | 2.494 | 0.203 *** | 2.705 | 0.231 *** | 2.764 |
| 2014 | 0.236 *** | 2.932 | 0.320 *** | 3.997 | 0.216 *** | 2.607 |
| 2015 | 0.241 *** | 2.947 | 0.261 *** | 3.200 | 0.191 *** | 2.341 |
| 2016 | 0.224 *** | 2.752 | 0.327 *** | 4.147 | 0.216 *** | 2.620 |
| 2017 | 0.296 *** | 3.473 | 0.421 *** | 5.118 | 0.213 *** | 2.604 |
| 2018 | 0.255 *** | 3.030 | 0.462 *** | 5.364 | 0.200 *** | 2.484 |
| 2019 | 0.339 *** | 3.887 | 0.427 *** | 4.988 | 0.170 ** | 2.173 |
| 2020 | 0.268 *** | 3.189 | 0.416 *** | 4.908 | 0.127 ** | 1.706 |
| 2021 | 0.248 *** | 2.966 | −0.021 | 0.163 | 0.141 ** | 1.840 |
| Test Type | Models | Inverse Geographic Distance Squared | Economic Distance | Economic–Geographical Nested |
|---|---|---|---|---|
| LR test | SLM | 26.53 *** | 37.60 *** | 49.82 *** |
| SEM | 16.11 ** | 41.97 *** | 21.53 *** | |
| Wald test | SLM | 21.29 *** | 31.67 *** | 20.37 *** |
| SEM | 14.76 ** | 45.14 *** | 20.31 *** | |
| Hausman | 48.07 *** | 38.83 *** | 71.24 *** |
| Variables | Inverse Geographic Distance Squared | Economic Distance | Economic–Geographical Nested |
|---|---|---|---|
| ER | 0.1480 *** (4.10) | 0.1445 *** (4.16) | 0.1451 *** (3.92) |
| W × ER | −0.2078 *** (−3.25) | −0.1993 *** (−4.57) | −0.1708 *** (−2.67) |
| lnID | 0.0229 ** (2.23) | 0.0254 ** (2.47) | 0.0244 ** (2.27) |
| W × lnID | 0.0058 (0.45) | −0.0066 (−0.59) | 0.0136 (0.98) |
| Controls | Yes | Yes | Yes |
| ρ | 0.6637 *** (14.92) | 0.4831 *** (14.24) | 0.6506 *** (13.28) |
| R2 | 0.5732 | 0.5840 | 0.5797 |
| Log-likelihood | 1144.6948 | 1147.9694 | 1132.5494 |
| Variables | Spatial Effect Decomposition | Inverse Geographic Distance Squared | Economic Distance | Economic–Geographical Nested |
|---|---|---|---|---|
| ER | Direct effect | 0.1291 *** (3.26) | 0.1172 *** (3.03) | 0.1333 *** (3.32) |
| Indirect effect | −0.3225 *** (−1.86) | −0.2273 *** (−3.09) | −0.2212 (−1.35) | |
| Total effect | −0.1934 (−1.01) | −0.1101 (−1.14) | −0.0879 (−0.49) | |
| lnID | Direct effect | 0.0263 *** (2.76) | 0.0263 *** (2.85) | 0.0288 *** (2.89) |
| Indirect effect | 0.0613 ** (2.39) | 0.0107 (0.80) | 0.0828 *** (2.94) | |
| Total effect | 0.0875 *** (3.41) | 0.0370 *** (2.79) | 0.1116 *** (3.96) |
| Explanatory Variables | Threshold Quantity | F-Value | p-Value | Critical Value | Threshold Value | 95% Confidence Interval | ||
|---|---|---|---|---|---|---|---|---|
| 10% | 5% | 1% | ||||||
| ER | Single | 38.67 | 0.0233 | 26.7087 | 31.5770 | 43.4597 | 1.8448 | [1.7990, 1.8479] |
| Double | 8.76 | 0.7367 | 24.8407 | 30.8644 | 40.5401 | 4.0673 | [3.8279, 4.0690] | |
| Triple | 7.61 | 0.7833 | 21.1479 | 25.7204 | 34.0103 | 3.3534 | [3.1986, 3.3755] | |
| lnCER | Single | 49.22 | 0.0367 | 38.8772 | 44.6485 | 58.8148 | 1.8448 | [1.7990, 1.8479] |
| Double | 32.52 | 0.0767 | 31.0225 | 35.3533 | 49.7380 | 4.1415 | [4.1230, 4.1431] | |
| Triple | 9.46 | 0.8033 | 27.8701 | 34.3783 | 46.6562 | 3.9318 | [3.7617, 3.9396] | |
| MER | Single | 53.30 | 0.0000 | 20.1417 | 26.8086 | 40.0607 | 1.8139 | [1.7849, 1.8448] |
| Double | 16.46 | 0.1800 | 21.1566 | 24.7829 | 36.9200 | 2.1331 | [2.0298, 2.1338] | |
| Triple | 9.47 | 0.6767 | 28.0747 | 33.2742 | 42.0182 | 4.1415 | [4.1197, 4.1431] | |
| lnVER | Single | 74.70 | 0.0000 | 37.8205 | 41.5160 | 61.0776 | 1.9407 | [1.9330, 1.9592] |
| Double | 30.96 | 0.1333 | 32.5320 | 37.4536 | 51.8556 | 4.1415 | [4.1230, 4.1431] | |
| Triple | 14.16 | 0.7767 | 33.1631 | 36.2351 | 51.4784 | 2.4668 | [2.0240, 2.4929] | |
| Variables | Model (6) | Model (7) | Model (8) | Model (9) |
|---|---|---|---|---|
| ER (lnID ≤ 1.8448) | 0.0392 (0.63) | |||
| ER (lnID > 1.8448) | 0.2377 *** (5.07) | |||
| lnCER (lnID ≤ 1.8448) | −0.0016 (−0.57) | |||
| lnCER (1.8448 < lnID ≤ 4.1415) | 0.0051 ** (2.00) | |||
| lnCER (lnID > 4.1415) | 0.0030 (1.14) | |||
| MER (lnID ≤ 1.8139) | −0.1005 *** (−5.60) | |||
| MER (lnID > 1.8139) | −0.0356 *** (−3.54) | |||
| lnVER (lnID ≤ 1.9407) | 0.0890 (1.54) | |||
| lnVER (lnID > 1.9407) | 0.1161 ** (1.99) | |||
| Controls | Yes | Yes | Yes | Yes |
| Constant | −0.6789 * (−1.88) | −2.1969 *** (−7.85) | −0.5999 * (−1.67) | −1.1549 *** (−3.56) |
| R2 | 0.6080 | 0.5960 | 0.6185 | 0.6160 |
| F | 82.21 *** | 87.05 *** | 85.92 *** | 94.65 *** |
Disclaimer/Publisher’s Note: The statements, opinions and data contained in all publications are solely those of the individual author(s) and contributor(s) and not of MDPI and/or the editor(s). MDPI and/or the editor(s) disclaim responsibility for any injury to people or property resulting from any ideas, methods, instructions or products referred to in the content. |
© 2024 by the authors. Licensee MDPI, Basel, Switzerland. This article is an open access article distributed under the terms and conditions of the Creative Commons Attribution (CC BY) license (https://creativecommons.org/licenses/by/4.0/).
Share and Cite
Sun, Z.; Zhao, L.; Wang, H. Environmental Health Crises and Public Health Outcomes: Using China’s Empirical Data to Verify the Joint Role of Environmental Regulation and Internet Development. Sustainability 2024, 16, 6156. https://doi.org/10.3390/su16146156
Sun Z, Zhao L, Wang H. Environmental Health Crises and Public Health Outcomes: Using China’s Empirical Data to Verify the Joint Role of Environmental Regulation and Internet Development. Sustainability. 2024; 16(14):6156. https://doi.org/10.3390/su16146156
Chicago/Turabian StyleSun, Zhaoxu, Lingdi Zhao, and Haixia Wang. 2024. "Environmental Health Crises and Public Health Outcomes: Using China’s Empirical Data to Verify the Joint Role of Environmental Regulation and Internet Development" Sustainability 16, no. 14: 6156. https://doi.org/10.3390/su16146156
APA StyleSun, Z., Zhao, L., & Wang, H. (2024). Environmental Health Crises and Public Health Outcomes: Using China’s Empirical Data to Verify the Joint Role of Environmental Regulation and Internet Development. Sustainability, 16(14), 6156. https://doi.org/10.3390/su16146156