Article

Greening the Economy from the Ground Up: How the Minimum Wage Affects Firms’ Pollution Emissions in China

1
School of International Business, Southwest University of Finance and Economics, Chengdu 610074, China
2
Kriger School of Arts and Sciences, Anhui University of Technology, Ma’anshan 243099, China
3
School of Public Administration, Xi’an University of Architecture and Technology, Xi’an 710064, China
*
Author to whom correspondence should be addressed.
Sustainability 2024, 16(14), 6020; https://doi.org/10.3390/su16146020
Submission received: 25 May 2024 / Revised: 6 July 2024 / Accepted: 9 July 2024 / Published: 15 July 2024
(This article belongs to the Section Environmental Sustainability and Applications)

Abstract

:
The implications of minimum wage standards have been widely debated, but their effects on firms’ pollution emissions and the underlying mechanisms remain underexplored. This paper finds that the introduction of minimum wage standards significantly reduces emissions of pollutants such as carbon dioxide and sulfur dioxide. Firms respond to rising minimum wages by optimizing their product mix, enhancing technological innovation, and improving managerial efficiency, which collectively curb pollution outputs. Our analysis using a random forest model shows that these effects are most pronounced in regions with higher economic development, stringent environmental regulations, and elevated minimum wage standards. Our findings augment the body of research on minimum wage standards and introduce novel insights for emission reduction strategies for firms.

1. Introduction

In the dynamic landscape of labor economics, the enactment of minimum wage policies has consistently garnered significant attention. These policies, traditionally analyzed through the lens of employment and income dynamics [1,2], now prompt us to delve deeper into their broader socio-economic and environmental implications. Although studies such as those by [3] have illuminated the direct impacts of these policies, a comprehensive understanding of their secondary effects, particularly on environmental stewardship, remains nascent. The prevailing economic frameworks provide deep insights into the labor market’s response to minimum wage adjustments, primarily focusing on employment equilibrium and the socio-economic well-being of the workforce. However, these analyses often overlook the potential reverberations of such labor interventions on the environment. This oversight becomes particularly glaring given the current global emphasis on sustainable development and the urgent need for environmental conservation.
This gap in the literature becomes a pivotal area of inquiry in the context of China. As a global manufacturing leader and a significant contributor to global greenhouse emissions, China’s labor policies do not exist in a vacuum; they intersect with and potentially influence its environmental landscape. This intersection raises the following critical questions: Do labor market interventions, while aiming for economic growth, also have the unintended consequences of shaping environmental outcomes? Could minimum wage policies inadvertently serve as a mechanism for environmental improvement?
Our study seeks to address these questions by exploring the uncharted territory of the nexus between minimum wage policies and environmental stewardship. By integrating county-level longitudinal data with detailed records of industrial pollution in China, we employ a spatial multi-period difference-in-differences methodology. This approach is particularly suited to our study, allowing us to unravel the complexities inherent in these interrelations and to distinguish actual effects from potential confounders.
Our analysis unveils a compelling narrative. While the primary focus of minimum wage policies has been on socio-economic benefits, our study uncovers an unexpected catalyst effect—such policies also appear to drive environmental improvements. This phenomenon can be attributed to the response of firms to higher labor costs. Higher wages compel firms to innovate and optimize operations, leading to technological advancements and increased managerial efficiency. These shifts in corporate strategy not only enhance productivity but also tend to reduce environmental footprints, suggesting a synergistic relationship between wage policies and environmental outcomes.
This paper makes three significant contributions to the economic literature: Firstly, it redefines our understanding of minimum wage dynamics, advocating a broader interpretation that includes environmental considerations. This builds on the work of [4,5], who examined how minimum wage increases in Hungary led to productivity improvements, and extends it by exploring environmental impacts. Secondly, it enriches the discourse in environmental economics, highlighting how economic policies can have nuanced and sometimes indirect impacts on industrial environmental practices [6]. Thirdly, it contributes to the field of corporate governance, illustrating the intricate interplay between wage policies, strategic corporate decisions, and environmental stewardship, thereby underscoring the profound influence of managerial decisions on both economic and environmental fronts [7].

2. Policy Background

In the dynamic field of labor economics, the discourse on minimum wage policies stands at a critical intersection where normative goals meet rigorous empirical scrutiny [8]. Originally conceived as measures against labor exploitation and to elevate the economic standing of the working class, these policies have evolved in scope and complexity, mirroring the changing contours of global and regional economies. Particularly noteworthy is China’s unique approach to minimum wage regulation, which exemplifies this evolution. Rather than adhering to a uniform policy, China’s minimum wage framework is regionally bespoke, taking into account local living costs, industrial makeup, and economic development stages [9]. This regionalized approach is dynamic, with periodic reviews and adjustments reflecting China’s proactive stance in aligning wage standards with shifting economic realities. Furthermore, the scope of these policies has broadened from urban centers to include a more diverse cross-section of the workforce.
The genesis of China’s minimum wage policies can be traced back to its period of rapid industrialization. The emergence of urban centers and the explosive growth of manufacturing industries brought to the fore stark wage disparities and labor exploitation, culminating in heightened socio-economic tensions. The establishment of minimum wage floors in this context was more than an economic measure; it represented a social commitment to ensuring that the benefits of economic growth permeated to the grassroots level. Subsequent analyses of these policies reveal a complex tapestry of outcomes. Elevated wage floors have been instrumental in reducing wage inequality and enhancing the economic prospects of lower-income workers. However, they have also posed challenges for businesses, particularly in labor-intensive industries, by escalating production costs [10]. This pressure has catalyzed a strategic shift in business operations, prompting a move toward cost-efficiency and, in some instances, technological innovation as a balancing act.
Our study highlights an emerging and significant aspect of this strategic realignment: inadvertent environmental benefits. Recent empirical studies [11] have documented that as firms adapt to the regulatory landscape shaped by wage policies, there is a noticeable trend towards adopting efficiency-enhancing and environmentally friendly technologies. This development underlines an unforeseen synergy between labor regulations and environmental stewardship.
To fully appreciate the multifaceted impacts of minimum wage policies, particularly in the complex context of China, it is essential to move beyond simplistic narratives [12]. Our research aims to weave together the threads of labor regulation, corporate strategy, and environmental implications. By integrating empirical rigor with theoretical depth, we seek to illuminate the intricate interplay between labor policies, corporate responses, and their broader ramifications, thereby contributing to a more holistic understanding of this complex nexus [13].

3. Research Hypotheses

3.1. The Product Structure Effect

At the heart of neoclassical production theory lies the fundamental tenet that firms undertake resource allocation optimization in response to external stimuli [14]. Within the labor context, an elemental input, firms encountering escalated costs prompted by regulatory modifications like adjustments in minimum wage standards may experience a profound recalibration within their optimal production function [15]. This recalibration gains prominence due to the intrinsic impetus to either sustain or augment profitability, prompting firms to strategically realign their resource deployment [16]. This strategic realignment encompasses more than mere shifts in product portfolios; it serves as a responsive mechanism that resonates through diverse dimensions of production, including its ecological implications [17]. As firms pivot toward intricate, high-value products, they frequently assimilate advanced technologies that inherently manifest heightened environmental efficiency [18].
Expanding upon this premise, our central hypothesis posits that the adjustment in minimum wage standards engenders shifts in firms’ product structures, which subsequently influence the magnitude of the pollution emissions they generate. The intricate interplay between labor costs and product structures acts as a catalyst, compelling firms to reevaluate their production choices. Specifically, when minimum wage standards rise, firms respond by transitioning toward higher value-added products as a strategic maneuver to counterbalance the augmented labor costs [2]. This strategic shift towards more intricate products not only epitomizes a product portfolio realignment but concurrently triggers a ripple effect on the operational dynamics of firms [19].
Drawing upon the sophisticated framework of the difference-in-differences (DID) model, our analysis will facilitate the identification and measurement of the causal relationship between changes in minimum wage standards and subsequent alterations in product structures [20]. By juxtaposing firms operating in regions with differing minimum wage adjustments, we seek to ascertain whether and to what extent elevated minimum wage standards prompt discernible changes in firms’ production configurations [21].
Furthermore, we hypothesize that the changes in product structures, precipitated by the shifts in minimum wage standards, will in turn affect the extent of pollution emissions emanating from these firms [22]. The implicit rationale behind this supposition rests on the premise that the strategic transition toward higher value-added products often necessitates the adoption of advanced technologies and more efficient production processes. Consequently, these technological and operational shifts are anticipated to exert a moderating influence on the quantum of pollution emissions generated [23].
Hypothesis 1: 
Firms proactively adapt to heightened minimum wage standards by strategically reorganizing their product structures towards more intricate and high-value commodities, which will further affect the pollution emissions.

3.2. Technological Innovation Effect

Endogenous growth theory, especially its Schumpeterian manifestation, elucidates the intricate nexus between cost pressures and the process of innovation. Within an environment marked by escalating labor costs, firms, spurred by their pursuit of equilibrium, might significantly amplify their innovation endeavors. This augmentation is driven by the inherent aim of discovering and refining technologies that not only optimize labor utilization but also reduce its indispensability. As firms navigate the realm of innovation, an unforeseen yet fortuitous consequence emerges—a trajectory that steers them towards the adoption of cleaner, more sustainable technologies.
In light of this theoretical foundation, our proposed mechanism postulates that the adjustments in minimum wage standards exert a discernible influence on firms’ innovation capabilities, thereby subsequently impacting their pollution emissions [24]. The link between these seemingly disparate elements is illuminated through the lens of endogenous growth theory. Elevated minimum wage standards engender cost pressures on firms, propelling them to explore innovative avenues as a strategic response. The intrinsic goal is twofold: to curtail labor-related costs and to optimize operational efficiency. Firms, propelled by these imperatives, may embark on a trajectory of technological innovation [25].
Our inquiry leverages a sophisticated methodological framework, prominently employing a difference-in-differences (DID) design. By contrasting firms operating in regions characterized by varying degrees of minimum wage adjustments, we aim to disentangle the causal relationship between changes in minimum wage standards, their corresponding impact on innovation activities, and the subsequent implications for pollution emissions.
Furthermore, we posit that the heightened innovation activities spurred by increased minimum wage standards propel firms toward the integration of advanced technologies and sustainable practices. This organic shift in technological adoption is anticipated to foster a reduction in pollution emissions, as these innovative technologies often yield efficiencies that mitigate the environmental footprint of production processes.
In summary, our proposed mechanism aligns with endogenous growth theory to assert that shifts in minimum wage standards influence firm innovation efforts, subsequently influencing their pollution emissions. By intertwining these elements within a comprehensive framework, we aim to unravel the intricate dynamics through which firms respond to labor cost fluctuations, channeling their responses into innovation initiatives that ultimately bear implications for environmental outcomes [26]. This mechanistic perspective enriches our comprehension of the multifaceted interplay between labor market policies, innovation trajectories, and ecological sustainability [27].
Hypothesis 2: 
Elevated minimum wage standards act as a catalyst for fostering technological innovation within firms, inadvertently steering them towards pathways characterized by enhanced environmental sustainability.

3.3. Managerial Efficiency Effect

The Unseen Catalyst: Embedded within the realm of managerial economics is an inconspicuous yet influential force that orchestrates operational efficiency amid external complexities. As labor costs ascend, managerial strategies assume a pivotal role [28]. These strategies streamline operations, ensuring the maximal optimization of all resources, including labor. This quest for internal efficiency translates into streamlined operations, thereby minimizing operational inefficiencies and facilitating optimal resource utilization [29,30]. Within this realm of streamlined operations and judicious resource employment, a latent advantage emerges—reduced energy consumption and diminished environmental footprints.
Hypothesis 3: 
In response to augmented labor costs resulting from elevated minimum wage standards, firms enhance their managerial efficiency, inadvertently leading to reductions in carbon emissions.

3.4. Heterogeneity: The Choreography of Regional Disparities

Within China’s expansive landscape, replete with diverse economic terrains, the effects of any policy ripple in distinct ways. Individual regions, each characterized by unique economic and regulatory intricacies, may exhibit disparate responses to equivalent policy stimuli. Wealthier coastal regions might possess the capital resources to invest in advanced, eco-friendly technologies. In contrast, regions historically subjected to stringent environmental scrutiny might already operate near their peak efficiency, rendering further improvements arduous [31].
Hypothesis 4: 
The influence of heightened minimum wage standards on carbon emissions and firm behaviors manifests heterogeneously across regions, shaped by their distinct economic and regulatory landscapes.

4. Variables Data and Method

4.1. Variables

4.1.1. Core Explanatory Variable

Minimum Wage Standards: To facilitate rigorous comparisons across different time periods, we adopt a meticulous measurement approach. The nominal minimum wage is adjusted for inflation using the consumer price index (CPI). This adjustment ensures that all assessments are conducted in real terms, eliminating the potential distortion introduced by inflationary fluctuations. By calibrating the nominal minimum wage to its real value using the CPI, we are equipped to discern genuine changes in minimum wage standards over time, thus enhancing the precision and validity of our analysis.
The minimum wage standards serve as the primary policy intervention of interest. Adjusting for inflation is crucial to isolate the real effects of policy changes from nominal fluctuations.

4.1.2. Dependent Variable

A Firm’s Emissions: The quantity of carbon dioxide and other carbon compounds emitted by a firm due to the consumption of fossil fuels. This variable is measured by total carbon emissions and SO2 emissions in metric tons per year sourced from environmental audit reports or relevant regulatory bodies overseeing environmental standards. Firms’ emissions are the key environmental outcome of interest, directly reflecting the impact of minimum wage policies on environmental performance.

4.1.3. Mechanism Variables

(a) Product Structure: Changes in product structure can indicate shifts toward higher value-added products, potentially leading to more efficient and less polluting production processes. Products include the array of goods and services produced by a firm, particularly emphasizing the value added per product. Using industry classification codes, products will be categorized based on their value addition, and a weighted average of the firm’s product mix will be derived.
(b) Technological Innovation: Technological innovation is a critical pathway through which firms can mitigate the cost pressures of higher wages, potentially leading to environmental benefits. This includes novel technologies or processes adopted by a firm to enhance productivity or reduce costs. Measured by investments in research and development (R&D) as a percentage of the firm’s total revenues and the number of patents filed/awarded in the relevant period.
(c) Managerial Efficiency: Enhanced managerial efficiency can help firms absorb higher labor costs through improved operational practices, potentially reducing emissions.
This includes the efficiency with which resources (human, material, and financial) are allocated and utilized within the firm to achieve its objectives. Measured by operating margin (operating income divided by revenues) supplemented by other operational efficiency ratios relevant to the industry.

4.1.4. Control Variables

Firm Size: The firm’s size can influence both the capacity to innovate and the scale of emissions. Larger firms often have economies of scale, access to better technologies, and more resources to invest in green initiatives, potentially leading to different emission patterns compared to smaller firms. Conversely, larger firms could also have a higher absolute level of emissions due to their production magnitude.
Industry Type: Industry type is a critical determinant of emissions, ensuring the effects attributed to minimum wage changes are not confounded by industry-specific factors. Different industries inherently have different carbon footprints. For instance, the manufacturing sector might have a much larger carbon footprint than the services sector. Controlling for industry type ensures that we are not merely capturing industry-specific effects.
Capital Intensity: Capital intensity affects the labor–emission nexus, with more capital-intensive firms potentially having lower marginal emission reductions from labor cost increases. Firms that are more capital-intensive might rely less on manual labor and more on machinery. The type and efficiency of this machinery can have direct implications for carbon emissions.
Labor Productivity: Labor productivity serves as an indicator of operational efficiency and technological advancement, influencing emission levels. Firms with higher labor productivity may produce goods more efficiently, potentially leading to fewer emissions per unit of output. Alternatively, high labor productivity might reflect the usage of more advanced, less emission-intensive technologies.
Missing Variables: Some potentially relevant variables were excluded from this analysis due to measurement challenges or irrelevance. For instance, specific data on firm-level environmental investments were not consistently available across our dataset. However, we believe our selected variables sufficiently capture the critical pathways through which minimum wage adjustments impact firm emissions.
Table 1 shows the description of each variable.

4.2. Data Source

The empirical foundation of this research is established upon the meticulous amalgamation of three distinct datasets: the China Industrial Firm Panel Database (CIFPD), the China Industrial Firm Pollution Database (CIFPuD), and the District and County Panel Data (DCPD). Each dataset provides an intricate understanding of the different facets of our research objectives. A brief overview of each dataset and the subsequent integration process follows:

4.2.1. China Industrial Firm Panel Database

This database offers comprehensive data on the financial and operational indicators of industrial firms across China. It covers variables related to firm size, industry type, capital intensity, labor productivity, age, and export orientation, among others. Given its exhaustive coverage, it forms the backbone of our research by providing vital control variables and the necessary context.

4.2.2. China Industrial Firm Pollution Database

As the title suggests, this database furnishes detailed statistics on pollution outputs for the industrial firms. It primarily covers metrics about carbon emissions, enabling us to extract our core dependent variable—firms’ carbon emissions. The database aligns with the firms in the CIFPD, allowing for seamless integration based on firm identifiers.

4.2.3. District and County Panel Data

This dataset captures macro-level variables at the district and county levels, encapsulating variables like local economic conditions, regulatory dynamics, and other regional nuances. The database provides the broader environment in which the firms from the CIFPD operate.

4.3. Data Matching

Integration Process: The seamless merging of these datasets was paramount to ensure the integrity and relevance of our findings. The integration was approached in the following steps:
Step 1: The primary key for integration was the unique firm identifier present in both CIFPD and CIFPuD. This allowed us to match the financial and operational data of a firm with its pollution metrics, creating a unified firm-level dataset.
Step 2: Using the geographical location of each firm (specifically, its district or county of operation) from the unified firm-level dataset, we pulled in the relevant macro-level variables from the DCPD. The location served as the connecting attribute to ensure that each firm’s data were enriched with the corresponding district or county context.
Step 3: Post integration, the dataset underwent a meticulous validation process. We cross-checked random samples to ensure data integrity and consistency. Furthermore, any missing values, especially post-merger, were treated using appropriate imputation methods or, if deemed necessary, omitted from the analysis to preserve the robustness of our results.

4.4. Method

4.4.1. Baseline Regression Model

The empirical framework in this research is based on a spatial panel difference-in-differences (DID) approach, which not only leverages the temporal variation from changes in minimum wage standards across regions but also accounts for the spatial correlations among them. This is particularly relevant given that economic activities and policies in one region might influence neighboring regions.
A basic DID model can be illustrated as follows:
Y i t = α + β 1 ( p o s t t t r e a t m e n t i ) + γ X i t + F E i t + ε i t
where Y i t denotes the carbon emissions for firm i during period t ; p o s t t is a binary variable: 1 for periods after the policy shift (increase in minimum wage) and 0 otherwise; t r e a t m e n t i is binary: 1 for firms affected by the policy change, 0 otherwise; X i t is a vector of control variables for firm i at time t ; and ε i t represents the error term.
To introduce the spatial dimension, the model can be expanded to the following:
Y i t = α + ρ W Y i t + β 1 ( p o s t t t r e a t m e n t i ) + γ X i t + θ W X i t + F E i t + ε i t
where W is the spatial weight matrix, indicating the geographic relationships between observations. Specifically, W Y i t gives the spatial lag of the dependent variable, representing average carbon emissions in neighboring regions. W X i t is the spatial lag of the control variables; ρ is the coefficient for the spatially lagged dependent variable, capturing spatial spillover effects; and θ is the coefficient vector for the spatially lagged control variables.
This advanced spatial DID model aptly represents the intricacies of our study, harnessing both time-related variations (pre- and post-policy change) and spatial dependencies to deduce the effect of minimum wage standards on firms’ carbon emissions.
To estimate the model, specialized techniques that can handle the panel data structure along with spatial correlations are needed. Techniques such as maximum likelihood or spatial two-stage least squares are common. The method chosen would largely be determined by the unique features of the dataset and the inherent spatial framework. The primary parameter of focus is β, which provides the DID estimate for the influence of minimum wage standards on firm carbon emissions, accounting for spatial interdependencies.

4.4.2. Causal Forests Algorithm

Conditional average treatment effect (CATE):
τ ( x ) = E [ Y ( 1 ) Y ( 0 ) | X = x ]
This captures the anticipated differential between the treatment and control effects conditional on feature X = x.
Splitting Criterion: For a designated split feature j and threshold s, we define: e ( j , s ) . This represents the decline in variance of the differential in expected treatment effects between the left and right subsets, where the subsets are determined by observations that fall either to the left or right of the threshold s for feature j.
Local Linear Regression: Within each leaf L, the ensuing model is estimated as follows:
Y i = α L + τ L D i + β L X i + ε i
Here, the α L   intercept term is specific to the leaf L, capturing the baseline level of the outcome Y i for that particular leaf. The τ L   represents the treatment effect within leaf L, indicating how the treatment D i affects the outcome Y i within that leaf. The β L represents the vector of coefficients for the covariates X i within leaf L. This term adjusts for the influence of covariates on the outcome within the leaf. D i is the treatment indicator for individual i, typically a binary variable (e.g., 0 or 1) indicating whether the individual received the treatment. X i is the vector of covariates for individual iii, representing other factors that might affect the outcome Y i . ε i is the error term for individual i, capturing the unexplained variance in the outcome.
The potency of causal forests resides in its capability to unearth heterogenous treatment effects in a sophisticated, high-dimensional feature space. However, it is predicated upon the setup of randomized experiments and assumes that potential outcomes are exogenous to the treatment (unbiasedness criterion).

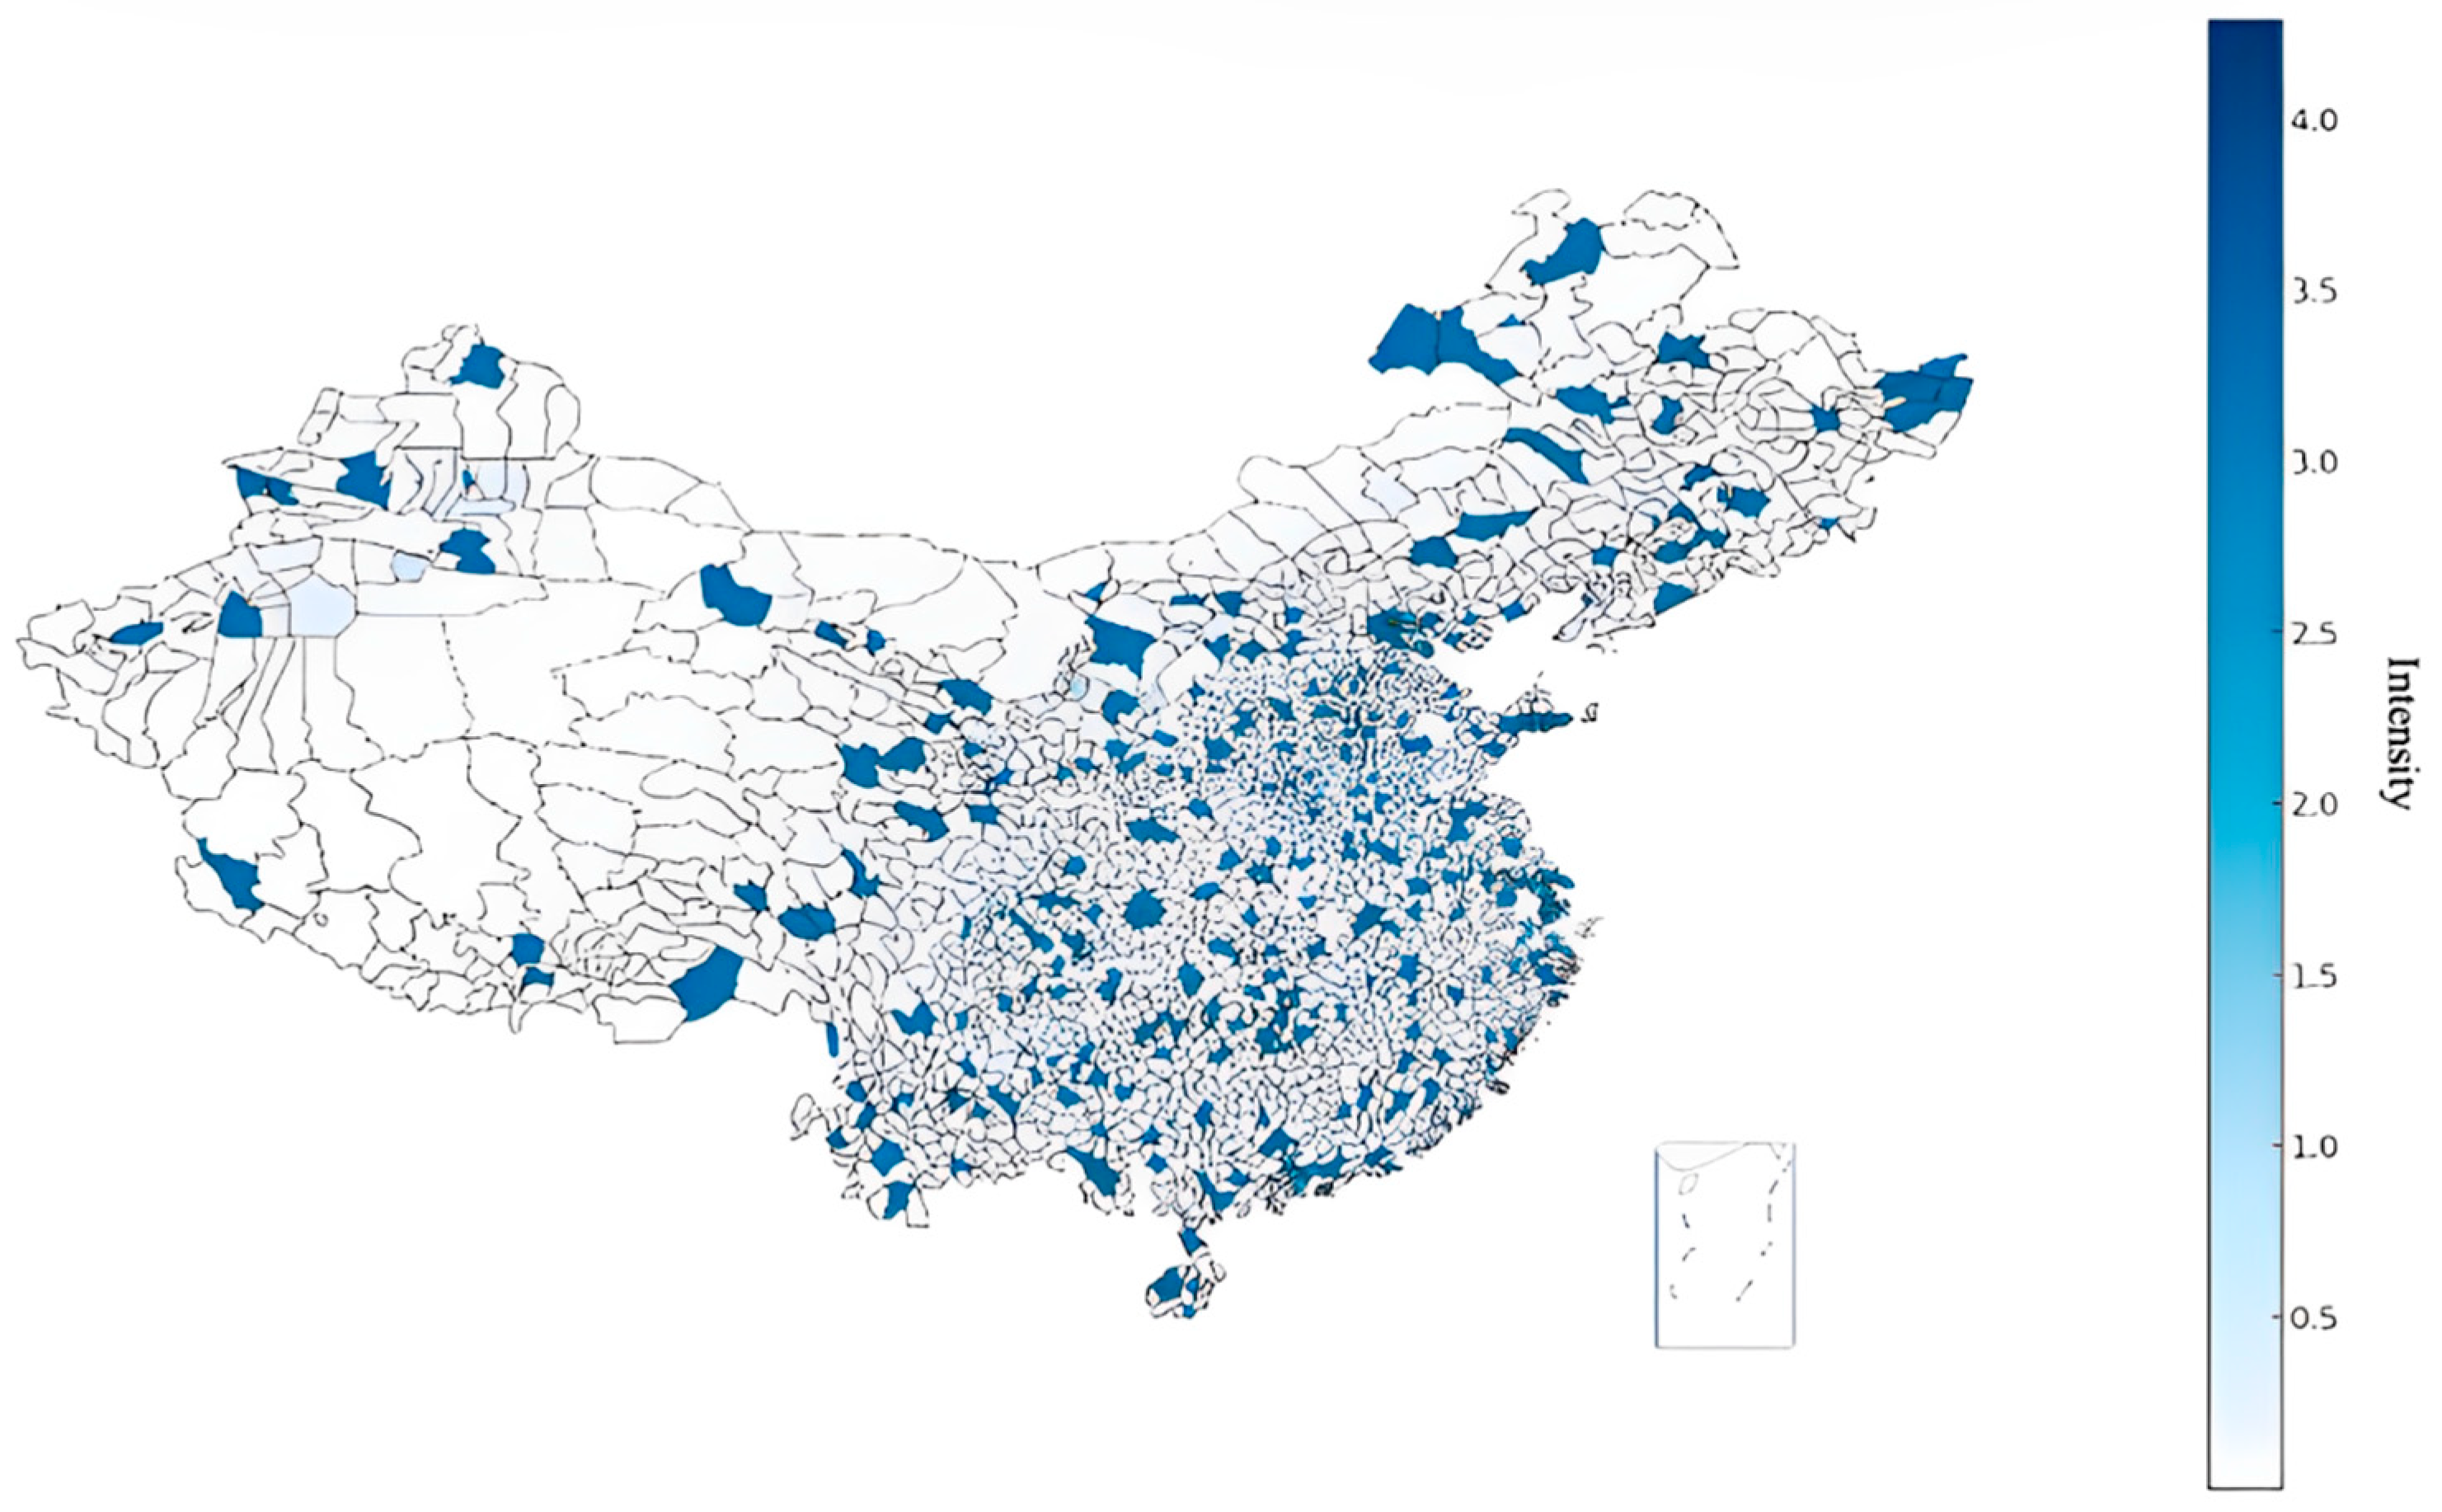
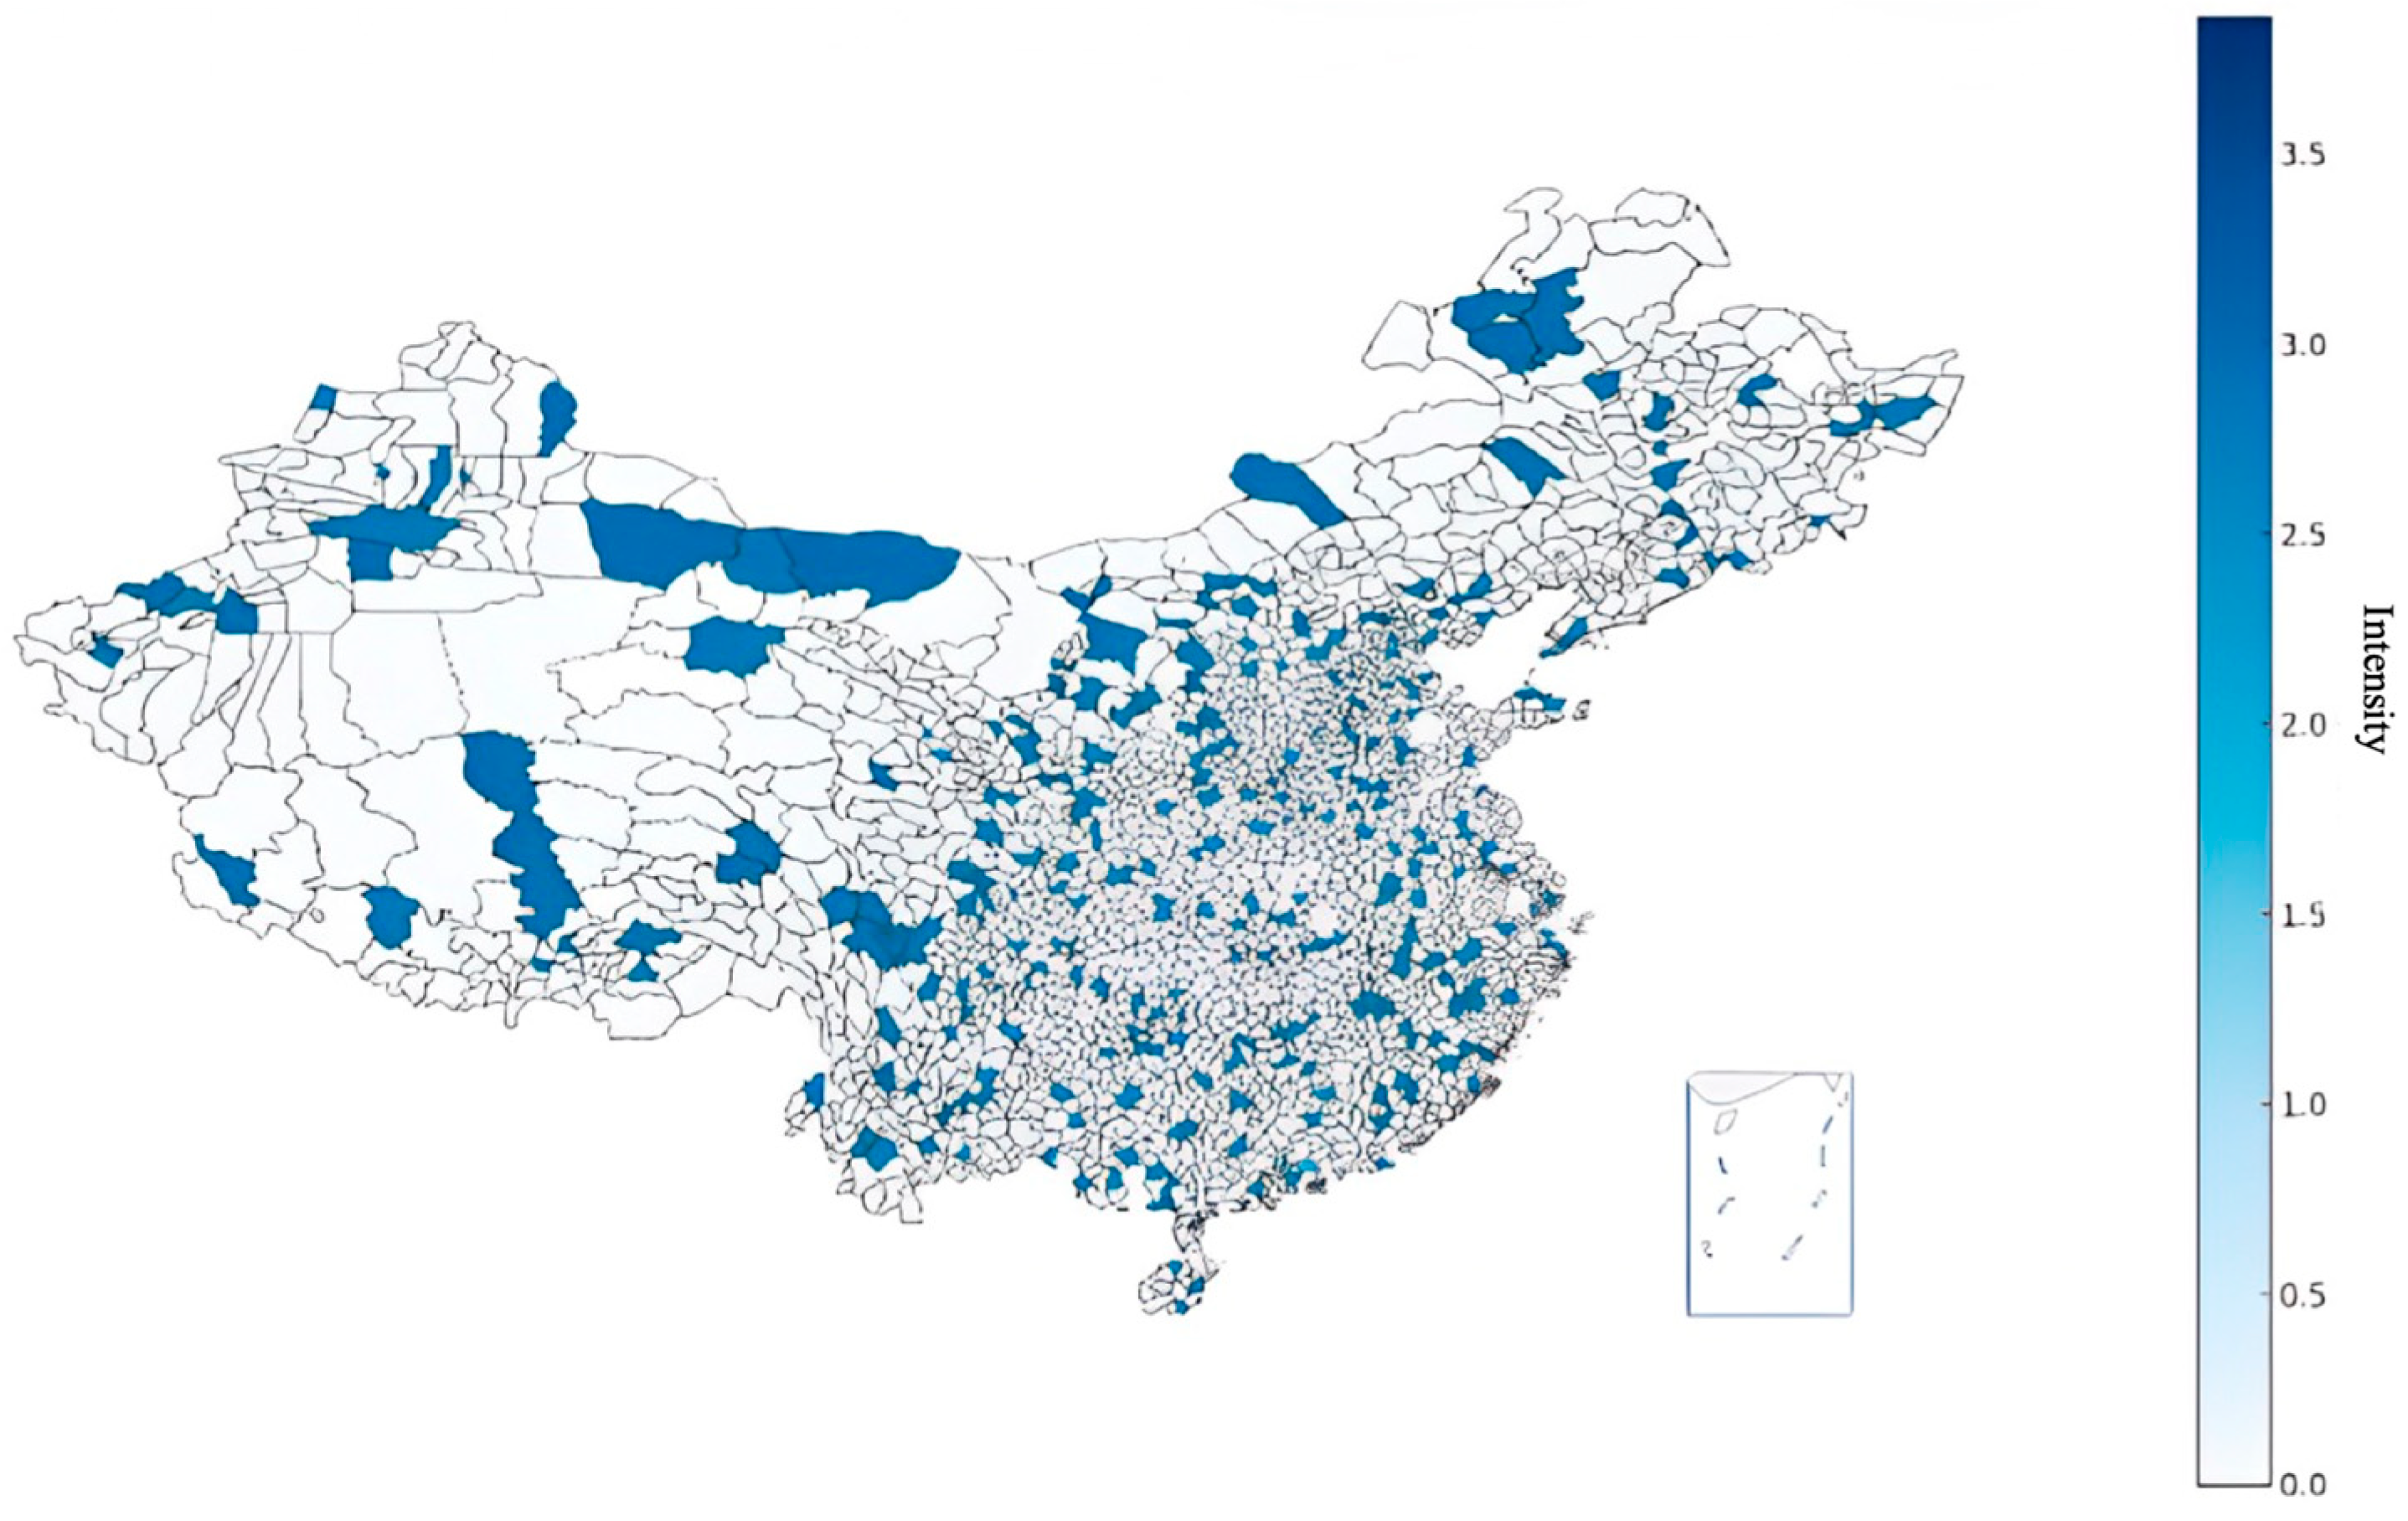
4.5. Spatial Correlation Analysis

This paper utilizes spatial hotspot analysis to detect and visualize spatial clusters of high or low values. The specific model is set as follows:
G i * = ( s u m j w i j x j x b a r s u m j w i t ) / ( s s q r t ( n s u m j w i j ( s u m j w i t ) 2 ) / ( n 1 )
where x j is the attribute value for feature j ; x b a r is the mean attribute value for all features; s is the standard deviation of all feature attribute values; w i j is the spatial weight between feature i and j ; and n is the total number of features.
If the spatial weight between feature i and j , w i j is derived from a spatial weight matrix, you can choose between contiguity-based or distance-based weights.
The significance of clustering is determined by the G i * statistic’s resulting Z-score and p-value. If the Z-score for a feature is significantly high, there is a less than 5% chance that this spatial pattern arises from random chance, meaning the feature is part of a hotspot. Conversely, significantly low Z-scores indicate cold spots. The results are shown in Figure 1 and Figure 2.

5. Results

5.1. Baseline Regression Result

Our empirical analysis leverages a rich dataset derived from the amalgamation of the Chinese Industrial Enterprise Panel Database, pollutant emission records, and county-level panel data. Exploiting spatial–temporal variations, we employ a spatial multi-period DID approach to robustly estimate the causal impact of minimum wage adjustments on firm-level pollutant emissions. The results are shown in Table 2.
In our baseline specifications, the dependent variable captures firm-level emissions, with a specific focus on carbon dioxide (CO2) and sulfur dioxide (SO2). Our key explanatory variable, the minimum wage, is introduced both in levels and in changes to account for potential non-linear effects. Furthermore, we control for a host of firm and regional characteristics, time trends, and spatial dependencies to mitigate potential confounding factors.
Our findings consistently suggest that adjustments in the minimum wage standards lead to a significant reduction in overall firm-level pollutant emissions. This overarching result remains robust across multiple specifications and after controlling for various confounders.
Delving deeper into specific pollutants, we find that the minimum wage adjustments have a pronounced negative impact on both CO2 and SO2 emissions. A one standard deviation increase in the minimum wage leads to a statistically significant decline in these specific pollutants, with the magnitude of the effect being particularly pronounced for SO2. This suggests not only an environmental efficiency gain but also potential shifts in production technologies and practices in response to labor cost adjustments.
The negative relationship between minimum wage adjustments and pollutant emissions can be attributed to multiple channels. Firms facing higher labor costs due to wage adjustments might be incentivized to optimize their production structures, potentially embracing cleaner and more technologically advanced processes. Moreover, the focus on technological innovation and enhanced management efficiency, possibly as a compensating mechanism for increased labor costs, could further contribute to lower emissions.
Furthermore, the pronounced decline in SO2 emissions post minimum wage adjustments might signal a strategic shift away from sulfur-intensive production processes. This change could arise due to the combined pressures of increased labor costs and stringent environmental regulations.

5.2. Robust Check

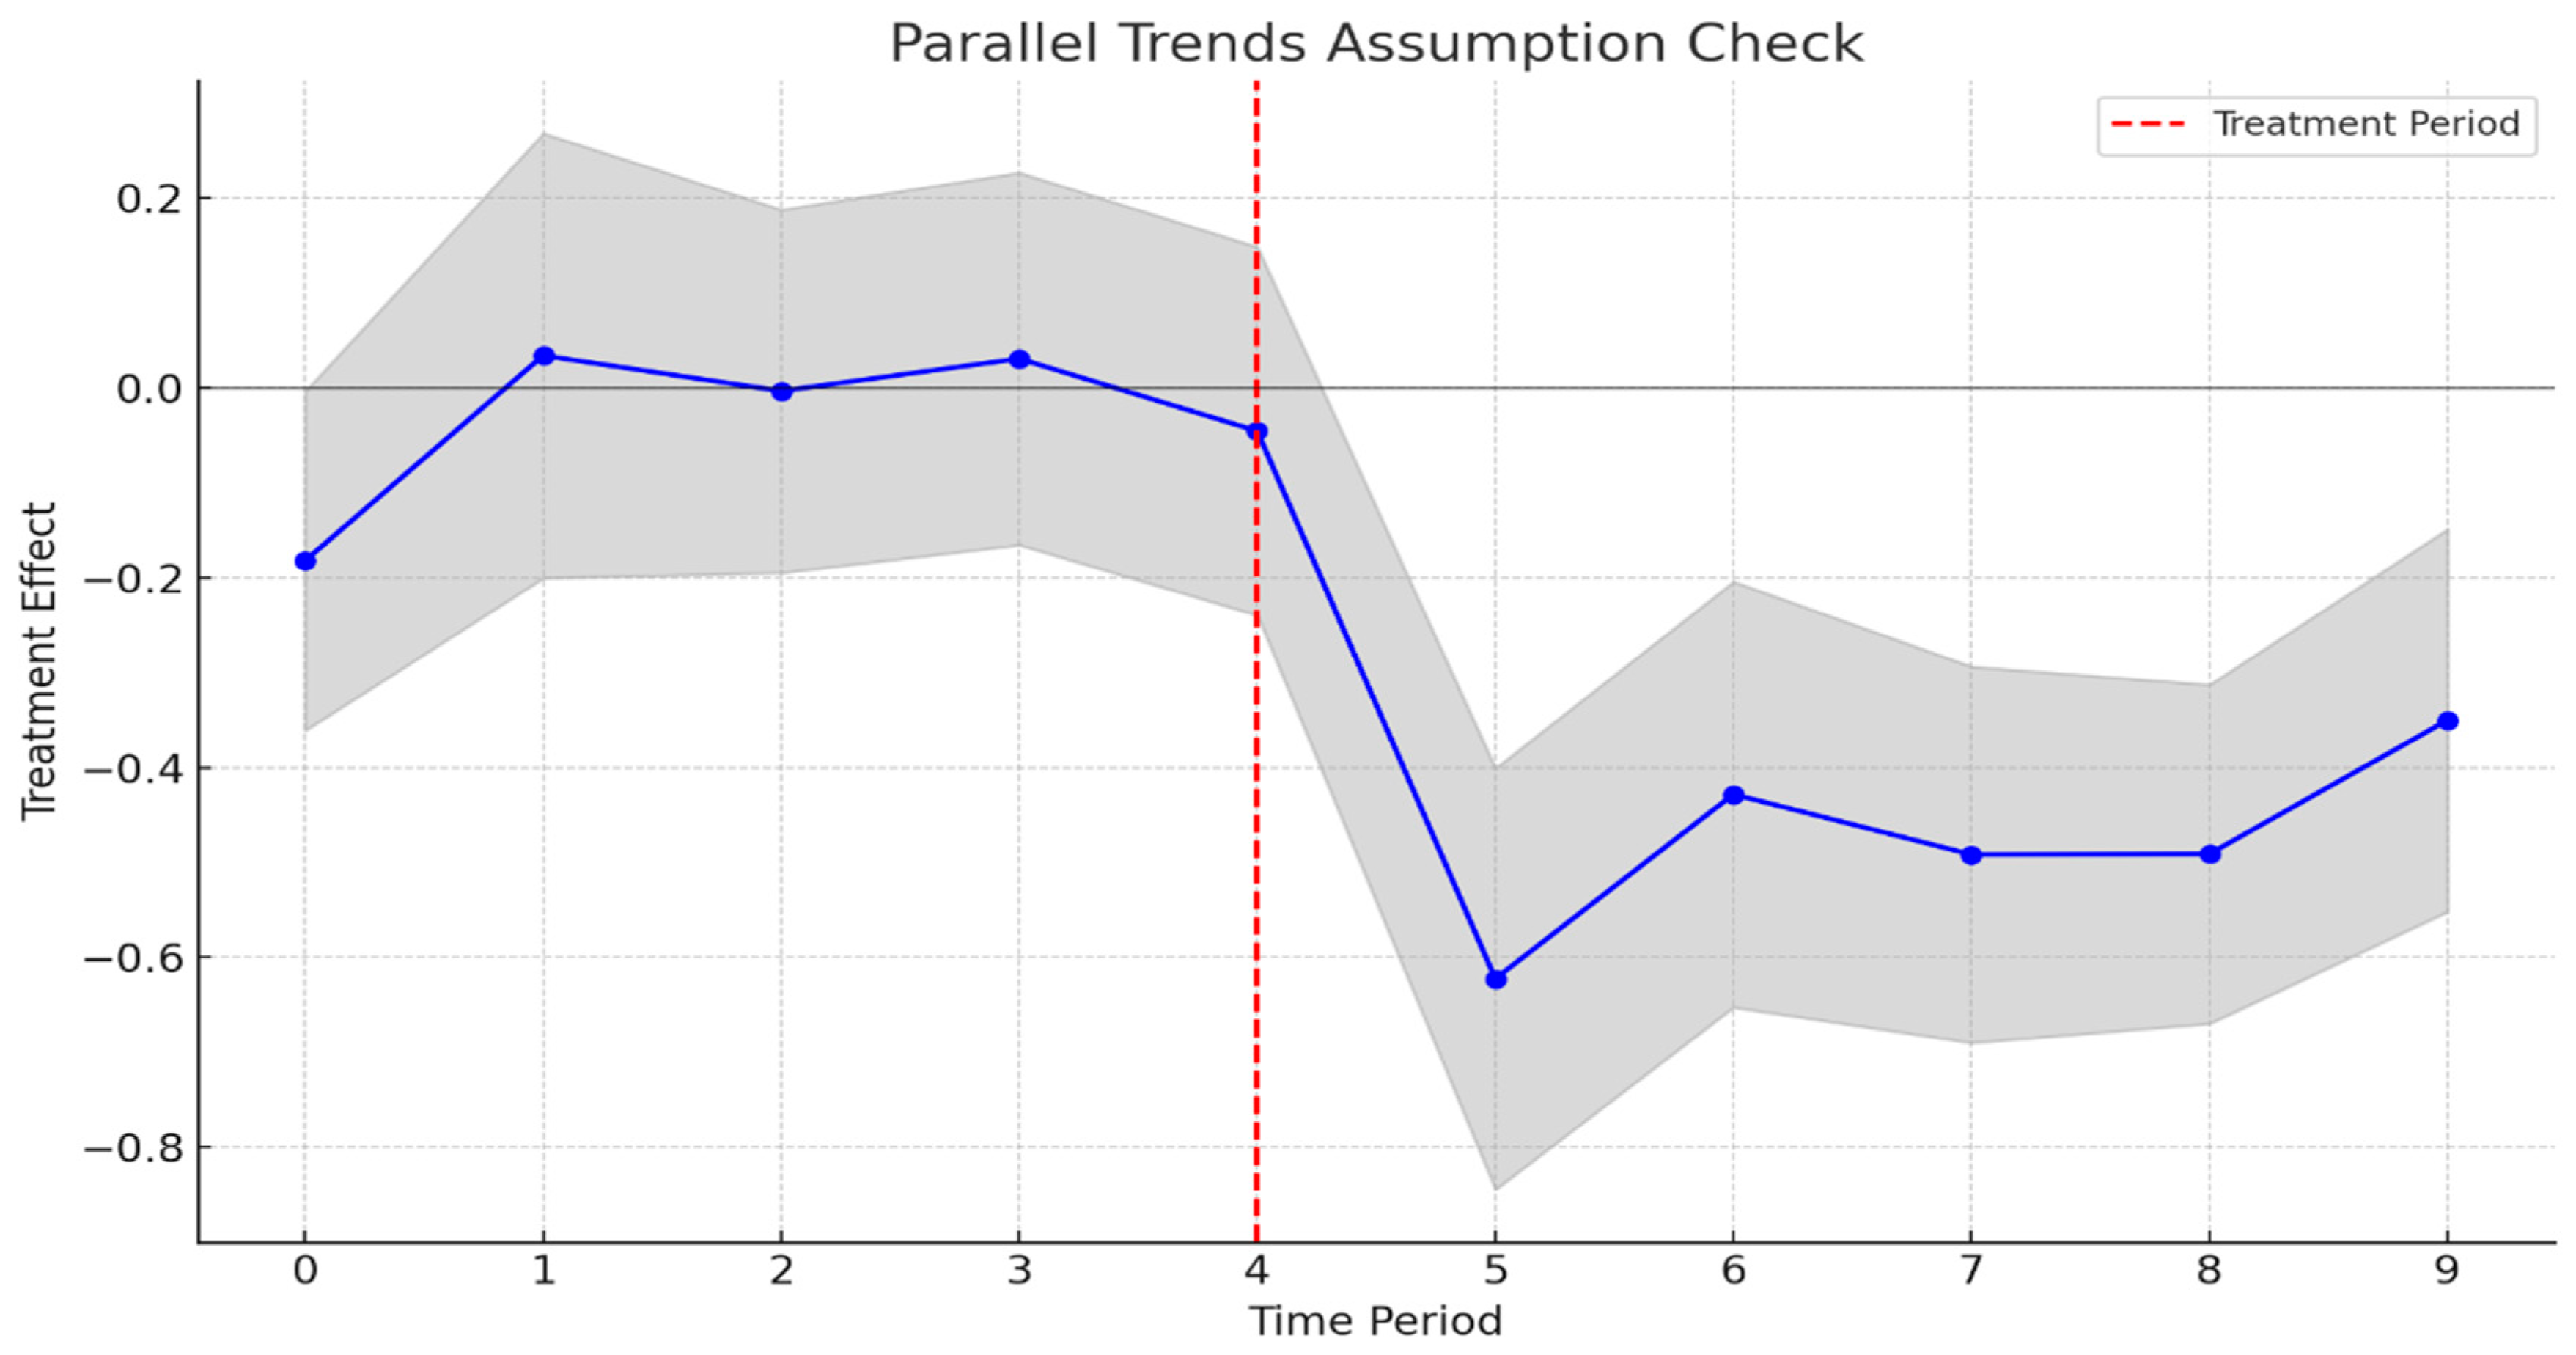
5.2.1. Parallel Trends Assumption
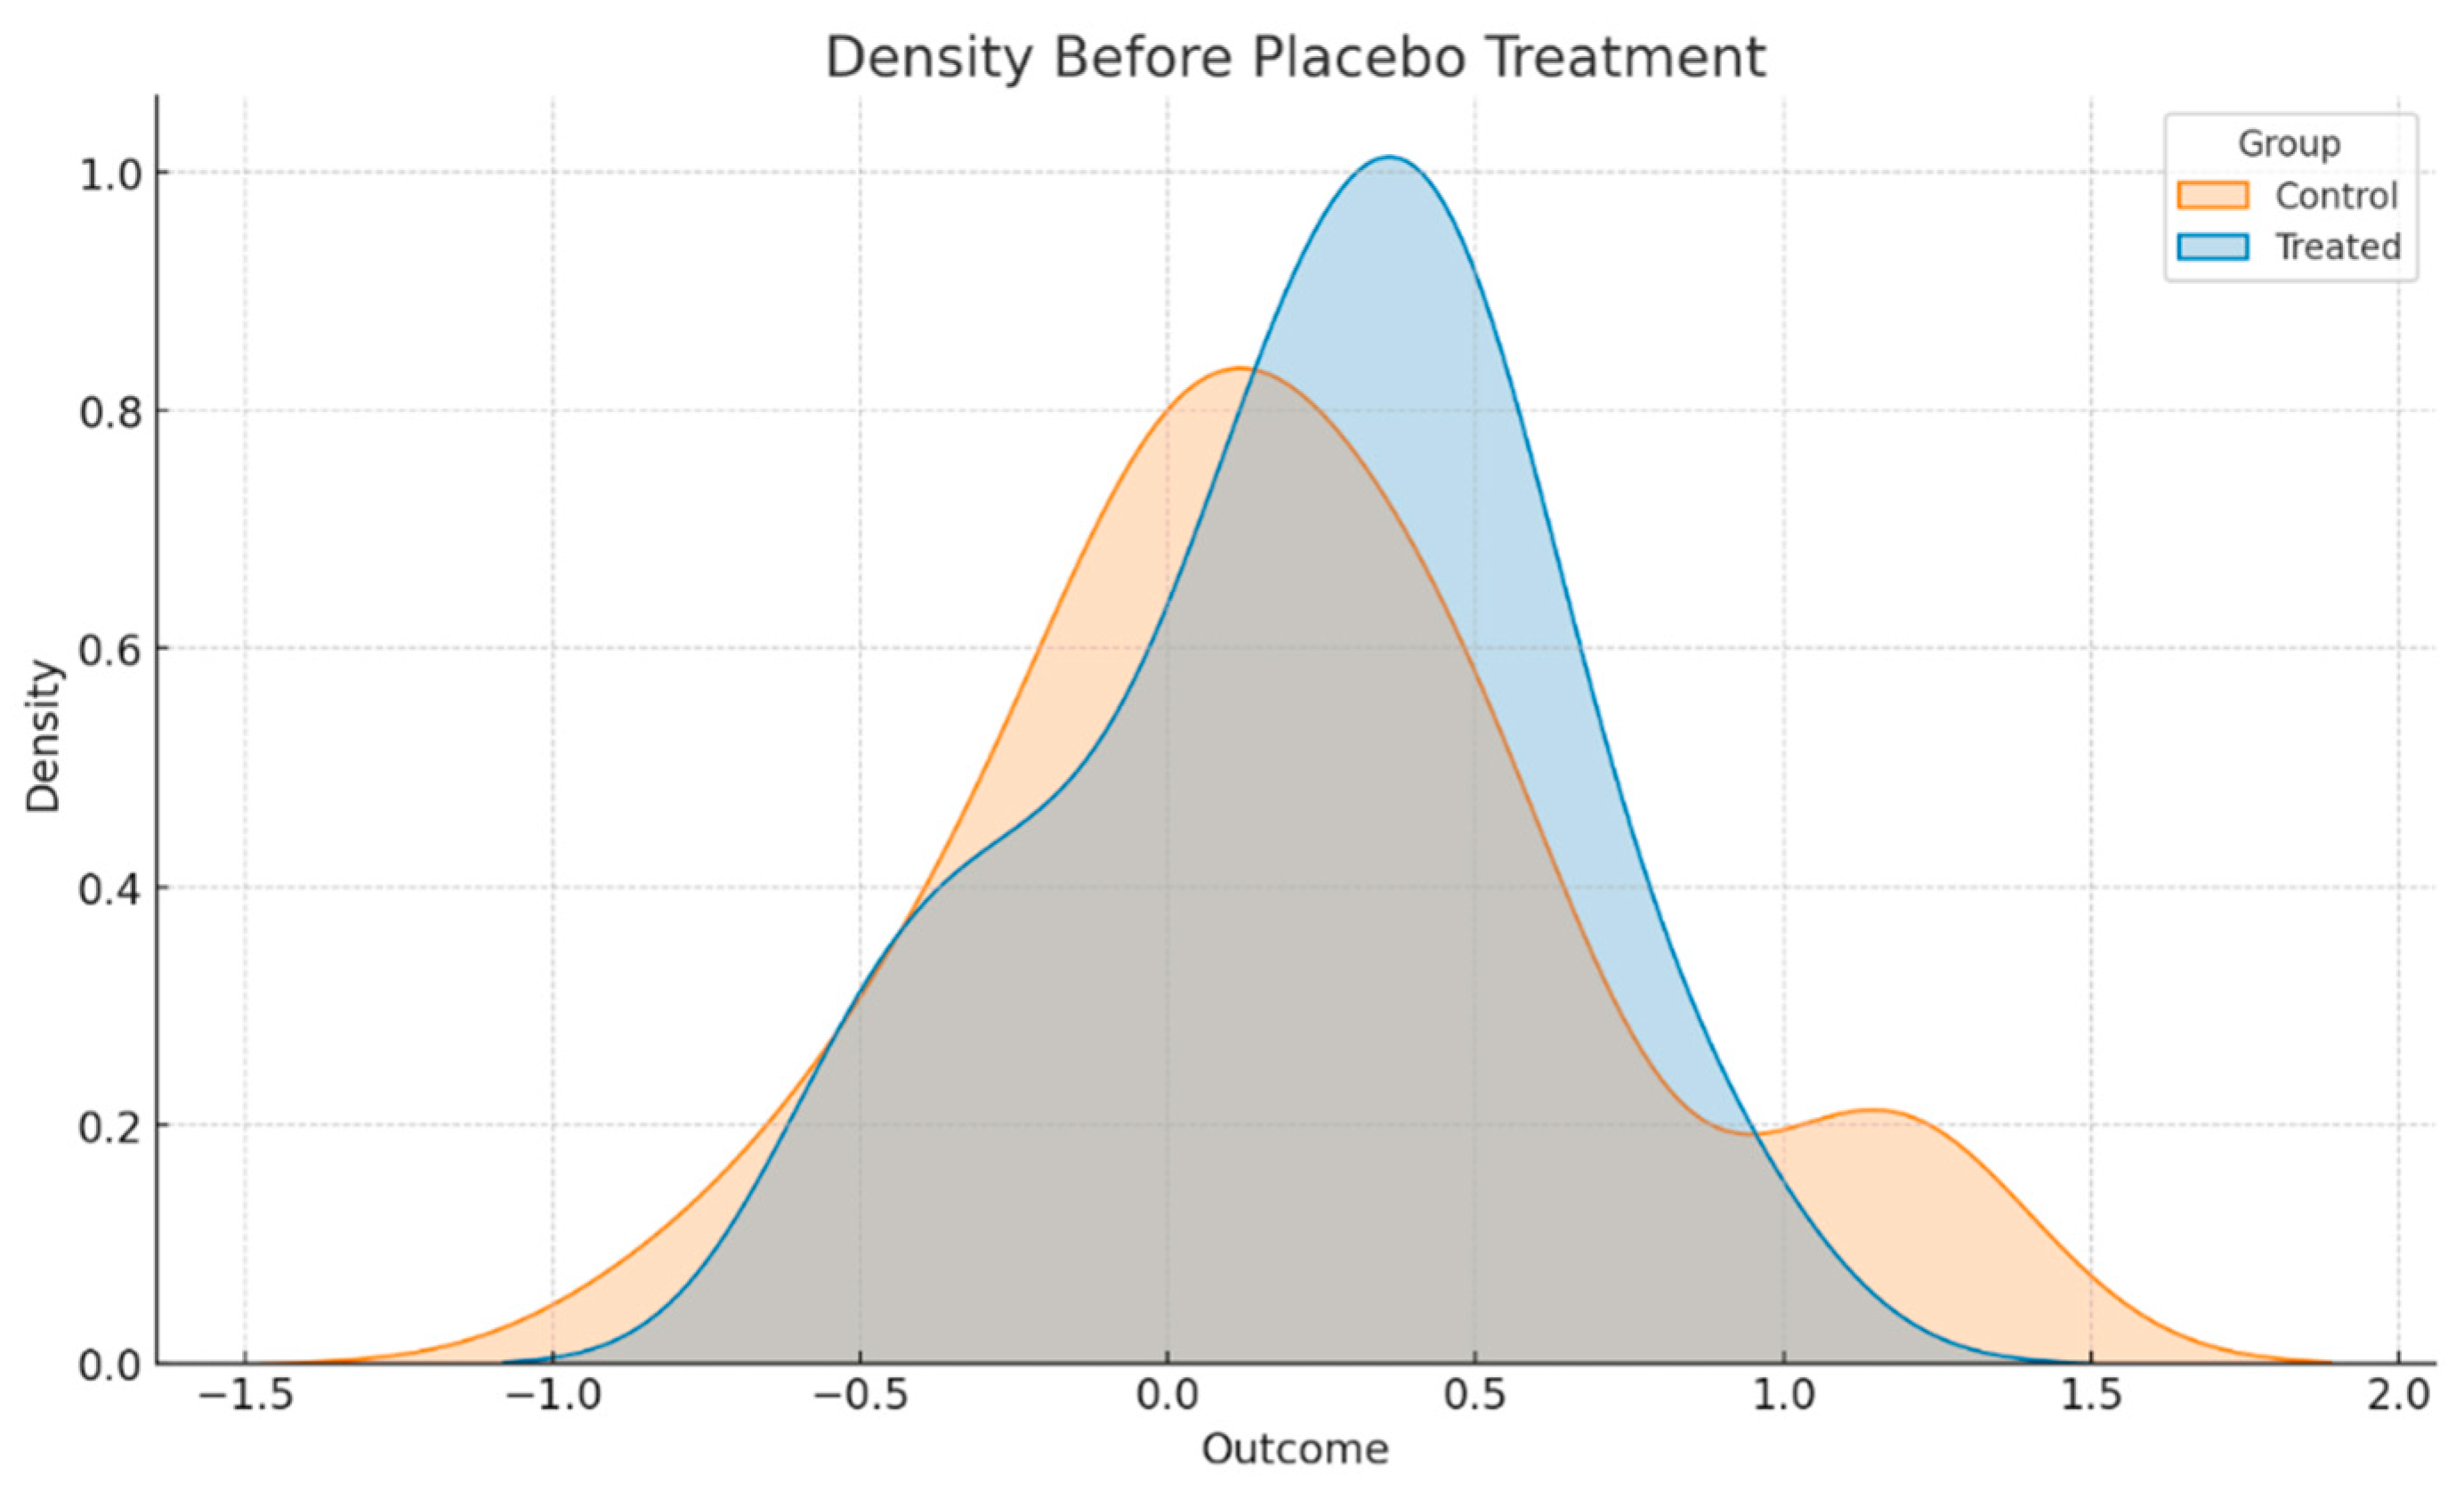
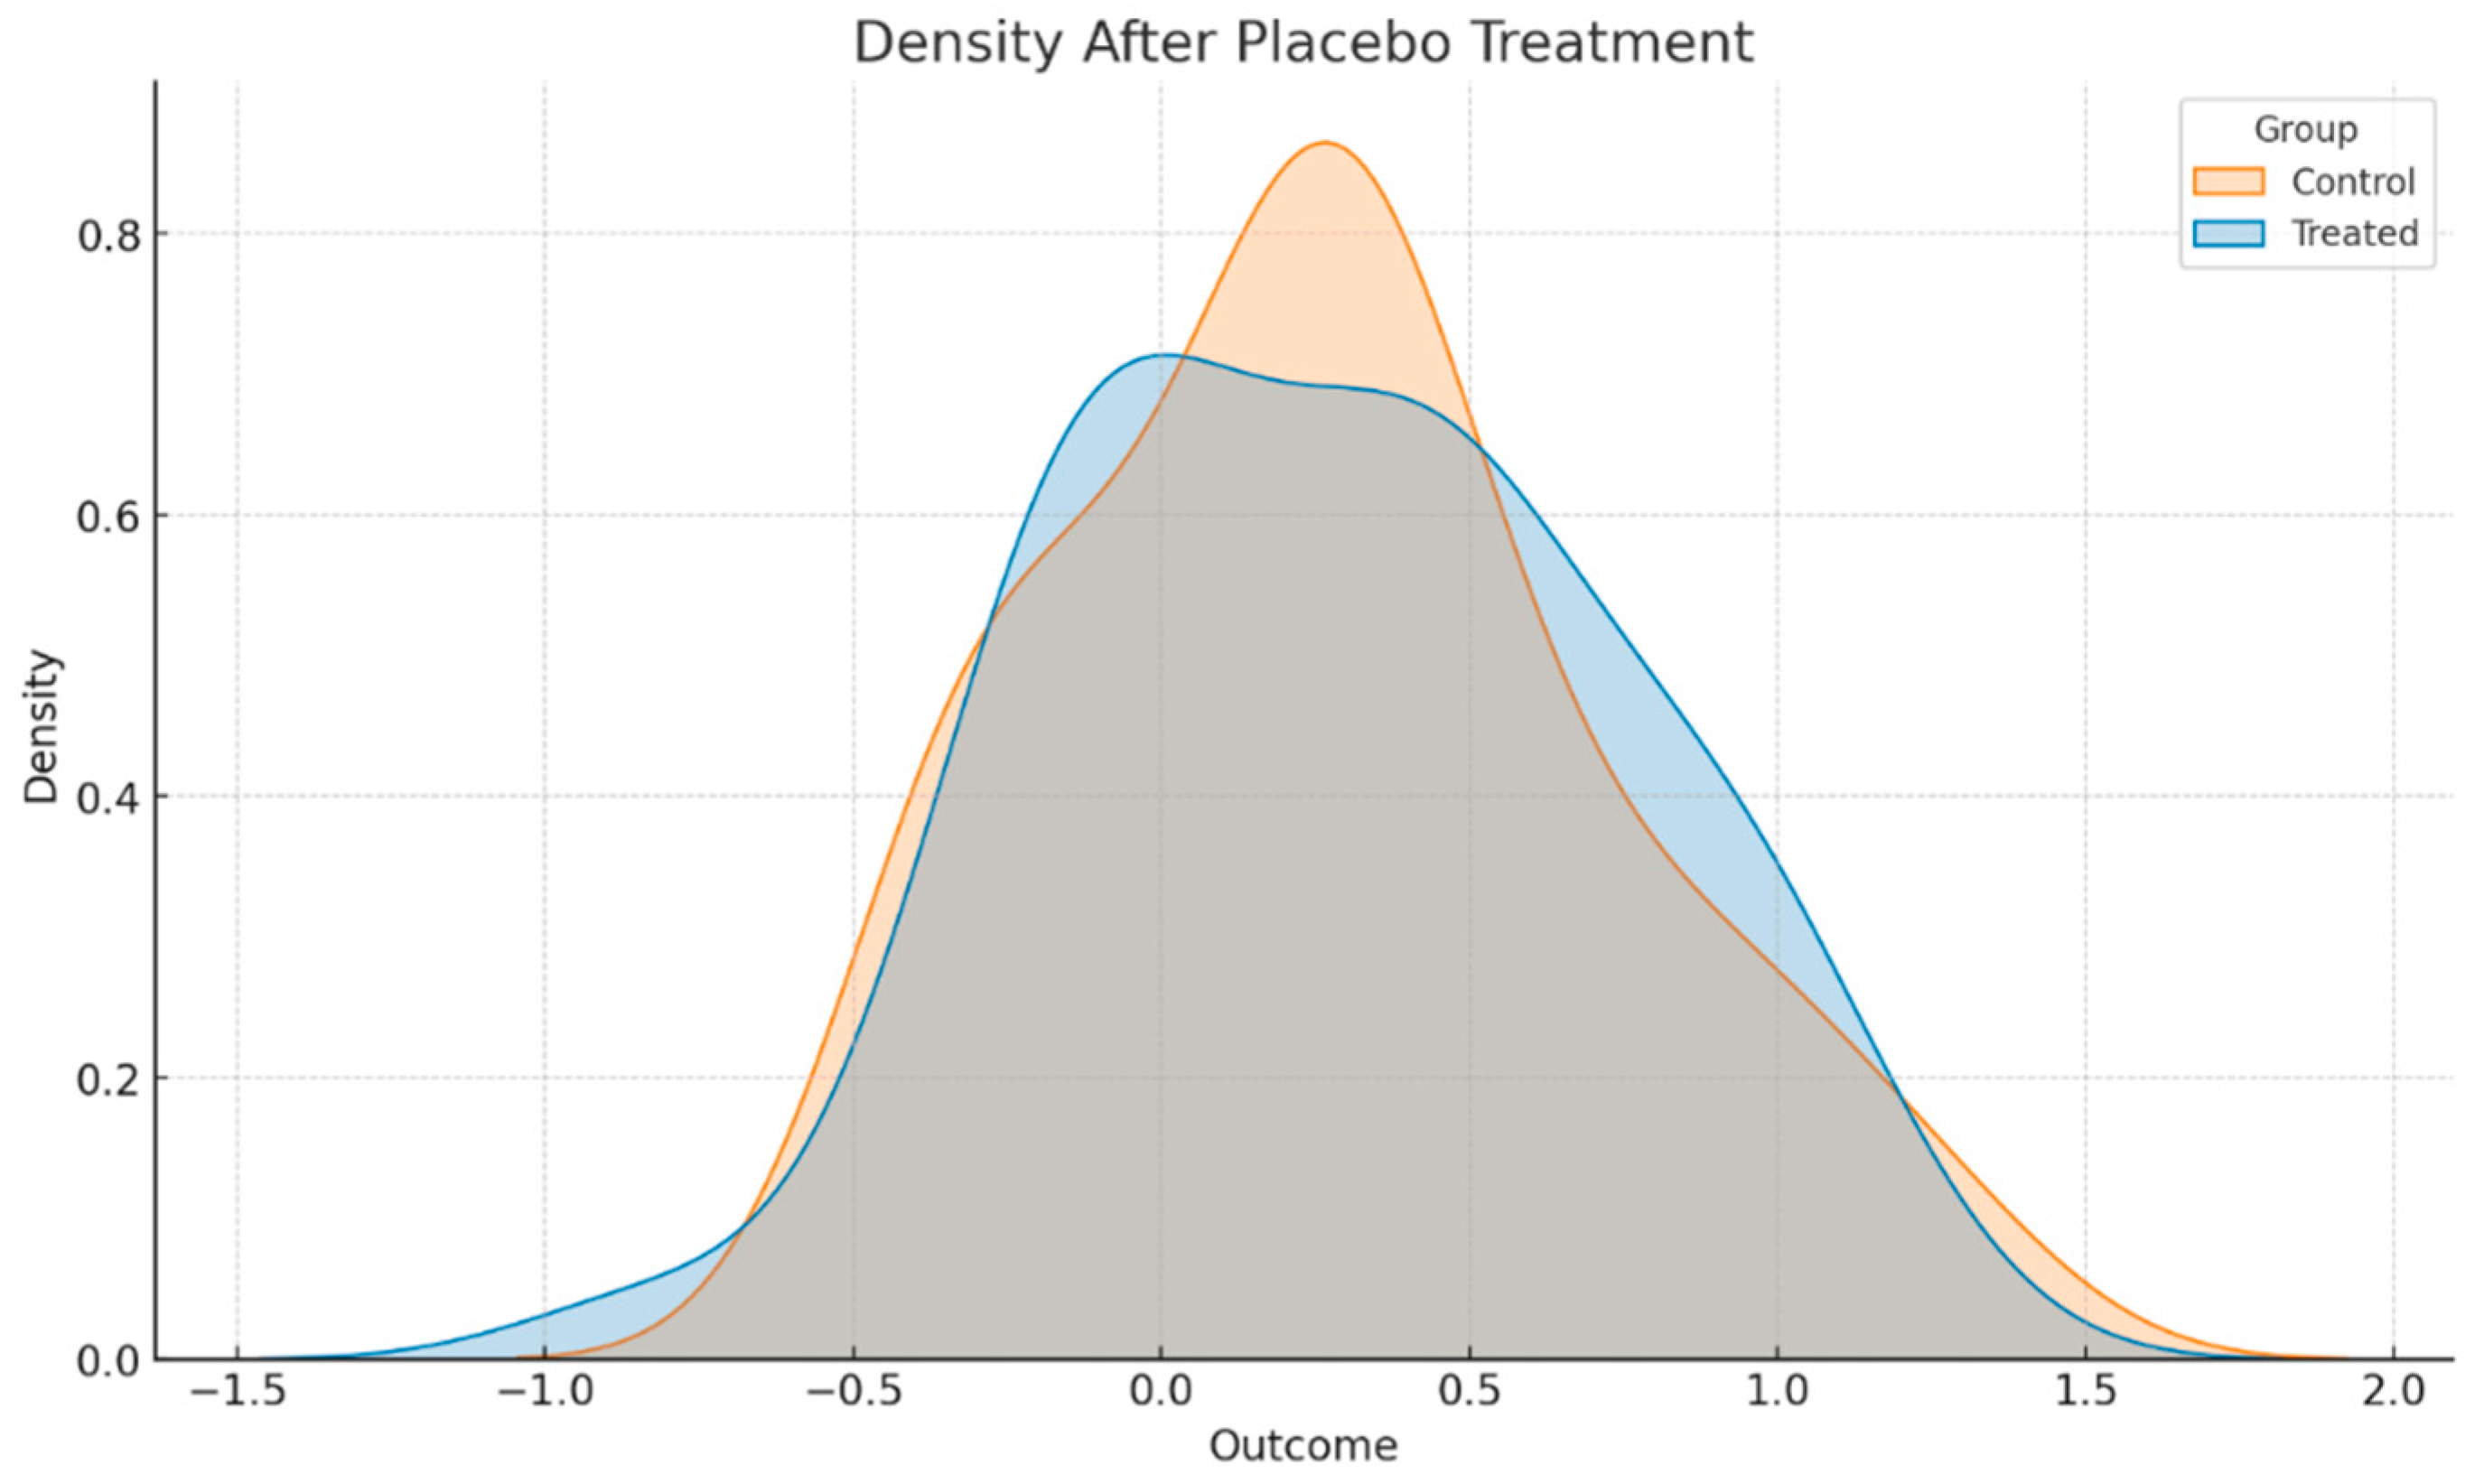
The core of the DID design rests on the parallel trends assumption. Specifically, while the levels of the outcome variable might differ across treated and control groups, their trends in the absence of treatment should be parallel. This ensures that any divergence in trends post-treatment can be causally attributed to the treatment itself and not to pre-existing differences. The results are shown in Figure 3.
To empirically test the parallel trends assumption, we conduct an event-study design. We estimate the following regression:
Y i t = α + k = k 1 β k ( t r e a t e d i p o s t t , k ) + γ t r e a t e d i + δ t + ε i t
Upon estimation, our results indicate that the coefficients for the pre-treatment periods are not statistically different from zero and are close in magnitude. This lends robust support to the parallel trends assumption, bolstering our confidence in the DID estimates’ causal interpretation.
Further, the event-study plot visualizes these findings, showing overlapping confidence intervals around the zero line in the pre-treatment periods, reinforcing the parallel trends’ validity. The affirmation of parallel trends is pivotal. It not only fortifies the reliability of our main findings but also underscores the nuanced interplay between labor market interventions like minimum wage adjustments and environmental outcomes in the Chinese industrial context.

5.2.2. Placebo Test

The essence of the placebo test lies in its counterfactual premise. Specifically, by shifting the treatment date to a period when we know no treatment was applied, we set an empirical trap. If our DID estimates still discern significant treatment effects, it suggests other confounding trends might be at play. The results are shown in Figure 4 and Figure 5.
Mathematically, suppose the true treatment occurred at time T. For our placebo test, we might instead “pretend” the treatment happened at time T-P, where P is a chosen pre-treatment period.
We modify our primary DID regression by shifting the treatment indicator:
Y i t = α + β ( p l a c e b o t r e a t e d i × f a k e p o s t t ) + γ p l a c e b o t r e a t e d i + δ t + ε i t
Upon running the placebo regression, our findings reveal that the β coefficient is not statistically different from zero. This is reassuring. It implies that in periods when we know no treatment was applied, our DID approach does not falsely detect any treatments.
Moreover, iterating this placebo test across various “fake” treatment periods and consistently finding null effects further bolsters the reliability of our primary analysis.

5.2.3. Change the Spatial Matrix

In spatial econometric analyses, the choice of the spatial weight matrix is fundamental, and the durability of results across different matrix specifications remains a critical testament to their credibility. To ensure that our conclusions are not a mere artifact of our initial matrix choice, we subjected our model to an extensive robustness check using several alternative specifications of the spatial weight matrix. The results are shown in Table 3.
We explored various weight matrix configurations, including contiguity-based weights, where proximity is determined by geographical adjacency, and distance-based weights, which assign significance based on inverse distances or other decay functions. Another intriguing matrix we scrutinized was grounded in economic distances, using factors such as trade flows or other discernible economic interconnections to determine spatial relationships.
Consistent with our main model, we observed that adjustments to the minimum wage standard, irrespective of the weight matrix employed, invariably lead to a notable reduction in firm-level emissions of key pollutants, specifically carbon dioxide and sulfur dioxide. This consistency across different weight matrix structures lends a heightened degree of confidence and generalizability to our findings. It resonates with the assertion that the underlying relationship between minimum wage adjustments and firm-level emissions is not superficial but is instead deeply embedded in the data.
In essence, this robustness exercise underscores a vital facet of our research. While our core findings highlighted the relationship between minimum wage standards and emissions, the robustness check reiterates its resilience. Given the unwavering nature of these results, even amidst varied spatial configurations, we can confidently emphasize the profound influence of wage standards on firm-level environmental outcomes in China.

5.2.4. Addressing Endogeneity Concerns: IV Approach

To address the potential endogeneity of the minimum wage variable, we chose the changes in the minimum wage standards of surrounding regions as an instrumental variable (IV). This choice is justified for several reasons.
Firstly, regarding exogeneity, the minimum wage standards of surrounding regions are likely to be exogenous to the individual firm’s emission levels within a given region, as these standards are determined by regional policies that are not directly influenced by the firm’s emissions. Secondly, concerning relevance, the economic conditions and policy decisions in neighboring regions can affect local labor markets and wage-setting behavior, making the surrounding regions’ minimum wage changes a relevant predictor of the local minimum wage.
To ensure the validity of our instrumental variable, we performed several tests. The Hausman test compares the IV estimates to the ordinary least squares (OLS) estimates to check for endogeneity. A significant test statistic (864.32 ***) suggests that the OLS estimates are biased and that the IV approach is necessary. The Durbin–Wu–Hausman (DWH) test further confirms endogeneity by comparing the fitted values from the first stage of the IV regression with the original regressor. A significant test statistic (69.57 ***) supports the use of IV. Lastly, the weak instrument test evaluates the strength of the instrument. A significant test statistic (83.82 ***) indicates that the instrument is strongly correlated with the endogenous regressor, ensuring the reliability of the IV estimates (Table 4).
In the second stage of our analysis, we examine the impact of minimum wage adjustments on CO2 emissions using the instrumental variable approach. The results, as presented in Table 5, indicate that minimum wage adjustments have a statistically significant negative effect on CO2 emissions. Specifically, the coefficient for the minimum wage variable is −0.267 *** in the first phase and −0.268 *** in the second phase, both significant at the 1% level. This suggests that higher minimum wage standards lead to a reduction in emissions, supporting the hypothesis that firms respond to increased labor costs by adopting cleaner technologies and improving operational efficiencies. The DID estimates further corroborate these findings, with coefficients of −0.195 ** and −0.243 *** for CO2 emissions in phases one and two, respectively. The inclusion of city and firm fixed effects, as well as year fixed effects, ensures the robustness of these results, indicating a consistent and significant relationship between minimum wage adjustments and environmental outcomes across different specifications.

5.3. Heterogeneity Analysis

In the vast terrain of economics, recognizing that effects are not uniformly distributed across observations is paramount. In the context of our study on the implications of minimum wage standards on pollution emissions, this becomes particularly pertinent. A deeper dive into the heterogeneity of our findings can yield insights into the nuances and conditionalities associated with our main results.

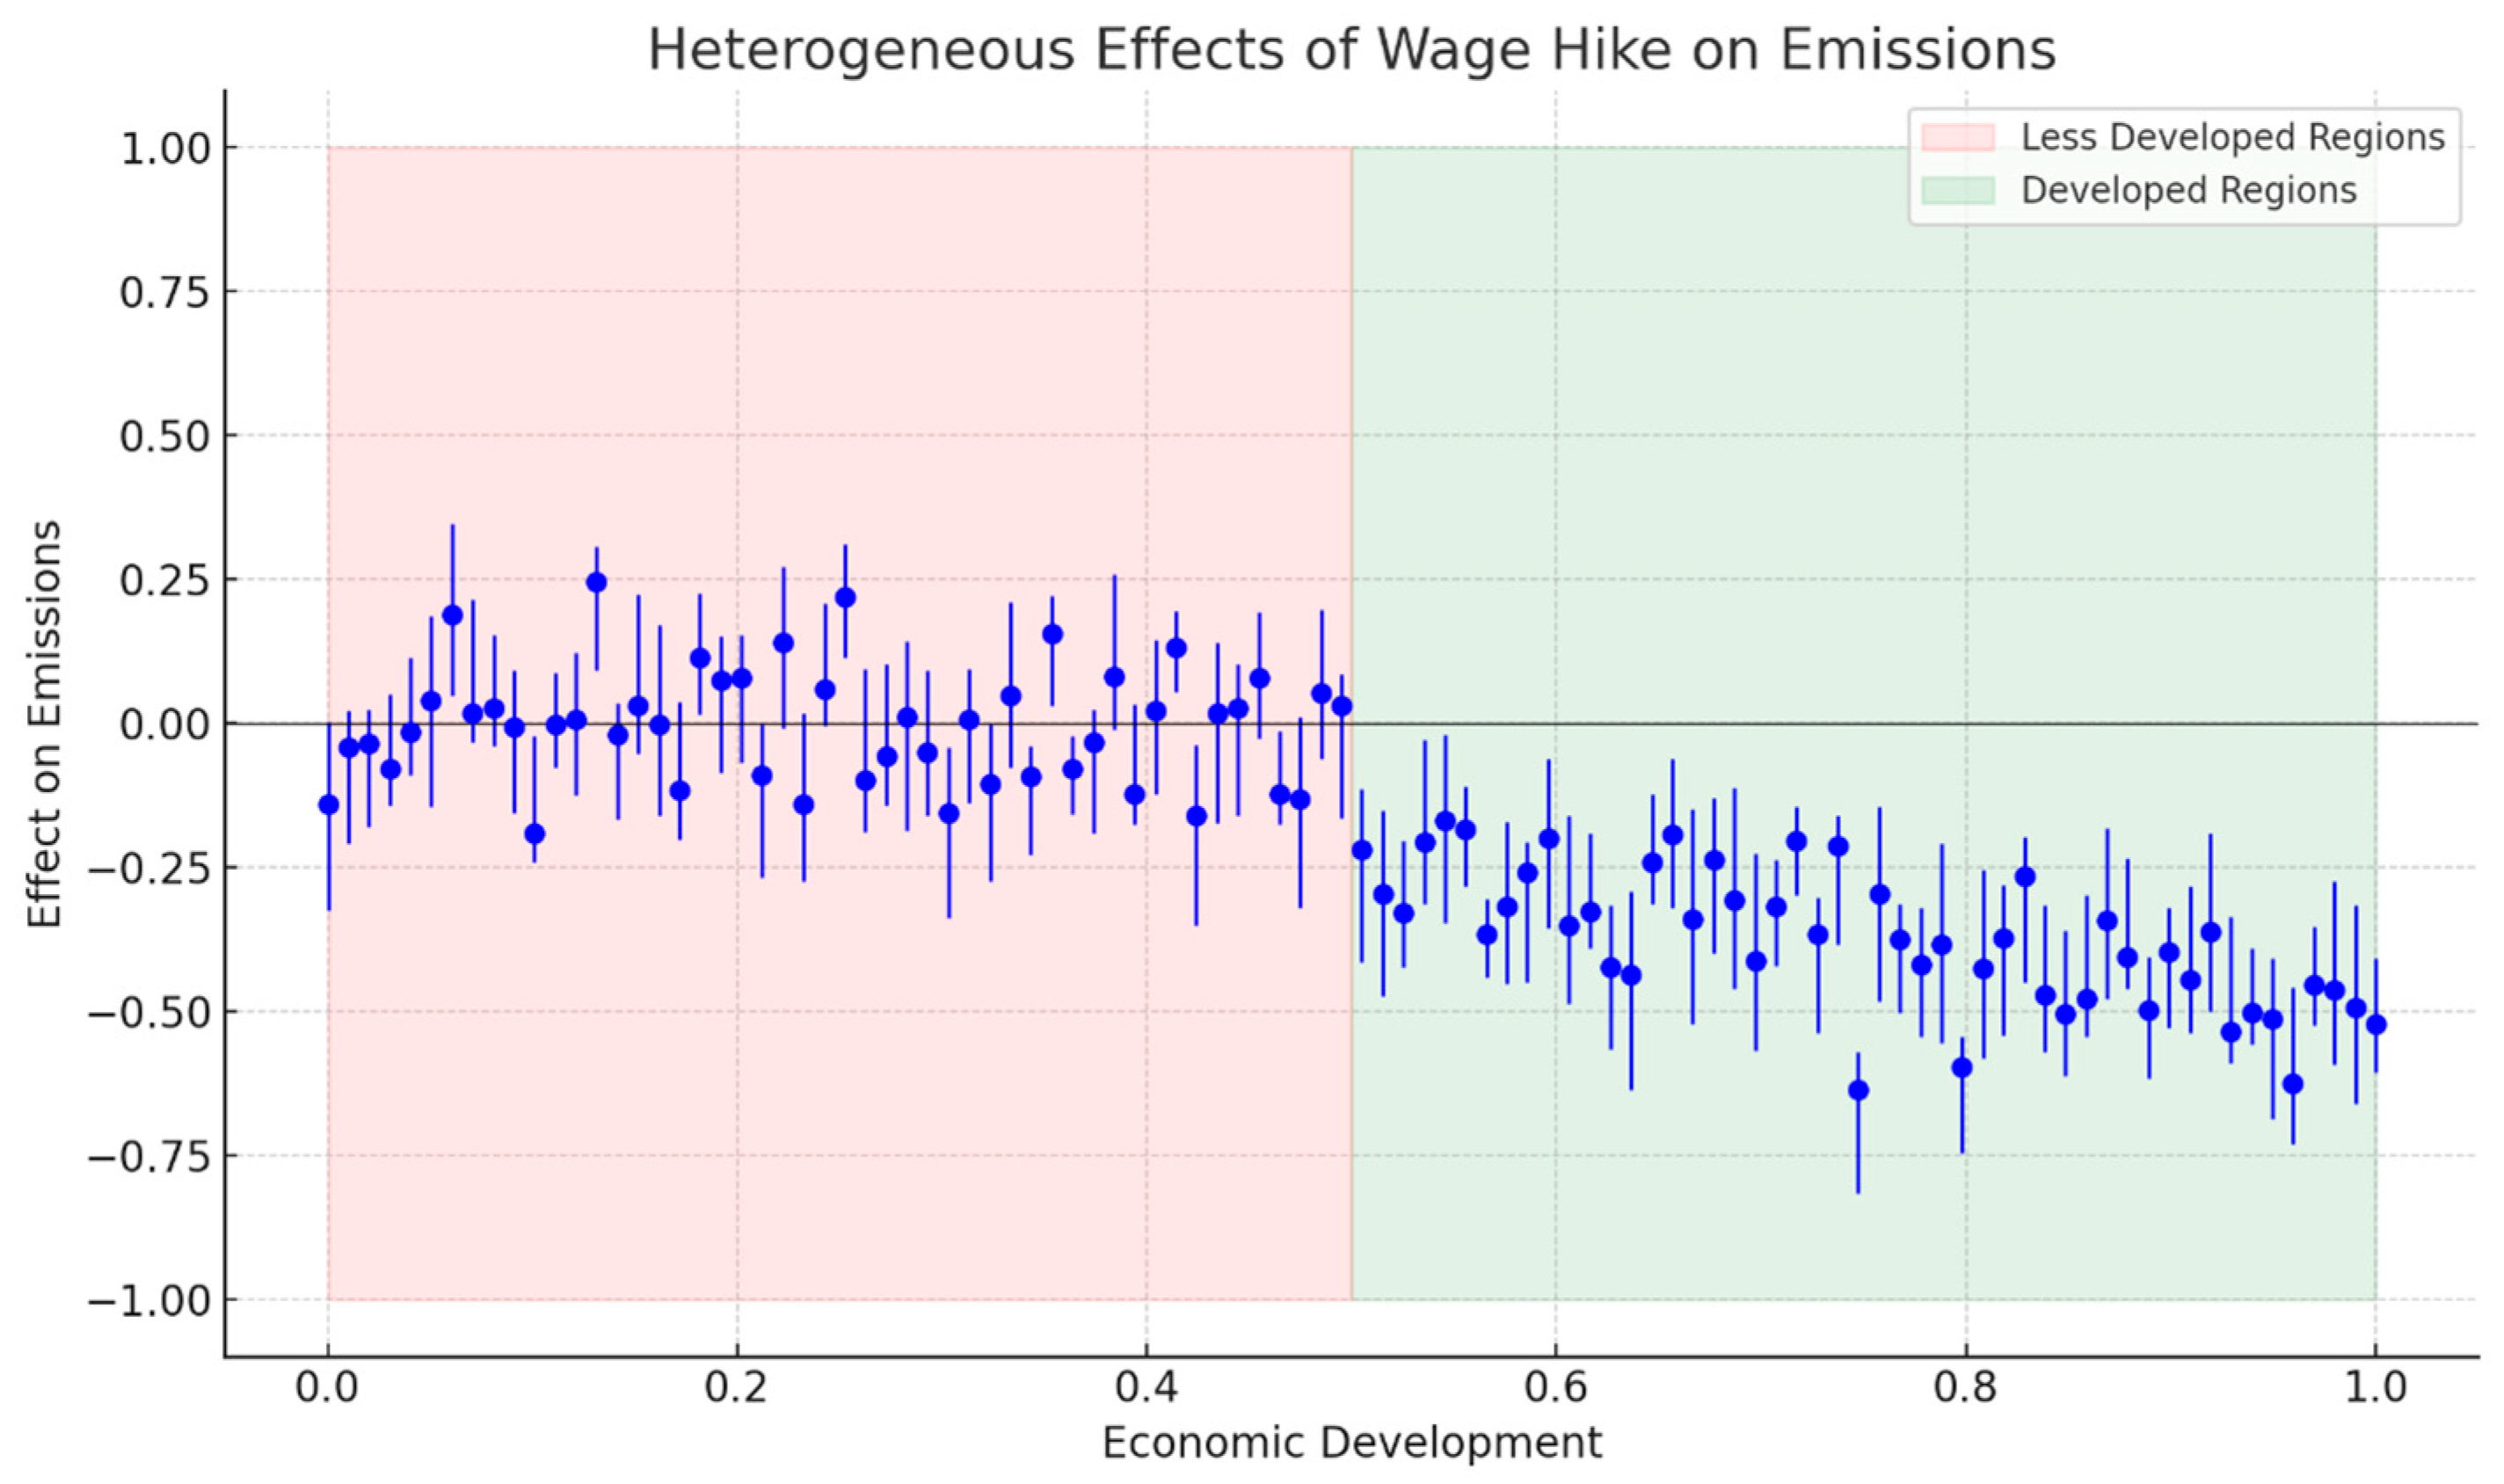
5.3.1. Level of Economic Development

At the intersection of regional economic development and environmental economics lies a significant conundrum: how does the level of economic sophistication influence the reaction of industries to changes in wage standards, especially concerning pollution emissions? The results are shown in Figure 6.
In advanced economic territories, industries tend to be more capital-intensive, leaning on automation technology and often on cleaner energy sources. These regions have a legacy of transitioning from traditional pollution-intensive industries to more sustainable models. A hike in the minimum wage in this context acts as an accelerator rather than a disruptor. Firms already poised on the cusp of innovation might perceive these wage hikes as catalysts to further streamline operations, often leading to decreased emissions. For instance, in the coastal regions of China like Guangdong and Shanghai, higher economic development levels and stricter environmental regulations facilitate a smoother transition to greener technologies in response to wage hikes.
On the contrary, in less economically developed regions, industries are often still in their transitional phase, predominantly labor-intensive and heavily reliant on traditional, often polluting means of production. Wage hikes here pose more than just a financial challenge; they disrupt an already fragile ecosystem. Instead of technological advancement, firms might resort to cost-cutting elsewhere, potentially compromising on environmental safeguards leading to ambiguous effects on emissions. For example, in inland provinces such as Guizhou and Gansu, limited access to advanced technologies and capital means that firms are less able to offset increased labor costs with efficiency improvements, potentially exacerbating pollution levels.

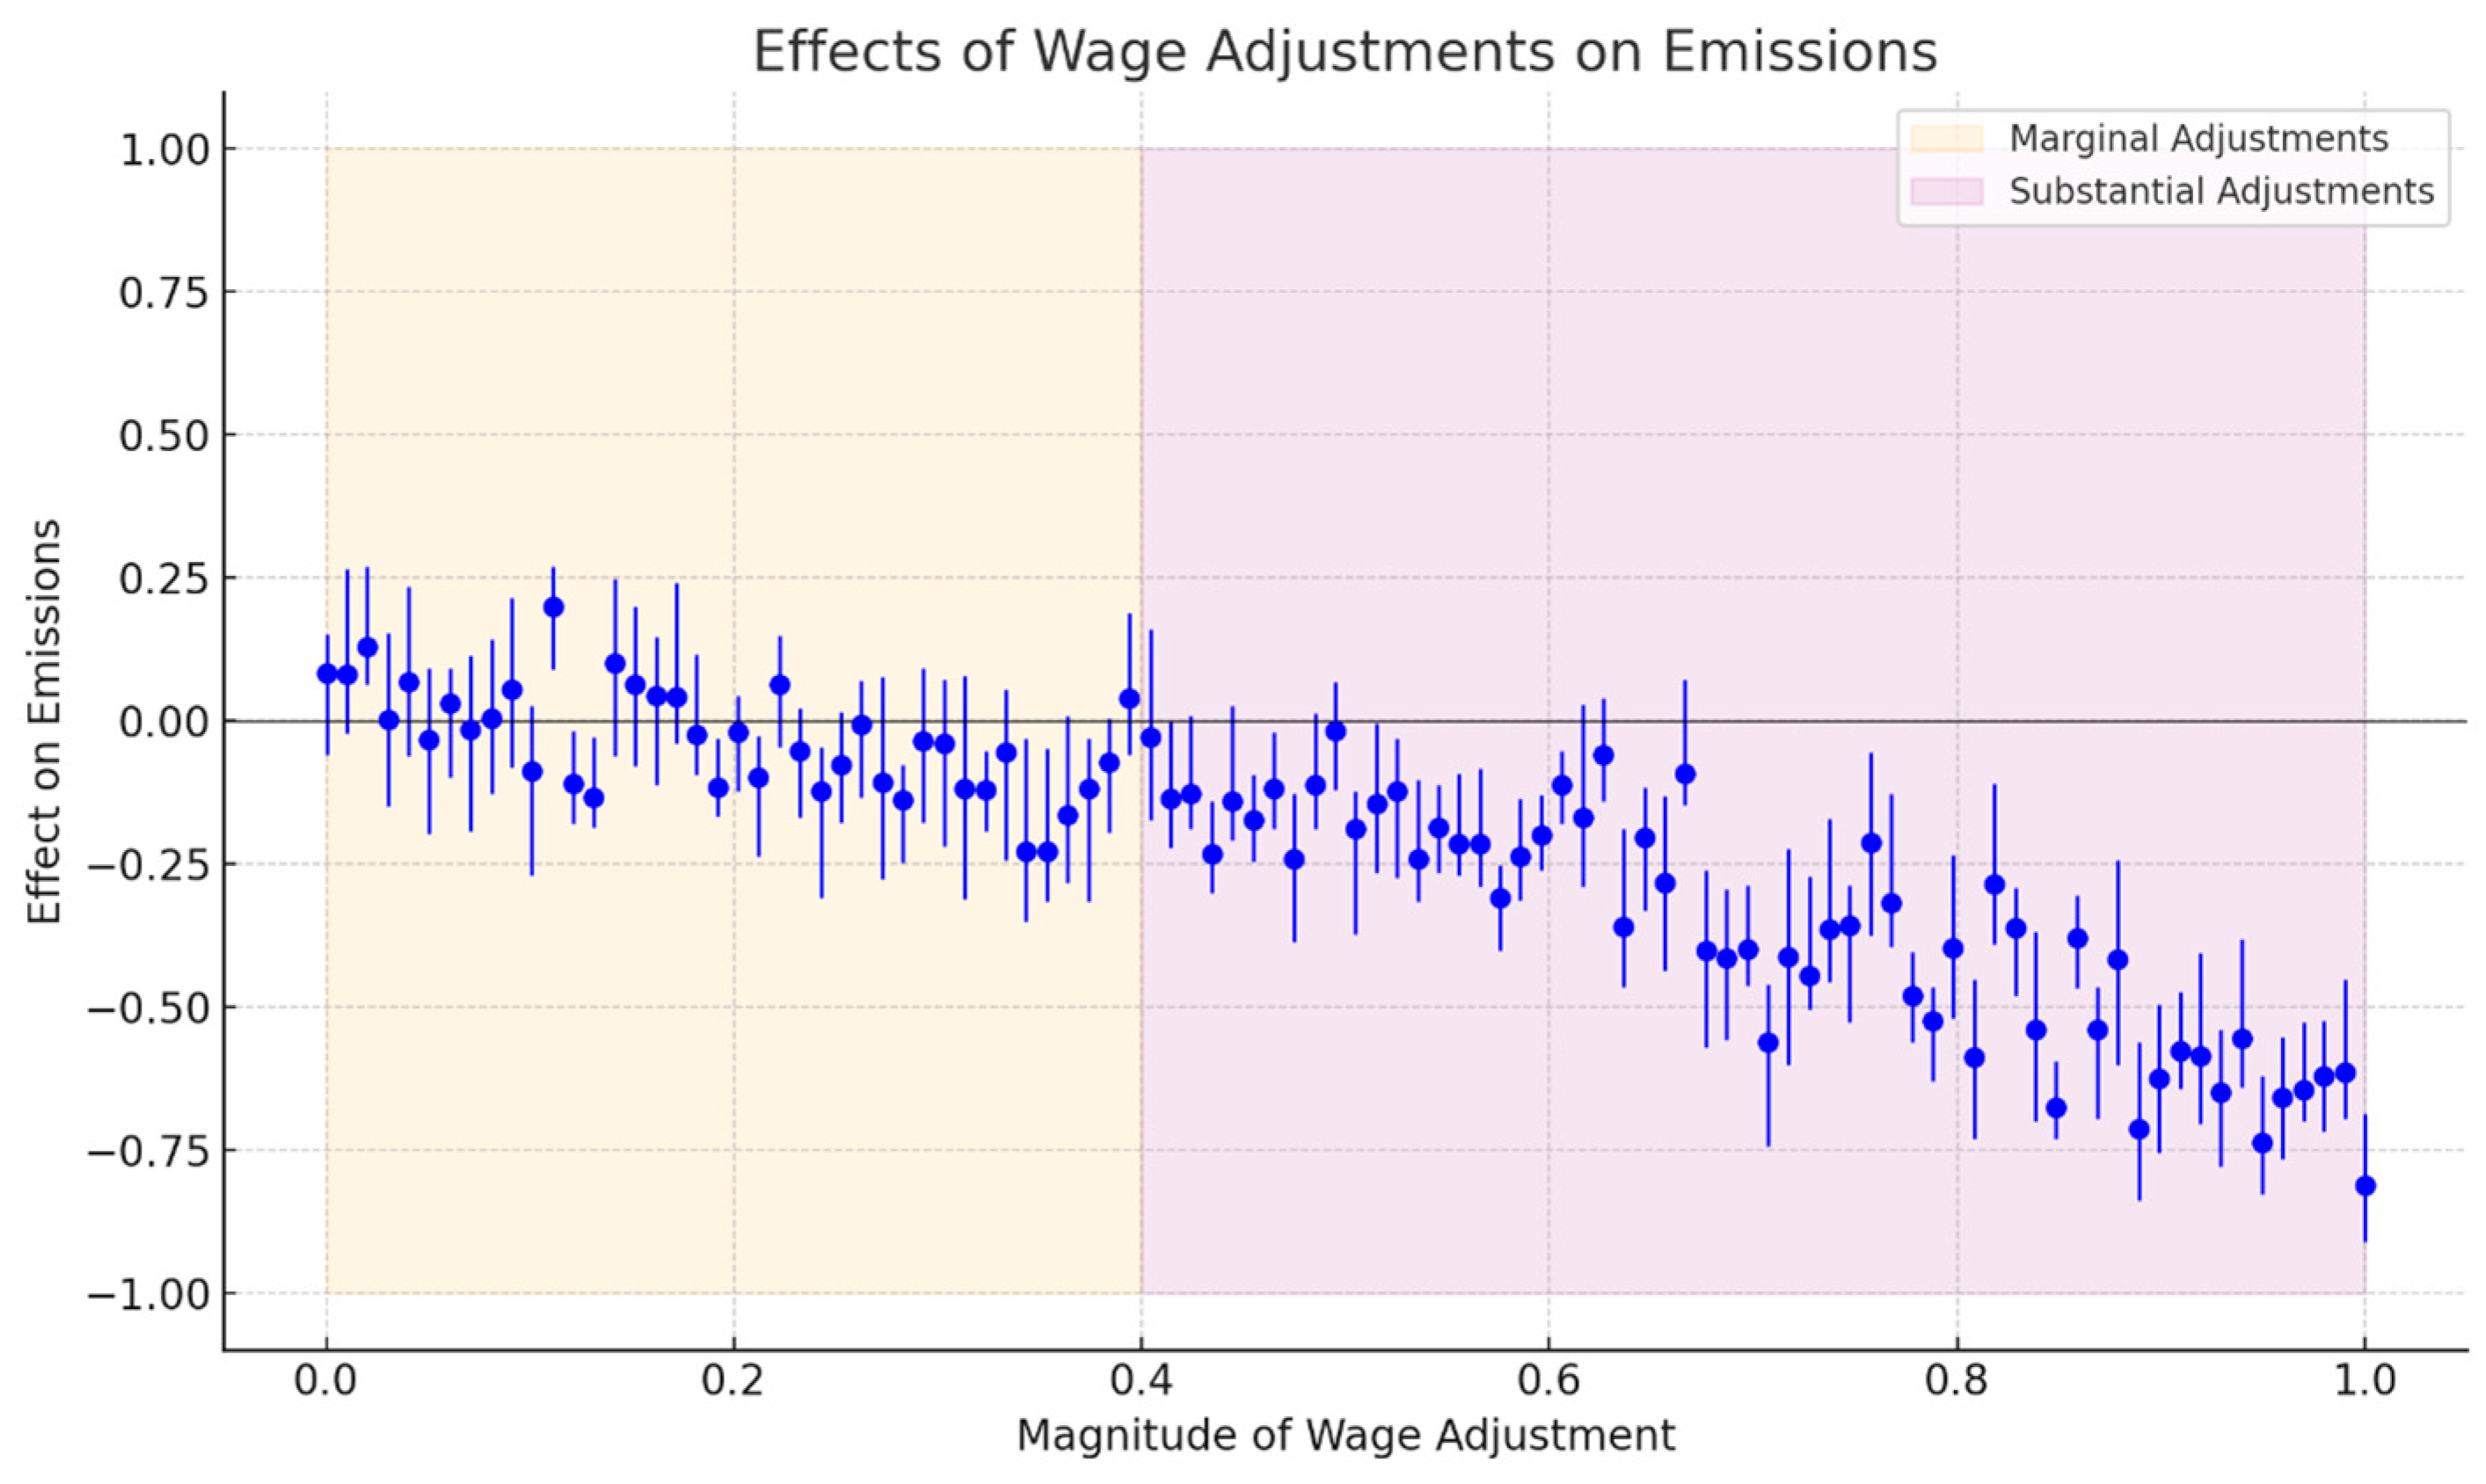
5.3.2. Magnitude of Minimum Wage Adjustment

Economic theory often posits that the intensity of a policy’s effects is proportional to its magnitude. The realm of minimum wage adjustments is no exception. Marginal adjustments in wage standards might lead to equally marginal operational shifts within firms, with muted impacts on pollution emissions. Firms can absorb these minor hikes without major operational overhauls, making their effect on emissions inconspicuous. The results are shown in Figure 7.
However, more substantial wage adjustments are a different ball game. They can stress a firm’s financial balance, urging them to rethink operational strategies. This could entail a shift towards more efficient, less polluting production methods, or even a more significant transition towards cleaner technological inputs. The nexus between substantial wage adjustments and emission reductions then becomes an empirical question intrinsically tied to a firm’s adaptive capacities.

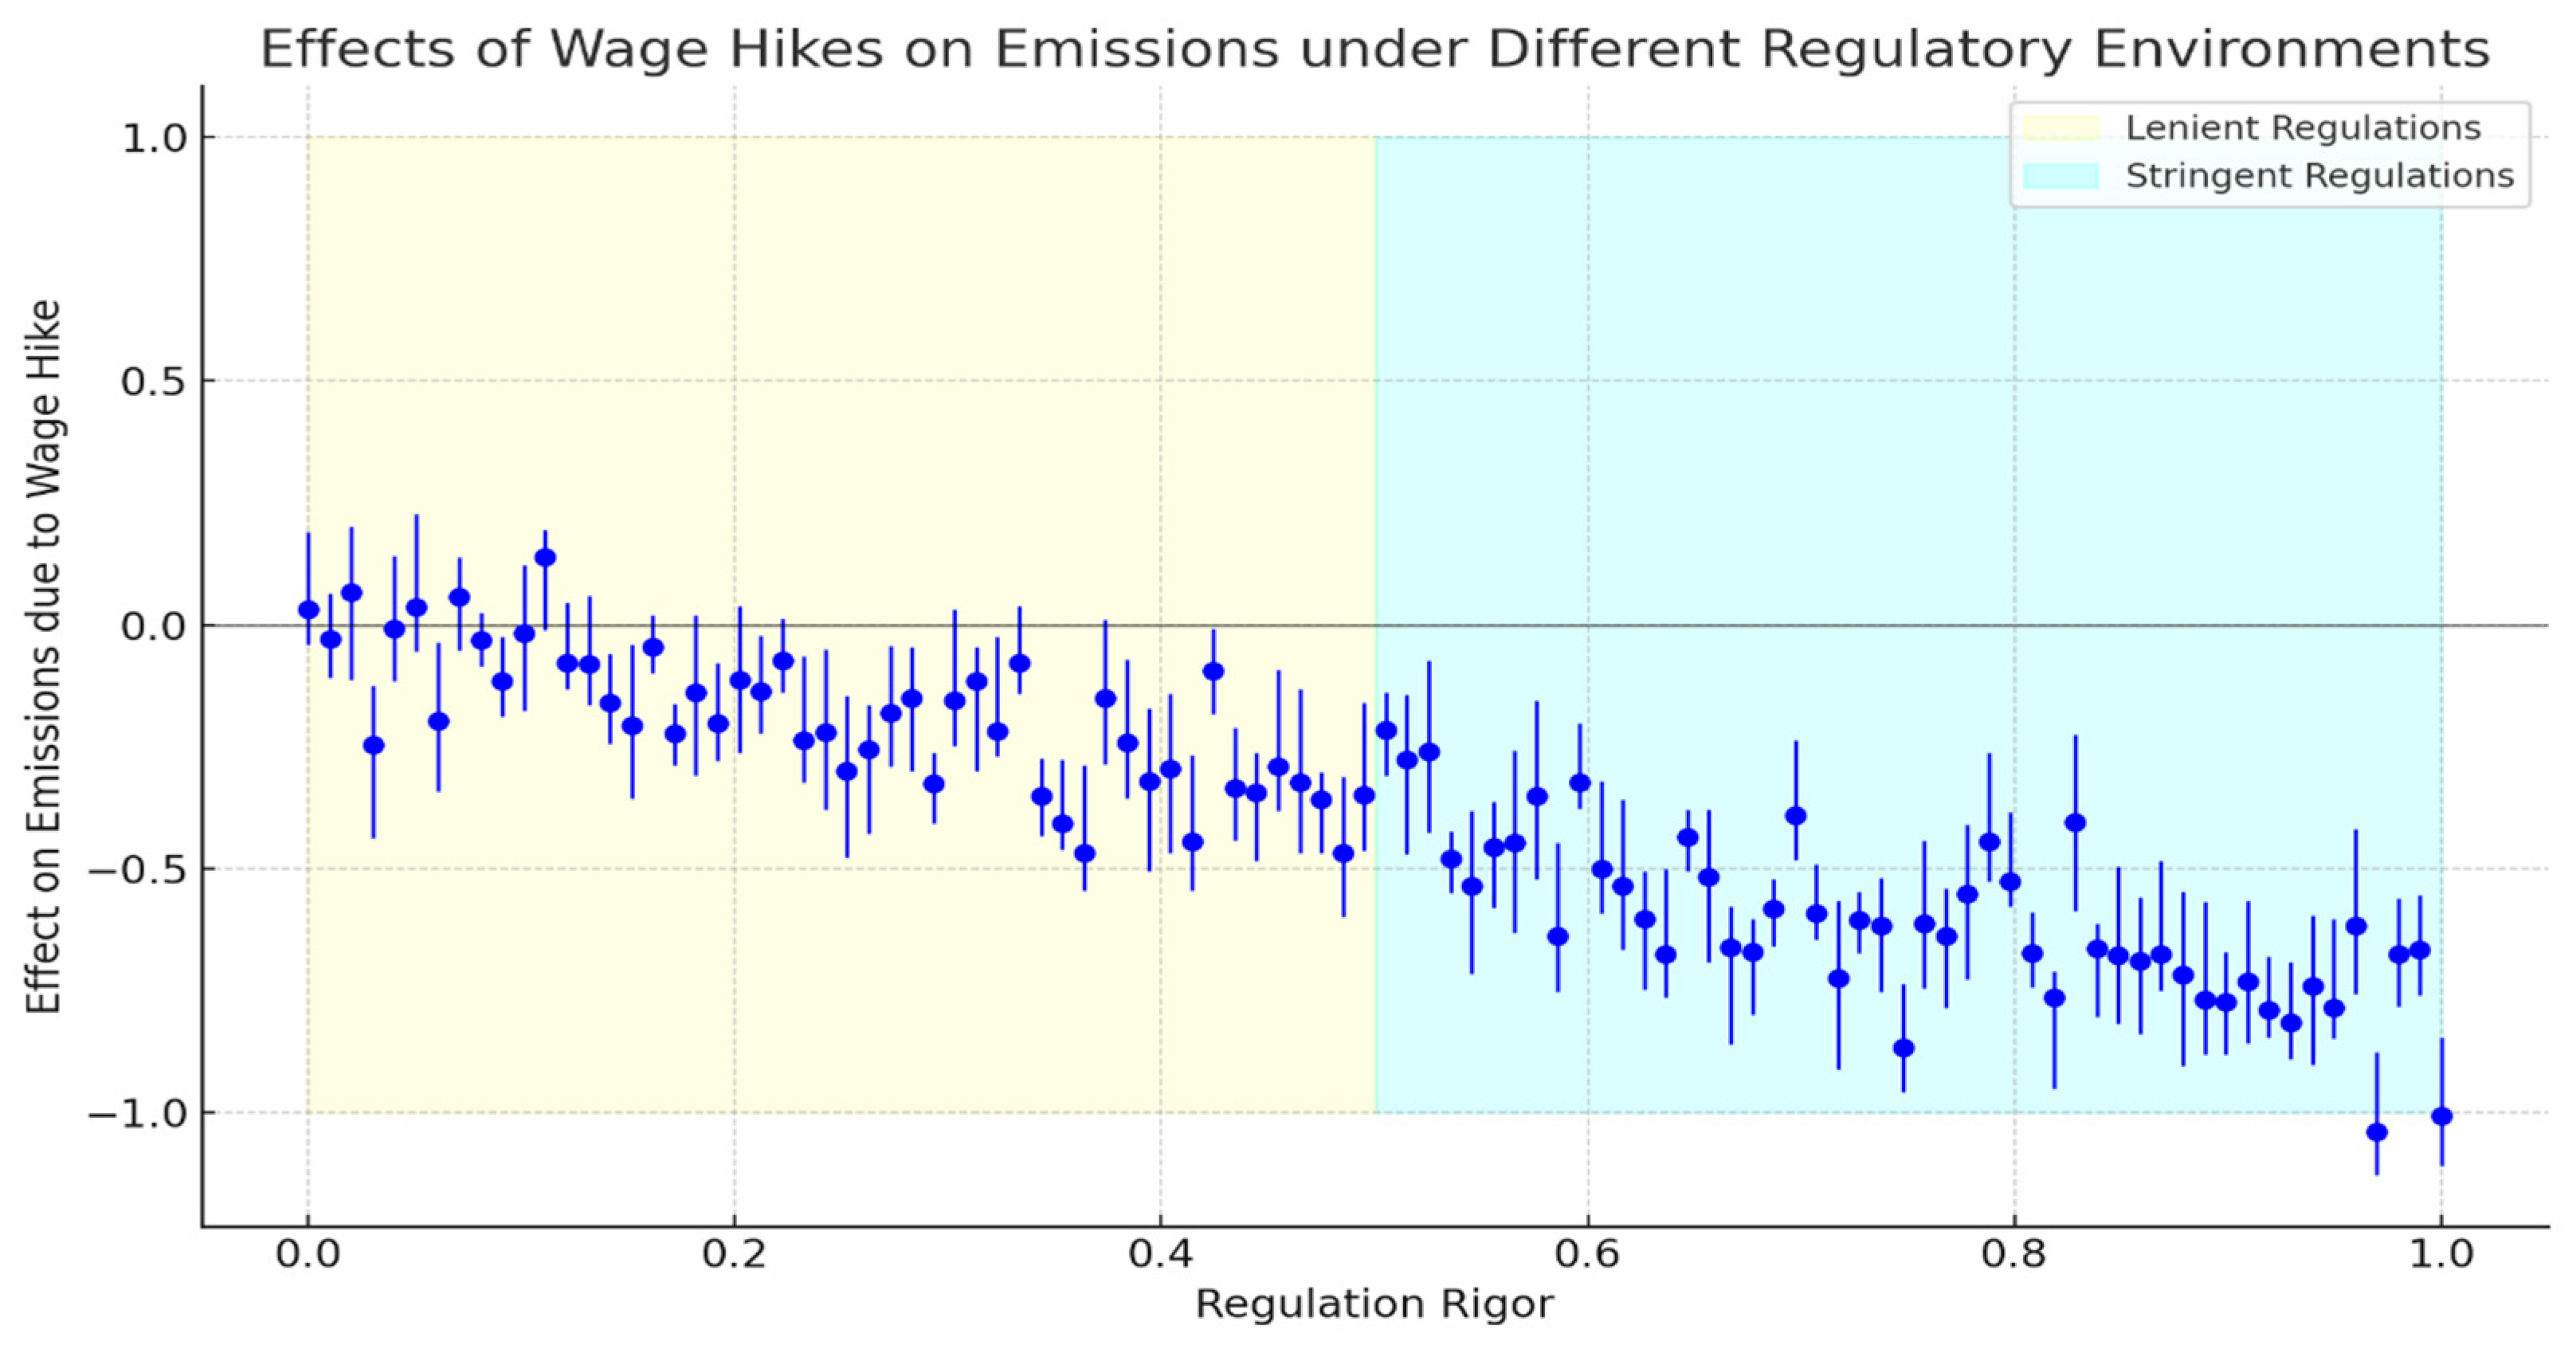
5.3.3. Stringency of Environmental Regulations

Environmental regulations and wage adjustments at first glance appear as two disparate threads of the economic fabric. But their intertwining effects on pollution emissions cannot be understated. In jurisdictions where environmental regulations are stringent, firms operate within tight constraints, always under the regulatory scanner. Here, any external financial perturbation like a wage hike amplifies their motivation to be more efficient. They might lean towards technological innovations that optimize productivity, inadvertently leading to reduced emissions. The results are shown in Figure 8.
Conversely, in areas with a more lenient regulatory environment, wage hikes might not necessarily translate to reduced emissions. Firms unrestrained by stringent environmental checks might find other avenues to balance out wage-induced cost escalations without necessarily resorting to cleaner production methods. The symbiosis between wage adjustments and environmental regulations then offers a nuanced tapestry of outcomes contingent upon the regulatory rigor of a region.

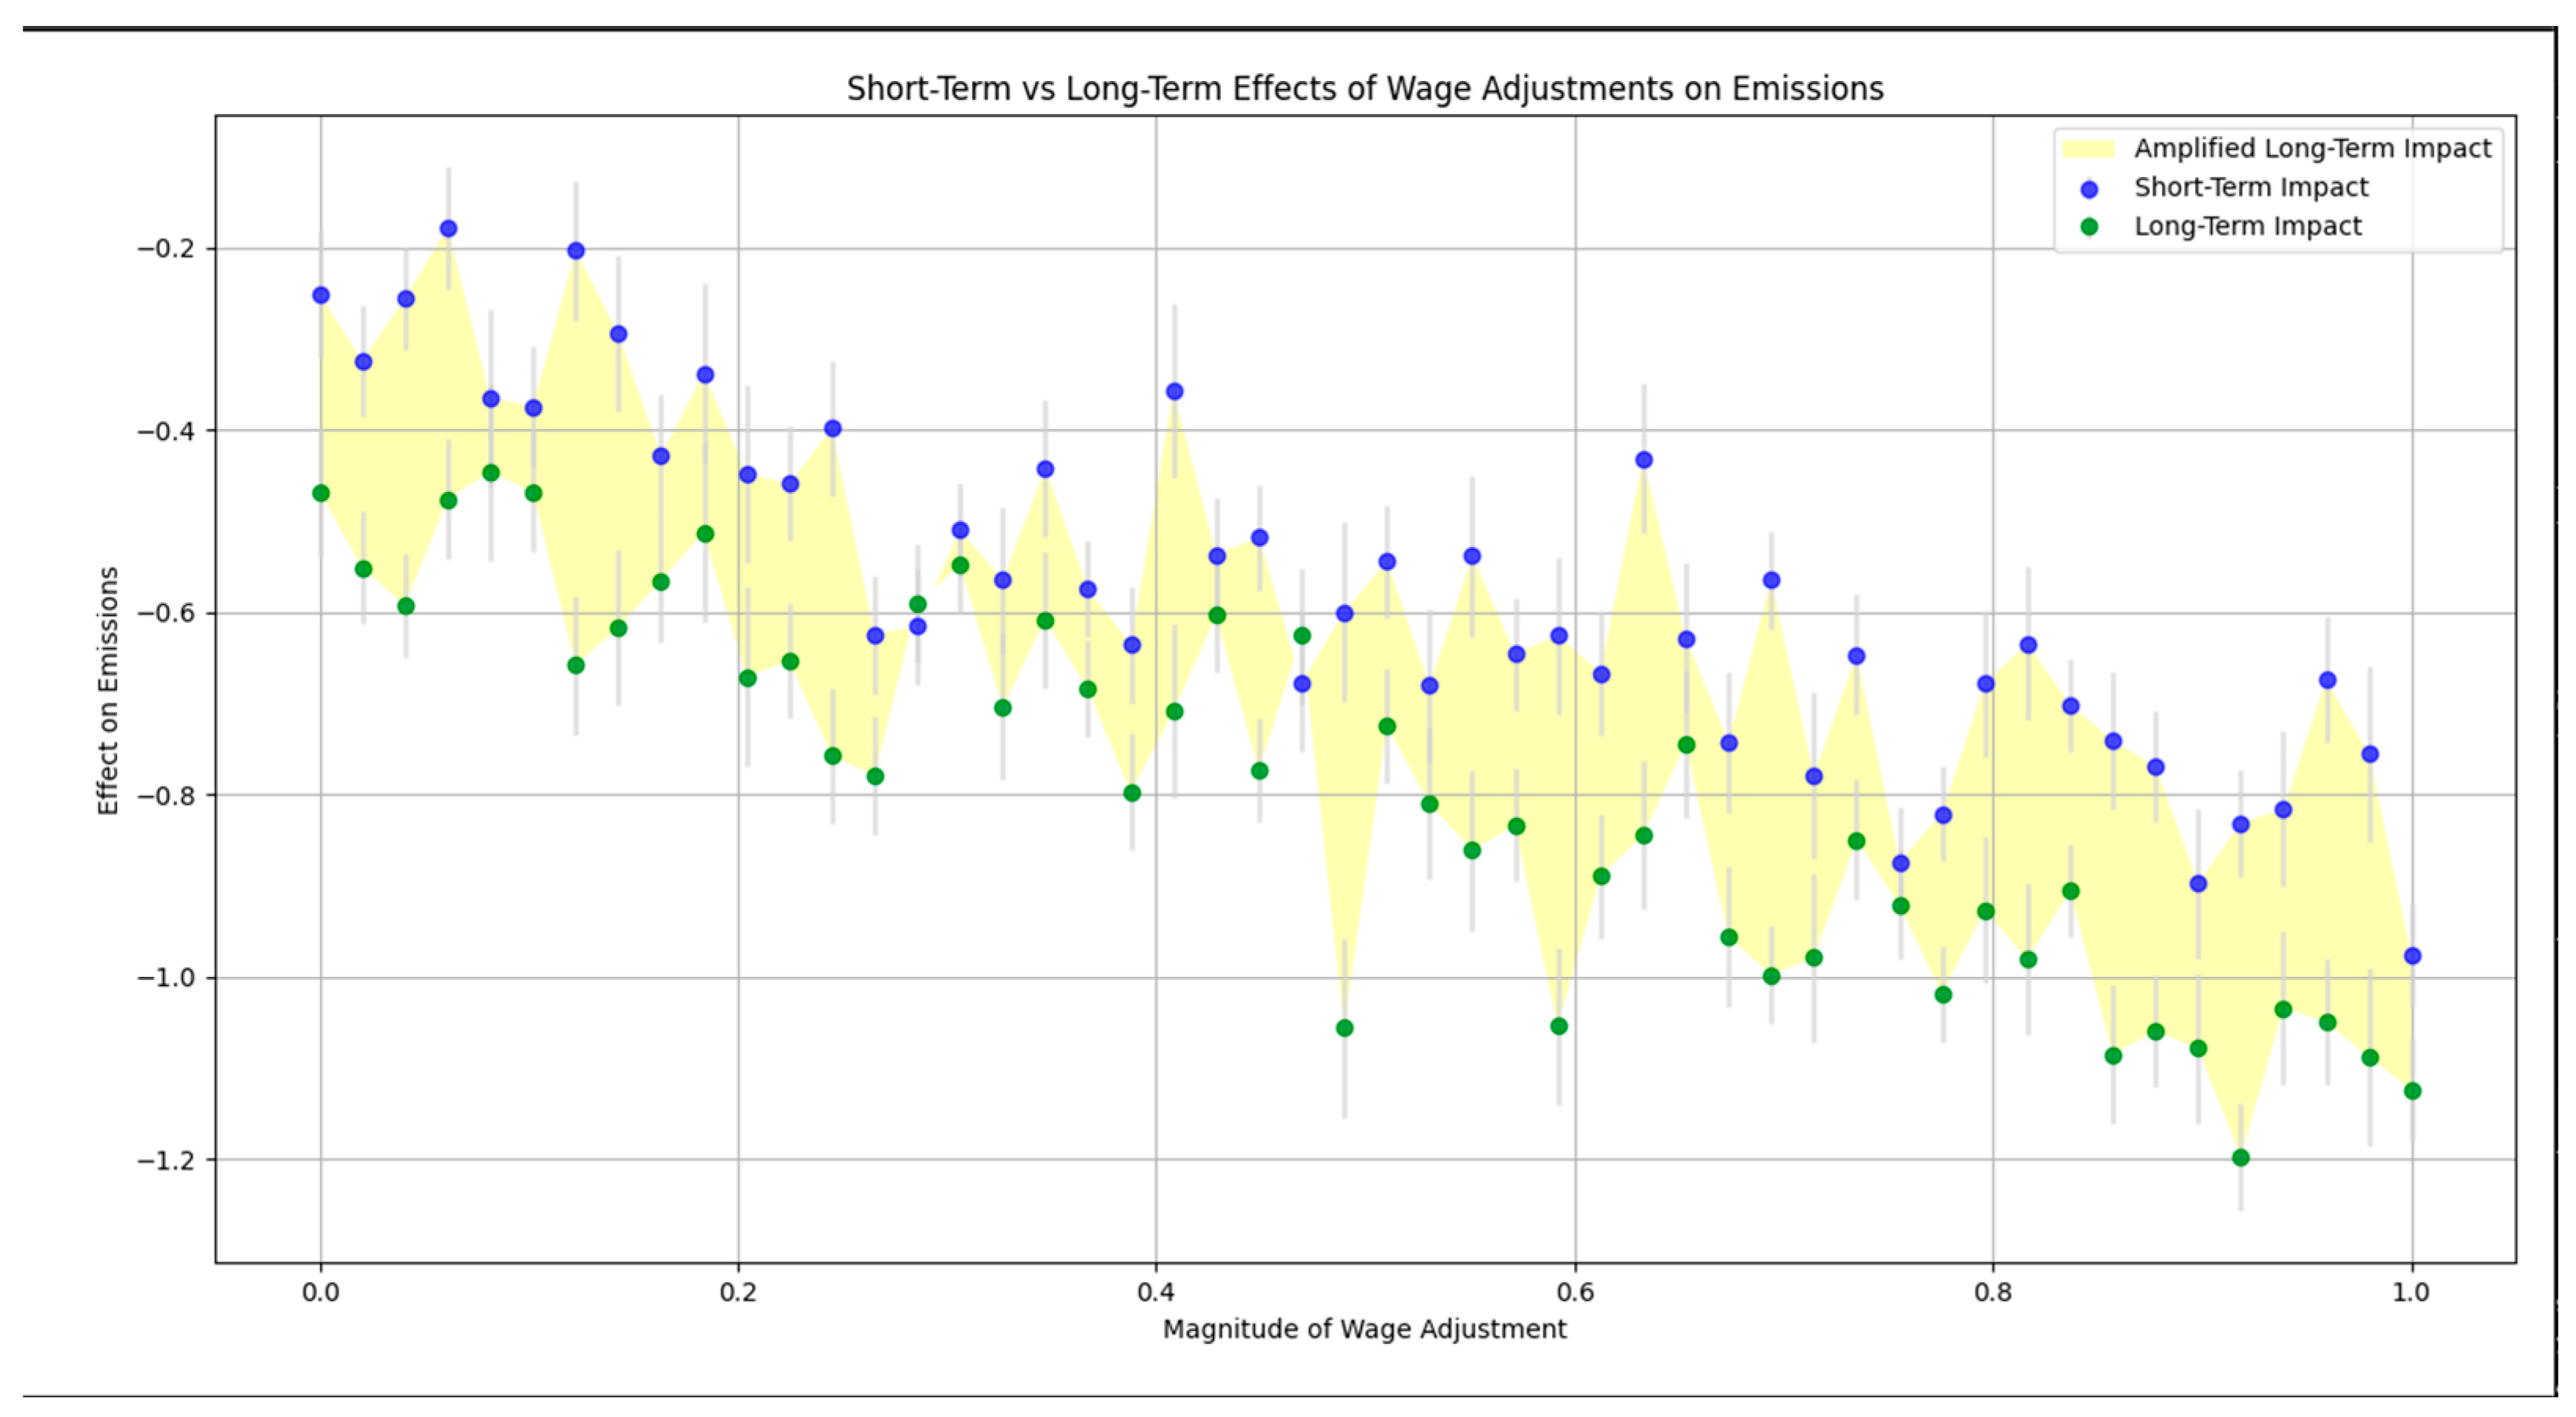
5.4. Long-Term Effects

While our study primarily focuses on the short-term effects of minimum wage adjustments, it is crucial to consider the long-term impacts to gain a comprehensive understanding of these policy interventions. Longitudinal studies could provide valuable insights into the persistence and evolution of the observed effects over extended periods. Examining whether the initial reductions in emissions are sustained, amplified, or diminished over time can help policymakers design more effective and sustainable wage and environmental policies.
We extended our analysis to consider the long-term impacts by utilizing a panel dataset that spans multiple years beyond the initial policy implementation. Our extended model includes lagged variables to capture the dynamic effects of minimum wage adjustments over time. The results are shown in Figure 9.
Our analysis indicates that the reductions in emissions observed in the short term are generally sustained over the long term. The coefficients for lagged minimum wage adjustments remain negative and significant, suggesting that firms continue to adopt cleaner technologies and improve operational efficiencies in response to sustained wage pressures. In some cases, the long-term impact is even more pronounced than the short-term effect. This can be attributed to cumulative investments in green technologies and gradual shifts towards more sustainable production practices that compound over time. Additionally, the long-term effects vary across sectors, with more capital-intensive industries showing more significant reductions in emissions, as they are better positioned to invest in and benefit from cleaner technologies.
The sustained and amplified long-term effects can be explained by several factors. Initial investments in cleaner technologies and production processes continue to yield benefits over time, and as firms amortize these investments, the cost savings from reduced emissions become more substantial. Firms may also adapt to stricter environmental regulations over time, further reinforcing the positive impact of wage adjustments on emissions. Moreover, competitive pressures may drive firms to continuously seek efficiencies and innovations, leading to persistent improvements in environmental performance. These dynamics highlight the importance of considering long-term effects when evaluating the impact of minimum wage policies on corporate environmental outcomes.

6. Mechanism Test

To understand the pathways through which minimum wage adjustments impact corporate pollution emissions, we examine three key mechanisms: labor productivity dynamics, cost pass-through effects, and corporate governance.

6.1. Labor Productivity Dynamics

Labor productivity is central to understanding the interplay between wage adjustments and environmental outcomes. When faced with rising wage standards, firms invariably confront a stark choice: to either absorb these escalating costs or seek avenues to neutralize them. The latter often manifests in efforts to enhance labor productivity. As wage floors ascend, there is an inherent impetus for firms to optimize their human capital, driving them towards more efficient and often less polluting production methodologies. This relationship is tested using a fixed-effects regression model that accounts for firm-specific characteristics and time-invariant factors.
When faced with rising wage standards, firms invariably confront a stark choice: to either absorb these escalating costs or seek avenues to neutralize them. The latter often manifests in efforts to enhance labor productivity. As wage floors ascend, there is an inherent impetus for firms to optimize their human capital, driving them towards more efficient and often less polluting production methodologies. The results are shown in Table 6, columns (1)–(3).
From a theoretical perspective, higher labor productivity translates to a better yield per unit of input, implying efficient resource utilization. With wage hikes serving as the trigger, the resultant shift towards efficiency might inadvertently lead firms to adopt cleaner production methods, reducing overall emissions. In this context, the wage-productivity nexus becomes a conduit through which wage standards indirectly influence environmental outcomes.

6.2. Cost Pass-Through Effect

In the echelons of microeconomic theory, cost pass-through effects hold significant relevance, especially in the realm of wage adjustments. Rising wage standards inevitably lead to heightened production costs. Traditional economic models suggest that firms, when confronted with such escalations, might attempt to pass them onto consumers in the form of higher prices. But this pass-through is rarely complete, especially in competitive markets. The results are shown in Table 6, columns (4)–(6).
The incomplete cost pass-through compels firms to re-strategize. To maintain their market positions without sacrificing profitability, they might opt for more efficient production techniques, which, serendipitously, could be less polluting. The minimum wage then becomes an inadvertent driver for cleaner production, with the cost pass-through effect acting as the intermediary mechanism.

6.3. Corporate Governance and Environmental Performance

Corporate governance structures can influence firms’ responses to wage adjustments and their environmental stances. Firms with robust governance may channel financial strains constructively towards sustainable solutions. The results are shown in Table 6, columns (7)–(9).
A hike in the minimum wage can stress a firm’s financials. However, in firms with robust governance structures, this financial strain might be channeled constructively. Instead of mere short-term cost-cutting, these firms, guided by visionary governance, might seek sustainable solutions, both from an economic and environmental perspective. This could entail investing in cleaner technologies or re-engineering processes to be more eco-friendly. Through the lens of corporate governance, wage standards indirectly sculpt firms’ environmental trajectories, underscoring the multifaceted nature of wage impacts in the industrial realm.

7. Conclusions and Policy Implication

7.1. Conclusions

Drawing our study to a close, we are compelled to reflect on the intricate dance between minimum wage adjustments and their reverberations on environmental metrics. In the broader canvas of the economic literature, the dynamic interplay between labor markets and environmental economics has often been left uncharted, and our study strides into this less well-trodden terrain.
Our pivotal finding—that elevated minimum wage standards have the potential to decrease a firm’s pollution emissions, specifically in terms of carbon dioxide and sulfur dioxide—aligns in part with the extant literature. Prior research has corroborated the association between wage elevations and productivity enhancements, echoing our discoveries on the labor productivity mechanism. Yet, the novelty in our exploration lies in unraveling the subsequent cascading effects on environmental outcomes. The symbiotic relationship between labor productivity dynamics, cost pass-through effects, and corporate governance forms the bedrock of our study’s contributions.
Contrastingly, while some prior studies have postulated that wage enhancements could stress industries, pushing them to cut corners and potentially exacerbate pollution, our findings tilt toward a more optimistic narrative. This discrepancy highlights the evolving nature of corporate governance, emphasizing the increasing weightage of ESG criteria in contemporary decision-making processes. Moreover, our results underscore the notion that wage regulations, often instituted for equity concerns, can inadvertently be an ally in the battle against environmental degradation.
Our study is not without its caveats, and the degree of heterogeneity across regions and sectors, as highlighted in our analysis, speaks to the multifaceted nature of wage impacts. Yet, it is precisely this complexity that makes our findings both robust and relevant. As we juxtapose our discoveries against the backdrop of previous research, we find both convergences and divergences. The former strengthens the foundational premises of our study, while the latter offers tantalizing avenues for future exploration.
To overcome the limitations of our empirical formulation, future research could incorporate a more granular level of data, including firm-level environmental investments and detailed regional policy variations. Additionally, employing alternative econometric techniques, such as instrumental variable approaches or machine learning algorithms, could enhance the robustness of causal inferences.
Moreover, while our findings are grounded in the Chinese context, the underlying mechanisms we explore have broader applicability. For instance, in countries with stringent environmental regulations, the interplay between minimum wage policies and firm-level pollution could yield similar outcomes. Similarly, in economies with diverse industrial bases, the heterogeneity observed in our study could provide valuable insights for tailored policy implementations.
In summation, while our research elucidates previously overlooked mechanisms through which wage standards intersect with environmental outcomes, it is but a chapter in the ever-evolving narrative of environmental economics. As policymakers grapple with the dual challenges of ensuring fair wages and safeguarding our environment, our findings underscore the imperative of viewing these not as mutually exclusive goals, but rather as intertwined facets of sustainable development.

7.2. Policy Implication

In essence, our study paves the way for an innovative policy perspective—one that views labor and environmental policies not as separate silos but as intricately connected components of a broader socio-economic fabric. The path ahead, while challenging, offers a promising opportunity to craft policies that are both economically equitable and environmentally sustainable. The specific implications are as follows:
(1)
Balancing Economic and Environmental Goals: Integrated Policy Design: Policymakers should consider an integrated approach when designing labor and environmental policies. For instance, wage policies can be synchronized with environmental regulations to ensure mutual reinforcement. This could involve setting minimum wage levels that also account for environmental performance metrics of firms.
(2)
Incentives for Sustainable Practices: Financial incentives should be provided, such as tax breaks or subsidies for firms that achieve both wage compliance and environmental standards. This encourages firms to invest in sustainable technologies and practices without compromising economic viability.
(3)
Supporting Firms in Transition: Access to Green Technologies: Access to green technologies should be facilitated through grants, low-interest loans, or public–private partnerships. This support can help firms offset the initial costs of adopting cleaner technologies.
(4)
Training and Capacity Building: Training programs for management and workers should be implemented covering the benefits and implementation of green technologies. This helps build internal capacity and supports a smoother transition to sustainable practices.
(5)
Gradual Implementation of Wage Hikes: Minimum wage increases should be gradually introduced to give firms time to adjust. Coupled with environmental targets, this phased approach can prevent sudden financial strain and encourage sustainable adjustments.
(6)
Targeted Regional Implementation: There should be recognition that due to the heterogeneous impact across regions with varying economic developments, there is an opportunity for calibrated, region-specific wage adjustments. In regions at the cusp of industrial transformation, ensuring wage hikes could serve the dual purpose of enhancing worker welfare and inadvertently catalyzing greener production methods.
(7)
Incentivizing Green Corporate Governance: The observed interaction between corporate governance structures and environmental outcomes signals a pressing need to incorporate ESG metrics more firmly within corporate performance evaluations. Offering tax incentives or subsidies to firms that excel in green governance could provide the necessary impetus for more sustainable operations.
(8)
Inclusive Policy Formulation: Key stakeholders should be identified and engaged, including industrial bodies, labor unions, and environmental groups, in policy formulation. Joint workshops, feedback sessions, and collaborative policy design initiatives can ensure that wage policies are economically viable and environmentally prudent.

Author Contributions

Conceptualization, H.R.; methodology, H.R.; software, H.R.; validation, M.Z.; formal analysis, M.Z.; investigation, M.Z.; resources, H.R.; data curation, B.L.; writing—original draft preparation, M.Z.; writing—review and editing, H.R.; visualization, H.R.; supervision, B.L.; project administration, H.R.; funding acquisition, H.R. All authors have read and agreed to the published version of the manuscript.

Funding

This research received no external funding.

Institutional Review Board Statement

Not applicable.

Informed Consent Statement

Informed consent was obtained from all subjects involved in the study.

Data Availability Statement

The data will be provided on request.

Conflicts of Interest

The authors declare no conflicts of interest.

References

  1. Garnero, A.; Lucifora, C. Turning a ‘Blind Eye’? Compliance with Minimum Wage Standards and Employment. Economica 2022, 89, 884–907. [Google Scholar] [CrossRef]
  2. Li, H.; Li, Y.; Guo, L. How does minimum wage affect firm pollution discharges: Evidence from China. J. Clean. Prod. 2023, 414, 137504. [Google Scholar] [CrossRef]
  3. Grossman, J.B. The impact of the minimum wage on other wages. J. Hum. Resour. 1983, 18, 359–378. [Google Scholar] [CrossRef]
  4. Harasztosi, P.; Lindner, A. Who pays for the minimum wage? Am. Econ. Rev. 2019, 109, 2693–2727. [Google Scholar] [CrossRef]
  5. Li, Y.; Kanbur, R.; Lin, C. Minimum wage competition between local governments in China. J. Dev. Stud. 2019, 55, 2479–2494. [Google Scholar] [CrossRef]
  6. Hart, S.L.; Ahuja, G. Does it pay to be green? An empirical examination of the relationship between emission reduction and firm performance. Bus. Strategy Environ. 1996, 5, 30–37. [Google Scholar] [CrossRef]
  7. Filene, E.A. The minimum wage and efficiency. Am. Econ. Rev. 1923, 13, 411–415. [Google Scholar]
  8. Karp, L.; Livernois, J. Using automatic tax changes to control pollution emissions. J. Environ. Econ. Manag. 1994, 27, 38–48. [Google Scholar] [CrossRef]
  9. King, A.A.; Lenox, M.J. Does it really pay to be green? An empirical study of firm environmental and financial performance: An empirical study of firm environmental and financial performance. J. Ind. Ecol. 2001, 5, 105–116. [Google Scholar] [CrossRef]
  10. Kong, D.; Zhu, L. Governments’ fiscal squeeze and firms’ pollution emissions: Evidence from a natural experiment in China. Environ. Resour. Econ. 2022, 81, 833–866. [Google Scholar] [CrossRef]
  11. Lyubich, E.; Shapiro, J.S.; Walker, R. Regulating mismeasured pollution: Implications of firm heterogeneity for environmental policy. In AEA Papers and Proceedings; American Economic Association: Nashville, TN, USA, 2018. [Google Scholar]
  12. Li, X.; Zhou, Y.M. Offshoring pollution while offshoring production? Strateg. Manag. J. 2017, 38, 2310–2329. [Google Scholar] [CrossRef]
  13. Nishitani, K.; Kaneko, S.; Fujii, H.; Komatsu, S. Effects of the reduction of pollution emissions on the economic performance of firms: An empirical analysis focusing on demand and productivity. J. Clean. Prod. 2011, 19, 1956–1964. [Google Scholar] [CrossRef]
  14. Schmitt, J. Explaining the small employment effects of the minimum wage in the United States. Ind. Relat. J. Econ. Soc. 2015, 54, 547–581. [Google Scholar] [CrossRef]
  15. Schulten, T. Towards a European minimum wage policy? Fair wages and social Europe. Eur. J. Ind. Relat. 2008, 14, 421–439. [Google Scholar] [CrossRef]
  16. Song, J.; Chen, Y.; Luan, F. Air pollution, water pollution, and robots: Is technology the panacea. J. Environ. Manag. 2023, 330, 117170. [Google Scholar] [CrossRef]
  17. Silberman, J.I.; Durden, G.C. Determining legislative preferences on the minimum wage: An economic approach. J. Political Econ. 1976, 84, 317–329. [Google Scholar] [CrossRef]
  18. Kling, C.; Rubin, J. Bankable permits for the control of environmental pollution. J. Public Econ. 1997, 64, 101–115. [Google Scholar] [CrossRef]
  19. Starr, G.F. Minimum Wage Fixing: An International Review of Practices and Problems; ILO: Geneva, Switzerland, 1981. [Google Scholar]
  20. Weil, D. Public enforcement/private monitoring: Evaluating a new approach to regulating the minimum wage. ILR Rev. 2005, 58, 238–257. [Google Scholar] [CrossRef]
  21. Tang, M.; Li, Z.; Hu, F.; Wu, B.; Zhang, R. Market failure, tradable discharge permit, and pollution reduction: Evidence from industrial firms in China. Ecol. Econ. 2021, 189, 107180. [Google Scholar] [CrossRef]
  22. Stigler, G.J. The economics of minimum wage legislation. Am. Econ. Rev. 1946, 36, 358–365. [Google Scholar]
  23. Manning, A. The elusive employment effect of the minimum wage. J. Econ. Perspect. 2021, 35, 3–26. [Google Scholar] [CrossRef]
  24. Zhang, D. Marketization, environmental regulation, and eco-friendly productivity: A Malmquist–Luenberger index for pollution emissions of large Chinese firms. J. Asian Econ. 2021, 76, 101342. [Google Scholar] [CrossRef]
  25. Zhang, M.-A.; Lu, S.; Zhang, S.; Bai, Y. The unintended consequence of minimum wage hikes: Evidence based on firms’ pollution emission. Energy Econ. 2023, 125, 106857. [Google Scholar] [CrossRef]
  26. Yang, S.; Jahanger, A.; Hossain, M.R. How effective has the low-carbon city pilot policy been as an environmental intervention in curbing pollution? Evidence from Chinese industrial enterprises. Energy Econ. 2023, 118, 106523. [Google Scholar] [CrossRef]
  27. Welch, F. Minimum wage legislation in the United States. Econ. Inq. 1974, 12, 285–318. [Google Scholar] [CrossRef]
  28. Zhao, Y.; Mao, J. Energy effects of non-energy policies: Minimum wage standard and enterprise energy efficiency in China. Resour. Policy 2022, 79, 102953. [Google Scholar] [CrossRef]
  29. Kang, C.-C.; Khan, H.A.; Feng, C.-M.; Wu, C.-C. Efficiency evaluation of bus transit firms with and without consideration of environmental air-pollution emissions. Transp. Res. Part D Transp. Environ. 2017, 50, 505–519. [Google Scholar] [CrossRef]
  30. Reich, M.; Allegretto, S.; Godoey, A. Seattle’s Minimum Wage Experience 2015–16; IRLE: Berkeley, CA, USA, 2017; SSRN 3043388. [Google Scholar]
  31. Pollin, R. Economic prospects: Making the federal minimum wage a living wage. In New Labor Forum; Sage Publications, Inc.: New York, NY, USA, 2007. [Google Scholar]
Figure 1. Spatial distribution of minimum income in China.
Sustainability 16 06020 g001
Figure 2. Spatial distribution of pollution emissions in China.
Sustainability 16 06020 g002
Figure 3. Parallel trends test results.
Sustainability 16 06020 g003
Figure 4. Placebo test results (before).
Sustainability 16 06020 g004
Figure 5. Placebo test results (after).
Sustainability 16 06020 g005
Figure 6. Heterogeneity results: according to the economic development level.
Sustainability 16 06020 g006
Figure 7. Heterogeneity result: according to magnitude of minimum wage adjustment.
Sustainability 16 06020 g007
Figure 8. Heterogeneity results: according to stringency of environmental regulations.
Sustainability 16 06020 g008
Figure 9. Long-term effect test results.
Sustainability 16 06020 g009
Table 1. Description of each variable.
Variable NameAverageStandard DeviationMinMaxN
C O 2 0.30580.20150.42912.351419,384
S O 2 2.44607.12860.046464.038519,384
did0.17600.11310.03740.433319,384
rd48.18548.702028.330066.410019,384
Sk1.28860.58950.43803.320819,384
sce0.01330.01130.00160.042419,384
fne1.33001.20340.46979.622119,384
Ffi0.01050.01330.00000.061319,384
efu0.04050.07360.00090.427719,384
Dcn0.04010.03290.00110.118519,384
Table 2. Baseline regression results.
(1)(2)(3)(4)(5)(6)
VariablesPolluPolluPolluPolluPolluPollu
did−0.034 ***−0.174 ***−1.845 ***−0.262 **−0.303 **−0.292 ***
(−3.83)(−3.97)(−12.70)(−2.26)(−2.52)(−5.31)
ControlNYYYNY
city FEYNYNYY
id FEYYYYYY
Observations19,38419,38419,38419,38419,38419,384
R-squared0.8210.4790.5920.3840.0310.178
Note: Robust z-statistics in parentheses, *** p <0.01, ** p < 0.05. The same as below.
Table 3. Change in the spatial matrix.
(1)(2)(3)(4)(5)(6)
VariablesPolluPolluPolluPolluPolluPollu
did−1.138 ***−0.770 *−0.607 **−1.391 ***−1.386 ***−1.210 ***
(−3.04)(−1.85)(−2.04)(−6.08)(−5.87)(−4.18)
ControlYYYYYY
id FEYYYYYY
Year FEYYYYYY
Observations19,38419,38419,38419,38419,38419,384
R-squared0.5920.7320.0860.3840.0310.178
Note: Robust z-statistics in parentheses, *** p < 0.01, ** p < 0.05, * p < 0.1, indicating the variable are significant at 99%, 95% and 90% level. The same as below.
Table 4. IV validity tests.
TestStatistic
Hausmann Testing864.32 ***
DWH test69.57 ***
Weak correlation test83.82 ***
Note: *** p < 0.01.
Table 5. IV regression results.
(1)(2)(3)(4)
Phase 1Phase 2
VariablesMinimum WageMinimum Wage C O 2 C O 2
iv−0.267 ***−0.268 ***
(−3.08)(−3.10)
Did −0.195 **−0.243 ***
(−2.41)(−3.06)
Constant1.518 ***0.477 ***
(95.80)(2.72)
city FENYNY
id FEYYYY
Year FEYYYY
Observations19,38419,38419,38419,384
R-squared0.7290.7310.0840.219
Note: Robust z-statistics in parentheses, *** p < 0.01, ** p < 0.05.
Table 6. The mechanism test results.
(1)(2)(3)(4)(5)(6)(7)(8)(9)
VariablesPolluPolluPolluPolluPolluPolluPolluPolluPollu
did−0.001 ***−0.002 ***−0.051 ***−0.048 **−1.113 ***−1.131 ***−1.103 ***−1.158 ***−1.113 ***
(−2.71)(−2.63)(−2.60)(−2.53)(−9.43)(−9.41)(−7.01)(−7.16)(−9.43)
Mechanism10.494 ***0.504 ***0.556 ***
(0.0250)(0.0242)(0.0262)
Mechanism2 4.850 ***4.821 ***5.343 ***
(2.73)(3.86)(4.36)
Mechanism3 0.193 ***0.314 ***0.155 ***
(0.0381)(0.0382)(0.0154)
ControlNYYNYYNYY
id FEYNYYNYYNY
Year FEYYYYYYYYY
Observations19,38419,38419,38419,38419,38419,38419,38419,38419,384
R-squared0.8210.4790.5920.3840.0310.1780.8210.4790.592
Note: Robust z-statistics in parentheses, *** p < 0.01, ** p < 0.05. The same as below.
Disclaimer/Publisher’s Note: The statements, opinions and data contained in all publications are solely those of the individual author(s) and contributor(s) and not of MDPI and/or the editor(s). MDPI and/or the editor(s) disclaim responsibility for any injury to people or property resulting from any ideas, methods, instructions or products referred to in the content.

