Abstract
As the future product and process design decision-makers, students in engineering should have knowledge of sustainability and its application in industry. However, educators are challenged in training students in these concepts. Existing analysis tools are deficient in supporting sustainability assessment by nonexperts. To address this gap, the Manufacturing Process and System (MaPS) Sustainability Analysis tool was developed under the Constructionism in Learning: Sustainable Life Cycle Engineering (CooL:SLiCE) project. The technical aspects of developing a framework and its associated proof-of-concept MaPS Sustainability Analysis tool are reported in a separate study. Herein, the educational aspects of the MaPS Sustainability Analysis tool and its operational performance in terms of ease of use and usefulness to assess its suitability for the classroom are investigated. Undergraduate and graduate engineering students at Tampere University and Oregon State University were recruited to use and evaluate the tool. Through application of the Technology Acceptance Model (TAM), it was determined that the 24 study participants found the tool easy to use and useful in analyzing product design, manufacturing process, and supply chain sustainability performance. To move this proof of concept toward general use, key software operational characteristics and a GUI should be investigated to improve efficiency, effectiveness, satisfaction, and learnability of the MaPS Sustainability Analysis tool.
1. Motivation
Sustainable development has received increasing attention from society, academia, and industry for the past half century due to global warming, growing public awareness, corporate social responsibility, stricter regulations, and resource scarcity. Engineers have a key responsibility in addressing these concerns by considering environmental, economic, and social impacts during the design, manufacture, and delivery of products and services. Students who join the engineering community need to be educated with the knowledge of sustainable engineering concepts to be applied from the start of the design process through product manufacturing, use, and end of life. Particularly, they should be able to propose and evaluate improvements to manufacturing processes and systems from a sustainability perspective supported by preparatory training and education. Education for Sustainable Development (ESD) was highlighted by The United Nations Educational, Scientific and Cultural Organization (UNESCO) as necessary to achieve the Sustainable Development Goals (SDGs) [1]. SDGs are 17 interconnected goals that were published by the United Nations in 2015 to achieve a better and more sustainable future for all [2]. Target 4.7 from Goal 4 specifies that all learners acquire the knowledge and skills needed to promote sustainable development [3].
Educators have previously incorporated sustainability principles into engineering education using a variety of methodologies and applying various ad hoc approaches [4,5,6,7,8,9]. They have developed degree-level curricula [10,11,12,13], formed sustainability-oriented courses [14,15], and incorporated sustainability-related principles into existing courses [16,17]. Several researchers have investigated the status of integrating sustainability and sustainable development into engineering curricula [18,19,20]. Thürer et al. [21] investigated universities in Europe, North America, Africa, Asia, and Australia and found active learning a more preferable method in delivering sustainability-related topics. However, they noted that the implementation of active learning is challenging. Moreover, existing methods and software tools for sustainability assessment of products and manufacturing processes and systems are not well-suited for educating nonexpert decision-makers (e.g., engineering students and practitioners) who do not possess specialized knowledge in sustainability analysis of product designs and manufacturing processes [22,23,24]. Thus, one of the main challenges is in providing educational and technical materials for training nonexperts for such assessment through active learning. This was also highlighted by Rampaso et al. [25] who identified 15 issues existing in engineering education for sustainable development, including the use of active learning methods for teaching sustainability-related topics, balanced focus on all aspects of sustainability, and development of systemic thinking in students.
This need stems from multiple factors, including (1) challenges in exchanging sustainability information between stages of the product life cycle [26]; (2) prohibitive costs of existing product cost and environmental impact analysis tools [27]; (3) the need for domain knowledge and expertise of eco-design issues [28]; (4) the dependency of analysis tools solely on product mass [28,29]; (5) a limited focus on one or two aspect(s) of sustainability [30]; and (6) sophistication, complexity, and difficulty in working with the eco-design software tools [31]. Additionally, when compared to traditional lecturing in the STEM (science, technology, engineering, and mathematics) disciplines, research has found that active learning improves the efficiency and effectiveness of learning and provides a better understanding of the instructional topic [32,33,34]. One enabler to address the gaps noted above is scaffolded (instructor-supported) educational materials to integrate instructional resources with active learning approaches [35]. This learning environment can be provided by a design analysis tool that enhances student’s problem-solving skills and facilitates their learning of sustainable design and manufacturing concepts.
The authors have previously reported on an easy-to-use, publicly available Manufacturing Process and System (MaPS) Sustainability Analysis tool as a proof of concept [29]. The MaPS tool implements unit manufacturing process (UMP) modeling, and facilitates simultaneous analysis of economic, environmental, and social impacts for different product, process, and supply chain designs. The technical aspects of implementing UMP modeling within an easy-to-use, publicly available MaPS Sustainability Analysis tool is reported by Raoufi and Haapala [36]. Building upon this prior work, the focus of the research presented herein is on the educational aspect of the MaPS tool and to assess its suitability for the classroom. Thus, the objective of this research is to evaluate the operational performance of the MaPS tool in terms of ease of use and usefulness.
The remainder of this paper is organized as follows. In Section 2, the methodology applied in this research along with each of the steps and their associated tasks is described. In Section 3, Section 4, Section 5 and Section 6, the application of the four methodology steps is discussed in greater detail. In Section 3, the first step of the methodology, including the development of the MaPS tool, the evaluation method, and the survey, are presented. In Section 4, the second step of the methodology (i.e., the development of the learning activities for evaluating the MaPS tool) is described including the tutorial, the learning outcomes, and the activity description. In Section 5, the implementation process, which is the third step of the methodology, is discussed. In Section 6, the last step of the methodology focusing on the assessment of the results as well as the opportunities for user study improvement and software improvement are presented. Section 7 presents a summary of the research. Finally, in Section 8, conclusions of this research and several directions for future study are described.
2. Methodology
To investigate the operational performance of the MaPS Sustainability Analysis tool, Deming’s Plan-Do-Study-Act (PDSA) Cycle for Learning and Improvement is applied herein [37]. The Cycle and each step are presented in Figure 1 and are described below.
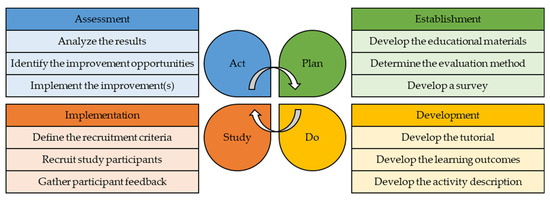
Figure 1.
The PDSA Cycle for Learning and Improvement applied to evaluate the operational performance of the MaPS Sustainability Analysis tool.
2.1. Step 1: Plan (Establishment)
The first step of the Cycle is to Plan. In the research presented herein, this step is considered as establishment of the materials required to achieve the research objective. The first task of this step is to develop educational materials to address the gaps in educating engineering students in product sustainability assessment. Next, the method to evaluate the educational materials developed in the previous task should be determined. The third task of this step of the PDSA Cycle is to develop a survey based on the evaluation method to test the educational materials and to capture feedback from the students.
2.2. Step 2: Do (Development)
The second step of the Cycle is to Do. Herein, this step mainly concentrates on development of a learning module composed of a tutorial, learning outcomes, and activity description. The first task is to develop a tutorial to introduce the educational materials provided in the first step of the Cycle to the students. Next, the learning outcomes of this study are developed in the second task. The final task in this step is to develop a step-by-step activity description to clarify the activities required of the students.
2.3. Step 3: Study (Implementation)
The third step of the Cycle is to Study. In this step, the focus is on implementation of this study to evaluate the educational materials developed in the first step of the Cycle. This step first defines the recruitment criteria to ensure that study participants are selected correctly. This results in fair assessment of the educational materials and the learning module developed in the first and second steps, respectively. Moreover, to acknowledge the time and efforts of the participants, a compensation method should be determined in this task. The last two tasks involve recruiting participants and gathering their feedback.
2.4. Step 4: Act (Assessment)
Once student participant feedback is gathered, the last step of the Cycle is to Act. Herein, this step focuses on assessment of the results obtained from the previous step. Thus, the first task is to analyze the results of the survey. Based on the analysis of survey results, improvement opportunities that can be made to the educational materials and the learning module are then identified. The last task of this step is to implement the identified improvements. Thus, the PDSA Cycle facilitates continuous improvement of learning.
3. Application of the Methodology—Step 1: Plan (Establishment)
Herein, the first step of the PDSA Cycle focuses on establishment of educational materials and evaluation methods, as presented in Figure 1 and described below.
3.1. Develop the Educational Materials
The supporting sustainability assessment framework considers a cradle-to-gate life-cycle scope and is comprised of four phases: (1) product development, (2) supply chain configuration, (3) manufacturing process design, and (4) sustainability analysis. The MaPS Sustainability Analysis tool is comprised of four modules (Figure 2) to align with this framework, and supports the evaluation of environmental (energy consumption and the associated carbon footprint), economic (cost of goods sold and lead time), and social (worker health and safety in the work environment) performance. Elements of the tool were derived from work under the Constructionism in Learning: Sustainable Life Cycle Engineering (CooL:SLiCE) project sponsored by the U.S. National Science Foundation (NSF) [38]. Researchers at Iowa State University, Oregon State University (OSU), Pennsylvania State University, and Wayne State University collaborated to develop a cyberlearning platform for STEM students to investigate the environmental, economic, and social impacts of product design changes on manufacturing processes and supply chain networks.
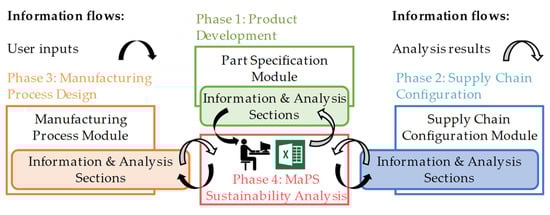
Figure 2.
Mapping of MaPS Sustainability Analysis tool modules with sustainability assessment framework phases.
To realize Phase 1 (product development), a part specification module was devised to capture product design information (e.g., materials and product geometry), as an outcome of the product design process (i.e., defining the product idea, defining product functions, determining functional relationships, extracting information from a design repository, generating conceptual designs, and generating a detailed design). Similarly, supply chain information (e.g., transportation routes and modes) is provided by the supply chain configuration module, which maps to Phase 2 (supply chain configuration). The activities of this phase include selecting raw material suppliers, selecting from-to locations, selecting transportation mode(s), and developing mathematical supply chain models. Next, the manufacturing process module provides manufacturing information (key process parameters and their associated values for each UMP), realizing Phase 3 (manufacturing process design), which includes selecting UMPs, developing mathematical UMP models, and defining process parameter values. The last phase (MaPS sustainability analysis) aims to assess economic, environmental, and social impacts of the product, and involves applying models, conducting sustainability assessment, and analyzing and comparing results.
The MaPS Sustainability Analysis tool was developed in MS Excel to enable nonexperts to conduct sustainability assessments easily and intuitively. Each of the four tool modules has two sections as follows: information and analysis. While each module performs the sustainability assessment independently through its associated analysis section, the information sections of the modules share the required information for conducting the sustainability assessment. Since it is not expected that nonexperts develop numerical models, such models for each activity are implemented within the information section of each module of a spreadsheet software tool. The analysis sections of the modules are integrated with a graphical user interface with drop-down menus that provide multiple choices for each parameter. This enables nonexperts to become familiarized with the parameter ranges as well as to investigate the effects of changes in the parameter values.
The MaPS Sustainability Analysis tool utilizes several information resources to support sustainability assessment. To improve usability of the MaPS Sustainability Analysis tool, these information resources are integrated as follows. First, the underpinning numerical UMP and supply chain models used to quantify the economic, environmental, and social performance metrics were reviewed to identify the key parameters of each model. The UMP modeling methodology was reported by Kellens et al. [39,40] was used to generate process models for evaluating the environmental impacts of various UMPs such as grinding [41], drilling [42], metal injection molding [43], laser powder bed fusion [44], stereolithography [45], gas metal arc welding [46], polymer injection molding [47], and fused deposition modeling [48]. Currently, UMP models for a subset of additive and subtractive manufacturing processes are included in the MaPS tool to investigate the sustainability performance of making polymer and metal products. The key model parameters are provided, but users must input these variable values in the analysis section of the tool. This enables them to create and to analyze different manufacturing and supply chain scenarios. Second, existing product design, supply chain configuration, and manufacturing process information resources were reviewed to identify the information provided from each resource (e.g., raw material, product dimensions, distances between locations, transportation time, speed and capacity of the selected transportation mode, and manufacturing process cycle time). This information provides key inputs for the UMP and supply chain models. Third, the key product design, supply chain, and manufacturing process information from the information section of the tool was identified and connected to the key parameters of the numerical models in the analysis section of the tool. This was accomplished by ensuring that the numerical formulations (transformation equations) utilize the data contained in the information resources as inputs for the key model parameters.
3.2. Determine the Evaluation Method
Software evaluation methods were defined by Fernandez et al. [49], and include various methods for evaluating software tool usability. Researchers have applied software usability evaluation methods in different domains, such as health [50,51], e-commerce [52], and web applications [53]. Paz et al. [54] reviewed the literature for software evaluation methods with the goal to identify the most widely used methods for evaluating software usability across different domains. They identified 34 usability evaluation methods and found survey/questionnaire-based methods to be the most widely applied across all software domains. Specifically, in the software development domain, they identified 13 usability evaluation methods and found that surveys/questionnaires, user testing, interviews, and user testing–thinking were the top four methods in evaluating usability; these methods were used ten, seven, five, and four times, respectively. In accordance with these findings, the Technology Acceptance Model (TAM) method [55] is applied herein to evaluate the MaPS Sustainability Analysis tool due to its technical simplicity and flexibility. TAM is a survey-based method that has been widely used in measuring user attitudes toward a particular software tool technology [56]. The method does not require face-to-face meetings with the users to capture their feedback on the tool being evaluated, a key requirement of our international study conducted under COVID-19 pandemic remote work restrictions. Thus, TAM avoids the logistical issues such as difficulties in scheduling interview meetings with a sufficient number of users, which can delay development timelines. Most importantly, the method evaluates ease-of-use and usefulness metrics defined by Davis [55], which are essential factors for the success of tool use and key aspects for our study of nonexperts in sustainable product design and manufacturing.
3.3. Develop a Survey
In the work reported herein, the user survey statements of the TAM method were modified slightly to focus participant attention on the MaPS Sustainability Analysis tool. Interested readers are referred to the dissertation of Raoufi [29], which documents the survey statements used. The metrics of interest were evaluated by asking study participants to express their agreement with statements relating to six indicators for each metric after using the tool. Participants indicated their level of agreement using a seven-point Likert scale (1: very strongly disagree, 2: strongly disagree, 3: disagree, 4: neither agree nor disagree, 5: agree, 6: strongly agree, 7: very strongly agree).
To ensure that every opinion is captured, the odd number of points provides an opportunity for study participants to select a neutral value when they truly feel neutral about a given indicator [57,58]. This approach creates a neutral value midpoint, which provides a standard point of comparison when calculating the mean weighted average and eases data interpretation [59]. An even-numbered scale is appropriate when participants must reflect their positive or negative opinions [60]. In addition to the indicator statements, an open-ended question was presented to the study participants to capture additional input on both metrics. Demographics questions were included to better understand user backgrounds (e.g., their age, their sustainable product design, and other work experiences). This study included both research and human subjects; thus, approval was obtained from the OSU Human Research Protection Program prior to commencing recruitment and other study activities.
4. Application of the Methodology—Step 2: Do (Development)
The second step of the PDSA Cycle in the research presented herein focuses on development. The tasks of this step are presented in Figure 1 and are described as follows.
4.1. Develop the Tutorial
To aid in evaluating operational performance of the tool in terms of the ease-of-use and usefulness metrics, a learning module was developed to guide the students in working with the tool. Students interacted with the tool outside of class and lab time without the input of their instructor by using a tutorial documented by Raoufi [29]. The tutorial introduces the MaPS Sustainability Analysis tool and provides an example case study for the design of a basic hexacopter (shown in Figure 3) to quantify the sustainability performance of a plastic product.
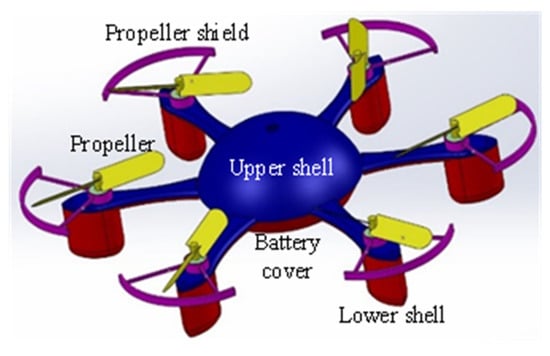
Figure 3.
Solid model of a hexacopter.
4.2. Develop the Learning Outcomes
The pedagogical goal of this study is to enable nonexperts to conduct sustainability performance of manufacturing processes and supply chain networks during the product design phase. Considering this goal and following the development of the tutorial, corresponding learning outcomes are developed to support the learning module, which are described as follows:
- Analyze the impacts of product architecture, manufacturing process, and supply chain decisions on product economic, environmental, and social sustainability.
- Articulate the impacts of product architecture, manufacturing process, and supply chain decisions on product economic, environmental, and social sustainability.
- Construct product design solutions that address technical requirements, in addition to economic, environmental, and social sustainability goals.
4.3. Develop the Activity Description
The third part of the learning module concerns the activities required to conduct the assessment and to improve product sustainability performance; these activities are provided in the activity description, in addition to a link to the survey. Similar to the tutorial, the activity description has been documented by Raoufi [29]. To analyze the product using the MaPS Sustainability Analysis tool, users will need the information described in the tutorial and product geometry data. Thus, a CAD file for a hexacopter (Figure 3) was also included with the learning module files. However, students were free to use any CAD file to investigate the sustainability performance of another desired product.
5. Application of the Methodology—Step 3: Study (Implementation)
The third step of the PDSA Cycle in the research presented herein focuses on implementation. The tasks of this step are presented in Figure 1 and are described as follows.
5.1. Define the Recruitment Criteria
To evaluate the operational performance of the MaPS Sustainability Analysis tool, the recruited students met all the following criteria:
- Study participants should be pursuing an undergraduate and/or a graduate engineering degree in and accredited program and/or university.
- Study participants should be recruited from a set of students representative of the broad diversity of engineering programs.
- Study participants should be nonexperts in sustainability analysis of product designs and manufacturing processes (as defined above).
In addition to the specific criteria for recruiting students, several general criteria were included, as described below:
- Study participants should be familiar with product design and/or manufacturing through coursework, research, and/or prior work experience.
- Before recruiting participants, the compensation methods (i.e., assignment points and monetary rewards) should be defined and approved to enable clear communication.
5.2. Recruit Study Participants
Three primary groups of users were recruited for this study from April to June 2020. In early April, 12 undergraduate and graduate engineering students were recruited from the MEI 51706 (Additive Manufacturing) course at Tampere University (TAU) in Finland. These students were nonexperts in sustainability, but were completing product design projects that utilized additive techniques in their manufacture. From the instructor’s perspective, use of the tool would bring awareness of cost, environmental, and social impacts to his students. During May–June 2020, 15 undergraduate and graduate students performing advanced manufacturing research at OSU were recruited.
These students were working across several process technology domains and did not have specialized knowledge in comprehensive sustainability assessment. Several of them were either individually studying manufacturing cost or specific environmental impacts in connection with technology development. In addition, one undergraduate engineering student from MFGE 336 (Production Engineering) and five students from ME 413 (Computer-Aided Design and Manufacturing) agreed to participate at OSU in Spring 2020, while one student from the MFGE 337 (Materials and Manufacturing Processes) course at OSU participated in Summer 2020.
Similar to the students from TAU, OSU students were not experts in sustainability assessment, nor in product design or process analysis. They were engaged in learning core concepts in these domains, and would not otherwise have had the opportunity to explore the connections between product/process sustainability performance and the primary topics covered in these courses. While 34 students were recruited, 24 students consented to be part of this user study, which involved voluntary completion of a set of learning activities using the MaPS Sustainability Analysis tool and responding to the user survey. Considering the principles of the central limit theorem, a sample size of less than 30 subjects presents challenges in drawing conclusions from [61]. However, a range of 20–30 samples is adequate for the purposes of this type of study [62,63].
To recruit students, they were offered assignment points and a monetary reward (i.e., a $15 gift card) at TAU and OSU, respectively. To reduce confirmation bias, the authors applied anonymous recruitment and students voluntarily participated in this study outside of regular class time. They had the opportunity to freely reflect their feedback and viewpoints about the ease of use and usefulness of the MaPS Sustainability Analysis tool. As discussed in Section 3, while a majority of students confirmed that the tool was easy to use and useful in performing sustainability assessment of different manufacturing systems and processes, a few students disagreed with some indicators of these two metrics.
5.3. Gather Participant Feedback
Once the recruitment criteria were defined, this study was initiated by recruiting participants from the target population, described above. Using the survey, developed as described in Section 3.3, study participants reflected their experience in working with the MaPS Sustainability Analysis tool in terms of its ease of use and usefulness.
6. Application of the Methodology—Step 4: Act (Assessment)
The last step of the PDSA Cycle in the research presented herein focuses on assessment. The tasks of this step are presented in Figure 1 and are described as follows.
6.1. Analyze the Results
Participant feedback was numerically analyzed for each indicator assessed in the user survey introduced above. Demographic information for the participants is presented in Section 6.1.1. The results of the evaluation for perceived ease of use and perceived usefulness are discussed in Section 6.1.2 and Section 6.1.3, respectively.
6.1.1. Participant Demographics
As discussed above, undergraduate and graduate engineering students were recruited for this study from TAU and OSU. Participant demographics provides context for the users’ backgrounds and experiences in sustainable product design, as summarized in Figure 4. Overall, 10 of the 24 participants were undergraduate students and the remaining 14 were graduate students. Nine of the undergraduate students were seniors and one was a junior. Six of the graduate students were pursuing doctoral degrees, with the other eight were pursuing master’s degrees. Half of the students were majoring in Mechanical Engineering (ME), while two at OSU were pursuing individual degrees in Industrial Engineering (IE) and Manufacturing Engineering (MFGE). Four OSU students were double majoring in Mechanical Engineering and Manufacturing Engineering (ME/MFGE) and two OSU students were pursing majors in Computer Science and Robotics. At TAU, one student was majoring in Mechanical Engineering and Business Administration, and three were pursuing various domains of Automation Engineering.
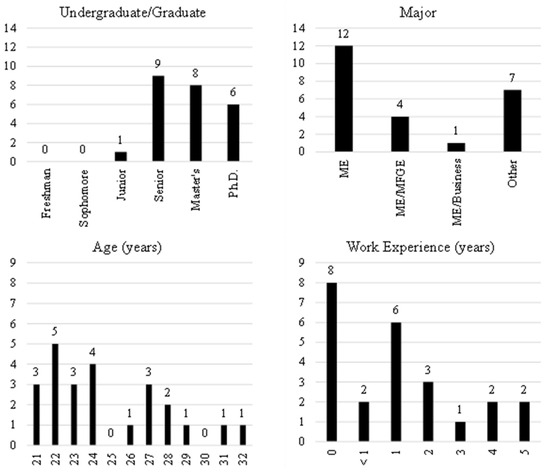
Figure 4.
Demographics of the 24 participants evaluating the MaPS Sustainability Analysis tool.
The participants were distributed between the ages of 21 and 32 years, with an average age of 25. The median age and standard deviation were 24 and 3.16, respectively. All but one of the participants were male. Two-thirds of the participants had some level of professional work experience. Of those with work experience, two students had 1 year or less, nine students had 1–2 years, and five students had 2–5 years.
6.1.2. Perceived Ease of Use
The numerical analysis of indicator results for the perceived ease-of-use metric is presented in Table 1. The median for indicators E1, E2, and E5 is 6 (strongly agree), and for the remaining indicators is 5 (agree). For indicator E1, 83% of the participants (20 students) selected 5 and above, indicating that they found the tool easy to learn and use. More than half (12 students) selected 6 (strongly agree) for this indicator. In addition, 92% (22 students) found it easy to get the tool to do what they wanted it to do (E2), selecting 5 and above. Nearly 80% (19 students) found the tool clear and understandable (E3), with nine selecting 5 (agree), seven selecting 6 (strongly agree), and three selecting 7 (very strongly agree). For the fourth indicator (E4), 58% (14 students) agreed or strongly agreed the tool was flexible to interact with. Around 30% (seven students) were neutral on this indicator. Twenty students (83% of the participants) found becoming skillful at using the tool easy (E5), selecting 5 (agree) and above. Interestingly, the frequency of responses for this indicator is skewed to the right; eight students (34%) selected 7 (very strongly agree), seven (29%) selected 6 (strongly agree), and five (21%) selected 5 (agree). Finally, 83% (20 students) found the tool easy to use and selected 5 and above. Among these, nine students (45%) selected 5, seven (29%) selected 6, and four (17%) selected 7.

Table 1.
Summary of the analysis for perceived ease-of-use indicators.
It should be noted that none of the participants selected 1 (very strongly disagree) or 2 (strongly disagree) for any of the indicators under the ease-of-use metric. Overall, four graduate engineering students at TAU and one undergraduate engineering student at OSU selected 3 (disagree) for several ease-of-use indicators. One student at TAU selected 3 (disagree) for indicators E1–E4 without providing further comments. However, this student found the tool easy to use and selected 5 (agree) for indicator E6. The main reasons provided by the students at TAU for selecting 3 (disagree) were related to problems in obtaining the required parameters, not understanding the flow of information, and errors in transportation calculations. One OSU undergraduate student selected 3 for indicators E2, E4, and E6. This student had difficulty in tracking down the information in the tool.
The numerical analysis of indicator results for the perceived ease-of-use metric based on the number of the years of participants’ professional work experience is presented in Table 2 and the highest average value for each indicator is highlighted. It was found that as the years of work experience increases, the average value for the indicators increases as well. However, as mentioned above, some students selected 3 (disagree) or 4 (neither agree or disagree) for indicators E2 and E4. These students had either 2–3 or 4–5 years of professional work experience. Thus, for these two indicators, the average value decreased with increasing experience. The frequencies of individual responses for the perceived ease-of-use metric indicators are shown in Figure 5.
Table 2.
Value of the perceived ease-of-use indicators relative to the years of professional work experience.
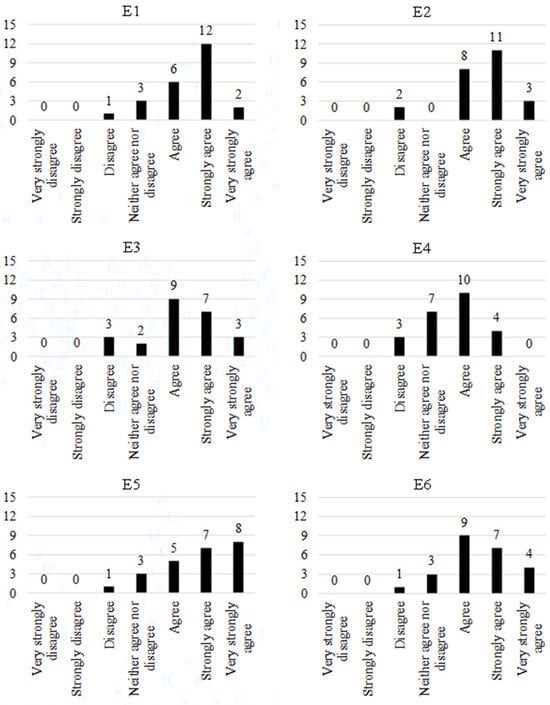
Figure 5.
Frequency of the responses for perceived ease-of-use indicators (E1–E6).
6.1.3. Perceived Usefulness
The numerical analysis of the results for the perceived usefulness metric is presented in Table 3. The median for each of the indicators is 5 (agree), with the responses largely following the trend of a normal distribution, centered on or greater than 5. This indicates that the participants were generally favorable that the tool was useful. Nearly two-thirds of the participants (15 students) indicated they could accomplish task more quickly when using the tool (U1). Seven students selected 5 (agree), while four each selected 6 (strongly agree) and 7 (very strongly agree). For the second indicator (U2), 75% (18 students) noted that using the tool would improve their performance, with 12 selecting 5 (agree). With regard to indicator U3, 71% (17 students) thought that using the tool would increase their productivity; in fact, more than one-third of participants either strongly agreed or very strongly agreed. For the fourth indicator (U4), 83% (20 students) found using the tool would enhance their effectiveness on the job, selecting 5 and above. Three quarters of the participants selected either strongly agree (10 students) or very strongly agree (eight students) for this indicator. Similarly, three quarters (18 students) found it would be easier for them to do their job when using the tool (U5), and selecting 5 and above. Among them, 11 selected 5 (agree) and six selected 6 (strongly agree). Finally, 71% (17 students) indicated they would find the tool useful in their job (U6), selecting 5 (agree) and above. Seven students each selected 5 (agree) and 6 (strongly agree), with three students selecting 7 (very strongly agree).
Table 3.
Summary of the analysis for perceived usefulness indicators.
It should be noted that similar to the ease-of-use indicators (E1–E6), none of the participants selected 1 (very strongly disagree) or 2 (strongly disagree) for any of the indicators (U1–U6) under the usefulness metric. The graduate student from TAU who disagreed with indicators E1–E4 for the ease-of-use metric also disagreed with usefulness indicator U1 (enabling them to complete tasks more quickly), but they did not provide additional comments. This student strongly agreed, however, that the tool would be useful in their job (U6). The other graduate student from TAU selected 3 (disagree) for all the indicators (U1–U6) under the usefulness metric. This student commented, “[I]n most companies the sustainability is not in the focus when selecting a supplier or manufacturing method”.
The undergraduate engineering student from OSU who disagreed with three ease-of-use indicators (i.e., E2, E4, and E6) also disagreed with usefulness indicator U1, which relates to how quickly tasks can be accomplished using the tool. They stated they could not comment adequately about the tool’s usefulness since they were not evaluating a real-world scenario, and felt “REAL WORLD TESTING” (capitalization theirs) was necessary, rather than seeking input from students. This student selected 4 (neither agree or disagree) for U2, U3, U5, and U6, but selected 5 (agree) for U4, indicating that the tool would enhance their on-the-job effectiveness.
The numerical analysis of indicator results for the perceived usefulness metric based on the number of the years of participants’ professional work experience is presented in Table 4 and the highest average value for each indicator is highlighted.
Table 4.
Value of the perceived usefulness indicators relative to the years of professional work experience.
Similar to the perceived ease-of-use indicators, as the years of work experience increases, the average value for the indicators increases as well. However, this trend was not observed for indicators U1 and U4. As discussed above, a few students who disagreed with some ease-of-use indicators also disagreed with usefulness indicators and specifically had 2–3 years of professional work experience. Thus, for this indicator, the more experienced students indicated lower satisfaction. For indicator U4, the average and the median values for the students with 0–1 and 4–5 years of work experience are the same, but the former is highlighted in the table based on its lower standard deviation and higher category population (eight students compared to four students). The frequency of responses for each of the perceived ease-of-use indicators is presented in Figure 6.
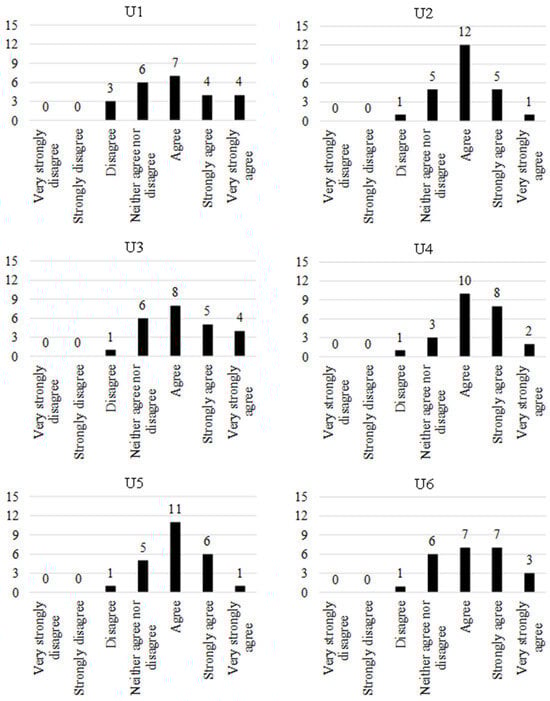
Figure 6.
Frequency of the responses for the perceived usefulness indicators (U1–U6).
6.2. Identify the Improvement Opportunities
As mentioned above, the proof-of-concept MaPS Sustainability Analysis tool applies the UMP modeling approach to quantify a number of sustainability performance metrics for assessing different manufacturing processes and systems on the basis of economic, environmental, and social impacts. Currently, the numerical models for selected UMPs and supply chain locations, routes, and transportation modes are implemented as spreadsheet models in the tool. Thus, a necessary advancement to enhanced functionality and usability would require model and interface development, and should enable users to evaluate a range of material, product, process, and supply chain options. While this development would be a significant undertaking, requiring a team of modelers and developers, a number of opportunities have been identified to improve the user study as well as the operational performance of the tool, as discussed in the following sections.
6.2.1. Opportunities for User Study Improvement
Although the results obtained from this study allowed conclusions to be drawn about the operational performance of the existing proof-of-concept tool, modifications to the study methods would ensure consistency of responses, clarify the intension of the study purpose, and involve broader user communities. First, it was found that survey wording may have led to some confusion. For example, from the comments reported above, the use of “job” was interpreted by one participant as working in a real-world industry. The student did not interpret the activities completed in the learning setting as a “job.” The survey could be clarified to indicate that conducting sustainability performance assessment as part of the learning activities or a class project is analogous to completing a job in the industry. For instance, “job” in all the indicator statements could be replaced with “design project”.
Although ME 413, MFGE 336, and MFGE 337 at OSU have large enrollments, the total number of participants recruited was less than 10% for each class, which may be attributed to remote learning during the pandemic. To increase the number of participants, the learning activities could be added as part of a course project or offered as an extra-credit assignment. To recruit more students, additional reminders could be sent, class or lab time could be set aside and devoted to the activity, or more generous compensation could be offered (e.g., higher assignment points or a higher monetary reward—a $15 gift card was given to OSU participants).
In addition to increasing the sample size, more precautions should be applied (e.g., methodology, results, implications, conclusion) to better mitigate confirmation bias [64,65,66]. It was noted above that only one female user participated in this study. A diversity of problem-solving styles within and across gender groups results in diverse ways of interpretation and approaches to analysis [67,68]. To confirm the MaPS Sustainability Analysis tool functions in a manner that is inclusive of all users, a diverse set of participants should be recruited to provide their opinions and feedback about the tool [69].
6.2.2. Improving Software Functionality and Usability
Software functionality relates to the ability of the tool to provide the user with the functions needed to perform their tasks [70], while software usability refers to the efficiency, effectiveness, satisfaction, and learnability of the tool [71]. Study participants found the limited flexibility of the tool as its largest potential deficiency, with a mean value of responses of 4.63 (neither agree nor disagree). A more formalized software development process could be undertaken to improve software functionality [72]. This can be performed by applying software design paradigms that have been developed and implemented for defining operational characteristics. It should be noted that software development teams apply agile, iterative techniques to ensure that user needs are well-defined and attended to by the resulting tool. Thus, the whole team would be able to focus on the key software tool attributes mentioned above [71].
In the case here, the efficiency of the MaPS Sustainability Analysis tool could be improved by implementing the functions in a dedicated software tool, rather than employing a spreadsheet-based solution. To achieve this, alternate programming languages such as Java, JavaScript, and Python could be considered [73]. Considering the capabilities of these languages for improving efficiency (e.g., portability, existing web frameworks/libraries, web service security, and built-in graphical user interfaces (GUIs)), they can provide a platform for tool developers to improve software flexibility, which would also contribute to higher efficiency [74,75]. In addition to improving efficiency, a more flexible tool with a broader set of features (e.g., a more user-friendly GUI) would greatly improve its learnability [76,77,78]. A more sophisticated GUI would also improve the effectiveness of the tool, as well as higher user satisfaction as they interact with the tool [79,80]. For example, representation of the myriad quantitative results from sustainability assessment can be improved by applying data visualization, such as bubble charts and tree maps [81]. Improved data visualization will enable nonexpert decision-makers to better understand the quantitative sustainability assessment results and assist them in evaluating sustainability performance of the intended product [82,83].
Finally, as part of future software development, new UMP models could be developed for different processes and added to the tool. This added functionality would equip students and industry users with additional flexibility in assessing products of their own design, especially products that utilize different and varied materials and geometries in their designs. These product designs would likely require more complex supply chains, which would also necessitate added supply chain modeling and analysis functionality.
6.3. Implement the Improvement(s)
The last task is to implement the required changes and start the PDSA Cycle again to verify the effect of the changes. Herein, this task is not accomplished since the CooL:SLiCE project ended without additional funding to support continued efforts.
7. Summary
The MaPS Sustainability Analysis tool was used by 24 undergraduate and graduate engineering students recruited for this study from TAU and OSU. The students completed several learning activities to assess and improve the sustainability performance of their product design or a hexacopter design provided by the research team. Students designed polymer or metal products that could be produced using polymer injection molding, fused deposition modeling, laser powder bed fusion, milling, drilling, extrusion, and metal injection molding. The students were between 21 and 32 years old and were studying industrial, manufacturing, and mechanical engineering, or related fields. One participant was female and four participants had more than 4 years of work experience.
Numerical analysis of survey responses found that the median of each of six indicators for two software operational effectiveness metrics (i.e., ease of use and usefulness) were either 5 (agree) or 6 (strongly agree). The mean values of responses ranged from 4.63–5.75 —with only indicator E4, relating to the tool’s flexibility, falling under 5 (agree). The results of this study show that the participants who evaluated the MaPS Sustainability Analysis tool found it easy to use and agreed that it would be useful in analyzing and improving product design, supply chain, and manufacturing process sustainability performance. However, it was also clear that the tool’s flexibility needs to be improved, which would require moving beyond the proof of concept to a more functional and usable software tool [84].
8. Conclusions
The MaPS Sustainability Analysis tool was developed as a part of a broader multi-university project to develop a cyber-based platform to educate engineering students on sustainable design and manufacturing concepts [38]. The tool, reported in a separate study [29], addresses the deficiencies of existing methods and tools to support nonexpert decision-makers in quantifying and evaluating the environmental, economic, and social impacts of product design changes on manufacturing processes and supply chain networks. The objective of the research presented herein was to evaluate the operational performance of the MaPS Sustainability Analysis tool in terms of the ease-of-use and usefulness metrics. To do so, a survey-based method, the Technology Acceptance Model (TAM), was applied due to its broad acceptance, technical simplicity, and flexibility.
In evaluating the operational performance of the MaPS Sustainability Analysis tool by surveying two dozen undergraduate and graduate engineering students across different programs, program levels, and universities, it was found that this proof-of-concept tool was perceived to be easy to use and useful in completing sustainability assessment tasks in product design and manufacturing. In fact, the median responses showed agreement with all 12 standard TAM indicators for the two metrics. Several opportunities for improving the user study and software functionality and usability were identified as a result of administering this study and analyzing student feedback.
It was found that future research should focus on improving the functionality of the MaPS Sustainability Analysis tool. First, operational performance of the tool should be defined to ensure that it functions in a manner that is inclusive of all users. This can be aided by recruiting a diverse set of participants to provide their opinions and feedback on operational characteristics and GUIs. Key attributes of efficiency, effectiveness, satisfaction, and learnability should also be investigated to improve software functionality. Second, different programming languages should be reviewed to evaluate their suitability for a more functional and usable tool. A dedicated software tool should be developed to implement the basic functions of the MaPS Sustainability Analysis tool, while improving its efficiency. These developments will also improve the tool’s flexibility, which was identified as a key drawback of the current spreadsheet-based proof of concept. Other tool attributes (e.g., learnability) can be improved by a more flexible tool. A more user-friendly GUI, for example, will shorten the learning curve of a nonexpert user of the tool. User understanding and interpretation of sustainability analysis results can be significantly improved by applying data visualization techniques in the GUI. A more flexible tool with a broader set of features (e.g., a more user-friendly GUI) will improve user satisfaction when using the tool to conduct a sustainability impact assessment of a product under study.
The proof-of-concept MaPS Sustainability Analysis tool incorporates a number of additive and subtractive UMP models to quantify performance metrics in producing polymer and metal products. To improve the effectiveness of the tool, a broader range of UMP models should be adopted from the existing literature and added to the tool. To do so, the requisite parameters and variables in each candidate model for quantifying the economic, environmental, and social performance metrics should be identified. Next, the information sections in each of the four tool modules should be reviewed to ensure that the required inputs for the key parameters are available and queried from the user. Then, by using numerical formulations (transformation equations), the data contained in the information sections should be connected to the key parameters of the numerical UMP model in the analysis sections of each module. Continuous advancement and improved tool utility will require new numerical models to be developed and added to support the analysis of a range of products, manufacturing processes, and supply chains. Such a tool offers an educational platform for interdisciplinary student collaborations, where computer science and engineering students can complete software development tasks while students from other engineering disciplines develop new manufacturing process and system models and design and analyze new products, manufacturing systems, and product supply chains.
As mentioned above, while this research addresses the educational aspects of the MaPS Sustainability Analysis tool, the associated technical aspects are reported in a separate study [29], which includes the following tasks: (1) identifying the relevant methods and software tools for sustainability assessment of product design, supply chain, and manufacturing process activities; (2) establishing a framework that integrates product design and supply chain information within a mechanistic UMP modeling approach for quantifying manufacturing sustainability performance; and (3) developing a publicly available MaPS Sustainability Analysis tool for nonexperts to conduct sustainability performance analysis. This separate study also reports a supporting framework for integrated design and manufacturing sustainability assessment including four phases (i.e., product development, supply chain configuration, manufacturing process design, and MaPS sustainability analysis) as well as the development of the MaPS Sustainability Analysis tool.
Author Contributions
Conceptualization, K.R. and K.R.H.; methodology, K.R. and K.R.H.; software, K.R. and K.R.H.; validation, K.R. and K.R.H.; formal analysis, K.R. and K.R.H.; investigation, K.R. and K.R.H.; resources, K.R.H.; data curation, K.R. and K.R.H.; writing—original draft preparation, K.R.; writing—review and editing, K.R.H.; visualization, K.R.; supervision, K.R.H.; project administration, K.R.H.; funding acquisition, K.R.H. All authors have read and agreed to the published version of the manuscript.
Funding
This material is based upon work supported by the U.S. National Science Foundation under Grant Nos. DUE-1432774 at Oregon State University, DUE-1431481 at Wayne State University, and DUE-1431739 at Pennsylvania State University.
Institutional Review Board Statement
Study IRB-2020-0609 was acknowledged by the Oregon State University (OSU) Institutional Review Board (IRB) on 6 May 2020. The OSU IRB determined that the protocol met the minimum criteria for approval under the applicable regulations pertaining to human research protections. Study design and scientific merit were evaluated to the extent required to determine that the regulatory criteria for approval were met (U.S. Office for Human Research Protections (OHRP) Common Rule: 45CFR46.111(a)(1)(i), 45CFR46.111(a)(2)).
Informed Consent Statement
Informed consent was obtained from all subjects involved in this study.
Data Availability Statement
The data presented in this study are available on request from the corresponding author.
Conflicts of Interest
The authors declare no conflicts of interest.
References
- UNESCO. Education for Sustainable Development Goals: Learning Objectives; United Nations Educational, Scientific and Cultural Organization: Paris, France, 2017; ISBN 978-92-3-100209-0. [Google Scholar]
- United Nations (UN). Sustainable Development Goals (SDGs). Available online: https://www.un.org/sustainabledevelopment/sustainable-development-goals/ (accessed on 26 May 2024).
- United Nations (UN) Global Indicator Framework for the Sustainable Development Goals and Targets of the 2030 Agenda for Sustainable Development. Available online: https://unstats.un.org/sdgs/indicators/indicators-list/ (accessed on 26 May 2024).
- Bergeå, O.; Karlsson, R.; Hedlund-Åström, A.; Jacobsson, P.; Luttropp, C. Education for Sustainability as a Transformative Learning Process: A Pedagogical Experiment in EcoDesign Doctoral Education. J. Clean. Prod. 2006, 14, 1431–1442. [Google Scholar] [CrossRef]
- Powers, L.M.; Summers, J.D. Integrating Graduate Design Coaches in Undergraduate Design Project Teams. Int. J. Mech. Eng. Educ. 2009, 37, 3. [Google Scholar] [CrossRef]
- Bremer-Bremer, M.H.; González-Mendívil, E.; Mercado-Field, E.R. Teaching Creativity and Innovation Using Sustainability as Driving Force International. J. Eng. Educ. 2010, 27, 430–437. [Google Scholar]
- von Blottnitz, H.; Case, J.M.; Fraser, D.M. Sustainable Development at the Core of Undergraduate Engineering Curriculum Reform: A New Introductory Course in Chemical Engineering. J. Clean. Prod. 2015, 106, 300–307. [Google Scholar] [CrossRef]
- Lozano, F.J.; Lozano, R. Developing the Curriculum for a New Bachelor’s Degree in Engineering for Sustainable Development. J. Clean. Prod. 2014, 64, 136–146. [Google Scholar] [CrossRef]
- Romero, S.; Aláez, M.; Amo, D.; Fonseca, D. Systematic Review of How Engineering Schools around the World Are Deploying the 2030 Agenda. Sustainability 2020, 12, 5035. [Google Scholar] [CrossRef]
- Arefin, M.A.; Nabi, M.N.; Sadeque, S.; Gudimetla, P. Incorporating Sustainability in Engineering Curriculum: A Study of the Australian Universities. Int. J. Sustain. High. Educ. 2021, 22, 576–598. [Google Scholar] [CrossRef]
- Mulder, K.F. Engineering Curricula in Sustainable Development. An Evaluation of Changes at Delft University of Technology. Eur. J. Eng. Educ. 2006, 31, 133–144. [Google Scholar] [CrossRef]
- Meyer, M.D.; Jacobs, L.J. A Civil Engineering Curriculum for the Future: The Georgia Tech Case. J. Prof. Issues Eng. Educ. Pract. 2000, 126, 74–78. [Google Scholar] [CrossRef]
- Raoufi, K.; Paul, B.K.; Haapala, K.R. Development and Implementation of a Framework for Adaptive Undergraduate Curricula in Manufacturing Engineering. Smart Sustain. Manuf. Syst. 2020, 5, 60–79. [Google Scholar] [CrossRef]
- Schäfer, A.I.; Richards, B.S. From Concept to Commercialisation: Student Learning in a Sustainable Engineering Innovation Project. Eur. J. Eng. Educ. 2007, 32, 143–165. [Google Scholar] [CrossRef]
- Quist, J.; Rammelt, C.; Overschie, M.; de Werk, G. Backcasting for Sustainability in Engineering Education: The Case of Delft University of Technology. J. Clean. Prod. 2006, 14, 868–876. [Google Scholar] [CrossRef]
- McLaughlan, R.G. Instructional Strategies to Educate for Sustainability in Technology Assessment. Int. J. Eng. Educ. 2007, 23, 201–208. [Google Scholar]
- Boks, C.; Diehl, J.C. Integration of Sustainability in Regular Courses: Experiences in Industrial Design Engineering. J. Clean. Prod. 2006, 14, 932–939. [Google Scholar] [CrossRef]
- Zizka, L.; McGunagle, D.M.; Clark, P.J. Sustainability in Science, Technology, Engineering and Mathematics (STEM) Programs: Authentic Engagement through a Community-Based Approach. J. Clean. Prod. 2021, 279, 123715. [Google Scholar] [CrossRef]
- Leifler, O.; Dahlin, J.-E. Curriculum Integration of Sustainability in Engineering Education—A National Study of Programme Director Perspectives. Int. J. Sustain. High. Educ. 2020, 21, 877–894. [Google Scholar] [CrossRef]
- Sánchez-Carracedo, F.; Moreno-Pino, F.M.; Sureda, B.; Antúnez, M.; Gutiérrez, I. A Methodology to Analyze the Presence of Sustainability in Engineering Curricula. Case of Study: Ten Spanish Engineering Degree Curricula. Sustainability 2019, 11, 4553. [Google Scholar] [CrossRef]
- Thürer, M.; Tomašević, I.; Stevenson, M.; Qu, T.; Huisingh, D. A Systematic Review of the Literature on Integrating Sustainability into Engineering Curricula. J. Clean. Prod. 2018, 181, 608–617. [Google Scholar] [CrossRef]
- Sharma, B.; Steward, B.; Ong, S.K.; Miguez, F.E. Evaluation of Teaching Approach and Student Learning in a Multidisciplinary Sustainable Engineering Course. J. Clean. Prod. 2017, 142, 4032–4040. [Google Scholar] [CrossRef]
- Ferster, B. Teaching Machines: Learning from the Intersection of Education and Technology; JHU Press: Baltimore, MD, USA, 2014. [Google Scholar]
- Gutierrez-Bucheli, L.; Kidman, G.; Reid, A. Sustainability in Engineering Education: A Review of Learning Outcomes. J. Clean. Prod. 2022, 330, 129734. [Google Scholar] [CrossRef]
- Rampasso, I.S.; Quelhas, O.L.G.; Anholon, R.; Pereira, M.B.; Miranda, J.D.A.; Alvarenga, W.S. Engineering Education for Sustainable Development: Evaluation Criteria for Brazilian Context. Sustainability 2020, 12, 3947. [Google Scholar] [CrossRef]
- Brundage, M.P.; Bernstein, W.Z.; Hoffenson, S.; Chang, Q.; Nishi, H.; Kliks, T.; Morris, K.C. Analyzing Environmental Sustainability Methods for Use Earlier in the Product Lifecycle. J. Clean. Prod. 2018, 187, 877–892. [Google Scholar] [CrossRef]
- Santolaria, M.; Oliver-Solà, J.; Gasol, C.M.; Morales-Pinzón, T.; Rieradevall, J. Eco-Design in Innovation Driven Companies: Perception, Predictions and the Main Drivers of Integration. The Spanish Example. J. Clean. Prod. 2011, 19, 1315–1323. [Google Scholar] [CrossRef]
- Rossi, M.; Germani, M.; Zamagni, A. Review of Ecodesign Methods and Tools. Barriers and Strategies for an Effective Implementation in Industrial Companies. J. Clean. Prod. 2016, 129, 361–373. [Google Scholar] [CrossRef]
- Raoufi, K. Integrated Manufacturing Process and System Analysis to Assist Sustainable Product Design. Ph.D. Dissertation, Oregon State University, Corvallis, OR, USA, 2020. [Google Scholar]
- Seay, J.R. Education for Sustainability: Developing a Taxonomy of the Key Principles for Sustainable Process and Product Design. Comput. Chem. Eng. 2015, 81, 147–152. [Google Scholar] [CrossRef]
- Ahmad, S.; Wong, K.Y.; Tseng, M.L.; Wong, W.P. Sustainable Product Design and Development: A Review of Tools, Applications and Research Prospects. Resour. Conserv. Recycl. 2018, 132, 49–61. [Google Scholar] [CrossRef]
- Han, F.; Ellis, R.A. Identifying Consistent Patterns of Quality Learning Discussions in Blended Learning. Internet High. Educ. 2019, 40, 12–19. [Google Scholar] [CrossRef]
- Hearns, M.K.; Miller, B.K.; Nelson, D.L. Hands-On Learning versus Learning by Demonstration at Three Recall Points in University Students. OTJR Occup. Particip. Health 2010, 30, 169–171. [Google Scholar] [CrossRef]
- Shu, H.; Gu, X. Determining the Differences between Online and Face-to-Face Student–Group Interactions in a Blended Learning Course. Internet High. Educ. 2018, 39, 13–21. [Google Scholar] [CrossRef]
- Zacharis, N.Z. A Multivariate Approach to Predicting Student Outcomes in Web-Enabled Blended Learning Courses. Internet High. Educ. 2015, 27, 44–53. [Google Scholar] [CrossRef]
- Raoufi, K.; Haapala, K.R. Manufacturing Process and System Sustainability Analysis Tool: A Proof-of-Concept for Teaching Sustainable Product Design and Manufacturing Engineering. J. Manuf. Sci. Eng. 2023, 146, 020904. [Google Scholar] [CrossRef]
- Deming, W.E. Elementary Principles of the Statistical Control of Quality: A Series of Lectures; Japanese Union of Scientists and Engineers: Tokyo, Japan, 1950. [Google Scholar]
- Raoufi, K.; Park, K.; Hasan Khan, M.T.; Haapala, K.R.; Psenka, C.E.; Jackson, K.L.; Kremer, G.E.O.; Kim, K.-Y. A Cyberlearning Platform for Enhancing Undergraduate Engineering Education in Sustainable Product Design. J. Clean. Prod. 2019, 211, 730–741. [Google Scholar] [CrossRef]
- Kellens, K.; Dewulf, W.; Overcash, M.; Hauschild, M.Z.; Duflou, J.R. Methodology for Systematic Analysis and Improvement of Manufacturing Unit Process Life Cycle Inventory (UPLCI) CO2PE! Initiative (Cooperative Effort on Process Emissions in Manufacturing). Part 2: Case Studies. Int. J. Life Cycle Assess. 2012, 17, 242–251. [Google Scholar] [CrossRef]
- Kellens, K.; Dewulf, W.; Overcash, M.; Hauschild, M.Z.; Duflou, J.R. Methodology for Systematic Analysis and Improvement of Manufacturing Unit Process Life Cycle Inventory (UPLCI) CO2PE! Initiative (Cooperative Effort on Process Emissions in Manufacturing). Part 1: Methodology Description. Int. J. Life Cycle Assess. 2012, 17, 69–78. [Google Scholar] [CrossRef]
- Linke, B.; Overcash, M. Reusable Unit Process Life Cycle Inventory for Manufacturing: Grinding. Prod. Eng. Res. Dev. 2017, 11, 643–653. [Google Scholar] [CrossRef]
- Overcash, M.; Twomey, J.; Kalla, D. Unit Process Life Cycle Inventory for Product Manufacturing Operations. In Proceedings of the ASME International Manufacturing Science and Engineering Conference, West Lafayette, IN, USA, 4–7 October 2009; pp. 49–55. [Google Scholar]
- Raoufi, K.; Harper, D.S.; Haapala, K.R. Reusable Unit Process Life Cycle Inventory for Manufacturing: Metal Injection Molding. Prod. Eng.—Res. Dev. 2020, 14, 707–716. [Google Scholar] [CrossRef]
- Ramirez-Cedillo, E.; García-López, E.; Ruiz-Huerta, L.; Rodriguez, C.A.; Siller, H.R. Reusable Unit Process Life Cycle Inventory (UPLCI) for Manufacturing: Laser Powder Bed Fusion (L-PBF). Prod. Eng. Res. Dev. 2021, 15, 701–716. [Google Scholar] [CrossRef]
- Simon, T.; Yang, Y.; Lee, W.J.; Zhao, J.; Li, L.; Zhao, F. Reusable Unit Process Life Cycle Inventory for Manufacturing: Stereolithography. Prod. Eng. Res. Dev. 2019, 13, 675–684. [Google Scholar] [CrossRef]
- Zhang, H.; Zhao, F. Reusable Unit Process Life Cycle Inventory for Manufacturing: Gas Metal Arc Welding. Prod. Eng. Res. Dev. 2019, 13, 89–97. [Google Scholar] [CrossRef]
- Madan, J.; Mani, M.; Lee, J.H.; Lyons, K.W. Energy Performance Evaluation and Improvement of Unit-Manufacturing Processes: Injection Molding Case Study. J. Clean. Prod. 2015, 105, 157–170. [Google Scholar] [CrossRef]
- Cerdas, F.; Juraschek, M.; Thiede, S.; Herrmann, C. Life Cycle Assessment of 3D Printed Products in a Distributed Manufacturing System. J. Ind. Ecol. 2017, 21, S80–S93. [Google Scholar] [CrossRef]
- Fernandez, A.; Insfran, E.; Abrahão, S. Usability Evaluation Methods for the Web: A Systematic Mapping Study. Inf. Softw. Technol. 2011, 53, 789–817. [Google Scholar] [CrossRef]
- Ozel, D.; Bilge, U.; Zayim, N.; Cengiz, M. A Web-Based Intensive Care Clinical Decision Support System: From Design to Evaluation. Inform. Health Soc. Care 2013, 38, 79–92. [Google Scholar] [CrossRef] [PubMed]
- Samson, L.L.; Pape-Haugaard, L.B.; Søgaard, M.; Schønheyder, H.C.; Hejlesen, O.K. Participatory Heuristic Evaluation of a Tablet Computer System for Clinical Microbiology. Stud Health Technol Inf. 2014, 205, 910–914. [Google Scholar]
- Hasan, L.; Morris, A.; Probets, S. A Comparison of Usability Evaluation Methods for Evaluating E-Commerce Websites. Behav. Inf. Technol. 2012, 31, 707–737. [Google Scholar] [CrossRef]
- Kaur, S.; Kaur, K.; Kaur, P. Analysis of Website Usability Evaluation Methods. In Proceedings of the 2016 3rd International Conference on Computing for Sustainable Global Development (INDIACom), New Delhi, India, 16–18 March 2016; pp. 1043–1046. [Google Scholar]
- Paz, F.; Pow-Sang, J.A. A Systematic Mapping Review of Usability Evaluation Methods for Software Development Process. Int. J. Softw. Eng. Its Appl. 2016, 10, 165–178. [Google Scholar] [CrossRef]
- Davis, F.D. Perceived Usefulness, Perceived Ease of Use, and User Acceptance of Information Technology. MIS Q. 1989, 13, 319–340. [Google Scholar] [CrossRef]
- Babar, M.A.; Winkler, D.; Biffl, S. Evaluating the Usefulness and Ease of Use of a Groupware Tool for the Software Architecture Evaluation Process. In Proceedings of the First International Symposium on Empirical Software Engineering and Measurement (ESEM 2007), Madrid, Spain, 20–21 September 2007; pp. 430–439. [Google Scholar]
- Adelson, J.L.; McCoach, D.B. Measuring the Mathematical Attitudes of Elementary Students: The Effects of a 4-Point or 5-Point Likert-Type Scale. Educ. Psychol. Meas. 2010, 70, 796–807. [Google Scholar] [CrossRef]
- Leung, S.-O. A Comparison of Psychometric Properties and Normality in 4-, 5-, 6-, and 11-Point Likert Scales. J. Soc. Serv. Res. 2011, 37, 412–421. [Google Scholar] [CrossRef]
- Gwinner, C.; Infosurv White Paper: 5-Point vs. 6-Point Likert Scales. Infosurv Online Research Service. Available online: https://www.infosurv.com/wp-content/uploads/2011/01/Likert_Scale_Debate.pdf (accessed on 1 July 2024).
- Joshi, A.; Kale, S.; Chandel, S.; Pal, D.K. Likert Scale: Explored and Explained. Curr. J. Appl. Sci. Technol. 2015, 7, 396–403. [Google Scholar] [CrossRef]
- Mayring, P. On Generalization in Qualitatively Oriented Research. Forum Qual. Sozialforsch./Forum Qual. Soc. Res. 2007, 8, 26. [Google Scholar]
- Boddy, C.R. Sample Size for Qualitative Research. Qual. Mark. Res. Int. J. 2016, 19, 426–432. [Google Scholar] [CrossRef]
- Marshall, B.; Cardon, P.; Poddar, A.; Fontenot, R. Does Sample Size Matter in Qualitative Research?: A Review of Qualitative Interviews in Is Research. J. Comput. Inf. Syst. 2013, 54, 11–22. [Google Scholar] [CrossRef]
- Vedejová, D.; Čavojová, V. Confirmation Bias in Information Search, Interpretation, and Memory Recall: Evidence from Reasoning about Four Controversial Topics. Think. Reason. 2022, 28, 1–28. [Google Scholar] [CrossRef]
- Schumm, W.R. Confirmation Bias and Methodology in Social Science: An Editorial. Marriage Fam. Rev. 2021, 57, 285–293. [Google Scholar] [CrossRef]
- Schwind, C.; Buder, J. Reducing Confirmation Bias and Evaluation Bias: When Are Preference-Inconsistent Recommendations Effective—And When Not? Comput. Hum. Behav. 2012, 28, 2280–2290. [Google Scholar] [CrossRef]
- Burnett, M.; Counts, R.; Lawrence, R.; Hanson, H. Gender HCl and Microsoft: Highlights from a Longitudinal Study. In Proceedings of the 2017 IEEE Symposium on Visual Languages and Human-Centric Computing (VL/HCC), Raleigh, NC, USA, 11–14 October 2017; pp. 139–143. [Google Scholar]
- Chattopadhyay, S.; Nelson, N.; Au, A.; Morales, N.; Sanchez, C.; Pandita, R.; Sarma, A. A Tale from the Trenches: Cognitive Biases and Software Development. In Proceedings of the ACM/IEEE International Conference on Software Engineering, Seoul, Republic of Korea, 27 June–19 July 2020. [Google Scholar]
- Hilderbrand, C.; Perdriau, C.; Letaw, L.; Emard, J.; Steine-Hanson, Z.; Burnett, M.; Sarma, A. Engineering Gender-Inclusivity into Software: Ten Teams’ Tales from the Trenches. In Proceedings of the ACM/IEEE International Conference on Software Engineering, Seoul, Republic of Korea, 27 June–19 July 2020. [Google Scholar]
- Salleh, M.A.; Bahari, M.; Zakaria, N.H. An Overview of Software Functionality Service: A Systematic Literature Review. Procedia Comput. Sci. 2017, 124, 337–344. [Google Scholar] [CrossRef]
- Sagar, K.; Saha, A. A Systematic Review of Software Usability Studies. Int. J. Inf. Technol. 2017. [Google Scholar] [CrossRef]
- Voorhees, D.P. Introduction to Software Design. In Guide to Efficient Software Design: An MVC Approach to Concepts, Structures, and Models; Voorhees, D.P., Ed.; Texts in Computer Science; Springer International Publishing: Cham, Switzerland, 2020; pp. 1–15. ISBN 978-3-030-28501-2. [Google Scholar]
- Ben Arfa Rabai, L.; Cohen, B.; Mili, A. Programming Language Use in US Academia and Industry. Inform. Educ. 2015, 14, 143–160. [Google Scholar] [CrossRef]
- Swacha, J.; Muszyńska, K. Python and C#: A Comparative Analysis fromsStudents’ Perspective. Ann. Univ. Mariae Curie-Sklodowska Sect. AI—Inform. 2011, 11, 89–101. [Google Scholar]
- Naim, R.; Nizam, M.F.; Hanamasagar, S.; Noureddine, J.; Miladinova, M. Comparative Studies of 10 Programming Languages within 10 Diverse Criteria; COMP 6411—A Comparative Studies of Programming Languages; Concordia University: Montreal, QC, Canada, 2010. [Google Scholar]
- Maheswari, B.; Shanmugam, V. Survey on Graphical User Interface and Machine Learning Based Testing Techniques. J. Artif. Intell. 2014, 7, 96–112. [Google Scholar] [CrossRef][Green Version]
- Almeida, T.; Nogueira, R.; André, P. Graphical User Interfaces for Teaching and Research in Optical Communications. In Proceedings of the ETOP 2013, Porto, Portugal, 23–26 July 2013; Optical Society of America: Washington, DC, USA, 2013; p. EThF4. [Google Scholar]
- Metros, S.E.; Hedberg, J.G. More than Just a Pretty (Inter) Face: The Role of the Graphical User Interface in Engaging Elearners. Q. Rev. Distance Educ. 2002, 3, 191–205. [Google Scholar]
- Findlater, L.; McGrenere, J. Impact of Screen Size on Performance, Awareness, and User Satisfaction with Adaptive Graphical User Interfaces. In Proceedings of the SIGCHI Conference on Human Factors in Computing Systems, Florence, Italy, 5–10 April 2008; Association for Computing Machinery: New York, NY, USA, 2008; pp. 1247–1256. [Google Scholar]
- Patalano, S.; Lanzotti, A.; Del Giudice, D.M.; Vitolo, F.; Gerbino, S. On the Usability Assessment of the Graphical User Interface Related to a Digital Pattern Software Tool. Int. J. Interact. Des. Manuf. 2017, 11, 457–469. [Google Scholar] [CrossRef]
- Harvard Business School Data Visualization Techniques for All Professionals. Available online: https://online.hbs.edu/blog/post/data-visualization-techniques (accessed on 10 August 2020).
- Ramanujan, D.; Bernstein, W.Z.; Chandrasegaran, S.K.; Ramani, K. Visual Analytics Tools for Sustainable Lifecycle Design: Current Status, Challenges, and Future Opportunities. J. Mech. Des. 2017, 139, 111415. [Google Scholar] [CrossRef] [PubMed]
- Raoufi, K.; Taylor, C.; Laurin, L.; Haapala, K.R. Visual Communication Methods and Tools for Sustainability Performance Assessment: Linking Academic and Industry Perspectives. Procedia CIRP 2019, 80, 215–220. [Google Scholar] [CrossRef]
- Mifsud, J. Usability Metrics—A Guide to Quantify the Usability of Any System. Available online: https://usabilitygeek.com/usability-metrics-a-guide-to-quantify-system-usability/ (accessed on 9 August 2020).
Disclaimer/Publisher’s Note: The statements, opinions and data contained in all publications are solely those of the individual author(s) and contributor(s) and not of MDPI and/or the editor(s). MDPI and/or the editor(s) disclaim responsibility for any injury to people or property resulting from any ideas, methods, instructions or products referred to in the content. |
© 2024 by the authors. Licensee MDPI, Basel, Switzerland. This article is an open access article distributed under the terms and conditions of the Creative Commons Attribution (CC BY) license (https://creativecommons.org/licenses/by/4.0/).