
New Interpretation of Human–Land Relation: Differentiated Impacts of Global Demographic Transition on Carbon Emissions


Abstract
1. Introduction
2. Literature Review
2.1. The Relationship between Carbon Emissions and Population Aging
2.2. The Relationship between Carbon Emissions and Population Urbanization
3. Methodology and Data Sources
3.1. Data
3.2. The Carbon Emission Impact Model Based on Demographic Transition
3.3. Operation Mechanism
4. Results
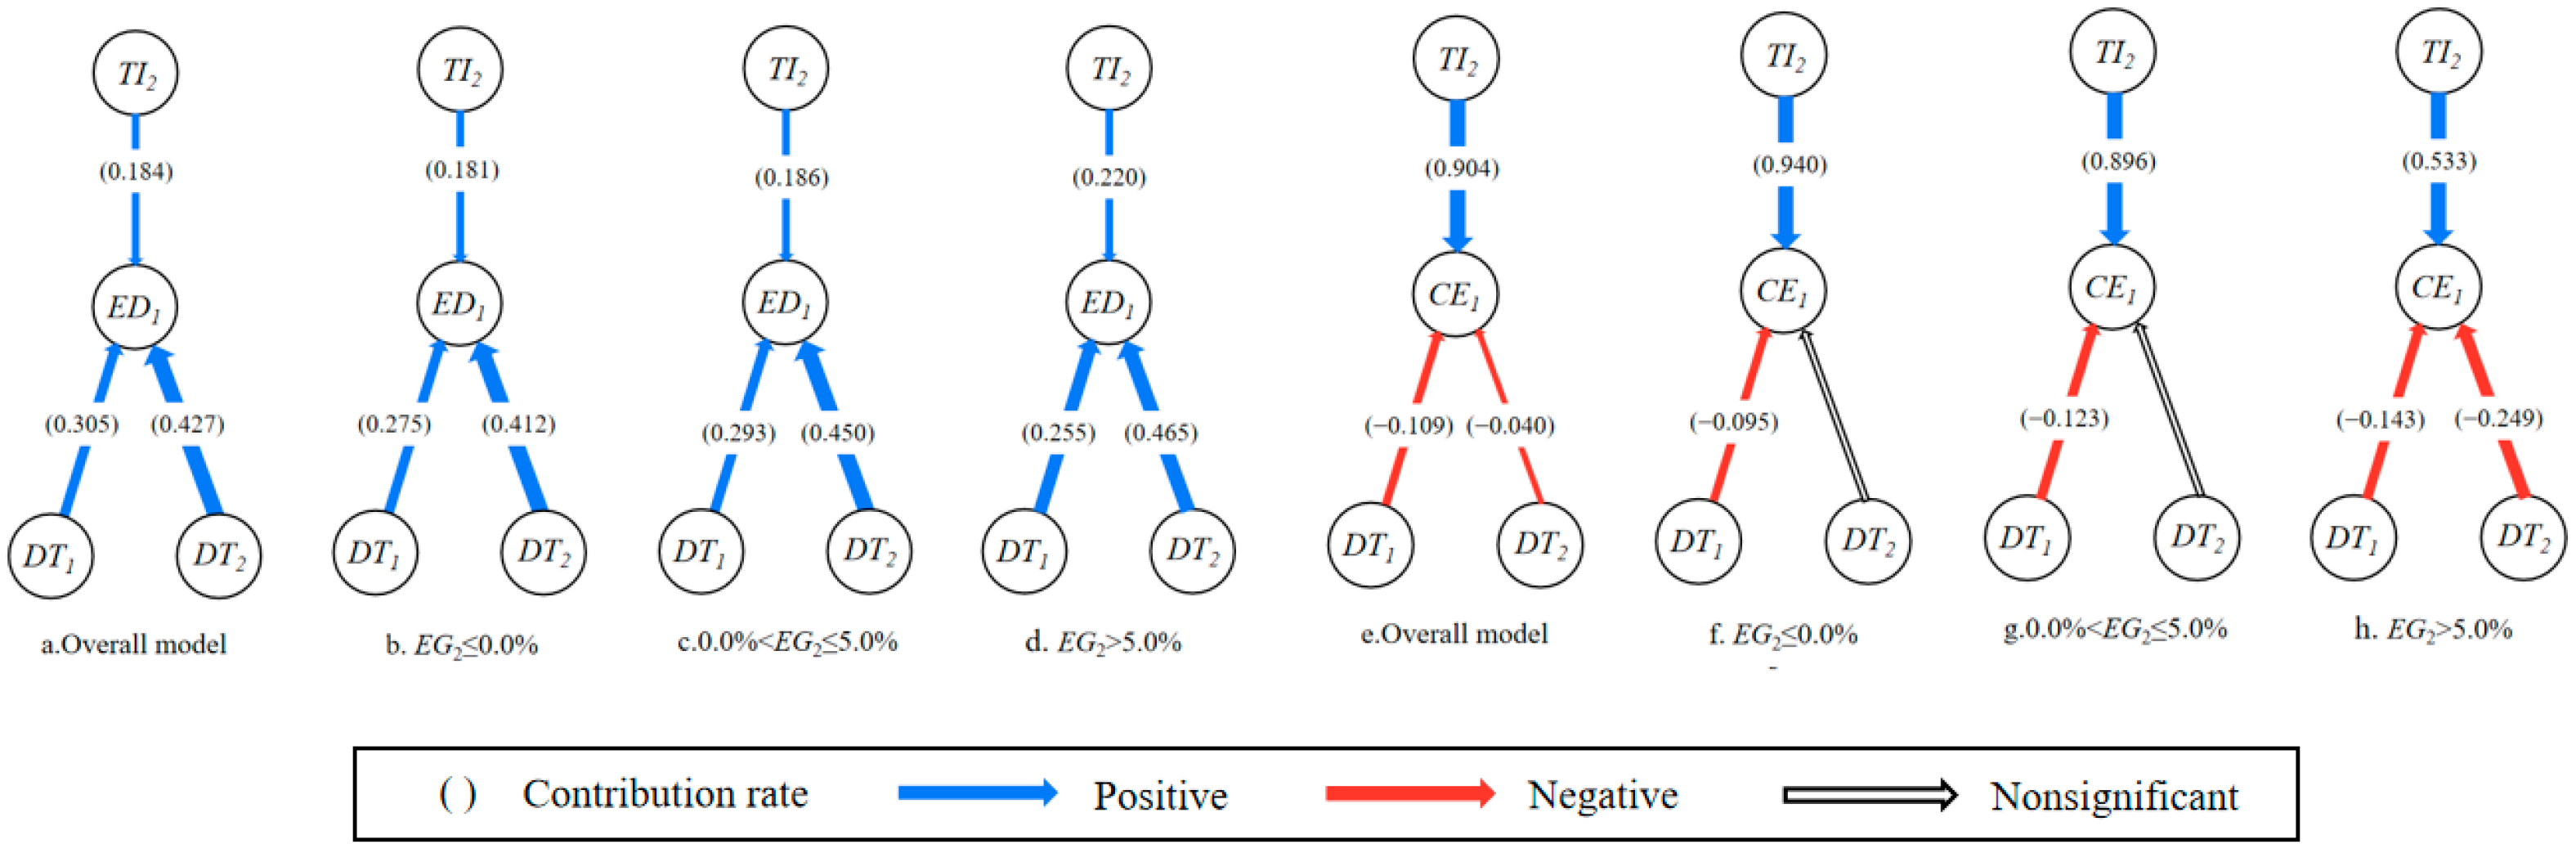
4.1. The Particular Production Function
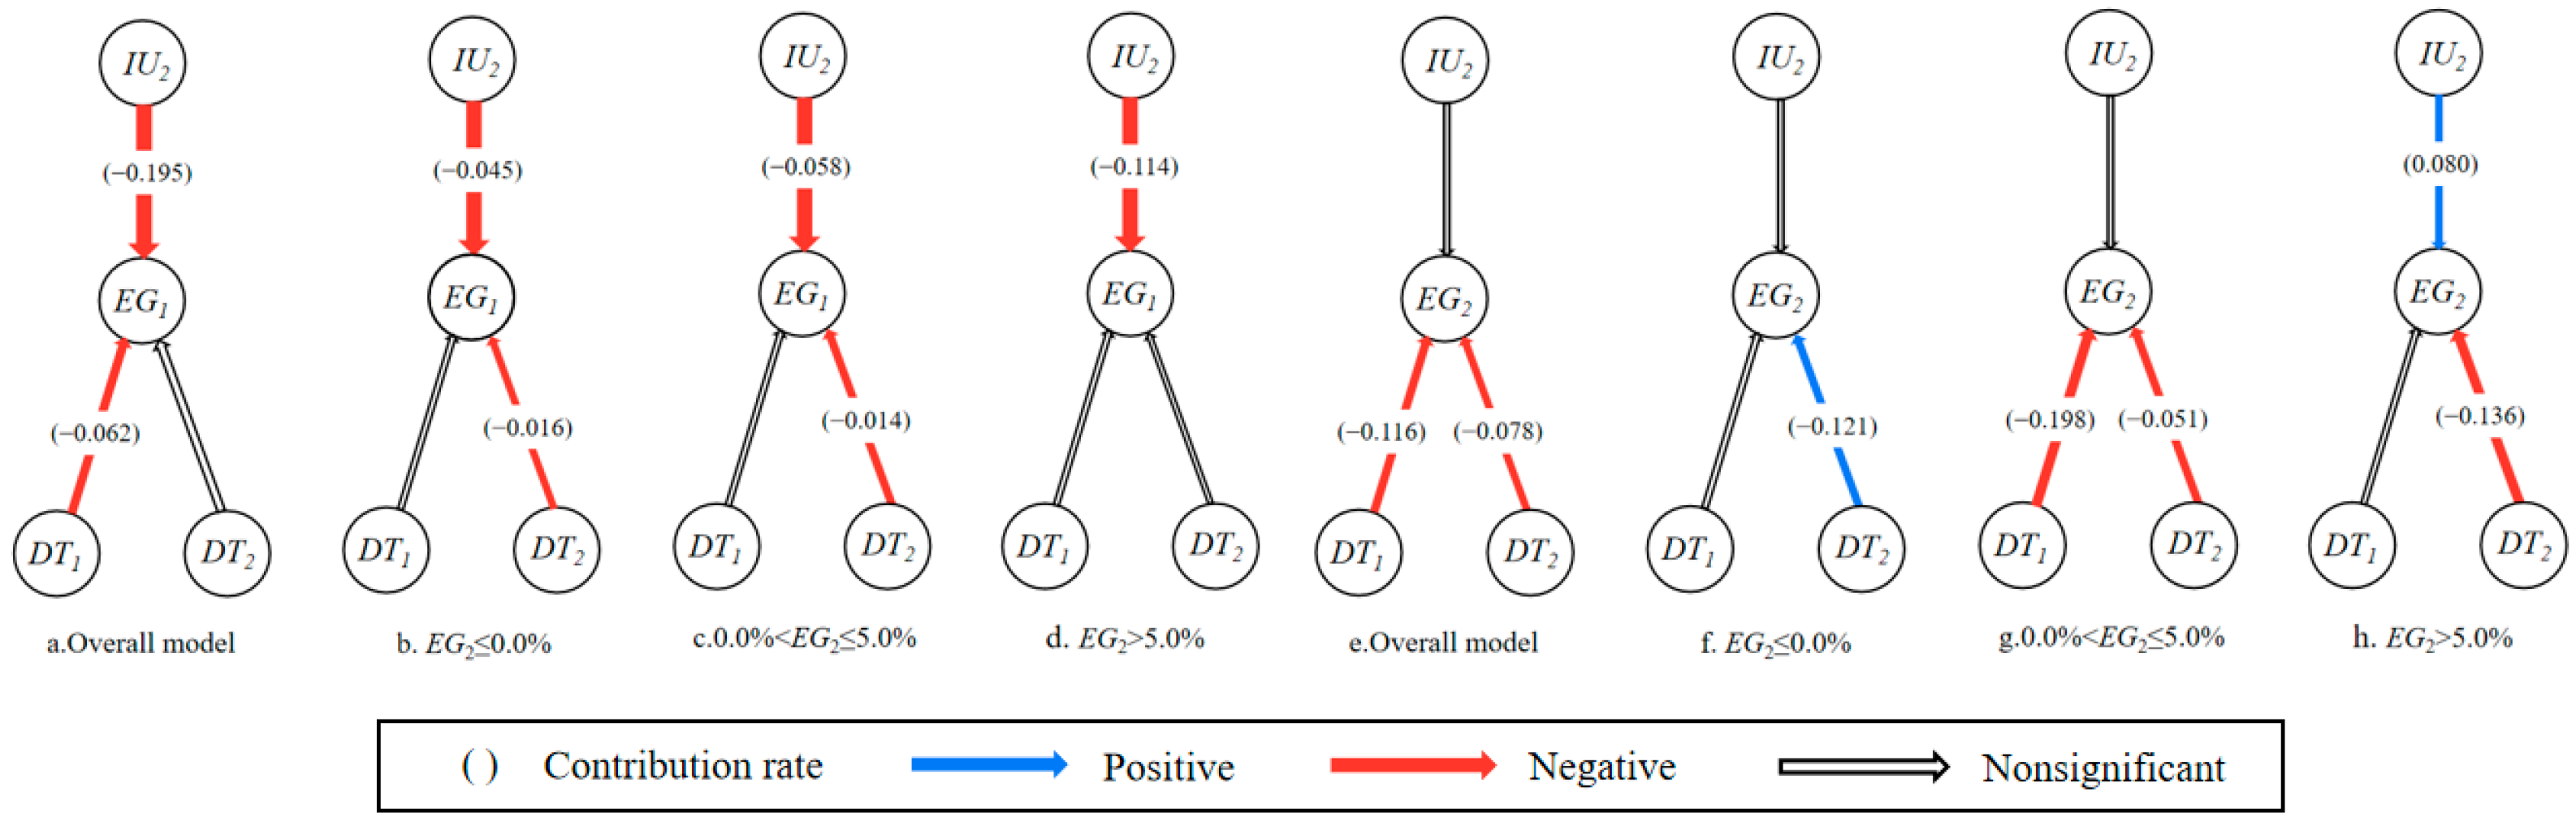
4.2. The Industrial Upgrading Function
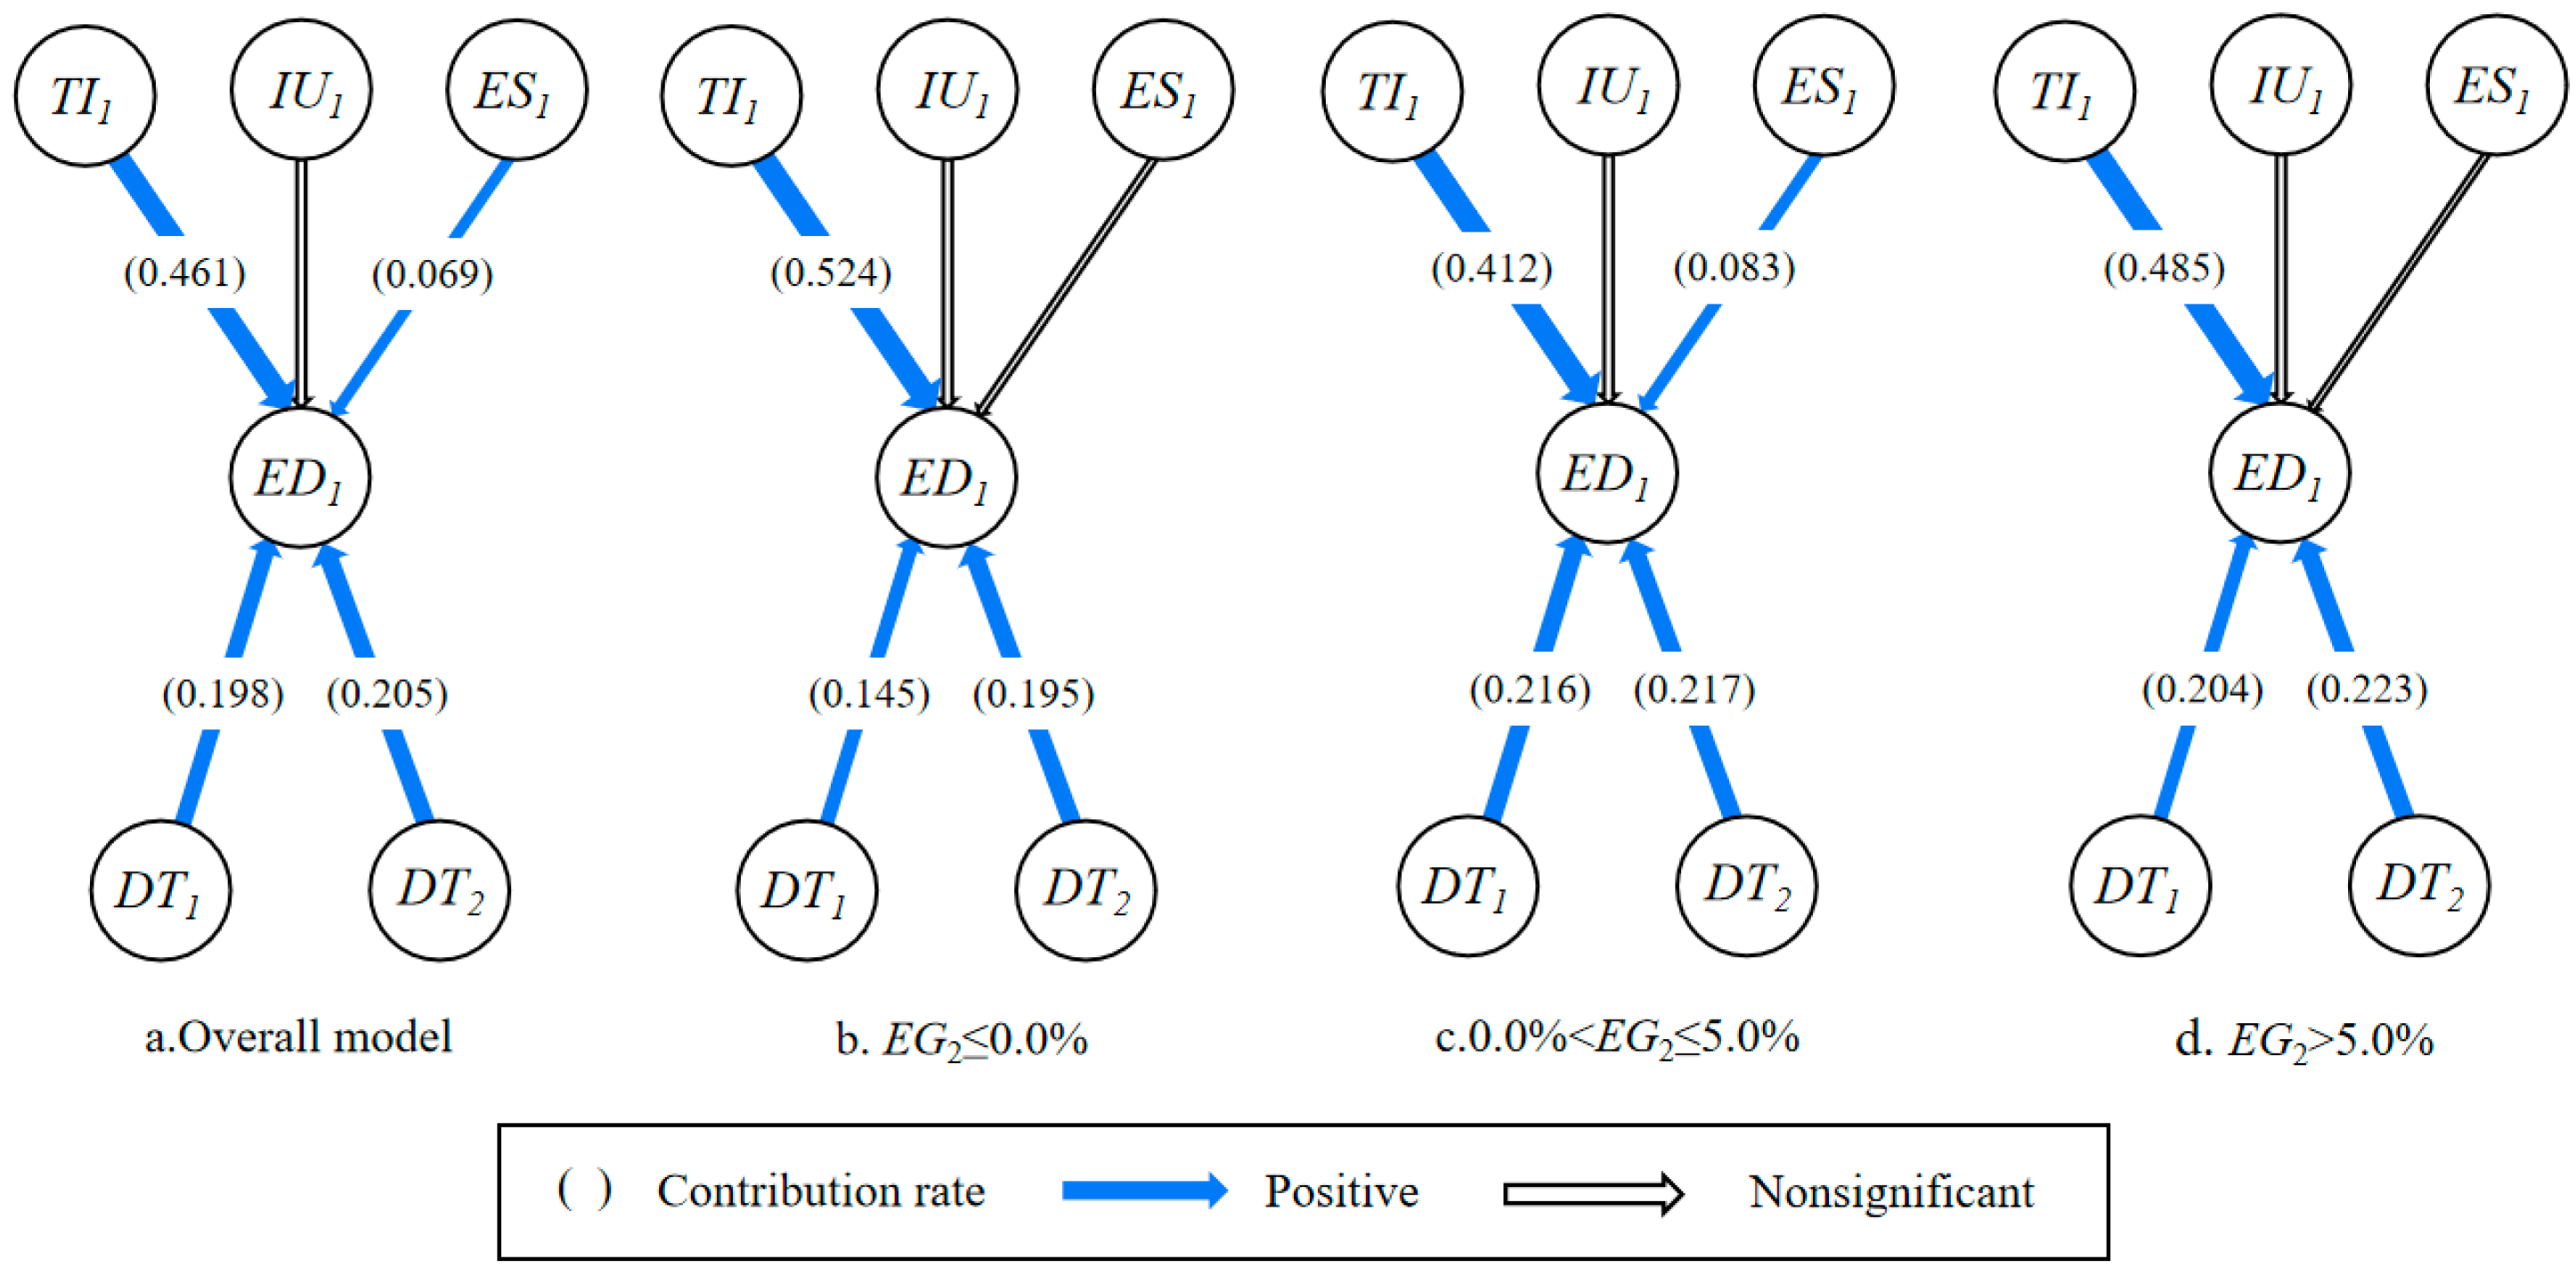
4.3. The Individual Function
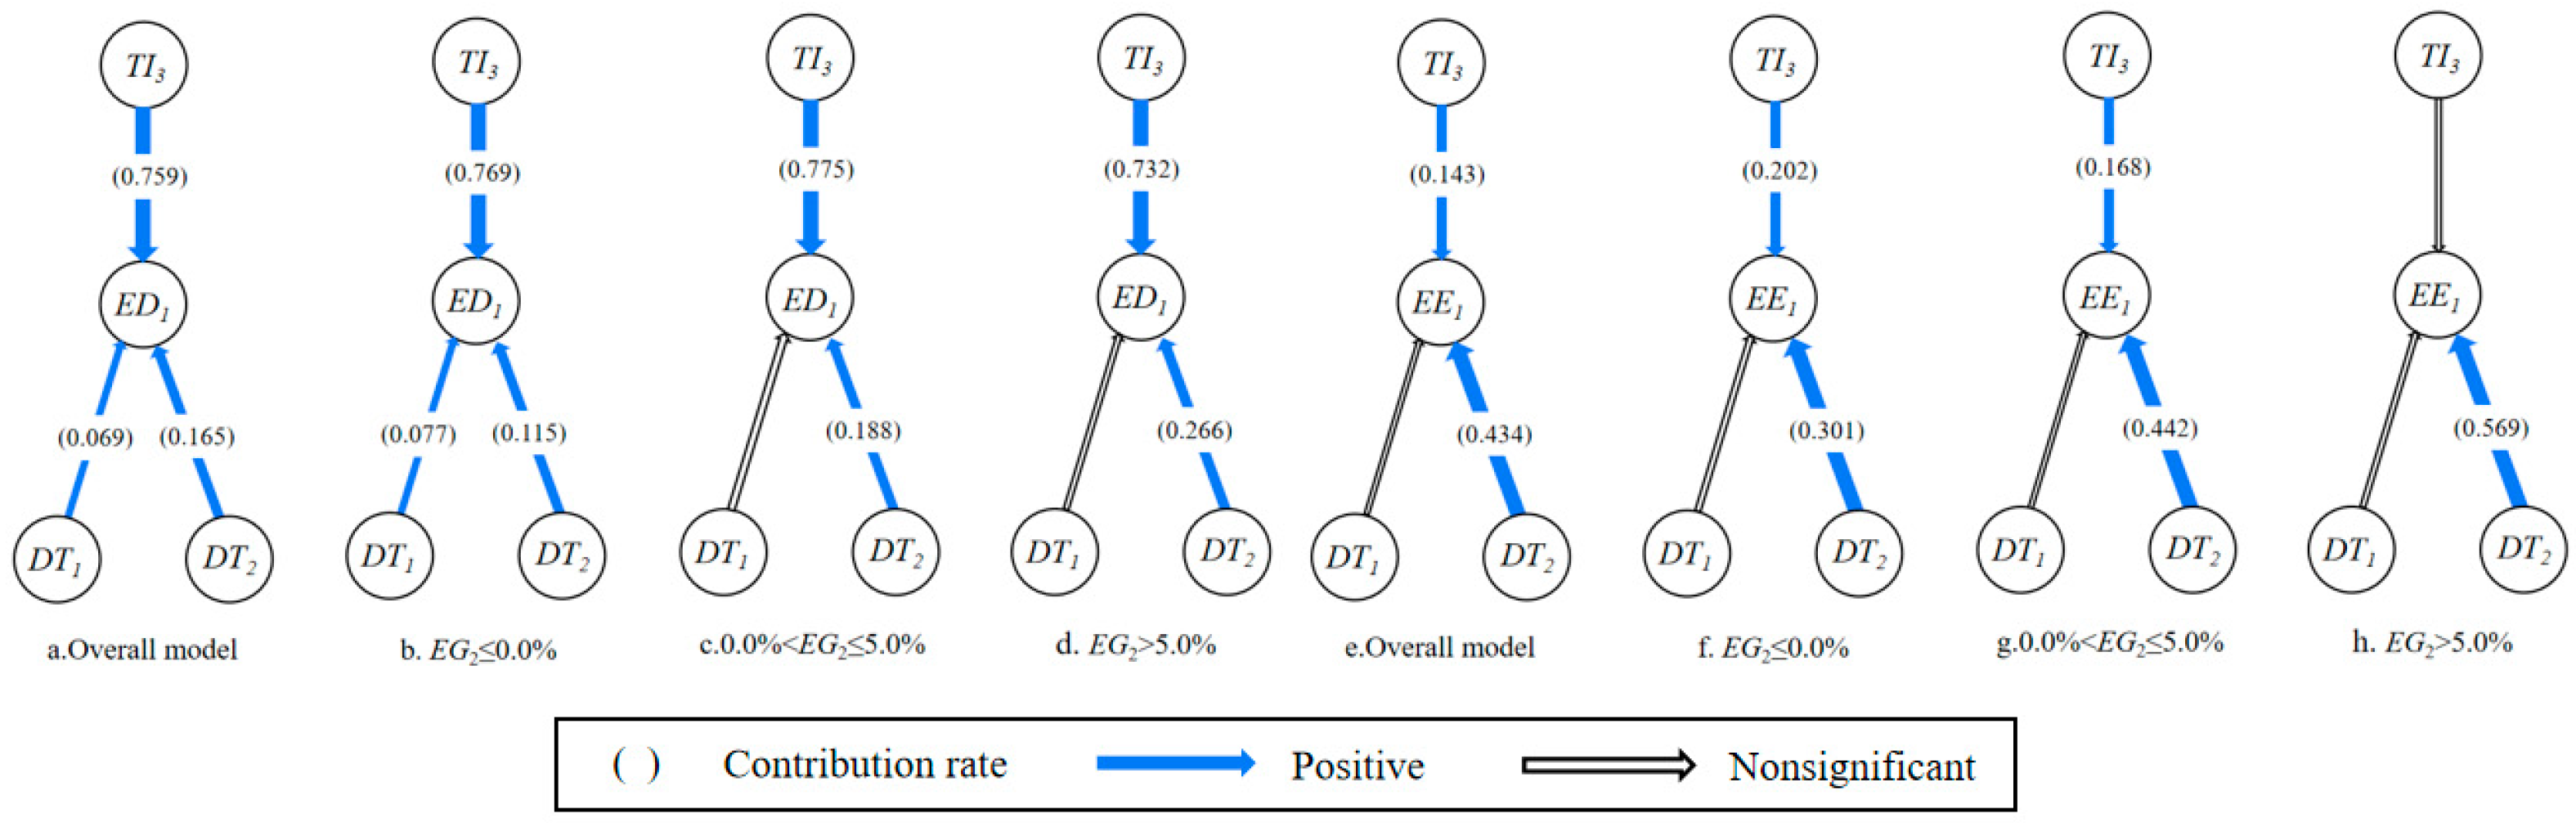
4.4. The Clean Energy Function
5. Discussion
5.1. The Impacts of Demographic Transition on Carbon Emissions
5.2. The EKC Test
6. Conclusions
6.1. Main Conclusions
6.2. Policy Implications
- (1)
- The optimization of energy consumption structures should be pursued globally, with a focus on developing renewable resources, such as solar, nuclear, and tidal energy. Low-carbon industries should be actively developed and encouraged to achieve carbon-peak and carbon-neutral goals in terms of energy consumption.
- (2)
- Enhancements to public transportation networks are essential. With an increasing proportion of elderly individuals who tend to adopt frugal travel habits, there exists an opportunity to reduce carbon emissions within the transportation sector.
- (3)
- Technological innovation should be encouraged. With population urbanization, the agglomeration effect of technological innovation should not be ignored. Enterprises and research institutes can be encouraged to share technologies, such as clean energy and energy efficiency improvement, by setting up economic development zones, research and development funds, and tax incentives.
- (4)
- As there are obvious differences in the levels of global economic development, interregional cooperation should be strengthened to promote high-tech industries in all countries with a low economic level to achieve global energy conservation and emission reduction.
6.3. Research Prospects
Author Contributions
Funding
Institutional Review Board Statement
Informed Consent Statement
Data Availability Statement
Conflicts of Interest
References
- Apergis, N.; Gupta, R.; Lau, C.K.; Mukherjee, Z. U.S. state-level carbon dioxide emissions: Does it affect health care expenditure? Renew. Sustain. Energy Rev. 2018, 91, 521–530. [Google Scholar] [CrossRef]
- Yang, X.; Li, N.; Mu, H.; Ahmad, M.; Meng, X. Population aging, renewable energy budgets and environmental sustainability: Does health expenditures matter? Gondwana Res. 2022, 160, 303–314. [Google Scholar] [CrossRef]
- Wang, Z.; Pan, Z.; Xu, Z.; Cui, X.; Zhang, X. How does demographic transition affect energy conservation? Evidences from the resource effects of global demographic transition. J. Clean. Prod. 2024, 2024, 140954. [Google Scholar] [CrossRef]
- Lewis, C.; Buffel, T. Aging in place and the places of aging: A longitudinal study. J. Aging Stud. 2020, 54, 100870. [Google Scholar] [CrossRef] [PubMed]
- Dalton, M.; O’Neill, B.; Prskawetz, A.; Jiang, L.; Pitkin, J. Population aging and future carbon emissions in the United States. Energ. Econ. 2008, 30, 642–675. [Google Scholar] [CrossRef]
- Hamza, N.; Gilroy, R. The challenge to UK energy policy: An ageing population perspective on energy saving measures and consumption. Energy Policy 2011, 39, 782–789. [Google Scholar] [CrossRef]
- Menz, T.; Welsch, H. Population aging and carbon emissions in OECD countries: Accounting for life-cycle and cohort effects. Energ. Econ. 2012, 34, 842–849. [Google Scholar] [CrossRef]
- Wang, W.; Liu, L.; Liao, H.; Wei, Y. Impacts of urbanization on carbon emissions: An empirical analysis from OECD countries. Energy Policy 2021, 151, 112171. [Google Scholar] [CrossRef]
- Zheng, H.; Long, Y.; Wood, R.; Moran, D.; Zhang, Z.; Meng, J.; Feng, K.; Hertwich, E.; Guan, D. Ageing society in developed countries challenges carbon mitigation. Nat. Clim. Change 2022, 12, 241–248. [Google Scholar] [CrossRef]
- Zhang, C.; Tan, Z. The relationships between population factors and China’s carbon emissions: Does population aging matter? Renew. Sustain. Energy Rev. 2016, 65, 1018–1025. [Google Scholar] [CrossRef]
- Fan, J.; Zhou, L.; Zhang, Y.; Shao, S.; Ma, M. How does population aging affect household carbon emissions? Evidence from Chinese urban and rural areas. Energ. Econ. 2021, 100, 105356. [Google Scholar] [CrossRef]
- Yu, B.; Wei, Y.M.; Kei, G.; Matsuoka, Y. Future scenarios for energy consumption and carbon emissions due to demographic transitions in Chinese households. Nat. Energy 2018, 3, 109–118. [Google Scholar] [CrossRef]
- Shi, G.; Lu, X.; Zhang, H.; Zheng, H.; Zhang, Z.; Chen, S.; Xing, J.; Wang, S. Air pollutant emissions induced by rural-to-urban migration during China’s urbanization (2005–2015). Environ. Sci. Ecotechnol. 2022, 10, 100166. [Google Scholar] [CrossRef] [PubMed]
- Wang, Z.; Cui, C.; Peng, S. How do urbanization and consumption patterns affect carbon emissions in China? A decomposition analysis. J. Clean. Prod. 2019, 211, 1201–1208. [Google Scholar] [CrossRef]
- Chen, J.; Wang, L.; Li, Y. Research on the impact of multi-dimensional urbanization on China’s carbon emissions under the background of COP21. J. Environ. Manage. 2020, 273, 111123. [Google Scholar] [CrossRef] [PubMed]
- Li, J.; Huang, X.; Chuai, X.; Yang, H. The impact of land urbanization on carbon dioxide emissions in the Yangtze River Delta, China: A multiscale perspective. Cities 2021, 116, 103275. [Google Scholar] [CrossRef]
- Lai, S.; Lu, J.; Luo, X.; Ge, J. Carbon emission evaluation model and carbon reduction strategies for newly urbanized areas. Sustain. Prod. Consump. 2022, 31, 13–25. [Google Scholar] [CrossRef]
- Zhou, C.; Wang, S.; Wang, J. Examining the influences of urbanization on carbon dioxide emissions in the Yangtze River Delta, China: Kuznets curve relationship. Sci. Total Environ. 2019, 675, 472–482. [Google Scholar] [CrossRef]
- Su, Y.; Wu, J.; Ciais, P.; Zheng, B.; Wang, Y.; Chen, X.; Li, X.; Li, Y.; Wang, Y.; Wang, C.; et al. Differential impacts of urbanization characteristics on city-level carbon emissions from passenger transport on road: Evidence from 360 cities in China. Build. Sci. 2022, 219, 109165. [Google Scholar] [CrossRef]
- Liu, B.; Tian, C.; Li, Y.; Song, H.; Ma, Z. Research on the effects of urbanization on carbon emissions efficiency of urban agglomerations in China. J. Clean. Prod. 2018, 197 Pt 1, 1374–1381. [Google Scholar] [CrossRef]
- Sun, W.; Huang, C. How does urbanization affect carbon emission efficiency? Evidence from China. J. Clean. Prod. 2020, 272, 122828. [Google Scholar] [CrossRef]
- Huang, Y.; Matsumoto, K. Drivers of the change in carbon dioxide emissions under the progress of urbanization in 30 provinces in China: A decomposition analysis. J. Clean. Prod. 2021, 322, 129000. [Google Scholar] [CrossRef]
- Sikder, M.; Wang, C.; Yao, X.; Huai, X.; Wu, L.; Yeboah, K.F.; Wood, J.; Zhao, Y.; Dou, X. The integrated impact of GDP growth, industrialization, energy use, and urbanization on CO2 emissions in developing countries: Evidence from the panel ARDL approach. Sci. Total Environ. 2022, 837, 155795. [Google Scholar] [CrossRef]
- Wang, S.; Xie, Z.; Wu, R.; Feng, K. How does urbanization affect the carbon intensity of human well-being? A global assessment. Appl. Energy 2022, 312, 118798. [Google Scholar] [CrossRef]
- Huo, T.; Li, X.; Cai, W.; Zuo, J.; Jia, F.; Wei, H. Exploring the impact of urbanization on urban building carbon emissions in China: Evidence from a provincial panel data model. Sustain. Cities Soc. 2020, 56, 102068. [Google Scholar] [CrossRef]
- Huo, T.; Cao, R.; Du, H.; Zhang, J.; Cai, W.; Liu, B. Nonlinear influence of urbanization on China’s urban residential building carbon emissions: New evidence from panel threshold model. Sci. Total Environ. 2021, 772, 145058. [Google Scholar] [CrossRef]
- Zhang, S.; Li, Z.; Ning, X.; Li, L. Gauging the impacts of urbanization on CO2 emissions from the construction industry: Evidence from China. J. Environ. Manage. 2021, 288, 112440. [Google Scholar] [CrossRef]
- Li, X. Study on the impact of energy rebound effect on carbon emission reduction at different stages of urbanization in China. Ecol. Indic. 2021, 120, 106983. [Google Scholar] [CrossRef]
- Zheng, S.; Wang, R.; Mak, M.W.T.; Hsu, S.; Tsang, C.W.D. How energy service companies moderate the impact of industrialization and urbanization on carbon emissions in China? Sci. Total Environ. 2021, 751, 141610. [Google Scholar] [CrossRef]
- Xu, Q.; Dong, Y.; Yang, R. Urbanization impact on carbon emissions in the Pearl River Delta region: Kuznets curve relationships. J. Clean. Prod. 2018, 180, 514–523. [Google Scholar] [CrossRef]
- Zhao, C.; Wang, B. How does new-type urbanization affect air pollution? Empirical evidence based on spatial spillover effect and spatial Durbin model. Environ. Int. 2022, 165, 107304. [Google Scholar] [CrossRef] [PubMed]
- Meng, G.; Guo, Z.; Li, J. The dynamic linkage among urbanisation, industrialisation and carbon emissions in China: Insights from spatiotemporal effect. Sci. Total Env. 2021, 760, 144042. [Google Scholar] [CrossRef] [PubMed]
- Lv, Q.; Liu, H.; Yang, D.; Liu, H. Effects of urbanization on freight transport carbon emissions in China: Common characteristics and regional disparity. J. Clean. Prod. 2019, 211, 481–489. [Google Scholar] [CrossRef]
- Xu, F.; Huang, Q.; Yue, H.; He, C.; Wang, C.; Zhang, H. Reexamining the relationship between urbanization and pollutant emissions in China based on the STIRPAT model. J. Environ. Manag. 2020, 273, 111134. [Google Scholar] [CrossRef] [PubMed]
- Lv, T.; Hu, H.; Zhang, X.; Wang, L.; Fu, S. Impact of multidimensional urbanization on carbon emissions in an ecological civilization experimental area of China. Phys. Chem. Earth. 2022, 126, 103120. [Google Scholar] [CrossRef]
- Wang, Q.; Wang, X.; Li, R. Does urbanization redefine the environmental Kuznets curve? An empirical analysis of 134 Countries. Sustain. Cities Soc. 2022, 76, 103382. [Google Scholar] [CrossRef]
- Li, B.; Haneklaus, N. The potential of India’s net-zero Carbon emissions: Analyzing the effect of clean energy, coal, urbanization, and trade openness. Energy Rep. 2022, 8, 724–733. [Google Scholar] [CrossRef]
- Muhammad, S.; Long, X.; Salman, M.; Dauda, L. Effect of urbanization and international trade on CO2 emissions across 65 belt and road initiative countries. Energy 2020, 196, 117102. [Google Scholar] [CrossRef]


| Variables | Specific Indicators | Mean | Std. Deviation | Max. | Min. |
|---|---|---|---|---|---|
| Energy-saving and emission reduction efficiency (EE) | Per capita CO2 emissions (t/person) (EE1) | 4.40 | 5.44 | 47.70 | 0.02 |
| Energy consumption structure (ES) | Proportion of nuclear energy and other clean energy consumption in total energy consumption (%) (ES1) | 8.26 | 10.61 | 55.58 | 0.00 |
| Carbon emissions (CE) | CO2 emissions (104 t) (CE1) | 15,573 | 71,671 | 1,030,000 | 3.00 |
| Demographic transition (DT) | Population aged 65 and above (% of total population) (DT1) | 7.81 | 5.49 | 28.40 | 0.69 |
| Urban population (% of total population) (%) (DT2) | 58.18 | 24.04 | 100.00 | 8.25 | |
| Growth rate (EG) | Annual GDP growth rate (%/year) (EG1) | 3.33 | 5.63 | 123.14 | −62.08 |
| Annual CO2 emission growth rate (%/year) (EG2) | 3.43 | 15.08 | 350.00 | −74.75 | |
| Industrial upgrading (IU) | Industry (including construction), value added (% of GDP) (IU1) | 26.32 | 12.47 | 94.70 | 3.15 |
| Services, value added (% of GDP) (IU2) | 54.21 | 12.83 | 96.20 | 10.86 | |
| Technical input (TI) | R&D expenditure (% of GDP) (TI1) | 1.12 | 1.01 | 4.95 | 0.01 |
| R&D investment (104 USD) (TI2) | 1,630,000 | 5,570,000 | 58,200,000 | 75.68 | |
| Per capita R&D investment (104 USD/person) (TI3) | 0.04 | 0.05 | 0.21 | 0.00 | |
| Economic development (ED) | Per capita GDP (USD/person) (ED1) | 15,216.43 | 23,643.47 | 189,487.10 | 111.93 |
| Function | Period | Samples | |||
|---|---|---|---|---|---|
| EG2 ≤ 0.0% | 0.0% < EG2 ≤ 5.0% | EG2 > 5.0% | Subtotal | ||
| The particular production function | 2000–2018 | 513 | 460 | 281 | 1254 |
| The industrial upgrading function | 2000–2018 | 1119 | 915 | 1063 | 3097 |
| The individual function | 2000–2018 | 513 | 460 | 281 | 1254 |
| The clean energy function | 2000–2014 | 384 | 332 | 199 | 915 |
| Dependent Variable | Classification | Regression Model | R2 | Adjusted R2 | F | p-Value |
|---|---|---|---|---|---|---|
| ED1 | Overall | 0.726 | 0.725 | 1102.545 | 0.000 | |
| EG2 ≤ 0.0% | 0.715 | 0.713 | 425.829 | 0.000 | ||
| 0.0% < EG2 ≤ 5.0% | 0.711 | 0.709 | 374.578 | 0.000 | ||
| EG2 > 5.0% | 0.702 | 0.699 | 217.363 | 0.000 | ||
| CE1 | Overall | 0.701 | 0.701 | 977.955 | 0.000 | |
| EG2 ≤ 0.0% | 0.687 | 0.686 | 373.251 | 0.000 | ||
| 0.0% < EG2 ≤ 5.0% | 0.734 | 0.733 | 420.359 | 0.000 | ||
| EG2 > 5.0% | 0.665 | 0.661 | 183.369 | 0.000 |
| Dependent Variable | Classification | Regression Model | R2 | Adjusted R2 | F | p-Value |
|---|---|---|---|---|---|---|
| Solution 1: EG1 > 0 | ||||||
| EG1 | Overall | 0.092 | 0.091 | 92.467 | 0.000 | |
| EG2 ≤ 0.0% | 0.067 | 0.065 | 31.476 | 0.000 | ||
| 0.0% < EG2 ≤ 5.0% | 0.082 | 0.080 | 38.528 | 0.000 | ||
| EG2 > 5.0% | 0.058 | 0.057 | 21.084 | 0.000 | ||
| EG2 | Overall | 0.116 | 0.115 | 116.633 | 0.000 | |
| EG2 ≤ 0.0% | 0.048 | 0.046 | 39.427 | 0.000 | ||
| 0.0% < EG2 ≤ 5.0% | 0.057 | 0.056 | 52.583 | 0.000 | ||
| EG2 > 5.0% | 0.063 | 0.060 | 22.411 | 0.000 | ||
| Solution 2: EG1 < 0 | ||||||
| EG1 | Overall | 0.024 | 0.018 | 4.247 | 0.015 | |
| EG2 ≤ 0.0% | 0.038 | 0.034 | 9.252 | 0.003 | ||
| 0.0% < EG2 ≤ 5.0% | 0.098 | 0.079 | 5.204 | 0.027 | ||
| EG2 | Overall | 0.088 | 0.082 | 15.653 | 0.000 | |
| EG2 ≤ 0.0% | 0.048 | 0.044 | 11.003 | 0.001 | ||
| Dependent Variable | Classification | Regression Model | R2 | Adjusted R2 | F | p-Value |
|---|---|---|---|---|---|---|
| ED1 | Overall | 0.872 | 0.872 | 2834.941 | 0.000 | |
| EG2 ≤ 0.0% | 0.887 | 0.886 | 1329.732 | 0.000 | ||
| 0.0% < EG2 ≤ 5.0% | 0.870 | 0.869 | 1014.588 | 0.000 | ||
| EG2 > 5.0% | 0.822 | 0.820 | 427.006 | 0.000 | ||
| EE1 | Overall | 0.547 | 0.546 | 502.753 | 0.000 | |
| EG2 ≤ 0.0% | 0.495 | 0.492 | 166.296 | 0.000 | ||
| 0.0% < EG2 ≤ 5.0% | 0.564 | 0.562 | 196.973 | 0.000 | ||
| EG2 > 5.0% | 0.561 | 0.557 | 118.149 | 0.000 |
| Dependent Variable | Classification | Regression Model | R2 | Adjusted R2 | F | p-Value |
|---|---|---|---|---|---|---|
| ED1 | Overall | 0.720 | 0.718 | 484.074 | 0.000 | |
| EG2 ≤ 0.0% | 0.728 | 0.724 | 202.428 | 0.000 | ||
| 0.0% < EG2 ≤ 5.0% | 0.617 | 0.607 | 65.282 | 0.000 | ||
| EG2 > 5.0% | 0.686 | 0.678 | 84.326 | 0.000 |
Disclaimer/Publisher’s Note: The statements, opinions and data contained in all publications are solely those of the individual author(s) and contributor(s) and not of MDPI and/or the editor(s). MDPI and/or the editor(s) disclaim responsibility for any injury to people or property resulting from any ideas, methods, instructions or products referred to in the content. |
© 2024 by the authors. Licensee MDPI, Basel, Switzerland. This article is an open access article distributed under the terms and conditions of the Creative Commons Attribution (CC BY) license (https://creativecommons.org/licenses/by/4.0/).
Share and Cite
Pan, Z.; Wang, Z.; Cui, X. New Interpretation of Human–Land Relation: Differentiated Impacts of Global Demographic Transition on Carbon Emissions. Sustainability 2024, 16, 5168. https://doi.org/10.3390/su16125168
Pan Z, Wang Z, Cui X. New Interpretation of Human–Land Relation: Differentiated Impacts of Global Demographic Transition on Carbon Emissions. Sustainability. 2024; 16(12):5168. https://doi.org/10.3390/su16125168
Chicago/Turabian StylePan, Zhilong, Zhibao Wang, and Xin Cui. 2024. "New Interpretation of Human–Land Relation: Differentiated Impacts of Global Demographic Transition on Carbon Emissions" Sustainability 16, no. 12: 5168. https://doi.org/10.3390/su16125168
APA StylePan, Z., Wang, Z., & Cui, X. (2024). New Interpretation of Human–Land Relation: Differentiated Impacts of Global Demographic Transition on Carbon Emissions. Sustainability, 16(12), 5168. https://doi.org/10.3390/su16125168