Article

Hybrid Waste-to-Energy Solutions within a Circular Economy Framework Directed towards Sustainable Urban Waste Management in Ghana

by
Ekua Afrakoma Armoo
1,2,*,
Satyanarayana Narra
1,
Mutala Mohammed
2,
Belinda Boahemaa
3,
Essossinam Beguedou
1,
Francis Kemausuor
4 and
Francis Boateng Agyenim
2
1
Department of Waste and Resource Management, University of Rostock, 18059 Rostock, Germany
2
Council for Scientific and Industrial Research, Institute of Industrial Research, Accra P.O. Box LG 576, Ghana
3
The Brew-Hammond Energy Center, College of Engineering, Kwame Nkrumah University of Science and Technology (KNUST), PMB, Kumasi AK-039-5028, Ghana
4
Department of Agricultural and Biosystems Engineering, Kwame Nkrumah University of Science and Technology (KNUST), PMB, Kumasi AK-039-5028, Ghana
*
Author to whom correspondence should be addressed.
Sustainability 2024, 16(12), 4976; https://doi.org/10.3390/su16124976
Submission received: 25 April 2024 / Revised: 2 June 2024 / Accepted: 4 June 2024 / Published: 11 June 2024

Abstract

:
Cities in developing countries continue to struggle with mounting waste management challenges. Within a circular economy framework, energy recovery is mostly nonexistent. Against that background, this study aimed to design and assess the viability of a hybrid waste-to-energy facility for the Greater Accra Metropolitan Area (GAMA) in Ghana by 2030. The proposed plant integrates solar PV, anaerobic digestion and pyrolysis to treat unsegregated municipal solid waste. Three cases were developed for different product combinations. Material flow analysis was performed with STAN software 2.7.101. The results indicate that 1.6 million tons of MSW will be generated, to be potentially converted to 271 GWh of electricity, 6400 tons of hydrogen or 4400 tons of bio-compressed natural gas per year, along with additional products: compost, refuse-derived fuel and bio-oil. The economic indicators show that all cases are potentially viable in terms of the net present value (EUR 397 to 1030 million), internal rate of return (14–22%) and levelized cost of energy (0.11–0.18 EUR/kWh). As such, this study proves that waste to energy is a viable waste management solution for large metropolitan areas, with the potential to supply energy, alternative fuels and material products within a circular economy, though it requires the buy-in of policy makers.

1. Introduction

The global population hit 8 billion by the end of 2023 with 57% living in urban areas. [1]. Meanwhile, the population in sub-Saharan Africa is estimated to hit 1.2 billion by 2030 [2]. Against that background, UN Sustainable Development Goal 11 urges all countries and stakeholders to work to achieve sustainable cities and communities by 2030. Cities in most developing countries, however, are battling with challenges of waste management as their population growth continues to outpace the level of infrastructural development. Nearly 40% of the 2.3 billion tons of municipal solid waste (MSW) generated globally in 2020 was not sustainably managed. Today, in sub-Saharan Africa and Oceania, less than 60% of generated waste is collected [3]. Meanwhile, recent research links waste management to the circular economy, sustainable production and recycling. However, achieving local management of waste in highly populated urban settlements presents peculiar challenges, and failed attempts may result in great negative impacts; as such, a robust strategy is required [4].
It is estimated that Africa will generate 244 million tons of waste per year by 2025, with only a 55% collection rate. The informal sector and community-based organizations contribute immensely to the collection of waste, but recycling is estimated at only 4% [5]. Urbanization has been linked to increasing consumption and waste generation; for instance, Kenya and Ghana imported as much as 3.57% and 2.9% of the USD 5.7 billion global trade of goods in 2022, respectively [6,7]. Moreover, another major reason for increasing waste generation is the increase in the import of substandard goods, including used clothes from the developed world, under the guise of donations, 40% of which end up as waste. On the contrary, urbanization in sub-Saharan Africa (SSA) has been positively linked to a reduction in the incidence and depth of poverty. This can conditionally occur with adequate planning, policies and sustainable infrastructure [8]. In an opposite case, poor waste management in Yaoundé, Cameroun has been attributed to the lack of citizen participation in sustainable approaches, while city authorities have failed to enforce laws and implement both local policies and international treaties [9]. A key issue is that waste management is capital intensive, and it requires sound infrastructure to meet health and safety standards. With most African countries facing economic challenges, investment in waste management is not given enough priority [5]. An exception is South Africa, the most developed country in Africa, which produces 12.7 million tons of waste per year and implements a robust waste management strategy, with huge investments targeting its continuous improvement [10].
In West Africa, the population of Ghana has experienced a five-fold increase over the past 60 years, with an average annual growth rate of 2.1% between 2010 and 2021. In 2021, 50.9% of the 30.8 million national population resided in urban areas, 47% of which resided in only two out of the sixteen regions: Ashanti and Greater Accra [11]. In that context, characterized by population increases in urban areas due to migration, the site selection for waste management infrastructure such as landfills is difficult, a matter further complicated by competing land uses [12,13]. As a result, only 51.4% of urban households engage with waste collection services, and the figure is as low as 5.8% for rural households [11].
The country administratively runs a decentralized governance system with sixteen administrative regions, which are further divided into 261 Metropolitan, Municipal and District Assemblies (MMDAs) [14]. One of the key responsibilities of the MMDAs is waste management. This has proven to be a challenge, especially in metropolitan and municipal areas such as Accra and Kumasi [15,16]. The major reasons include a lack of resources and financing, the sociocultural framework of the society, such as its belief systems and citizen participation, and weak institutional law enforcement [17].
Several studies have established various strategies that can be adopted by municipalities to improve the current situation. These include source segregation and recycling [18,19], energy recovery from organic waste [20], composting [21], biochar from organic waste [22], conversion to fuels such as RDF [23] and hydrogen [24], pyrolytic bio-oil [25] and composite materials for road construction [26]. All these treatment strategies provide a one-sided approach, while treating only some types of wastes. Nonetheless, within the broader context, such mini strategies can be encapsulated into a city-scale circular economy [27].
The circular economy is being promoted all over the world to respond to growing concerns about waste management and the need for climate action. It provides a sustainable approach, which follows natural principles of recovery and recycling of resources within a large system such as city, national or global boundaries. Material and energy recovery have a role to play in closing the loop in a circular economy [28]. The EU Framework Directive establishes a five-step waste hierarchy, which presents an order of preference for managing and disposing of waste: prevention, preparing for reuse, recycling, recovery and disposal. The principles of the circular economy are to as much as possible maintain the materials we have within a circular system, where they cease to exist only after all possible steps have been exhausted [29].
One of the key aspects of circular economy is the creation value and markets for resources within the cycle. This value creates a push and pull effect, ensuring the continuous cycle of materials within the system. A circular city requires business models with various scopes: collective citizen actions, the city governance level, local service providers or international networks [30]. At the core of those, the recovery of materials and energy is crucial for every circular economy. Two African countries have implemented ambitious waste-to-energy (WTE) projects within the last decade, to deal with their increasing waste, which must be scaled up. In Ethiopia, a 25 MW WTE plant started operations in 2019 and supplies 30% of the city’s energy needs [31]. In Ghana, a pilot hybrid WTE plant is under construction and is expected to generate 810 MWh/year of energy for grid supply with other potential alternative fuels [32,33]. Within a circular economy framework, these projects make a contribution toward the achievement of sustainable cities.
In Ghana, the circular economy currently exists on a small scale, especially in urban areas such as Accra and Kumasi, for the recycling of plastics and scrap metals. An extensive network of formal service providers, informal collectors popularly known as waste pickers, and middle men (large-scale storage warehouses) recover materials and subsequently trade those with local manufacturers of plastic products or exports [15,34]. This is part of the global circular economy system because most of the plastic products originate from imports, and some of the reclaimed plastic waste processed into intermediary products (plastic pellets/scrap) is returned to the international market for further product manufacturing [35,36]. However, considering similar circular economy models across the globe, further action is required in terms of waste reduction, source segregation and recycling, energy recovery and emission tracking. Cities such as Phoenix, Amsterdam, Toronto, London and Cape Town have led the way with ambitious projects [30,37].

Justification for and Objective of this Study

In the face of the challenges associated with waste management, several studies have sought to investigate various solutions to Ghana’s waste management problems. As compared to developed countries, Ghana as a developing country has challenges involving a lack of funding and poor awareness on the role of the circular economy in supporting sustainable waste management through waste to energy [38]. Most studies have focused on the technologies or small-scale models for communities within cities or in rural areas. In a hybrid setup of integration of technologies, off-grid [39], micro-grid [40] or grid-tied systems are available, as outlined in previous studies. Also, in some instances, schemes such as net metering have been studied [41]. However, utility-scale WTE projects involving large metropolitan areas have scarcely been researched in the context of Ghana. A recent study investigated the feasibility of a 47 MW hybrid waste-to-energy system for the Kumasi Metropolis, integrating solar PV and gasification technologies, to be sited at the Oti Landfill. The study, however, failed to access the levelized cost of electricity (LCOE), which is an important consideration in the economic analysis of energy projects [42]. This general lack of relevant research within the scope of waste to energy and the circular economy provides little support for decision-making or directing broad governmental policies.
The objective of this study was to develop a technical design for a hybrid renewable WTE system for the Greater Accra Metropolitan Area in Ghana and assess its techno-economic viability within a broad circular economy context for GAMA. Achieving a circular economy within a city in Ghana will require three major initiatives: (1) government policy (regulation, planning, procurements and markets), (2) citizen participation (values, attitudes and knowledge) and (3) development of the physical environment (infrastructure, waste management, energy and material security) [30]. This study, therefore, aimed to directly support the policy and planning direction of the government in terms of enhancing the physical environment within the city and amassing greater citizen participation. It also sought to develop a technical, economical and environmentally viable city-scale model for waste management infrastructure.
Large-scale material recovery and composting plants are already operational [43,44]. However, the conversion of WTE or alternative fuels is almost nonexistent. This study assessed the current system and plugged in WTE to create a more sustainable model. The overall business case for the WTE system was evaluated to determine whether it would attract potential investment. Our model integrates the current actors with a new system through a chain of activities starting from waste segregation at the source of consumption and proceeding through waste collectors, preprocessors, recyclers, manufacturers, recovery plants and return to consumers.
Many previous studies have proven the energy recovery potential of waste in Ghana [45,46,47]. For instance, it has been estimated that 13,000 GWh of energy can be recovered from waste by 2030 [48]. However, the government has failed to prioritize achieving this goal. Appropriate policies and strategies are required at the national and local government levels to ensure that the country gradually transitions to sustainable outcomes [49].
The WTE system within the circular economy framework will follow a similar technical design to the pilot plant, which integrates solar PV, anaerobic digestion and pyrolysis. It will produce two additional categories of marketable products based on the estimated input waste: electricity and alternative fuels [33]. Energy and alternative fuels have a major role within the circular economy in driving the manufacture and transportation of materials. As the population increases and industrial development means the demand for energy increases, WTE can provide significant energy, which may relieve the current dependence on fossil-based generation and its negative environmental and economic impacts [50].

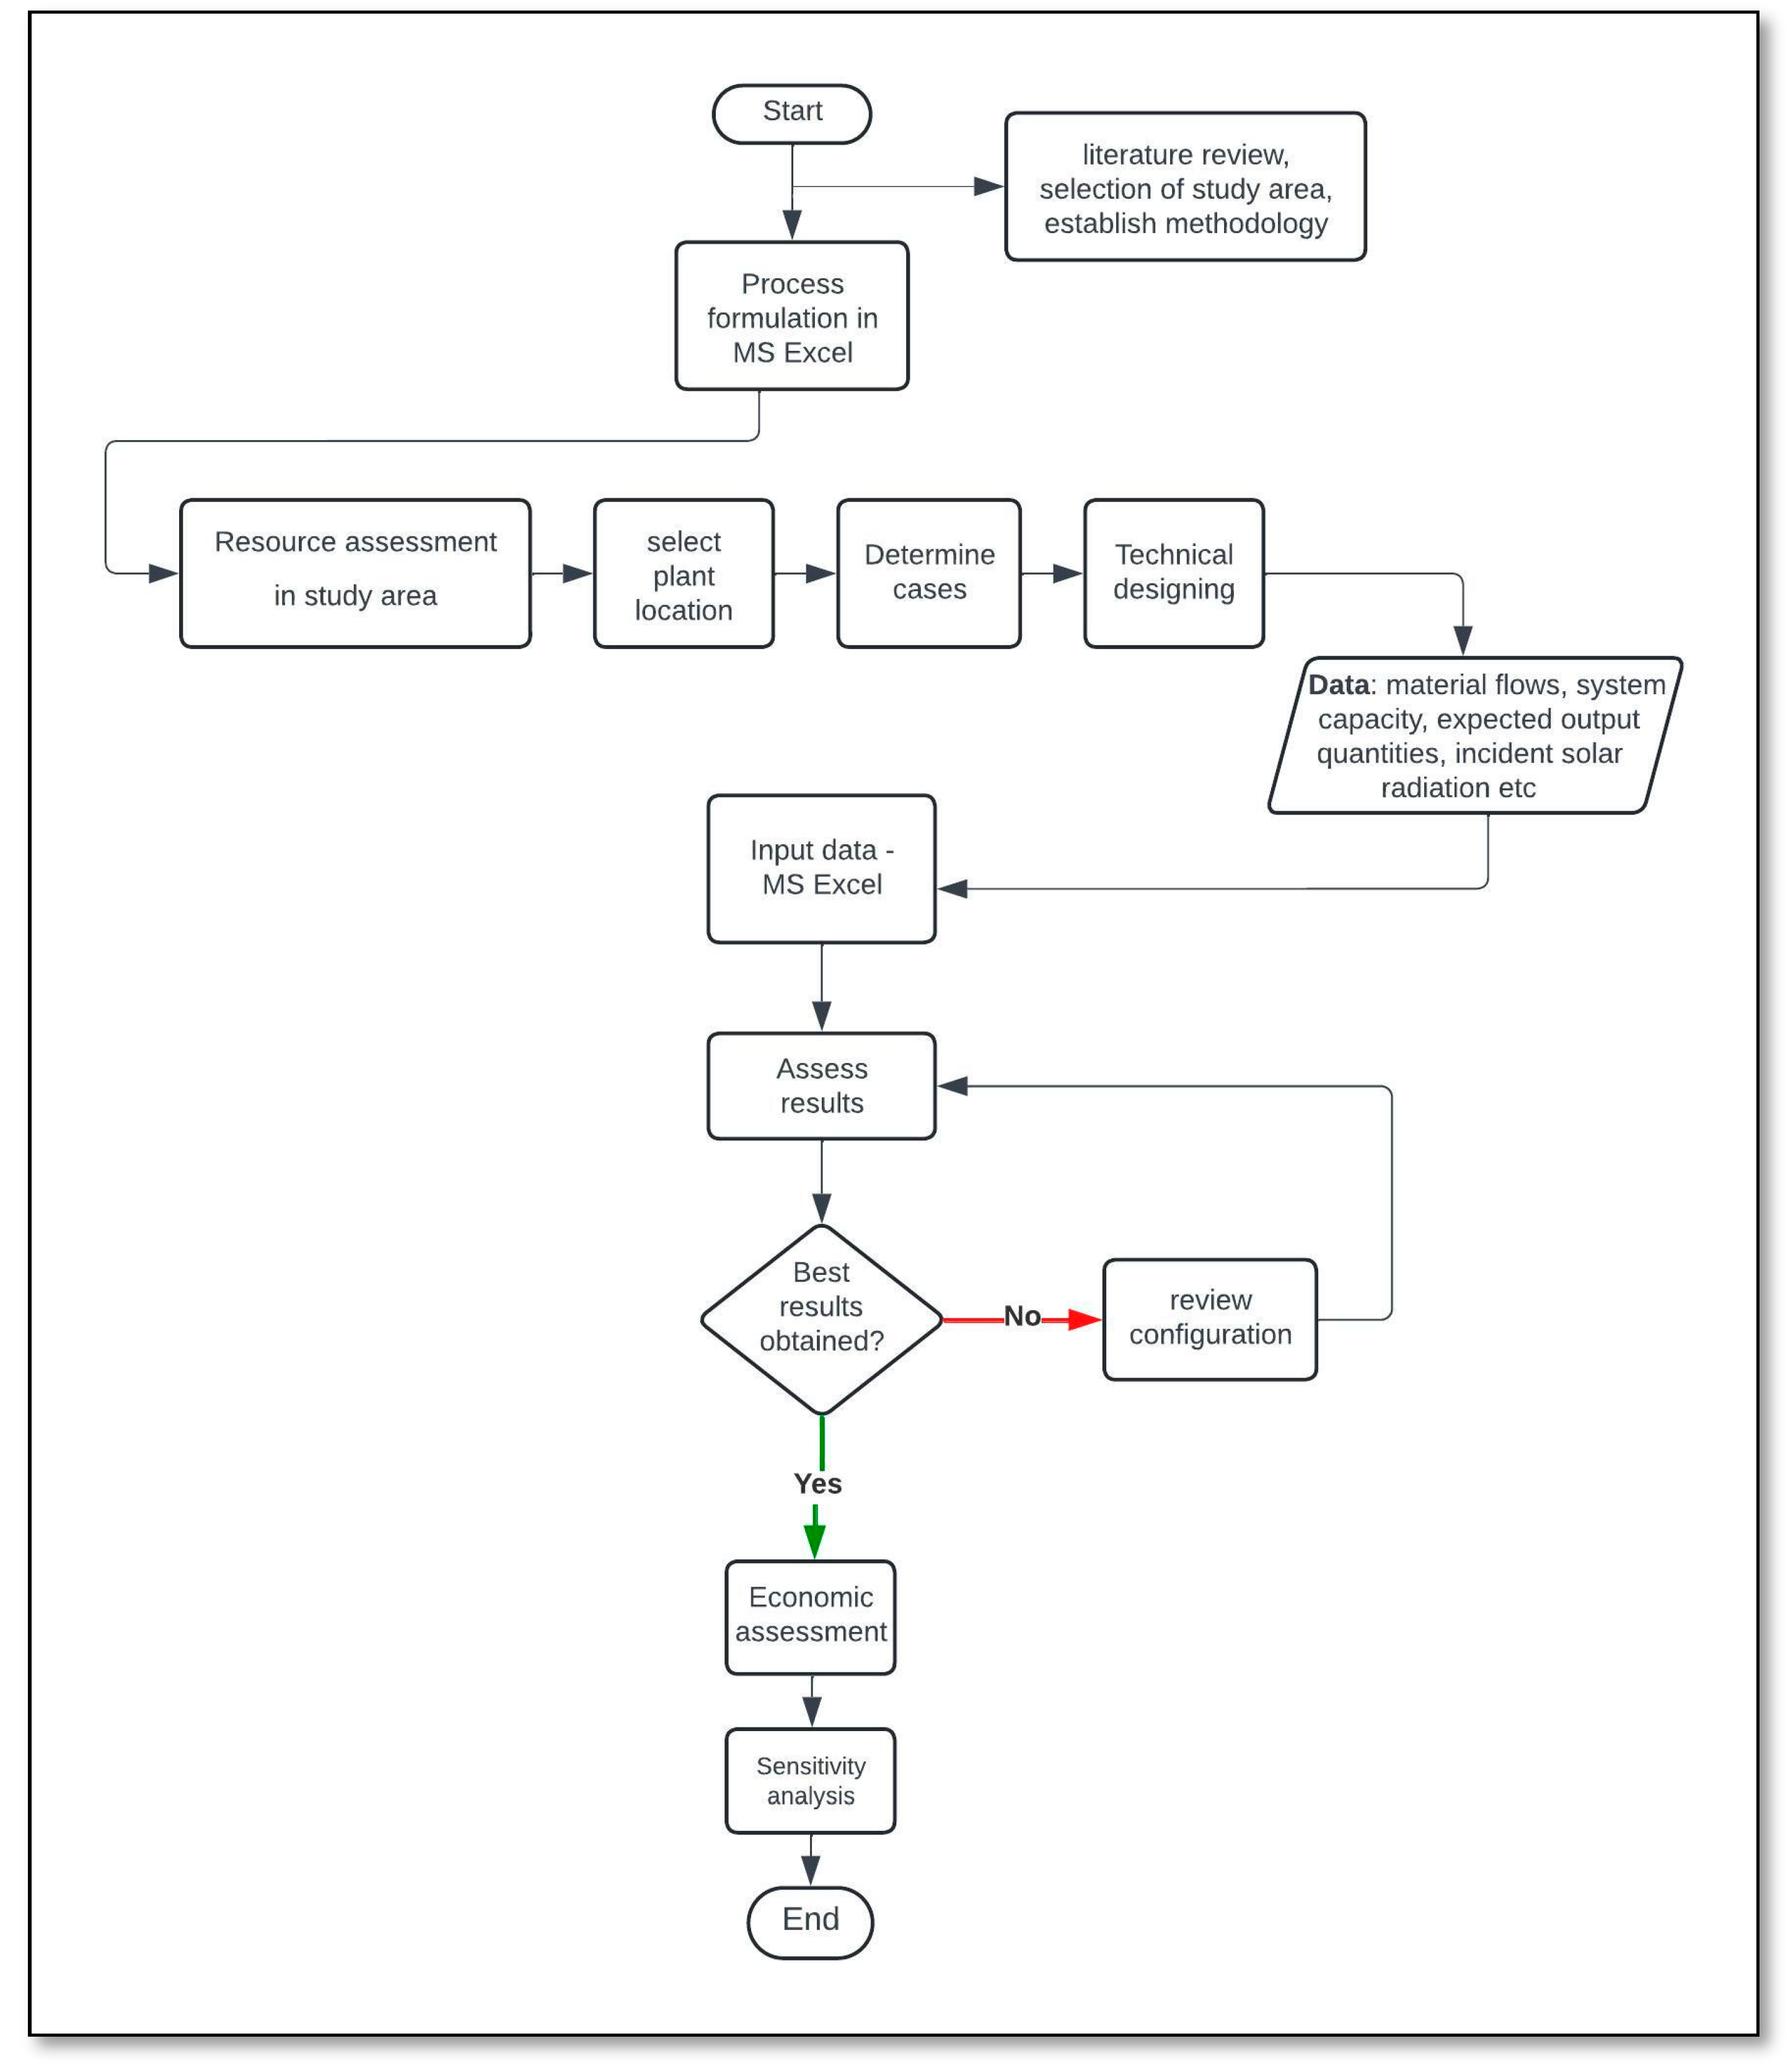
2. Materials and Methods
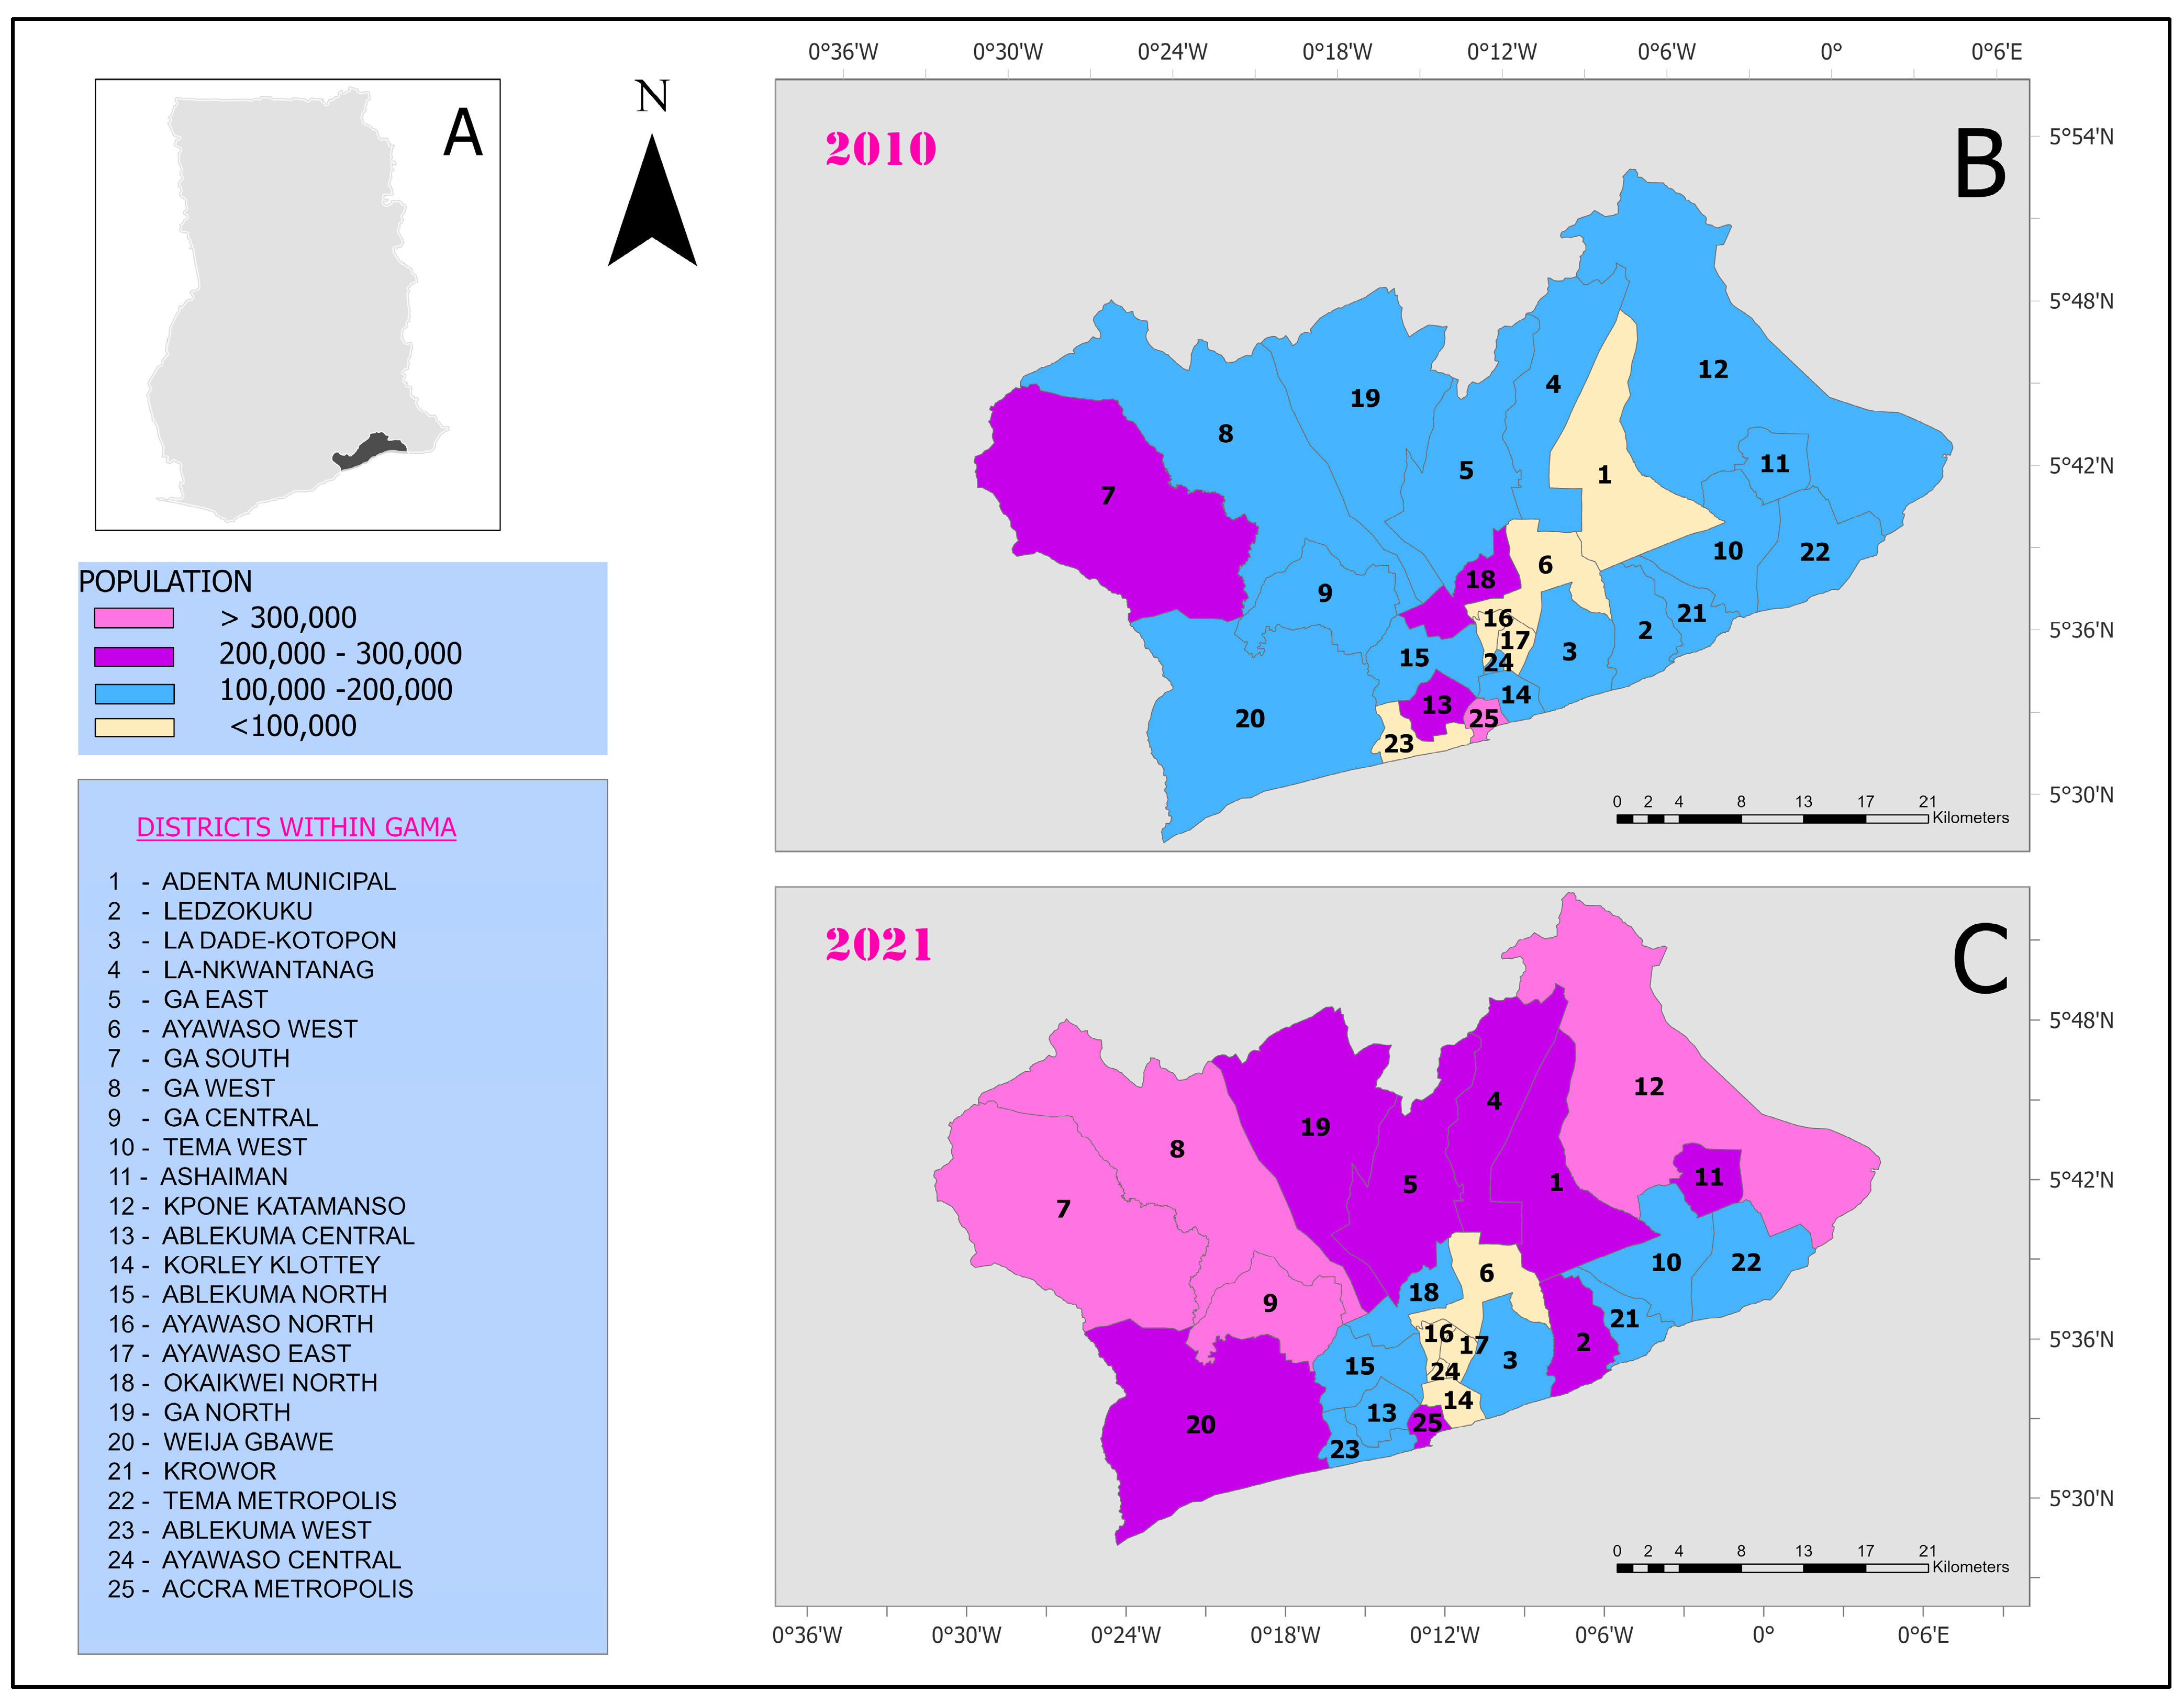
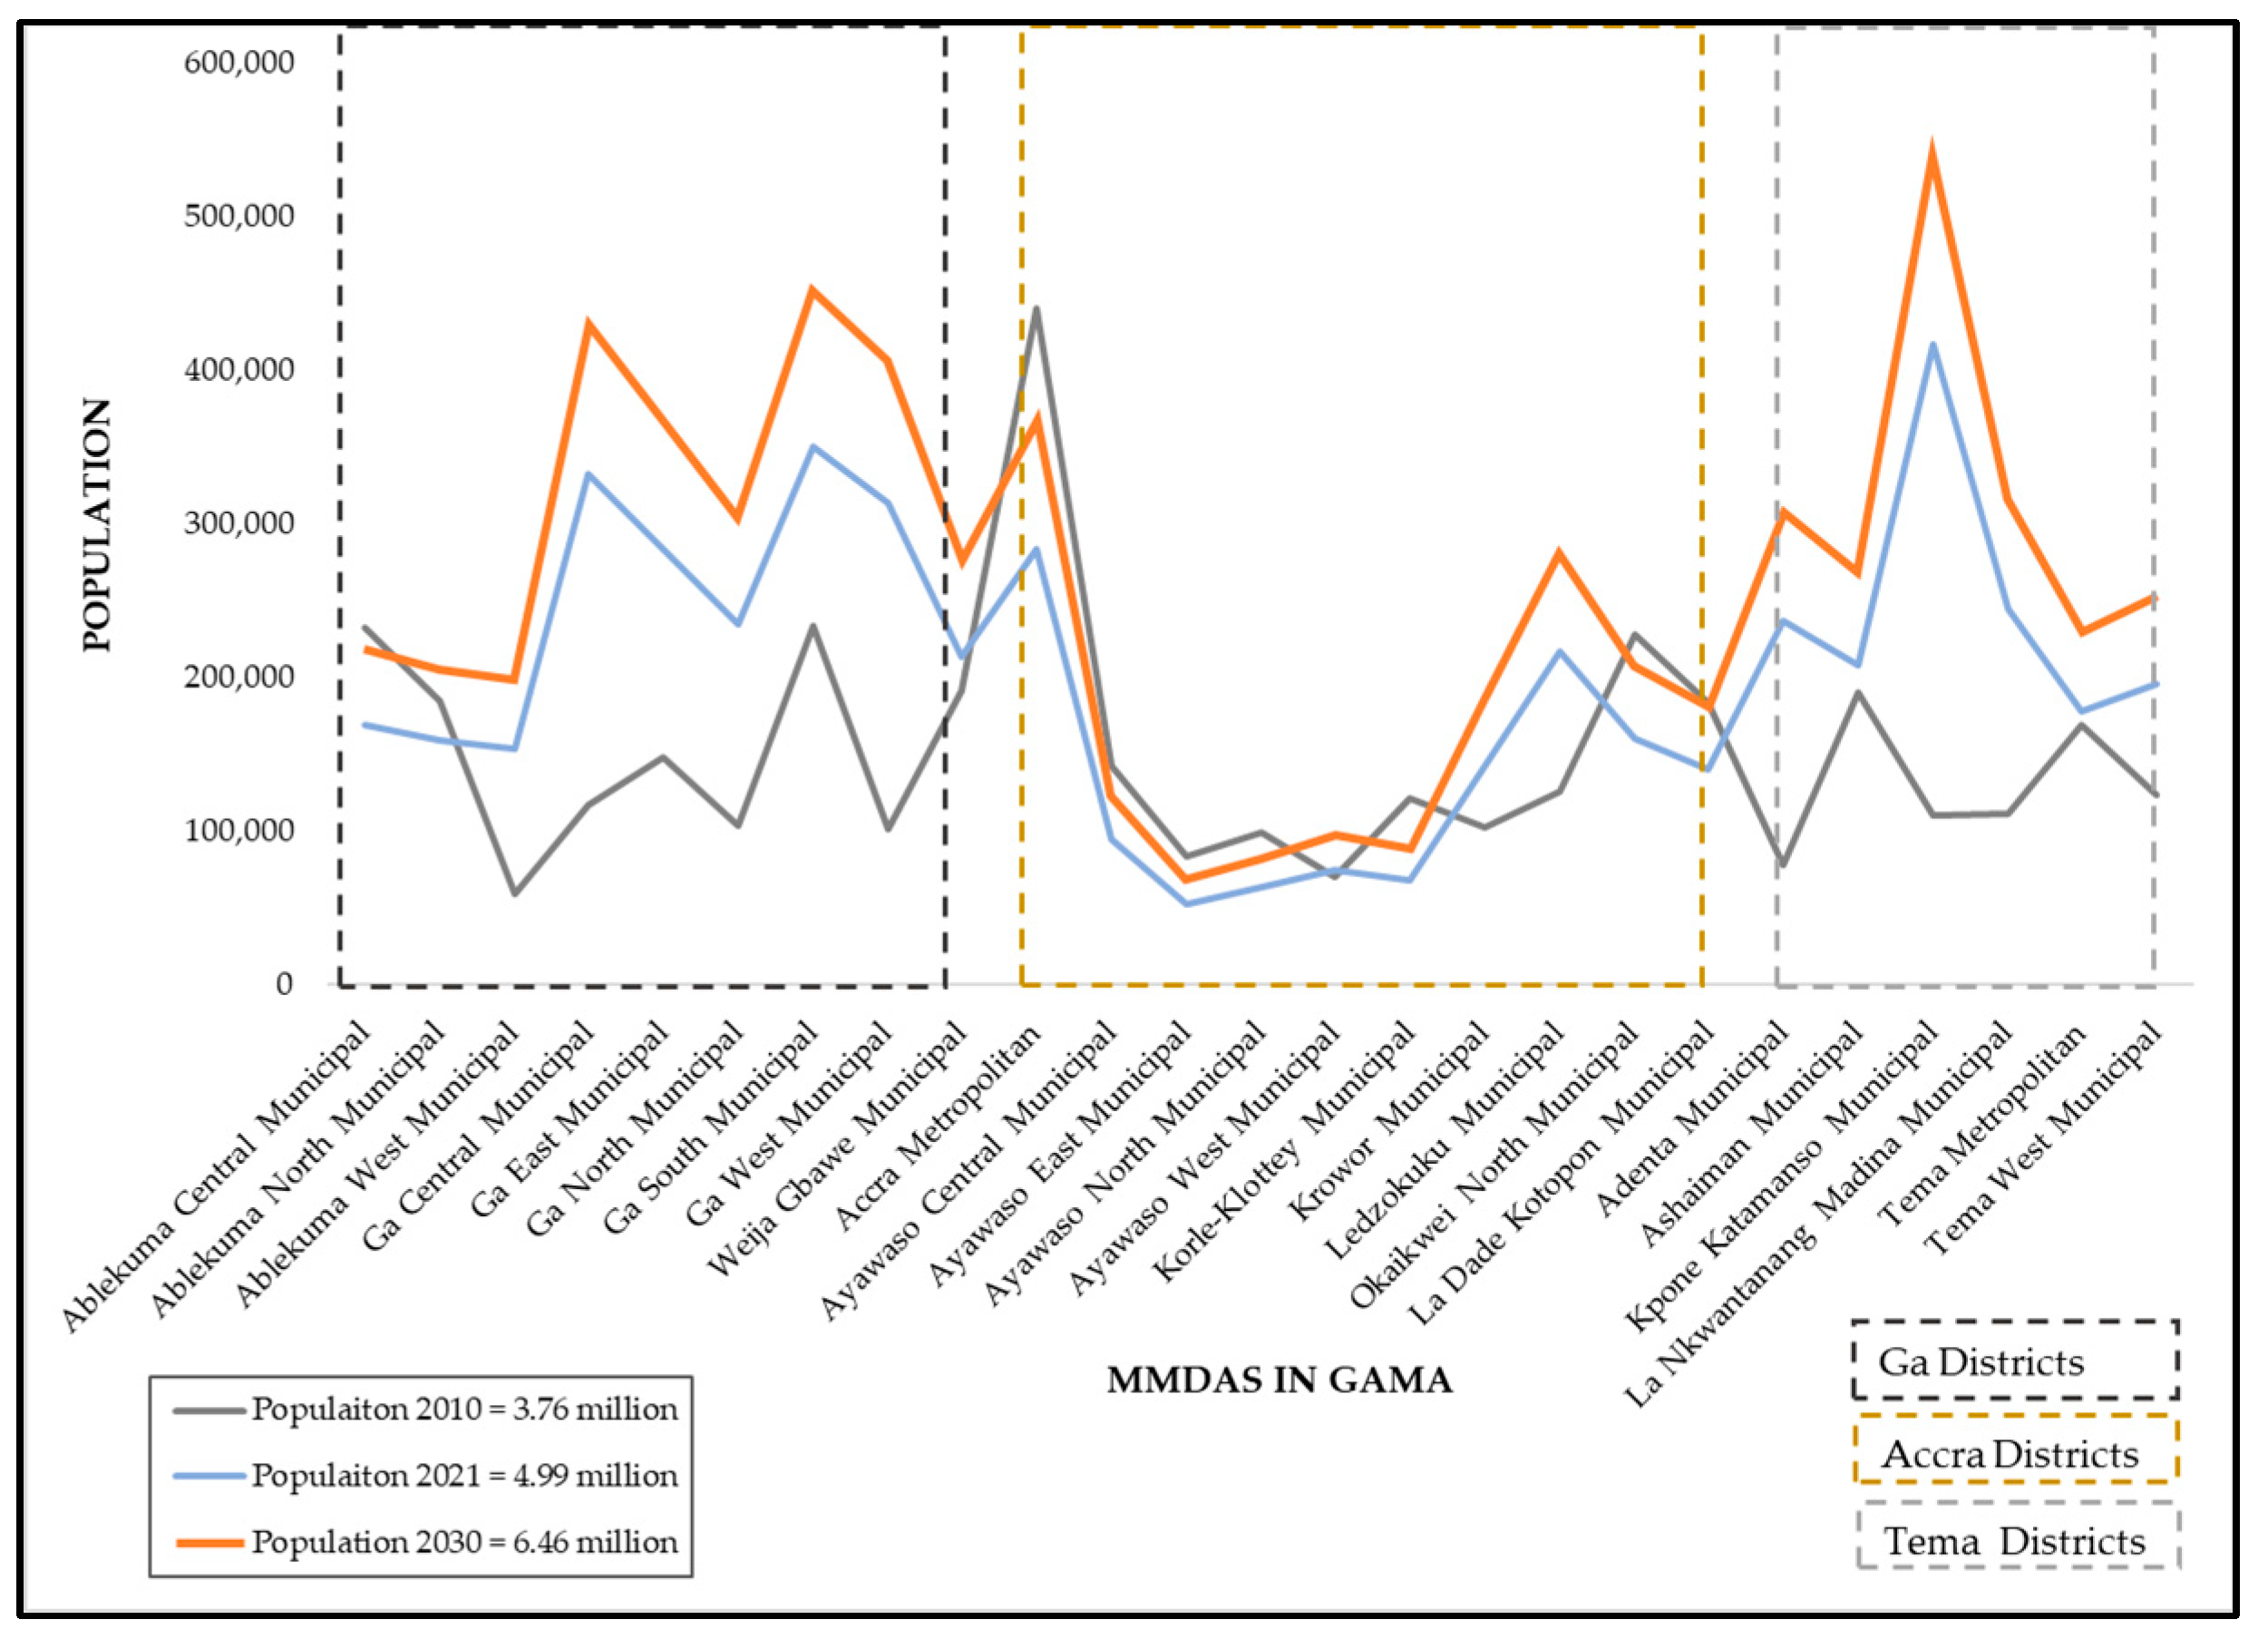
This section follows the methodology outlined in Figure 1, based on similar studies [39,51].

2.1. Study Area

This study focused on the Greater Accra Metropolitan Area (GAMA), which consists of 25 out of the 29 MMDAs within the Greater Accra Region. The capital of Ghana, Accra, falls within the Accra Metropolitan Assembly (AMA), which is one of the MMDAs in GAMA (Figure 2). The impacts of migration and urbanization have resulted in the geographical expansion of the population beyond the AMA to adjoining municipalities and districts, to form the GAMA or the city of Accra. A recent study revealed that the built-up area within the GAMA increased from 27% in 2008 to 46% in 2017 and is expected to reach 73% by 2030 [52]. The term “metropolitan area or city” encompasses the metropolis and 23 adjoining municipalities and districts. Some studies have also described it as a sub-region [13,16].
The expansion of research beyond the AMA to the larger GAMA is key to attaining relevant data for development planning of the waste management infrastructure. Currently, the most critical waste management infrastructure, landfills, are sited outside the AMA in the peripheral municipalities encompassing the GAMA. Most of these MMDAs’ locations have resulted from the not-in-my-back-yard (NIMBY) syndrome in terms of landfill site locations [53]. The Kpone and Nsumia landfills, for instance, are located 50 km beyond the AMA.
Residents of the GAMA generate 0.7 kg per capita each day [54,55]. The city is currently being supported by the C40 cities Finance Facility to implement a project targeted at increasing recycling and composting and decreasing waste disposal to landfills and subsequent greenhouse gas emissions. This targets the recovery of 192,297 tons of waste and 140,000 tons of CO2 emissions per year, impacting 750,000 households [56]. Waste management is currently characterized by numerous players, involving waste collection and transportation, transit and recovery centers, recycling companies, treatment facilities and waste dumps/landfills. The collection of waste is the most challenging aspect of waste management within the city. Source segregation exists for some plastics and scrap metals and has an active value chain involving a network of collectors, plastic pelletizers, transporters, storage warehouses, bulk buyers and recycling industries [19,57]. Smart technologies have been introduced to improve the efficiency of collection and distribution. This includes the Bolabird and Jumeni mobile application, which allows waste producers to request collection services on the application. The Bolabird application, furthermore, provides a platform for trading recyclables for rewards once the consumer segregates those at source. Such innovative approaches may enhance future efforts when scaled up. Other companies such as Jekora Ventures Limited, Asadu Royal Limited and Zoomlion have introduced smart payment systems integrating mobile money platforms, to facilitate revenue collection for enhanced service delivery.
The total MSW disposed of in landfills in Accra was estimated at 1170 t/d [15]. The Kpone landfill site alone received an average of 931 t/d between 2013 and 2017, although it was designed to receive 400 t/d [58]. This led to its closure and decommissioning more than 5 years before its planned lifespan. Today, the Ayidan engineered landfill site is under construction and is expected to provide a more environmentally friendly disposal site.
However, the crux of the problem still remains, with 51.5% of the collected waste directly transferred to the landfill or waste transfer stations to be either transferred for recycling and composting or sent to landfill. A 2017 study developed a mass balance for the city. It is estimated that recycling and composting treat 6.7% and 7% of the total generated waste and 9.1 and 9.5% each of the collected waste, respectively. Surprisingly, the data also reveal that 30% of all waste directed to recycling goes to the landfills due to poor material quality. In total, 85% of all generated waste in Accra is either buried in landfills or, in the case of the uncollected waste, deposited in open spaces or drains or burnt [15].

Selection of Plant Location

This study aimed to assess the design and development of a WTE plant to replace the existing unsanitary/non-engineered landfill practices within the GAMA. Currently, the Ayidan landfill is located at longitude −0.4 and latitude 5.8. Furthermore, the Kumasi Compost and Recovery Plant (KCARP) in Kumasi is sited within 5 km of the Oti landfill in Kumasi. A feasible approach may be to divert current waste disposal from landfill to a new plant. However, considering the current rate of urbanization within the city, it is unlikely that a large portion of land will be secured for such uses by 2030. Nonetheless, the selected location is suitable for the required purposes of such a site based on economic, environmental and sociocultural criteria, according to [59].

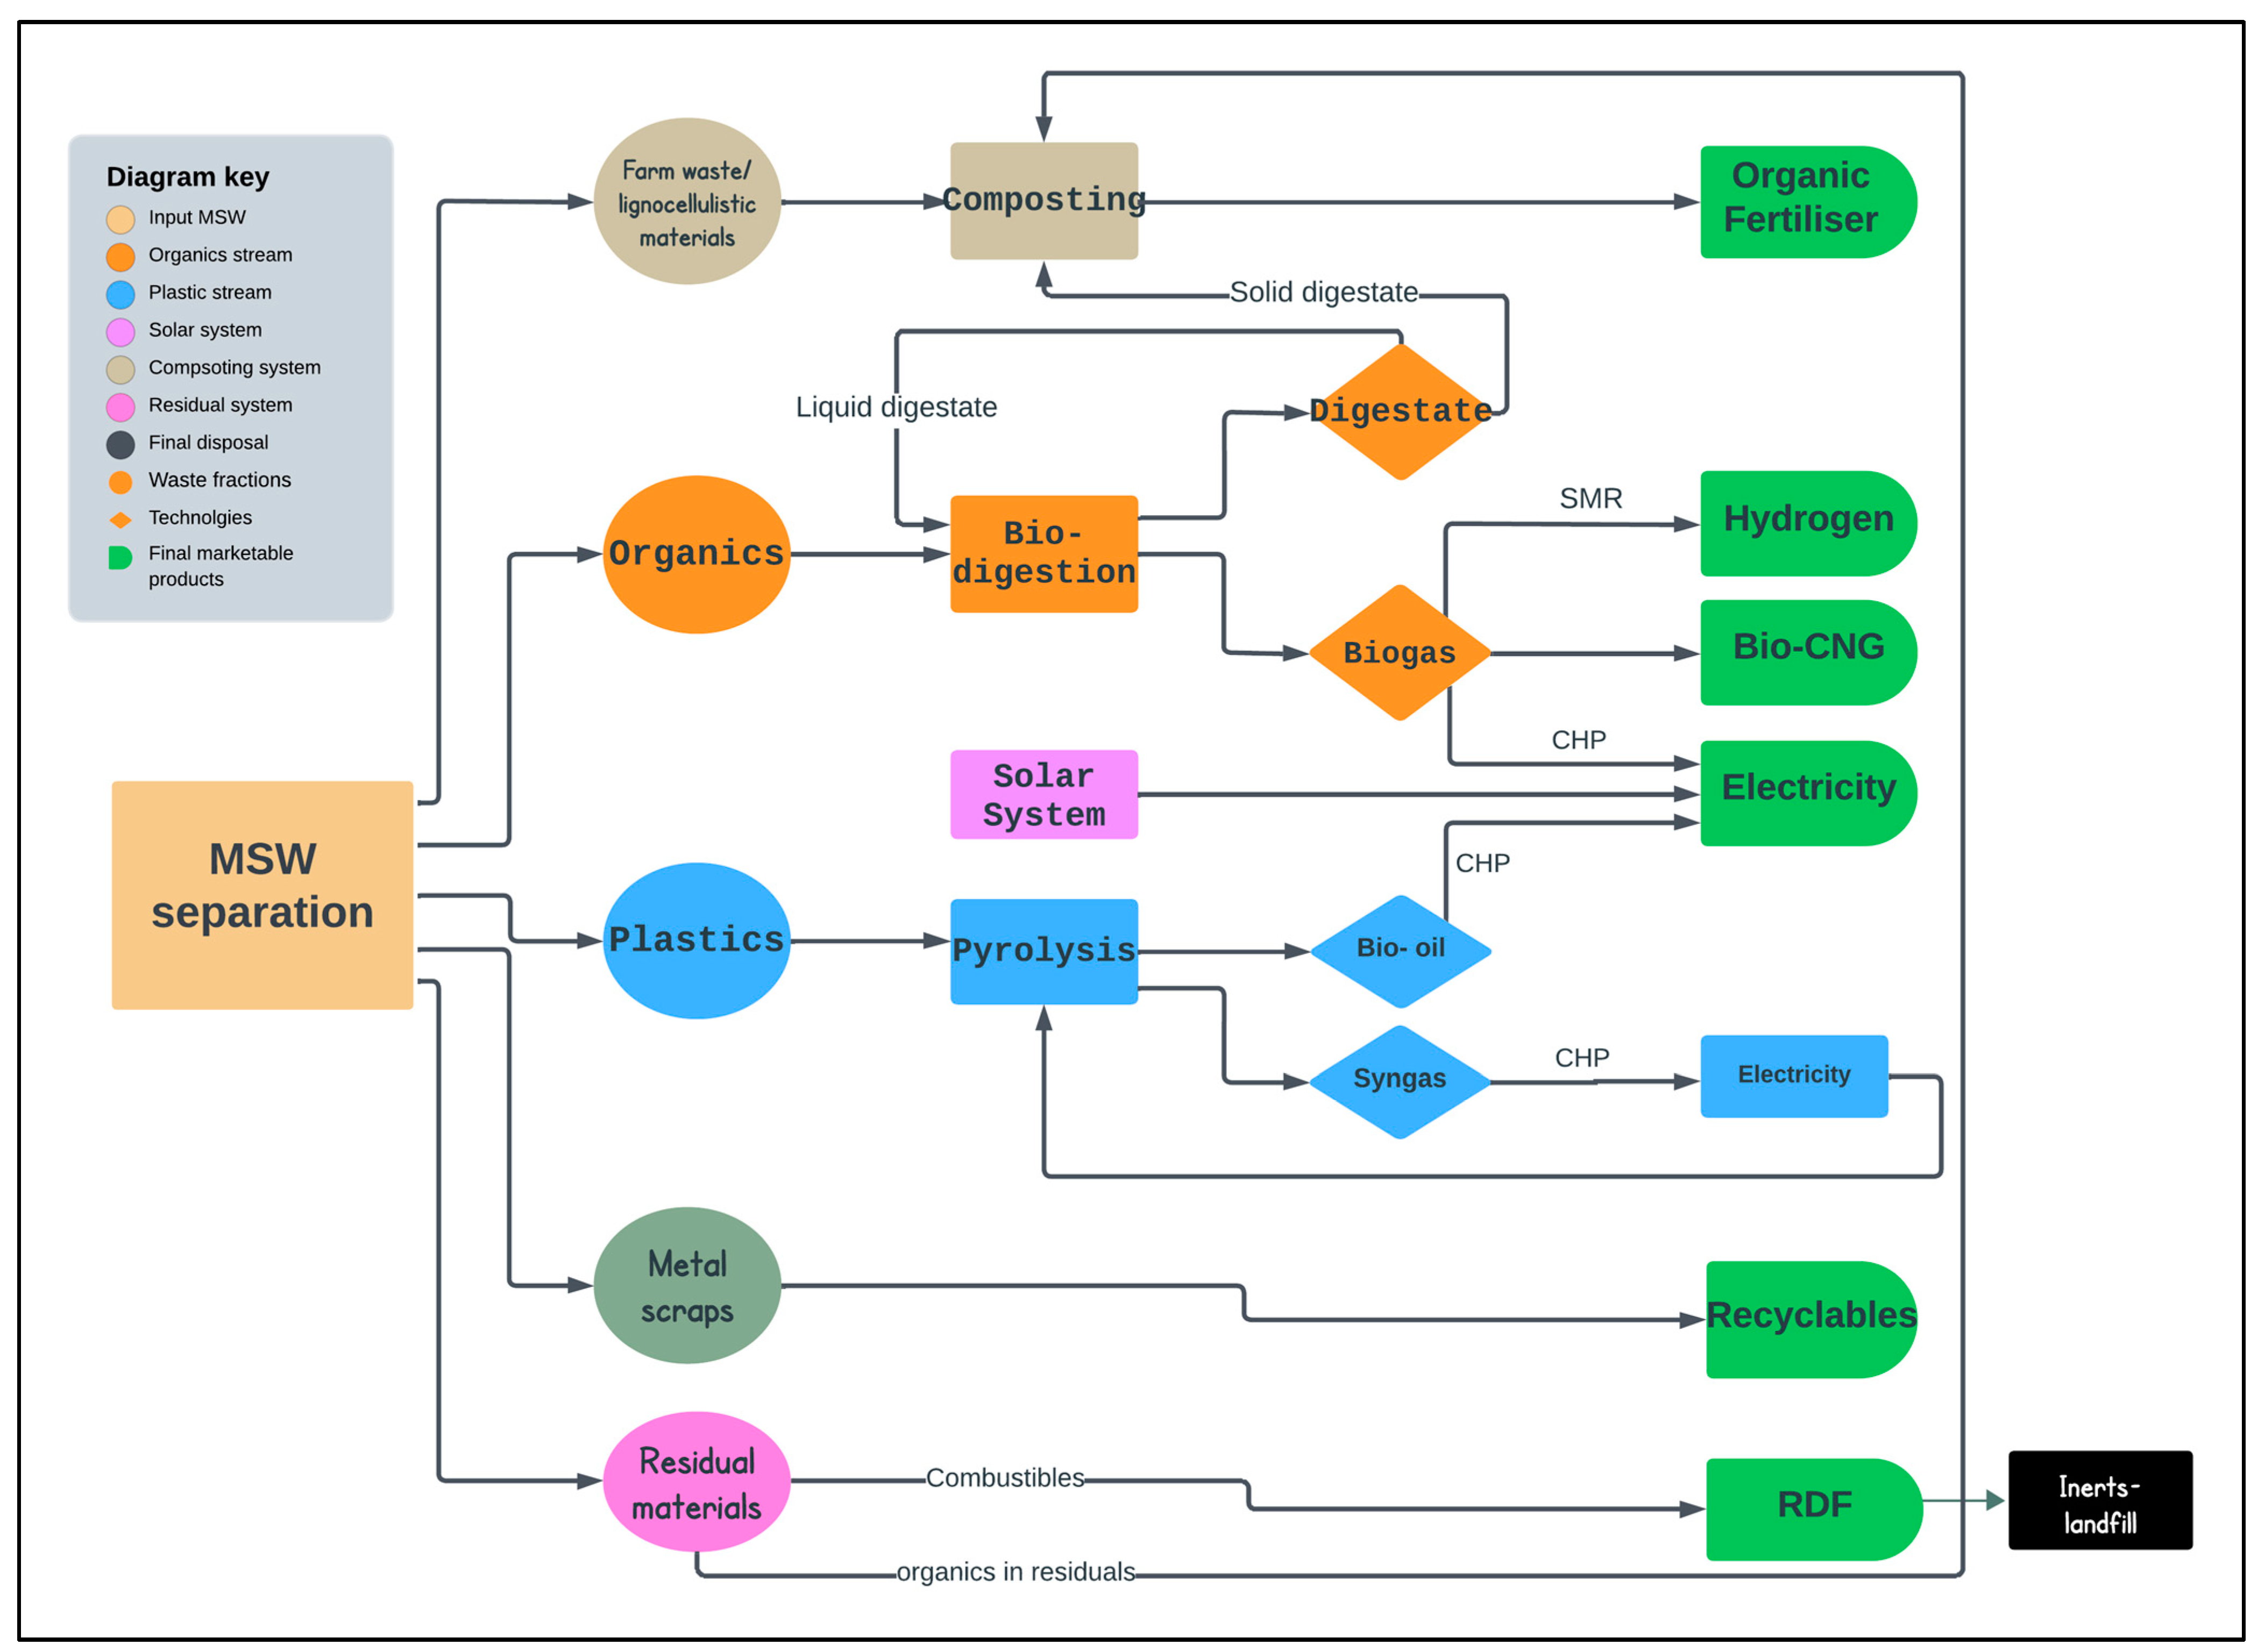
2.2. Technical Design of the Plant

The proposed plant under consideration in this study will be referred to as the GAMA plant. The design will follow a similar design to the pilot plant. A previous publication offered a technical description of the pilot plant being scaled up and replicated in this study [33]. When a waste truck arrives at the plant, waste is off-loaded into a bunker. A pay loader transfers the waste onto a segregation conveyor, after which the waste undergoes manual and mechanical sorting. The onsite segregation is similar to the process in a typical material recovery facility (MRF) [60]. After sorting, each waste fraction is directed to a specific treatment system: organics to the anaerobic digester (AD), non-recyclable plastics to pyrolysis and residuals to the RDF. About 5.6% of inert substances (e.g., ceramic, ash, sand, glass) are expected to be transferred to a landfill or for other land reclamation uses. The purified biogas is then converted to electricity or fuels: hydrogen or bio-CNG. The digestate from the AD is processed into compost. Figure 3 presents the technical design for the proposed plant.
The independent systems within the plant and their expected outputs are as follows:
1.Energy-electricity
2.Alternative fuels -RDF, bio-CNG, hydrogen, bio-oil
3.Plant nutrients -compost
4.Recyclables -scrap metal, etc.

2.3. Resource Assessment

The GAMA plant will also utilize hybrid renewable energy technologies that integrate solar PV, anaerobic digestion (AD) and pyrolysis. Two key resources will feed the plant: (1) MSW and (2) incident solar radiation for the solar PV system. The following sections describe the estimation of the key resources for the proposed GAMA plant.

2.3.1. Quantification of MSW for the Proposed Plant

In order to achieve a sustainable city, it is proposed that the waste now being disposed of untreated at the landfill site should be diverted to the proposed plant and only the untreatable or complex waste be transferred to the landfill site. This also assumes that by 2030, the treatment capacity of the current composting and recycling plants will be increased to allow for additional material recovery. The quantity of waste expected at the plant ( Q M S W 2030 ) (t/d) is calculated by the following (Equation (1)):
Q M S W 2030 = P 2030   ×   Q g e n / c a p   ×   % W c o l l ( % W r e c )
where P 2030 is the population by 2030 using an annual population growth rate of 2.9% for the Greater Accra Region obtained from the last census data in 2021 [11]. Q g e n / c a p is the waste generated per person per day (kg/cap/day); several studies have confirmed that each resident of Accra produces an average of 0.7 kg/day [55,56]. % W c o l represents the percentage of collected waste; in Accra, it is estimated that 91% of generated waste is collected and can be made available for waste management, which is above the national average of 56.5% for urban areas. The remaining is lost in open spaces, drains and burning. % W r e c is the proportion of collected waste recovered for recycling, composting or RDF by the existing composting plants and private recycling firms, which is estimated as 12% of the waste generated [44,61].

2.3.2. Quantification of Waste Fractions

The major components of the input waste expected to be received at the plant were estimated from a previous study in similar MRF plants in Accra and Kumasi (ACARP, IRECOP and KCARP) [23]. The expected fractions are presented in Table 1. Of these, the recovered portion from the MRF is 52–70%, while the remaining input waste exits the segregation system as the reject/residual fraction (RF) and inerts. The majority of the plastics are recovered as large materials through manual sorting. For the purposes of this study, the organics and plastics recovered from the MRF are referred to as the primary fraction (PF), which is considered to have an average value of 60% of the input waste. This implies that the same fraction of Q M S W 2030 is available for the WTE system (AD and pyrolysis). On average, RF contains 24% organics and 34.7% plastics, equivalent to 9.6% and 13.9% of the input waste.
Thus, the total quantity of the PF is calculated using the equation below, where n is the ratio of PF (%), which is taken to be 60% in this study:
Q P F = Q M S W 2030 × n
The quantities of organics and plastics from the PF after manual and mechanical sorting are calculated using the ratios in Table 2 and Equation (3):
Q X = % X P F × Q P F
where Q X is the quantity of each waste fraction (organics and plastics) (tons/yr), and % X P F is the fraction of each waste in the PF.

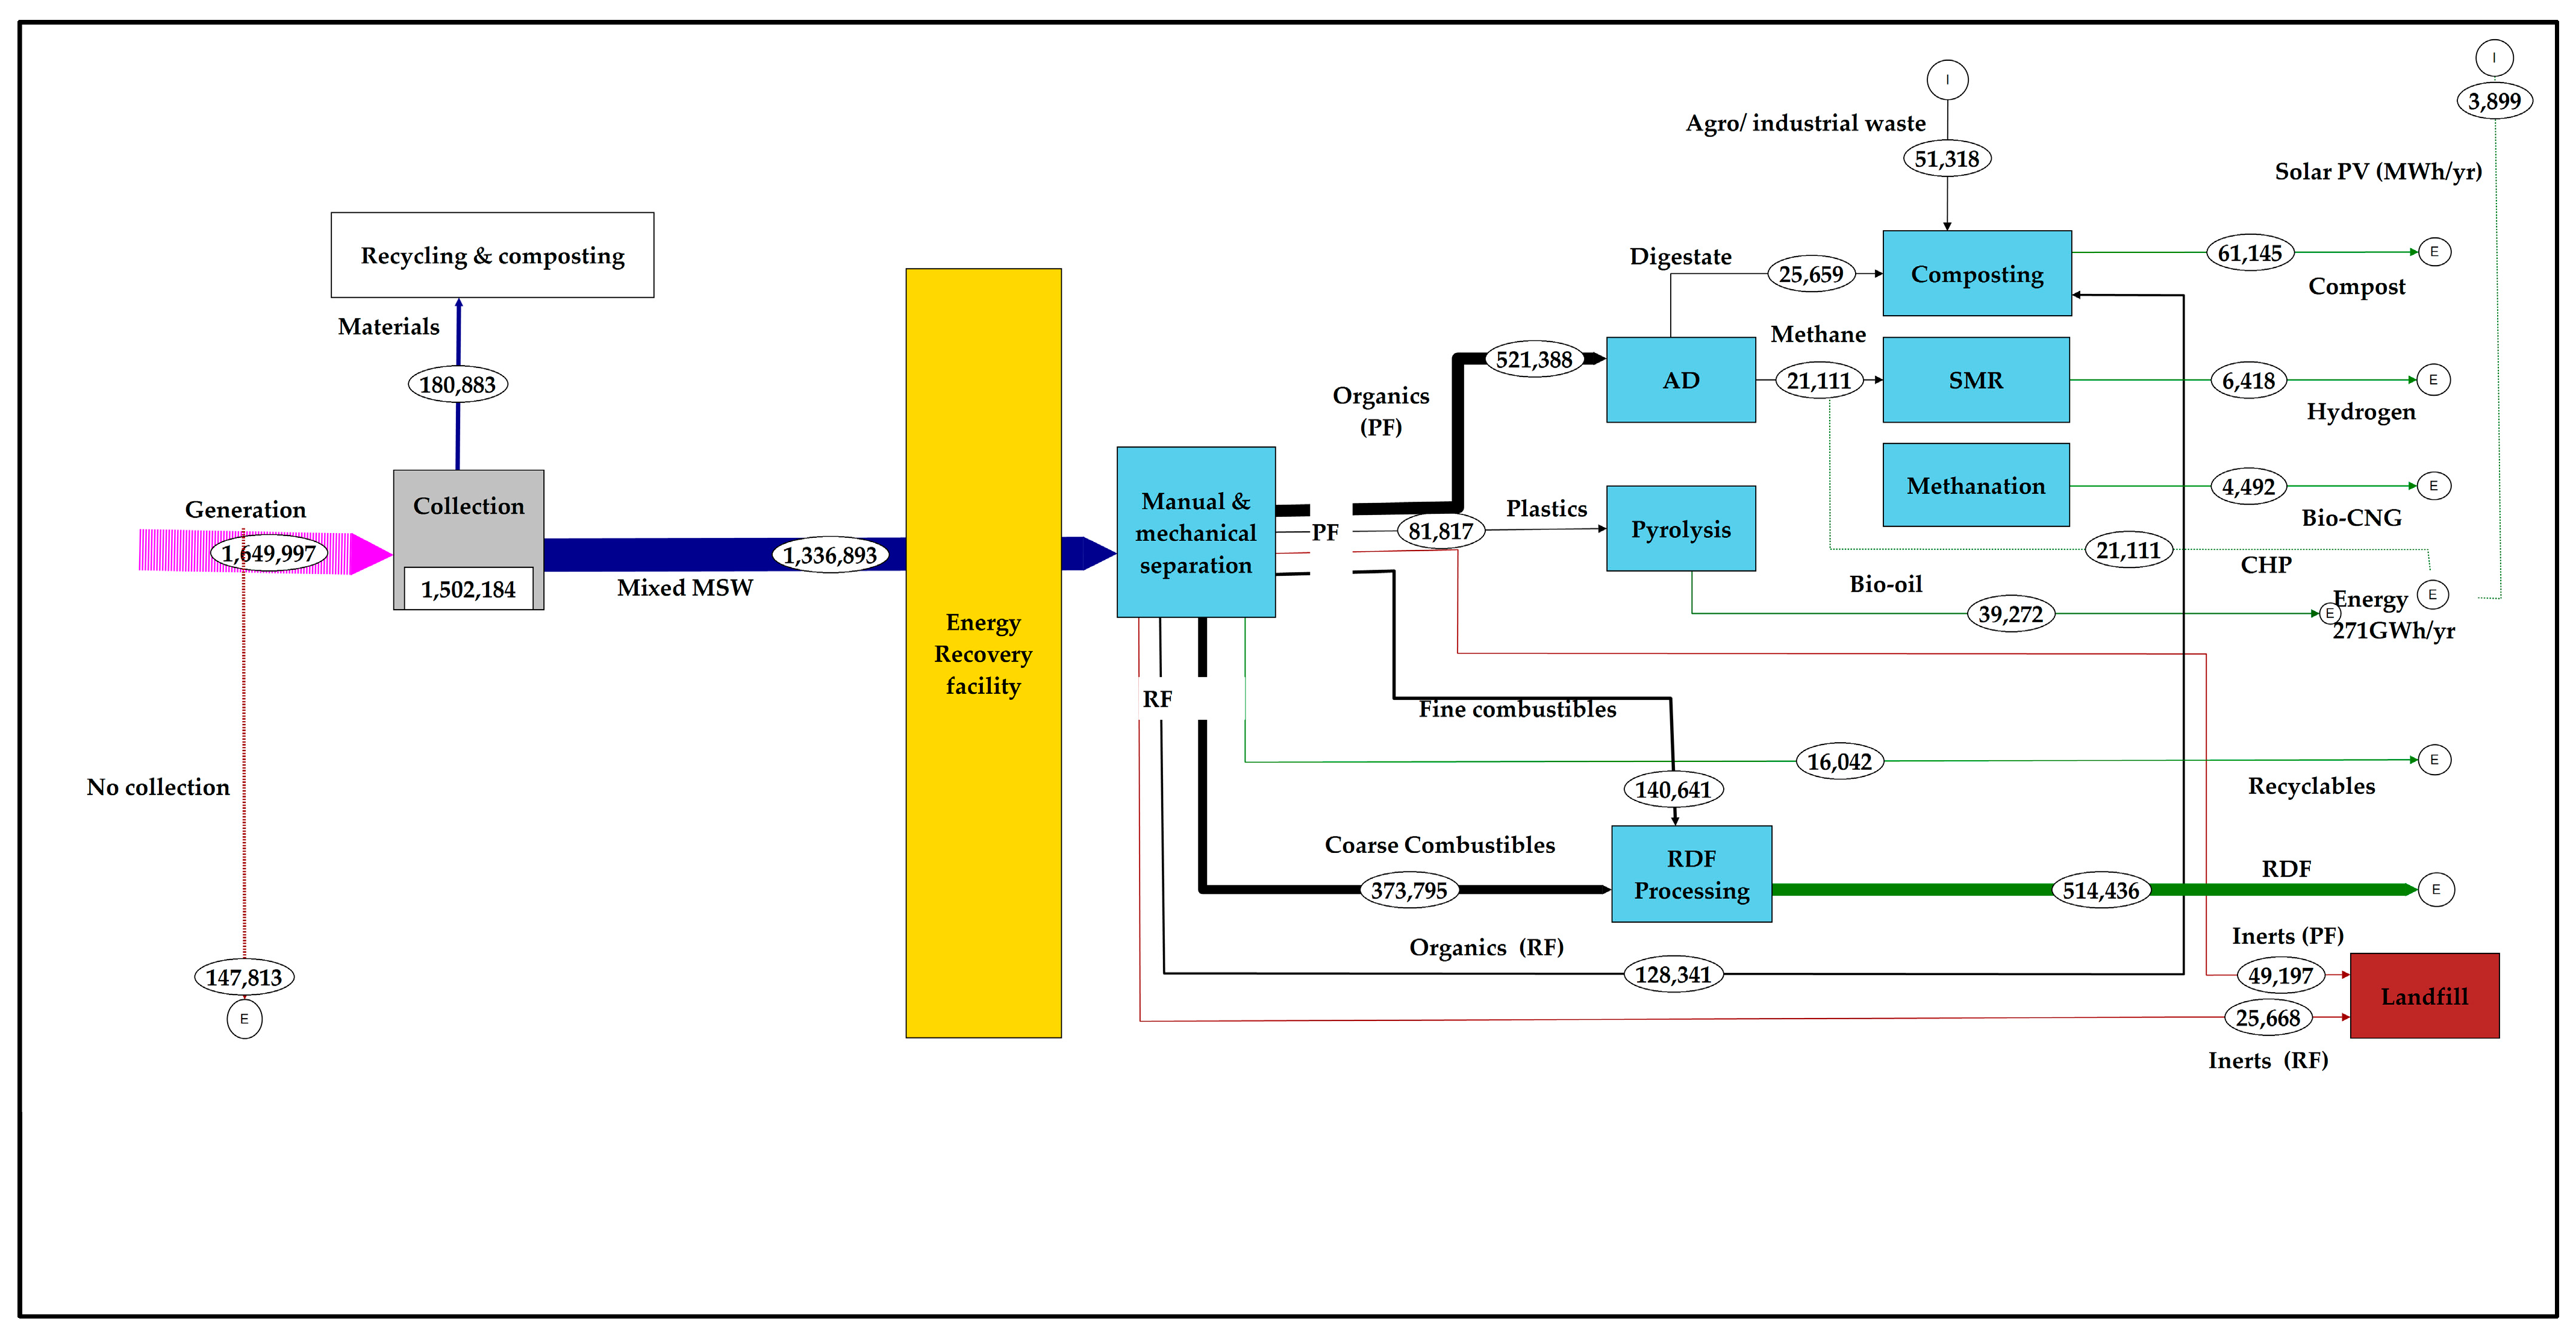
2.3.3. Material Flow Model for GAMA

The data on resource assessment from the previous section were transferred into STAN software 2.7.101 to model the material flows through the system. The STAN software provides a comprehensive platform for assessing the material flows from a system and computing the mass balance [63]. A material flow projection for the GAMA by 2030 was developed using the current data for material flows for the GAMA, sourced from previous studies published between 2015 and 2021 [13,15,44,55,62]. The ratio of the various material flows in these studies was used to project the flows from waste generation in 2030. This assumed that the components of the waste management system in the GAMA will expand at the same rate as in 2021.

2.3.4. Incident Solar Radiation

The incident solar radiation at the Ayidan landfill site was obtained from the software-integrated NASA database in the RETSCREEN Expert® Software version 8.0.1.31. The software automatically generated the average annual incident solar radiation at the selected site at longitude −0.4 and latitude 5.8.

2.4. System Capacity and Expected Outputs

The plant is expected to produce six marketable products as outputs. Each of the products requires a specific methodology, as outlined below. The plant is expected to operate for 335 days/yr, with 30 days allocated for scheduled maintenance and unplanned breakdowns.

2.4.1. Electricity (Energy)

The electrical energy transferred to the grid is expected to come from three sources, i.e., anaerobic digestion ( E A D ), pyrolysis E p y r   and solar PV ( E p v ). The net energy transferred to the grid is minus the internal energy consumption, which is estimated to be 50% of the energy from the solar PV.

Anaerobic Digestion (AD)

The AD system produces biogas for electricity generation. Biogas contains about 65% methane, along with other compounds that are often unwanted and thus must undergo purification. Pure methane is obtained, which powers a combined heat and power engine (CHP) to produce electrical energy. Table 3 details the step-by-step process for estimating the energy output for the AD system.

Pyrolysis

The pyrolysis system used in this study is expected to follow a similar setup to the pilot plant. Similar process are also described by [25,69]. The pyrolysis process is expected to be carried out through catalytic polymerization at a temperature of 500 °C using natural zeolite as the catalyst. The system contains an energy source, plastic chopper, fluidized bed reactor, condenser, acidity remover and fractional distillation chamber. The gas produced is directed into a CHP to produce electricity to power the process. A closed-loop system is formed where the mass balance within the reactor evens out the input and output masses [18]. The internal energy demand, which is estimated at 844 W/kg, is supplied by a CHP utilizing the gas recovered at the reactor. This key assumption is represented by Equation (8). Table 4 details the energy output through pyrolysis. The power capacity of the pyrolysis system is calculated using Equation (7).

Solar PV

For the solar PV system, the specifications are assumed to be the same as those already installed for the pilot plant. Thus, using the same module characteristics and site-specific irradiance data, the RETSCREEN Expert software version 8.0.1.31 estimates the energy output from the PV system. The Talesun TP6L72M Mono-Si module was used with the technical specifications indicated in Table 1. The Sinexcel PWG2 inverter was also applied, which has an efficiency of 95.5%. The capacity of the solar PV system ( C a p p v ) (kW) was taken to be the same as that of the AD system. The key technical specifications for the PV module are given in Table 5.

2.4.2. Alt Fuels

Bio-CNG and Hydrogen

From the methane yield obtained above, bio-CNG or hydrogen can be produced. First, H2 is produced, after which Bio-CNG is produced from H2. Hydrogen is expected to be produced from stem methane reformation (SMR), which consists of a reformer reactor and a shift reactor with nickel as the catalyst. The final quantity of compressed H2 in m3 is calculated using Equations (10) and (11) [33]
Q H 2 = V C H 4 × ρ C H 4 × E f f b o i l e r × E f f r e f o r m e r × 0.5
Q H 2   c o m p r e s s e d = Q H 2 × E f f c o m p r e s s i o n
where QH2 is the total hydrogen produced (kg), ρ C H 4   is the density of methane (kg/m3), which is considered to be 0.717 kg/m3, VCH4 (m3) is the volume of purified methane at 95% purity and E f f b o i l e r and E f f r e f o r m e r   are the efficiencies of the steam boiler and reactor for the dry and steam-reforming reactions. It is assumed that 1 m3 of steam-reformed methane is equivalent to (0.5 ×   ρ C H 4   )kg of H2 gas, and that H2 requires compression and storage of the final product under pressure to be transported to the customer. E f f c o m p r e s s i o n is the compression efficiency, which is assumed to be 95%.
Bio-CNG is estimated through the Sabatier reaction, where H2 reacts with carbon dioxide to produce pure methane and water in the presence of a methane catalyst [71]. The methane gas is compressed to facilitate storage and transportation using Equation (12) above.
The two fuels can be adopted depending on the availability of the markets and the cost–benefit assessment. Bio-CNG may be preferred due to potential local markets, while hydrogen currently needs to be exported to international markets.

RDF

RDF is produced from the quantity of the RF received after segregation and other treatment options have been exhausted. RDF studies in Ghana have shown that the RF makes up an average of 40 wt% of the initial waste and may contain up to 95% RDF components, which are made up of 70% combustible materials (CF). The RF is estimated to contain 24% organics, 9.2% paper, 34.7% plastics, 9.7% textiles, 1.3% metals, 0.4% glass, 1.2% wood, 6.7% sanitary waste, 2.2% leather, 0.8% e-waste, 4.4% others and 4.8% inert substances such as glass, ceramics and sand. The proportions in the input waste are given in Table 1. However, the presence of organics in RDF reduces the lower heating value by 26% on average [23]. Thus, in order to improve the quality of the final product, the combustibles are considered RDF components. The organic fraction of the RF (ORF) is, therefore, transferred to the production of compost. Hence, the quantity of RDF is estimated by the following equation:
Q R D F = Q M S W 2030 × R F   ×   C F

2.4.3. Compost

One of the key outputs of the AD system is the digestate, which is a slurry that can be separated into solid digestate (SD) and liquid digestate (LD). The SD is the main component for compost production. A bulking agent is required to improve the physical and chemical properties of the final compost product [72]. The pilot plant is sited in a rural area with intensive agriculture. However, the plant being considered in this study is anticipated to be sited in an urban environment. Thus, farm waste may not be available in large quantities. Other potential sources of bulking agents include wood chippings or other industrial waste of a biogenic nature [73]. Another raw material for compost production is the organic component of residual waste from the material recovery system. It is estimated that the RF (as described in the previous section) may contain about 24% organics. This is referred to as the organic fraction of the residual waste (ORF). The quantity of compost expected to be produced through the windrow method is calculated using the following equation:
Q c o m p = Q S D + Q O R F + Q B u l k × % l o s s
where Q c o m p is the quantity of compost produced (tons/yr), Q S D   is the quantity of solid digestate, Q O R F is the quantity of organics in the residual waste and Q B u l k is the quantity of bulking materials.

2.4.4. Recyclables

The recyclables expected at the plant were estimated using previous studies from the Kpone landfill site, where the waste pickers mainly collect plastics, metals scraps, e-waste and cartons (if not contaminated). Based on the plant design and material flow, only metal scraps are expected to be transferred to recycling outside the plant. Depending on the market value and quantity, this may provide additional sources of revenue to the plant. We found that 1.2% metals are expected. The quantity by 2030 was estimated from the increase in waste generation based on the population growth rate and the input waste fractions (Equation (1)). Assuming 1 ton of steel has a volume of 0.127, and the metals are transported once every week (53 times each year), the space required to store the scrap metals is estimated using
Q m e t a l s × V s t e e l 53
where Q m e t a l s is the quantity of metal recyclables (tons/yr) and V s t e e l is the volume occupied per ton of steel.

2.5. Economic Feasibility Assessment

In order to assess the feasibility of the plant, a financial model was developed based on the assumptions in Table 3. The target for the new plant is to start operations in 2030 with a lifespan of 20 years, with decommissioning to begin in 2050. It is also assumed that the construction will follow the same 3-year timeline as the pilot plant. The feasibility was assessed using the net present value, the internal rate of return (IRR), the LCOE and the simple payback period (PBP). The Euro was the main currency used for this study. In cases where data were sourced in Ghanaian Cedis (GHC) (the local currency), the conversion to EUR was performed with the official European Commission exchange rate in March 2024 [74] of GHC 1 to EUR 0.073 (Table 6).
The revenues from the plant were calculated as a product of revenues and market prices. This study considered that the plant becomes an independent power producer (IPP) and transfers its net electricity production to the grid through supply to the power distribution company (Electricity Company of Ghana). From the published tariffs of the PURC in the first quarter of 2024 to take effect in April 2024, the electricity tariff for this study was 0.0726 EUR/kWh. However, the tariffs are expected to be reviewed each quarter. Based on the PURC published tariffs from 2008 to 2023, the annual escalation rate of revenue was calculated as 25% [50,76,77]. Beyond electricity, the revenues for all other products were escalated at the average rate of inflation. The inflation rate used in this study was computed as the average national inflation from 2014 to 2023 (15.14%) [78].

3. Results

3.1. Waste Resources by 2030

The quantity of waste is the most crucial consideration for this system. Based on the population of the 25 MMDAs within the GAMA and the regional average annual inter-censual population growth rate of 2.9% in the GAMA in 2021, it is forecast that the population will hit 6,457,913 in 2030. Figure 4 shows the estimated population increases in the metropolis and municipalities. The population will have doubled over the 20-year period from 2010 to 2030. Key hotspots are municipalities such as Kpone Katamanso and the Ga Districts, which will have populations above 400,000.
The total annual MSW generation is estimated at 1.34 million tons (Mt). Figure 5 represents the estimated waste recovery by 2030 assuming that the system expands at the same rate as in 2020. However, by 2030, it is estimated that citizen compliance with waste collection will improve in the metropolitan area, and that city authorities will improve the collection efficiency to achieve 91% of all generated MSW. Out of this, 11% will be treated in the current recycling and composting facilities across the GAMA [44]. Our estimation assumes that no new large-scale projects will be started within this period, leaving all other waste available for further treatment. Currently, all collected and untreated waste is directed to the landfill sites and open dumps across the city, and 15% of all collected waste will pass through intermediary transfer stations before its final treatment.

3.2. Estimated Material Recovery at the Hybrid Waste-to-Energy Plant

The material flows once the waste arrives at the plant depend on the characteristics of the input waste and the sorting efficiency of the manual and mechanical separation. Figure 6 shows the material flows and the conversion of materials into products using various technologies. According to Table 1, 802,135 t/yr is separated as the primary fraction, which contains 64% organics and 10% plastics. The magnetic separators are expected to remove 16,042 t/yr of metals for recycling. The remaining fine components are mainly made up of a mixture of plastics and paper, directed to the RDF section of the plant. Fine inerts such as glass, stones and ceramics must be eliminated from the primary waste and directed to landfill.
The residual fraction represents the rejected portion from the manual and mechanical separation. It is expected to contain 24% organics, which can be separated through a secondary separation process to be added to the digestate for composting. This will potentially improve the quality of the RDF produced, with a higher calorific value as compared to that containing organics. Overall, about 0.5 Mt/yr of combustible materials can be directed to RDF production. The RF also will contain about 25,668 t/yr of inert substances, which must be directed to landfill. It must be noted, however, that the waste fractions may only represent cumulative averages over a period, and daily variations in waste fraction are likely to occur based on original consumer patterns.
For the hybrid WTE plant being considered in this study, the annual input waste is expected to be 1.34 Mt. Only 74,000/yr of inert substances are expected to be sent to landfill, representing 6% of the input MSW into the energy recovery facility and 5% of all generated waste.

3.3. Product Outputs

The technical design of the plant considers seven independent systems. However, in order to assess the potential for various products for the market, this study considered three alternatives.
  • Case 1—All biogas and bio-oil for pyrolysis is converted to electricity for grid transfer and internal consumption.
  • Case 2—All biogas is converted to hydrogen. In this case, bio-oil is purified and sold as an industrial fuel. Solar PV provides energy for internal consumption.
  • Case 3—All hydrogen is converted to bio-CNG, while bio-oil is sold as an industrial fuel. Solar PV provides energy for internal consumption.
In total, 283 GWh of electricity is expected per year to be produced from a cumulative capacity of 107 MW. The AD system will produce 21,110 tons of methane per year. This can potentially be converted to three products (hydrogen, bio-CNG or electricity). For case 1, 27% of the revenue is expected from electricity alone. Out of this, the internal energy demand is expected to be satisfied with 3899 MWh/yr of the gross energy produced (self-consumption). This brings the total energy available for grid transfer to 229 GWh/yr. Internal energy is needed to power the various systems as well as laboratories and offices.
Cases 2 and 3 both present a scenario where alternative fuels are prioritized for industrial or transportation purposes. About 6417 tons of hydrogen is expected to be produced through steam methane reformation in Case 2, and 4492 of bio-CNG in Case 3. An additional 39,272 of crude bio-oil will be available in each case, together with RDF and compost.
The digestate from the AD system is directed to the composting shed to produce organic fertilizer for the local market. It is estimated that 25,659 tons of solid digestate will be produced from the digester. In order to improve the physical and chemical characteristics of the compost, a bulking agent is required, which must be of a lignocellulosic nature. In such an urban environment, farm waste may be difficult to acquire. Industrial waste such as wood chippings can be added at a ratio of 1:2. This is estimated to produce 61,146 tons of compost per year. When the organic component of the RF is added, this can potentially increase to 160,000 tons/yr.
The estimated recyclable metal scraps weigh 17,167 tons per annum. These will not receive any treatment on-site but will require a storage space of 45 m3 to allow for a dislodging rate of once per week. Overall, the 39,000 tons of inert substances are to be transferred to the landfill, which represents 6% of the input waste and 5% of the generated waste. This excludes all other waste that is directed for other treatment or recycling or waste that is not collected at the point of generation.

3.4. Business Case

The project-related costs are categorized as capital costs (CAPEXs) and operation and maintenance costs (O&Ms). The O&M costs are further distinguished as fixed costs and variable costs. The fixed costs for this study include labor, interest on debt, insurance, equipment replacement costs and scheduled maintenance. The variable costs depend on the revenues, and they include marketing and transportation, taxes, energy costs, maintenance and miscellaneous expenditure.
The financial parameters are presented in Table 7 below. All cases are viable, although Case 1 considering the conversion of all biogas and bio-oil to electricity is the most viable option. The NPV is positive in all cases and higher than the CAPEX. This is also reflected in the IRR, which is higher than the discount rate of 10%. The LCOE is expressed as 0.18 EUR/kWh for Case 1, while the others, which focus on internal use of solar PV energy, have a lower LCOE. The investment cost for solar PV is lower than that for the AD and pyrolysis plants, thus contributing to a lower LCOE. In all cases, compost and electricity, hydrogen or bio-CNG make up 75% of revenues. In Cases 2 and 3, RFO and RDF contributes an additional 14.6% and 9.6%, respectively, while recyclables provide less than 1%.

4. Discussion

4.1. Quantity of Waste Generated and Treated

Waste management is dependent on the population increase and other social patterns, along with the policy direction of the government, such as for waste segregation.
Recyclables can potentially be recovered by waste collectors at the site. In a 2018 study, it was estimated that about 3 tons of waste is recovered daily from a total landfill waste of 931 tons/day [19,58]. Thus, the current model reduces the current landfill waste from 85% to 6%. There are then space savings from the landfill since each ton of waste occupies 2 m3. Thus, about 1.1 million m2/year will be saved from the landfills across the city [58].
This study considered RDF from the RF, which contains various fractions of waste including organics, combustibles and inerts. The combustibles form 38% of the input waste, which is comparable to the 30% in other studies [79]. The presence of organics in RDF results in a final RDF product with a lower energy content (19.7–23.7 MJ/kg) due to its higher moisture content [80]. It is recommended that a further mechanical sorting step be incorporated to remove organic components of RDF, to improve the energy properties. Results from a previous study in Ghana showed that RDF containing only combustible materials, making up 70% of the RF, has a higher heating value (28.6–30.3 MJ/kg), which is comparable to that of coal (18–36 MJ/kg) [23]. The organics removed at this point may be directed to the compost. It has also been discovered that bio-drying can improve RDF quality by reducing the moisture content by 24% and the mass of RDF by 33% [81,82].
The combustibles can become a potential resource for the production of additional electricity for the plant. The plant can be designed with a gasification system to convert RDF to electricity, whereby 1242 GWh of energy can potentially be produced per annum per ton of RDF. This is based on the assumption that 1 ton of RDF contains 23,000 MJ of energy, with each MJ also containing 0.3 GWh at a 35% conversion efficiency [79]. This is about five times the energy produced from the other renewables. However, this will involve additional CAPEX for gasification, which may affect the LCOE and NPV. RDF is also an important source of energy for the local industry, especially the cement industry. With technical modifications such as preprocessing, RDF can potentially offer cost savings of 7.18 EUR/GJ [83].
The inerts are the only component of waste expected to be sent to landfill, representing only 5.6% of the initial waste. This is lower than in some studies involving waste from households, markets and other open areas, where the inert component of waste was found to be relatively higher at 8% [62].
Although compost contributes the most to the revenue mix, its marketing and promotion can potentially be challenging. With production in an urban area, the product must be transported to rural agricultural areas to be used for farming. Thus, 80% of the cost of marketing, promotion and transportation was allocated to the compost product. In the event that this increases above the 28% allowable margin, other product costs must be reduced to cross-subsidize the transportation cost for composting. Cross-subsidization may become an important opportunity for this plant, where various products support one another through the shared cost of operations and maintenance (Table 8).

4.2. Energy Potential to Supplement National Energy Demand

Ghana has faced major challenges in power generation in recent years due to the overdependence on fossil-based generation sources, which has had a gross impact on the cost of energy. This study found that electricity tariffs increased by an average of 25% per annum between 2008 and 2023. A tariff review typically considers the hydro-thermal generation mix, the currency exchange rate, inflation rate and fuel prices [50]. Renewables can potentially stabilize the price adjustments and reduce the economic implications of purchasing fossil fuels from external sources. As compared to similar developing countries such as Kenya, the tariff increments caused by fluctuating fossil fuel costs and economic indicators provide a substantial risk for potential businesses and consumers who depend on electricity [84].
The total energy output from the AD system is comparable to the results obtained in a study of the energy potential of waste from the Kumasi metropolis [47]. Assuming that 100% of biogas produced is directed to electricity generation, the plant has the potential to supplement national generation by 110 GWh/yr. However, under the current plant design, only 33% is directed to electricity, with the remaining producing hydrogen and bio-CNG. According to the national energy statistics, the national dependable capacity is 4975 MW, with 95 MW renewable capacity apart from hydropower [85]. The proposed plant can potentially generate an additional 88 MW to the renewable capacity. This could potentially increase the current capacity by 92% and almost double the current contribution of renewables to the national energy mix, to 3.7%. This may make a significant contribution to the target of attaining 10% renewables in the national energy mix by 2030 if this model is replicated at a national scale [86]. One of the important policy objectives of Ghana within the energy sector is the diversification of the national energy mix in terms of energy sources by implementing programs to support the development of renewables [87].
Adopting this model at the national level also supports the objective of generation diversification based on geographic location. This can gradually be implemented by identifying the hotspots in the country for waste generation, which is also linked to the population. Various studies have identified metropolitan areas as the most important hotspots for waste generation, with a high potential for renewable energy through waste [46,48,55]. More importantly, urban areas have a higher waste generation rate due to their consumption patterns, and the collection rate was reported as 51.4% for urban areas, as compared to 5.8% for rural areas [88].

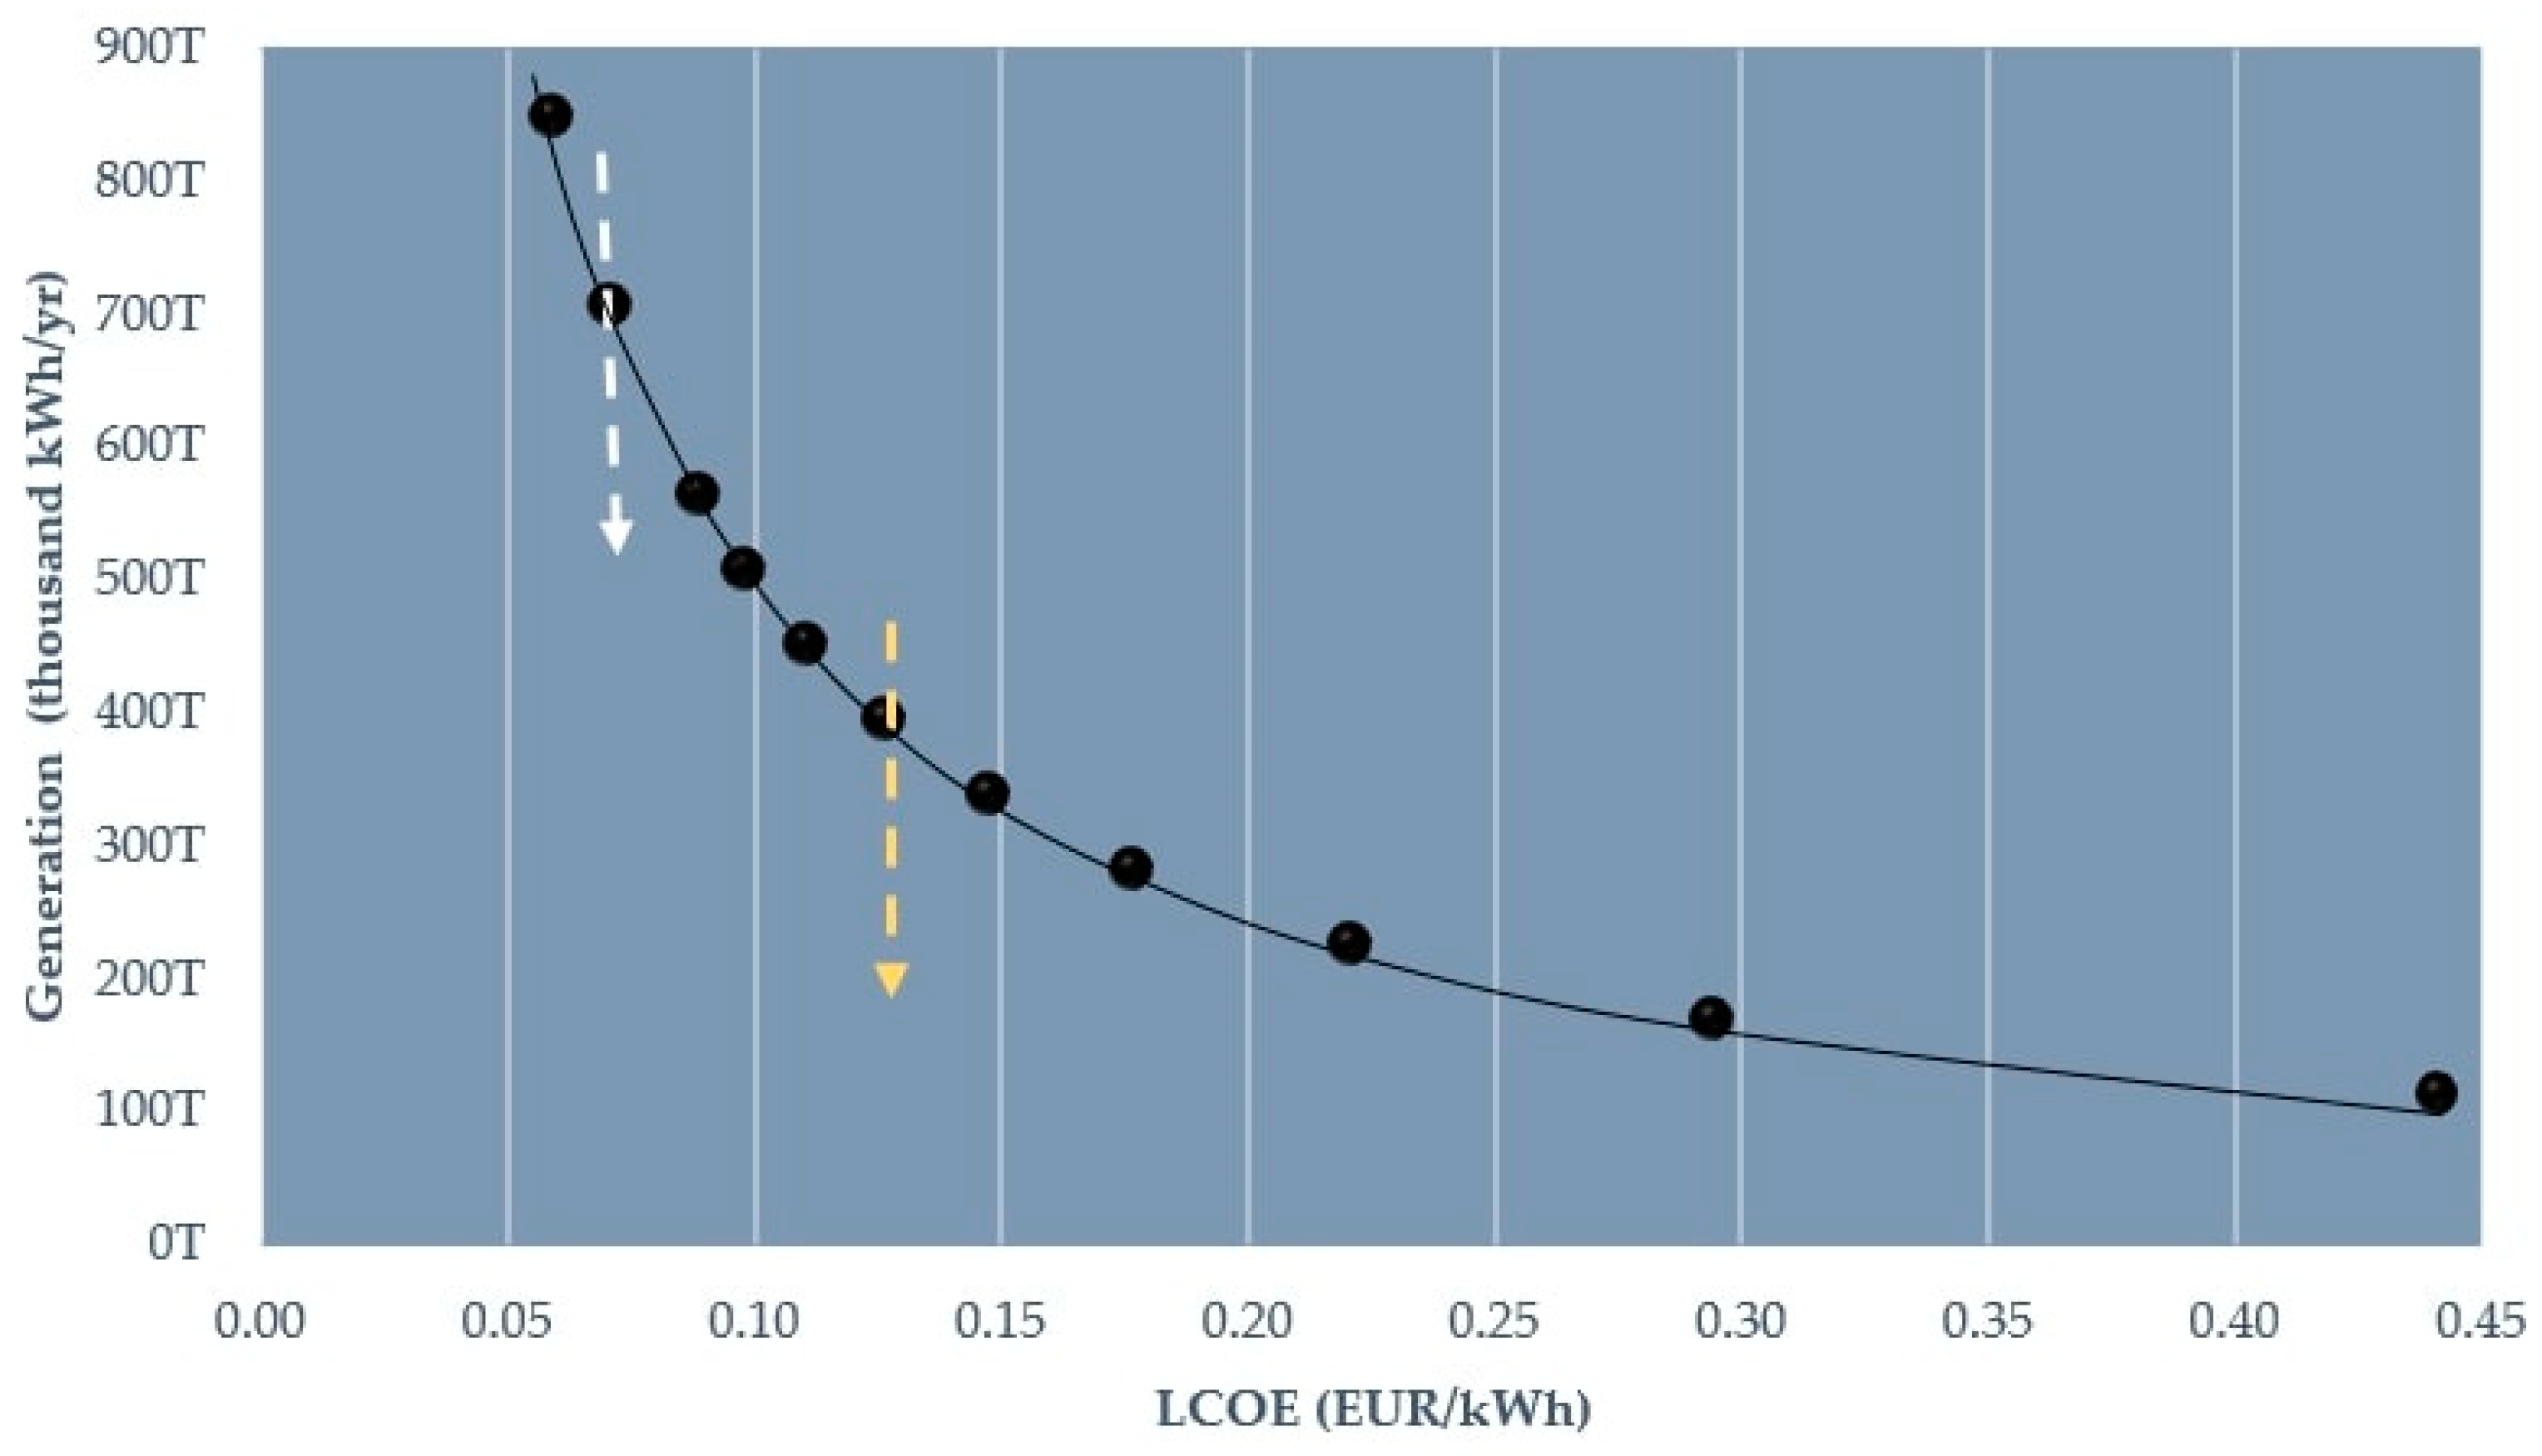
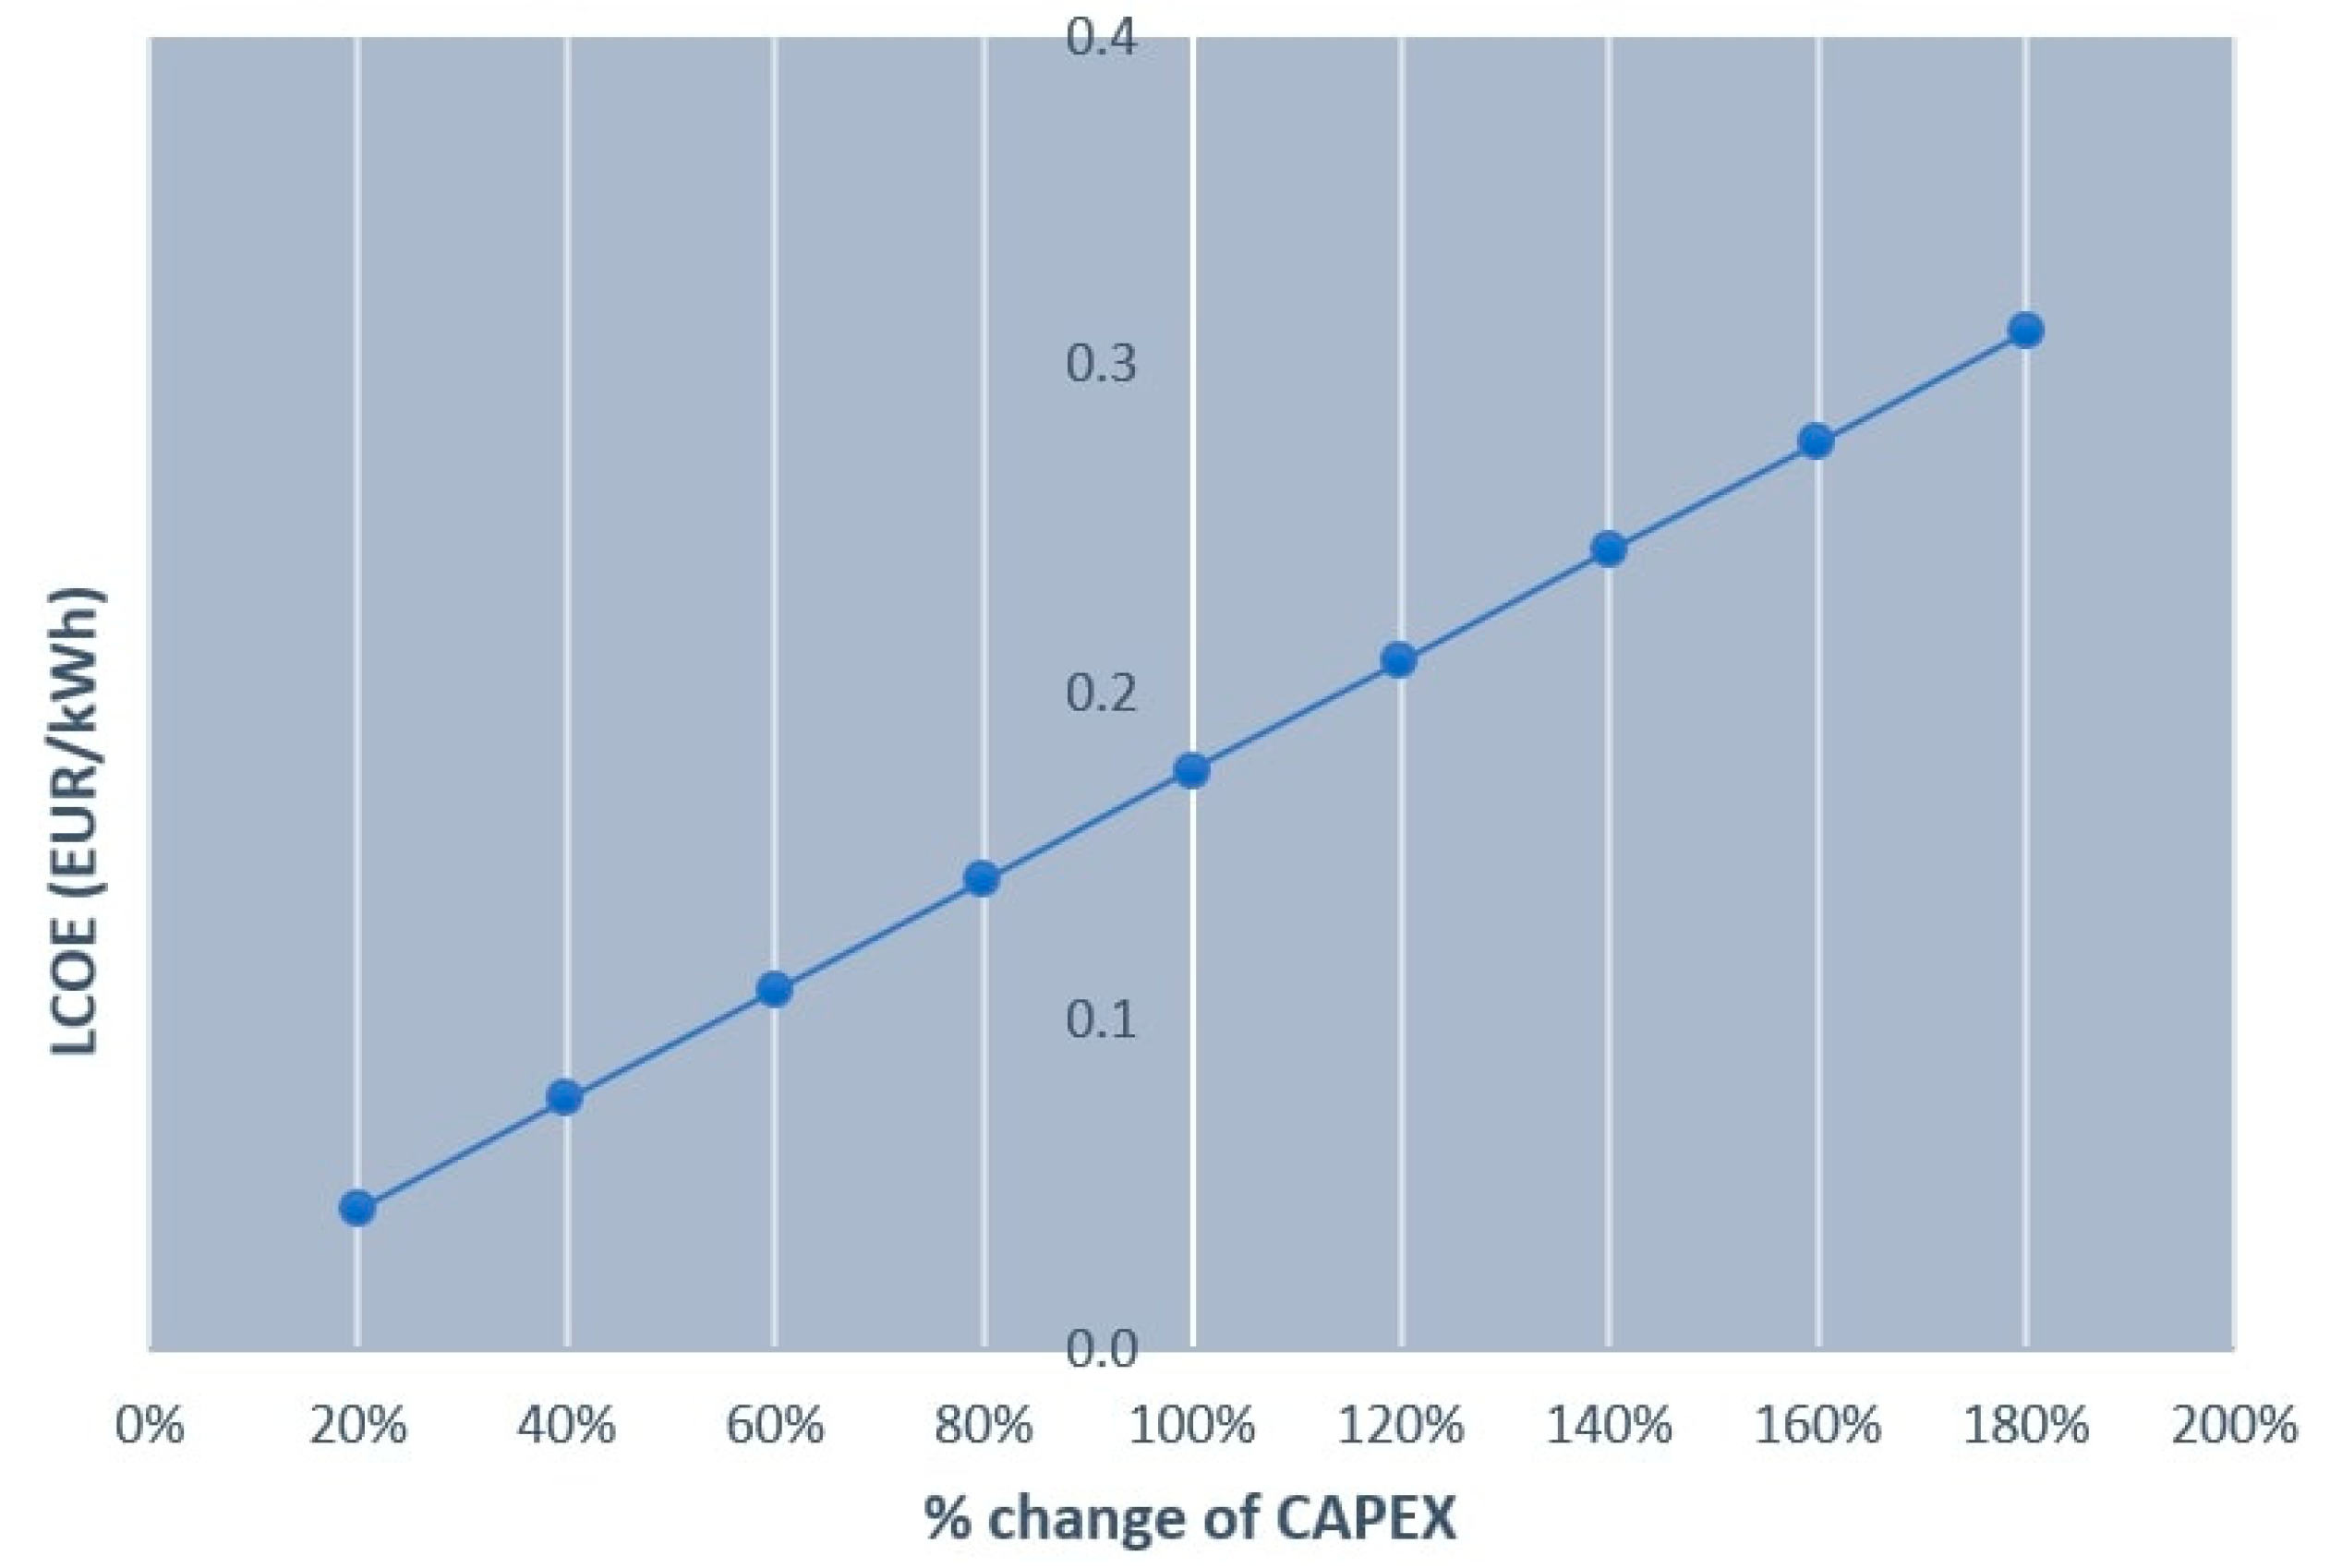
4.3. Sensitivity Analysis

The fixed costs, variable costs and tax combine to make up the total OPEX, which is escalated at the rate of inflation per annum. The O&M cost is calculated as 12% of the CAPEX, which includes the cost of capital, debt repayment, equipment replacement cost and scheduled maintenance. The variable costs, meanwhile, consist of energy costs, materials, marketing and miscellaneous expenditure. NPV and ROI approach zero when the fixed and variable costs (before tax) increase by 28.9%. This indicates that the operational and maintenance cost of the plant can be increased within this range while maintaining the economic feasibility determined by the NPV, whereas revenues must not be reduced.
The sensitivity analysis of LCOE is presented in Figure 7, which suggests that the plant expanding the capacity to 500 GWh/yr can potentially improve the LCOE. This can be expected as global RE prices continue to plummet. It also indicates that the O&M cost for electricity production will not meet the minimum point, considering the electricity export rate used for the analysis (0.076 EUR/kWh). The average residential EUT published in January 2024 was EUR 0.12 [74,89]. This indicates that the cost of the production of energy within the plant is too high when compared with the current tariff of power for the grid. Hence, the escalation rate for costs, which is the rate of inflation (15.14%), is too high to ensure a sustainable LCOE. Inflation is an external factor beyond the internal control of the plant. Due to the large capacity of the system in this study, the LCOE is lower than that of the pilot plant although higher than the tariff. The average LCOE for the pilot plant with a capacity of 400 KW was 0.53 EUR/kWh [33].
Other studies recorded similar high LCOE results for hybrid renewable systems in Ghana. However, such hybrid systems differ in the combination of technologies. In a 2022 study involving a hybrid solar PV and biogas system with an energy output of 396 kWh/day, it was found that it had an LCOE of 0.23 [39]. In a 2016 study, a hybrid solar PV and biodiesel generator system producing 104 kWh/day had an LCOE of 0.63 [90]. However, a 2023 study on a 400 MW floating solar system showed a very low LCOE of 0.091. This could be attributed to the lower cost per kW of solar PV (EUR1050/kW) as compared to AD or pyrolysis (3730/kW) in this study. A comparative study of solar PV, waste gasification and a hybrid of the two technologies revealed that NPV and IIR for the standalone solar PV performed better than the hybrid, with the gasification showing unattractive results. The cost difference between the technologies also has implications for future technical designs of the model proposed in this study. Moreover, it is implied that expansion of the capacity of such hybrid technologies can be implemented in regions with low waste generation and with a higher capacity of solar PV, to provide a lower overall project cost both in terms of CAPEX and O&M. In such instances, a lower LCOE can be obtained.
Since the none of these technologies are locally produced but are imported into the country, the influence of currency depreciation and fluctuations of the local currency has a high tendency to increase the CAPEX, while the OPEX is strongly influenced by local inflation. This indicates the strong influence of the local economic situation on potential investments [91].
According to the IEA and IRENA, the global cost of new renewable energy plants is expected to reduce in the next decade due to increasing research into cheaper technologies and increasing interest from governments in implementing utility-scale plants. Figure 8 shows that the LCOE is influenced by a certain percentage as the CAPEX increases or decreases. The LCOE for utility-scale solar PV plants in 2022 was 0.049, which was 29% lower than that for commissioned fossil fuel projects. Biomass, on the other hand, recorded an average of 0.54 EUR/kWh [92].

4.4. Broad Circular Economy Framework for GAMA

Waste governance is a major responsibility of city managers across SSA. However, this has proven to be very challenging. The circular economy created for the GAMA region includes a robust system for the collection of 96% of waste, recycling of 15% of the collected waste, with energy recovery from 45% of the input waste, 38% for alternative fuels and the remaining organics, recyclables and inerts for compost, industry and landfills, respectively. The energy, compost and recyclables present a direct source of material recycling, while the energy transferred to the grid presents energy recovery potential. Eventually, alternative fuels (hydrogen, RDF and bio-CNG) produce energy as the end use, also contributing to energy recovery from waste. This energy is typically for industrial manufacturing, also indirectly contributing to a circular economy.
In implementing this circular economy model, energy recovery must always be at the back end of material recovery. This will allow multiple players such as recycling industries within the current waste management infrastructure to be seamlessly integrated into the proposed model. Data indicate that each plastic recycling company collects about 30 tons of waste per day and has 50 direct employees on average, with an annual trade volume of EUR 14,000 by waste pickers distributed along the value chain [19,74]. This acknowledges the role of the informal sector within the waste management value chain, which incorporates over 2200 service providers and recycling entrepreneurs, who collect 1370 tons of waste per day [44].
One critical aspect of attaining a circular economy is source segregation. The social impact of this project must be carefully considered to ensure public acceptability. It has been estimated that the landfill site employs about 157 registered informal sector waste pickers who collect recyclable waste to sell to middlemen in the recycling trade. They only collect 3 tons of waste per day, with an annual average of 1000 tons [58]. This means the recyclable quantities estimated to be recovered from the plant can become a source of income for these waste pickers. However, a more sustainable approach will be to integrate them as unskilled workers at the plant. This will potentially improve their working and economic conditions since current waste collection activities are carried out with few health and safety measures. Careful public policies must be also directed toward supporting female entrepreneurs within the circular economy, such as farmers adopting the use of compost from the plant or those within the recycling industries [93].
SSA has adequate potential to implement such models to facilitate the attainment of SDGs 7,11 and 13. To do so, a multidimensional and multilevel approach is required. At the core, citizens must have a strong will to get involved in sustainable waste management. Policies focusing on source segregation, the circular economy and the trade of products are needed. To crown it all, strong institutions are required to enforce these policies [17].
This study’s results indicate that the cost of energy of the system is mainly affected by external factors such as inflation and the capital cost of the technologies. However, this study did not consider different investment and financing models such as various debt-to equity scenarios, capacity financing or government concessionary loans [94]. Investment security is important within the energy sector. Under the current economic conditions within the country, government concessionary loans can provide important means to cover the cost of producing energy from the proposed plant. Furthermore, in order to support renewable energy development in developing countries, Sustainable Development Goal 7.a.1 tracks the international public financial flows to developing countries. Ghana must actively take advantage of such policies. Moreover, research has a role to play in tracking the progress of specific countries such as Ghana [95].
This study has considered a hybrid renewable energy system a city in a developing country that is currently saddled with poor waste management. Although the results of demonstrate that such a system has the potential to improve the situation, there were a few limitations to this study. For one, there were no data available from municipal authorities on the exact daily waste generated in the metropolitan area. As such, data were based on projections from previous studies within the last five years. Research is needed to develop appropriate data collection systems to support accurate waste generation data. Furthermore, the social, health and environmental impacts of proper collection were not considered. In the future, the environmental and social costs associated with waste management can be valued to improve our understanding of the overall benefits of the project [96]. Since the current energy mix is dominated by hydro and fossils, it is important to compare the environmental savings made with the renewable energy replacement.

5. Conclusions

This study designed and assessed the feasibility of developing a utility-scale hybrid waste-to-energy plant within the Greater Accra Metropolitan Area. Waste is considered a huge nuisance within the city, and in this way, it can contribute as much as 271 GWh per year to the national energy mix. Also, alternative fuels can be produced if a PPA cannot be secured for the national grid. The options include hydrogen, bio-CNG and bio-oil. Compost is also a very important product, which can potentially contribute about 50% of revenues if rigorous marketing and cost-effective transportation and distribution channels are established to transport compost from the city to rural areas where agriculture is prevalent. Since Ghana has few large-scale farms, extensive stakeholder engagement across the country will be required to ensure adequate distribution channels are developed. Similarly, green hydrogen requires the development of local markets or trade on the international market. Within a circular economy framework, energy recovery stands at the backend of waste reduction and material recovery. This study has estimated that by 2030, 91% of the waste within the city can be collected with improvements in collection services, and 6% will go to landfill with WTE. In sum, waste segregation, material recovery and recycling must be improved to enhance the sustainable waste management within the city. Overall, this study provides a recommended strategic direction for city authorities and policy holders in order to solve the challenges associated with waste management and sustainable development. Future research must incorporate the environmental and social impacts of the project, as well as the economic cost of improved waste management for global society. Also, national resource mapping and research into the potential of the technical model are necessary to identify the hotspots in the country for waste generation. This can provide an index of the characteristics of various geographical locations across the country. With this, investment advice can easily be provided to potential investors, as well as guidance for future public policy decisions.

Author Contributions

Conceptualization, E.A.A. and S.N.; methodology, E.A.A., F.B.A. and M.M.; validation and data curation, S.N. and M.M.; writing—original draft preparation, E.A.A. and B.B.; writing—editing and review, M.M., S.N. and E.B.; supervision, S.N. and F.K.; funding acquisition, S.N. All authors have read and agreed to the published version of the manuscript.

Funding

This work was supported under the project “Waste to Energy: Hybrid Energy from Waste as Sustainable Solution for Ghana”, funded by the German Federal Ministry for Education and Research (BMBF), 03SF0591E, and the Open Access Publication Fund of the University of Rostock.

Informed Consent Statement

Not applicable.

Data Availability Statement

Data are contained within the article.

Conflicts of Interest

The authors declare no conflicts of interest.

References

  1. Population Reference Bureau World Population Data Sheet. Available online: https://2023-wpds.prb.org/data-sheet-download/ (accessed on 10 April 2024).
  2. United Nations. Department of Economic and Social Affairs: Population Division. In World Population Prospects 2022: Summary of Results; United Nations: New York, NY, USA, 2022. [Google Scholar]
  3. United Nations. Human Settlements. Programme (UN-Habitat). In Rescuing SDG 11 for a Resilient Urban Planet; United Nations Center for Human Settlements: Nairobi, KY, USA, 2023. [Google Scholar]
  4. Negrete-Cardoso, M.; Rosano-Ortega, G.; Álvarez-Aros, E.L.; Tavera-Cortés, M.E.; Vega-Lebrún, C.A.; Sánchez-Ruíz, F.J. Circular Economy Strategy and Waste Management: A Bibliometric Analysis in Its Contribution to Sustainable Development, toward a Post-COVID-19 Era. Environ. Sci. Pollut. Res. 2022, 29, 61729–61746. [Google Scholar] [CrossRef]
  5. UNEP. Africa Waste Management Outlook; UN Environment Programme: Nairobi, KY, USA, 2018; Volume 123, ISBN 9789280737042. [Google Scholar]
  6. Johnson, S. The Guardian; Accra, Ghana. 2023. Available online: https://www.theguardian.com/global-development/2023/jun/05/yvette-yaa-konadu-tetteh-how-ghana-became-fast-fashions-dumping-ground (accessed on 9 April 2024).
  7. OEC Used Clothing. Available online: https://oec.world/en/profile/hs/used-clothing (accessed on 10 April 2024).
  8. Ahimah-Agyakwah, S.; Nketiah-Amponsah, E.; Agyire-Tettey, F. Urbanization and Poverty in Sub-Saharan Africa: Evidence from Dynamic Panel Data Analysis of Selected Urbanizing Countries. Cogent Econ. Financ. 2022, 10, 4582. [Google Scholar] [CrossRef]
  9. Ndam, S.; Touikoue, A.F.; Chenal, J.; Baraka Munyaka, J.-C.; Kemajou, A.; Kouomoun, A. Urban Governance of Household Waste and Sustainable Development in Sub-Saharan Africa: A Study from Yaoundé (Cameroon). Waste 2023, 1, 612–630. [Google Scholar] [CrossRef]
  10. Wansi, B.-I. Afrik 21; Paris, France. 2022. Available online: https://www.afrik21.africa/en/south-africa-state-strengthens-western-cape-waste-management-system (accessed on 15 March 2024).
  11. Ghana Statistical Service Ghana. 2021 Population and Housing Census: General Report—Highlights—Volume 3; Ghana Statistical Service Ghana: Accra, Ghana, 2022. [Google Scholar]
  12. Ampofo, S.; Issifu, J.S.; Kusibu, M.M.; Mohammed, A.S.; Adiali, F. Selection of the Final Solid Waste Disposal Site in the Bolgatanga Municipality of Ghana Using Analytical Hierarchy Process (AHP) and Multi-Criteria Evaluation (MCE). Heliyon 2023, 9, e18558. [Google Scholar] [CrossRef]
  13. Gaisie, E.; Kim, H.M.; Han, S.S. Accra towards a City-Region: Devolution, Spatial Development and Urban Challenges. Cities 2019, 95, 102398. [Google Scholar] [CrossRef]
  14. Ayee, J.R.A. The Political Economy of the Creation of Districts in Ghana. J. Asian Afr. Stud. 2012, 48, 623–645. [Google Scholar] [CrossRef]
  15. Oduro-appiah, K.; Scheinberg, A.; Mensah, A.; Afful, A.; Boadu, H.K.; Vries, N. De Assessment of the Municipal Solid Waste Management System in Accra, Ghana: A ‘Wasteaware’ Benchmark Indicator Approach. Waste Manag. Res. 2017, 35, 1149–1158. [Google Scholar] [CrossRef]
  16. Asabere, S.B.; Acheampong, R.A.; Ashiagbor, G.; Beckers, S.C.; Keck, M.; Erasmi, S.; Schanze, J.; Sauer, D. Urbanization, Land Use Transformation and Spatio-Environmental Impacts: Analyses of Trends and Implications in Major Metropolitan Regions of Ghana. Land Use Policy 2020, 96, 104707. [Google Scholar] [CrossRef]
  17. Lissah, S.Y.; Ayanore, M.A.; Krugu, J.K.; Aberese-Ako, M.; Ruiter, R.A.C. Managing Urban Solid Waste in Ghana: Perspectives and Experiences of Municipal Waste Company Managers and Supervisors in an Urban Municipality. PLoS ONE 2021, 16, e0248392. [Google Scholar] [CrossRef] [PubMed]
  18. Tulashie, S.K.; Dodoo, D.; Mensah, S.; Atisey, S.; Odai, R.; Adukpoh, K.E.; Boadu, E.K. Recycling of Plastic Wastes into Alternative Fuels towards a Circular Economy in Ghana. Clean. Chem. Eng. 2022, 4, 100064. [Google Scholar] [CrossRef]
  19. Fiati, K.E. The Plastic Waste Value Chain in Greater Accra Metropolitan Area: Assessing Flows and Spatial Patterns of Recycling; University of Ghana—Institute of Sanitation and Environmental Studies: Accra, Ghana, 2021. [Google Scholar]
  20. Agbejule, A.; Shamsuzzoha, A.; Lotchi, K.; Rutledge, K. Application of Multi-Criteria Decision-Making Process to Select Waste-to-Energy Technology in Developing Countries: The Case of Ghana. Sustain 2021, 13, 12863. [Google Scholar] [CrossRef]
  21. Daadi, B.E.; Latacz-Lohmann, U. Composting Municipal Solid Waste for Agriculture in Northern Ghana: Rural Farmers’ Willingness to Pay for Compost Quality and Access Attributes. Q Open 2022, 2, 1–22. [Google Scholar] [CrossRef]
  22. Galgani, P. Compost, Biogas and Biochar in Northern Ghana Climate Impact and Economic Feasibility. Master’s Thesis, Leiden University, Leiden, The Netherlands, Delft University of Technology, Delft, The Netherlands, 2012. [Google Scholar]
  23. Sarquah, K.; Narra, S.; Beck, G.; Bassey, U.; Antwi, E.; Hartmann, M.; Sarfo, N.; Derkyi, A.; Awafo, E.A.; Nelles, M. Characterization of Municipal Solid Waste and Assessment of Its Potential for Refuse-Derived Fuel (RDF) Valorization. Energies 2023, 16, 200. [Google Scholar] [CrossRef]
  24. Seglah, P.A.; Wang, Y.; Wang, H.; Wobuibe Neglo, K.A.; Zhou, K.; Sun, N.; Shao, J.; Xie, J.; Bi, Y.; Gao, C. Utilization of Food Waste for Hydrogen-Based Power Generation: Evidence from Four Cities in Ghana. Heliyon 2023, 9, e14373. [Google Scholar] [CrossRef] [PubMed]
  25. Ndiaye, N.K.; Derkyi, N.S.A.; Amankwah, E. Pyrolysis of Plastic Waste into Diesel Engine-Grade Oil. Sci. Afr. 2023, 21, e01836. [Google Scholar] [CrossRef]
  26. Tagbor, T.A.; Mohammed, L.; Mohammed, M.; Bruce-Mensah, M.M.; Tekpetey, S.; Armoo, E.A.; Adomah, R.; Arthur, T.D.; Agyenim, F.B.; Amoah, J.Y.; et al. The Utilization of Palm Kernel Shells and Waste Plastics in Asphaltic Mix for Sustainable Pavement Construction. Sci. Afr. 2022, 16, e01277. [Google Scholar] [CrossRef]
  27. European Commission. A New Circular Economy Action Plan: For a Cleaner and More Competitive Europe; Communication from the Commission to the European Parliament, the Council, the European Economic and Social Committee and the Committee of the regions; European Commission: Brussels, Belgium, 2020. [Google Scholar]
  28. Tomić, T.; Schneider, D.R. “Closing Two Loops”—The Importance of Energy Recovery in the “Closing the Loop” Approach. Circ. Econ. Sustain. Manag. Policy 2021, 1, 433–455. [Google Scholar] [CrossRef]
  29. European Parliament and Council of the European Union EU Framework Directive 2018/851. J. Eur. Union 2018, 150, 32.
  30. Paiho, S.; Mäki, E.; Wessberg, N.; Paavola, M.; Tuominen, P.; Antikainen, M.; Heikkilä, J.; Rozado, C.A.; Jung, N. Towards Circular Cities—Conceptualizing Core Aspects. Sustain. Cities Soc. 2020, 59, 102143. [Google Scholar] [CrossRef]
  31. UNEP. Ethiopia’s Waste-to-Energy Plant Is a First in Africa. Available online: https://www.unep.org/news-and-stories/story/ethiopias-waste-energy-plant-first-africa (accessed on 10 March 2023).
  32. Tena, N. 400kW Hybrid Waste to Energy Power Plant a First for Ghana. Available online: https://www.esi-africa.com/industry-sectors/energy-efficiency/400kw-hybrid-waste-to-energy-power-plant-a-first-for-ghana/. (accessed on 10 March 2023).
  33. Armoo, E.A.; Mohammed, M.; Narra, S.; Beguedou, E.; Agyenim, F.B.; Kemausuor, F. Achieving Techno-Economic Feasibility for Hybrid Renewable Alternative Fuels. Energies 2024, 17, 735. [Google Scholar] [CrossRef]
  34. Offeh Gyimah, K.; Amoakohene, S.; Kojo Mensah, W. Challenges and Economic Benefits of Scrap Metal Trade at Kumasi Suame Magazine, Ghana. Int. J. Res. Publ. 2021, 77, 32–37. [Google Scholar] [CrossRef]
  35. Ghanaweb. The Scrap-Metal Industry a Multi-Billion-Dollar Business Left for the Average Joe. Available online: https://www.ghanaweb.com/GhanaHomePage/business/The-scrap-metal-industry-a-multi-billion-dollar-business-left-for-the-average-Joe-692279 (accessed on 16 January 2023).
  36. Tsai, F.M.; Bui, T.D.; Tseng, M.L.; Lim, M.K.; Hu, J. Municipal Solid Waste Management in a Circular Economy: A Data-Driven Bibliometric Analysis. J. Clean. Prod. 2020, 275, 124132. [Google Scholar] [CrossRef]
  37. Ellen Macarthur Foundation Circular Examples. Available online: https://www.ellenmacarthurfoundation.org/explore?sortBy=dateDesc&contentType=CircularEconomyExample (accessed on 13 March 2024).
  38. Rezania, S.; Oryani, B.; Nasrollahi, V.R.; Darajeh, N. Review on Waste-to-Energy Approaches toward a Circular. Processes 2023, 11, 2566. [Google Scholar] [CrossRef]
  39. Odoi-Yorke, F.; Abaase, S.; Zebilila, M.; Atepor, L. Feasibility Analysis of Solar PV/Biogas Hybrid Energy System for Rural Electrification in Ghana. Cogent Eng. 2022, 9, 2034376. [Google Scholar] [CrossRef]
  40. Sackey, D.M.; Amoah, M.; Jehuri, A.B.; Owusu-Manu, D.G.; Acapkovi, A. Techno-Economic Analysis of a Microgrid Design for a Commercial Health Facility in Ghana-Case Study of Zipline Sefwi-Wiawso. Sci. Afr. 2023, 19, e01552. [Google Scholar] [CrossRef]
  41. Afonaa-Mensah, S.; Majeed, I.B.; Odoi-Yorke, F. Advancing the Adoption of Net Metering: An Economic Assessment of Grid-Tied Solar Photovoltaic Systems in Urban Homes in Ghana. Int. J. Energy Res. 2024, 2024, 1–28. [Google Scholar] [CrossRef]
  42. Asante, K.; Gyamfi, S.; Amo-boateng, M. Techno-Economic Analysis of Waste-to-Energy with Solar Hybrid: A Case Study from Kumasi, Ghana. Sol. Compass 2023, 6, 100041. [Google Scholar] [CrossRef]
  43. AfricaFertilizer.org Fertiliser Statistics Overview Ghana 2015–2019; Ghana Statistical Service: Accra, Ghana, 2020.
  44. Oduro-Appiah, K.; Scheinberg, A.; Afful, A.; de Vries, N. The Contribution of Participatory Engagement Strategies to Reliable Data Gathering and Inclusive Policies in Developing Countries: Municipal Solid Waste Management Data in the Greater Accra Metropolitan Area of Ghana. Afr. J. Sci. Technol. Innov. Dev. 2020, 13, 735–746. [Google Scholar] [CrossRef]
  45. Amoatey, N.K.; Darmey, J.; Tabbicca, K.E. Estimation of the Methane Generation Potential of the Tamale Landfill Site Using LandGEM. Ghana Min. J. 2023, 23, 27–32. [Google Scholar]
  46. Kemausuor, F.; Kamp, A.; Thomsen, S.T.; Bensah, E.C.; Stergård, H. Assessment of Biomass Residue Availability and Bioenergy Yields in Ghana. Resour. Conserv. Recycl. 2014, 86, 28–37. [Google Scholar] [CrossRef]
  47. Amo-Asamoah, E.; Owusu-Manu, D.G.; Asumadu, G.; Ghansah, F.A.; Edwards, D.J. Potential for Waste to Energy Generation of Municipal Solid Waste (MSW) in the Kumasi Metropolis of Ghana. Int. J. Energy Sect. Manag. 2020, 14, 1315–1331. [Google Scholar] [CrossRef]
  48. Darmey, J.; Ahiekpor, J.C.; Narra, S.; Achaw, O.W.; Ansah, H.F. Municipal Solid Waste Generation Trend and Bioenergy Recovery Potential: A Review. Energies 2023, 16, 7753. [Google Scholar] [CrossRef]
  49. Williams, P.A.; Narra, S.; Antwi, E.; Quaye, W.; Hagan, E.; Asare, R.; Owusu-Arthur, J.; Ekanthalu, V.S. Review of Barriers to Effective Implementation of Waste and Energy Management Policies in Ghana: Implications for the Promotion of Waste-to-Energy Technologies. Waste 2023, 1, 313–332. [Google Scholar] [CrossRef]
  50. Public Utilities Regulatory Commission. Ghana 2024 First Quarter Tarrif Review Decision for Electricity, Natural Gas and Water; Public Utilities Regulatory Commission: Accra, Ghana, 2024. [Google Scholar]
  51. Hasan, S.; Islam Meem, A.; Saiful Islam, M.; Sabrina Proma, S.; Kumar Mitra, S. Comparative Techno-Economic Analyses and Optimization of Standalone and Grid-Tied Renewable Energy Systems for South Asia and Sub-Saharan Africa. Results Eng. 2024, 21, 101964. [Google Scholar] [CrossRef]
  52. Akubia, J.E.K.; Ahmed, A.; Bruns, A. Assessing How Land-Cover Change Associated with Urbanisation Affects Ecological Sustainability in the Greater Accra Metropolitan Area, Ghana. Land 2020, 9, 182. [Google Scholar] [CrossRef]
  53. Mohammed, M.; Ozbay, I.; Donkor, A.K.; Olalekan, I.E.; Nyankson, E.A.; Bayitse, R.; Mohammed, L.; Fahanwi, A.N. Inter-Continental Differences in Waste Management in Developing Countries: Turkey and Ghana. Proc. Inst. Civ. Eng. Waste Resour. Manag. 2022, 175, 14–28. [Google Scholar] [CrossRef]
  54. Accra Metropolitan Assembly Accra’s per Capita Waste Generation Rate Is 0.70kg per Day—Report. Available online: https://ama.gov.gh/news-details.php?n=OTU3NTU5MjUxNXMwNTcwcDYxczhxczFzb3Izc3M0MHI2cHMyNDFycw== (accessed on 12 January 2024).
  55. Miezah, K.; Obiri-Danso, K.; Kádár, Z.; Fei-Baffoe, B.; Mensah, M.Y. Municipal Solid Waste Characterization and Quantification as a Measure towards Effective Waste Management in Ghana. Waste Manag. 2015, 46, 15–27. [Google Scholar] [CrossRef]
  56. C40 Cities Climate Leadership Group Generating Green Jobs through Organic Waste Management Solutions. Available online: https://c40cff.org/projects/waste-management-solutions (accessed on 12 March 2024).
  57. Andrews, N.; Francis, A.; Engelbert, K. Scrap Metals Role in Circular Economy in Ghana, Using Sunyani as a Case Study. Afr. J. Environ. Sci. Technol. 2015, 9, 793–799. [Google Scholar] [CrossRef]
  58. Abledu, E.S.; Amfo-Otu, R. Contribution of Informal Sector Recycling Workers to Sustainable Landfill Management: The Case of Kpone Landfill Site in the Greater Accra Region. Appl. Res. J. 2019, 4, 1–11. [Google Scholar]
  59. Sambiani, K.; Lare, Y.; Zanguina, A.; Narra, S. Location-Allocation Combining Fuzzy Analytical Hierarchy Process for Waste to Energy Facilities Siting in Developing Urban Areas: The Case Study of Lomé, Togo. Heliyon 2023, 9, e19767. [Google Scholar] [CrossRef]
  60. Jalalipour, H.; Mansorabadi, J.N.; Fereydoni, H.; Fard, N.J.H.; Narra, S. Stabilizing the Organic Fraction of Municipal Solid Waste by Windrow Composting in a Large Scale Plant under Semi-Arid Condition. In Proceedings of the 13th Rostock Bioenergy Forum, Rostock, Germany, 20–21 June 2013; Nelles, M., Ed.; University of Rostock: Rostock, Germany, 2013. [Google Scholar]
  61. Ghana Statistical Service. Ghana 2021 Population and Housing Census; Ghana Statistical Service: Accra, Ghana, 2022. [Google Scholar]
  62. Addae, G.; Oduro-Kwarteng, S.; Fei-Baffoe, B.; Rockson, M.A.D.; Ribeiro, J.X.F.; Antwi, E. Market waste composition analysis and resource recovery potential in Kumasi, Ghana. J. Air Waste Manag. Assoc. 2021, 71, 1529–1544. [Google Scholar] [CrossRef] [PubMed]
  63. TU Wien. STAN Version 2.7—User Manual; TU Wien: Vienna, Austria, 2022; Volume 3304, ISBN 5702012100. [Google Scholar]
  64. Antwi, E.; Anang, D.A.; Marfo, E.O.; Bediako, M.; Ribeiro, J.; Boahen, B.; Opoku, G. Decentralized Solid Waste Management in Rural Ghana: A Case Study of Assin Kushea Community in Assin North Municipality. J. Appl. Sci. Environ. Manag. 2022, 26, 1657–1661. [Google Scholar] [CrossRef]
  65. Gunaseelan, V.N. Anaerobic Digestion of Biomass for Methane Production: A Review. Biomass Bioenergy 1997, 13, 83–114. [Google Scholar] [CrossRef]
  66. Krou, N.M.; Baba, G.; Akpaki, O. Estimation of the Amount of Electrical Energy Available From the Biogas Produced at the Faecal Sludge Treatment Plant in the City of Sokodé. In Proceedings of the TH Wildau Engineering and Natural Sciences Proceedings, Kara, Togo, 6 April 2021; Volume 1, pp. 77–82. [Google Scholar] [CrossRef]
  67. Ayodele, T.R.; Ogunjuyigbe, A.S.O.; Alao, M.A. Life Cycle Assessment of Waste-to-Energy (WtE) Technologies for Electricity Generation Using Municipal Solid Waste in Nigeria. Appl. Energy 2017, 201, 200–218. [Google Scholar] [CrossRef]
  68. Couturier, C.; Berger, S.; Herault, I.; Meiffren, I.; Herault, I. Anaerobic Digestion of Urban Sludge Situation, State of the Art; La digestion anaerobie des boues urbaines Etat des lieux, etat de l’art; Solagro: Toulouse, France, 2001. [Google Scholar]
  69. Kabeyi, M.J.B.; Olanrewaju, O.A. Review and Design Overview of Plastic Waste-to-Pyrolysis Oil Conversion with Implications on the Energy Transition. J. Energy 2023, 2023, 1–25. [Google Scholar] [CrossRef]
  70. Ayodele, T.R.; Ogunjuyigbe, A.S.O.; Durodola, O.; Munda, J.L. Electricity Generation Potential and Environmental Assessment of Bio-Oil Derivable from Pyrolysis of Plastic in Some Selected Cities of Nigeria. Energy Sources Part A Recover. Util. Environ. Eff. 2020, 42, 1167–1182. [Google Scholar] [CrossRef]
  71. Falcinelli, S.; Capriccioli, A.; Rosi, M.; Martì, C.; Parriani, M.; Laganà, A. Methane Production from H2 + CO2 Reaction: An Open Molecular Science Case for Computational and Experimental Studies. Physchem 2021, 1, 82–94. [Google Scholar] [CrossRef]
  72. Bustamante, M.A.; Restrepo, A.P.; Alburquerque, J.A.; Pérez-Murcia, M.D.; Paredes, C.; Moral, R.; Bernal, M.P. Recycling of Anaerobic Digestates by Composting: Effect of the Bulking Agent Used. J. Clean. Prod. 2013, 47, 61–69. [Google Scholar] [CrossRef]
  73. Zeng, Y.; De Guardia, A.; Dabert, P. Improving Composting as a Post-Treatment of Anaerobic Digestate. Bioresour. Technol. 2016, 201, 293–303. [Google Scholar] [CrossRef] [PubMed]
  74. European Commission Exchange Rate (InforEuro). Available online: https://commission.europa.eu/funding-tenders/procedures-guidelines-tenders/information-contractors-and-beneficiaries/exchange-rate-inforeuro_en (accessed on 27 January 2024).
  75. Ghana Revenue Authority Corporate Income Tax (CIT). Available online: https://gra.gov.gh/domestic-tax/tax-types/corporate-income-tax/ (accessed on 4 June 2023).
  76. Public Utilities Regulatory Commission (PURC). A Study on the Trends in Electricity Tariffs in Ghana between 2010 and 2020; PURC: Accra, Ghana, 2020. [Google Scholar]
  77. Public Utilities Regulatory Commission (PURC). 2023 Fourth Quarter Tariff Review Decision For Electricity, Natural Gas and Water; PURC: Accra, Ghana, 2023. [Google Scholar]
  78. The World Bank Country Data. Available online: https://data.worldbank.org/country/ghana?view=chart (accessed on 4 September 2023).
  79. Mabalane, P.N.; Oboirien, B.O.; Sadiku, E.R.; Masukume, M. A Techno-Economic Analysis of Anaerobic Digestion and Gasification Hybrid System: Energy Recovery from Municipal Solid Waste in South Africa. Waste Biomass Valorization 2021, 12, 1167–1184. [Google Scholar] [CrossRef]
  80. Mohammed, M.; Ozbay, I.; Karademir, A.; Donkor, A. Effect of Waste Matrix for the Optimization of Moisture Content and Calorific Value of Biodried Material Using Taguchi DOE. Dry. Technol. 2018, 37, 1352–1362. [Google Scholar] [CrossRef]
  81. Elnaas, A.; Belherazem, A.; Müller, W.; Nassour, A.; Nelles, M. Biodrying for Mechanical Biological Treatment of Mixed Municipal Solid Waste and Potential for RDF Production. In Proceedings of the 6th International Conference on Environmental Technology and Knowledge Transfer, Hefei, China, 19–20 May 2016; pp. 155–164, ISBN 978-3-86009-431-0. [Google Scholar]
  82. Mohammed, M.; Ozbay, I.; Durmusoglu, E. Bio-Drying of Green Waste with High Moisture Content. Process Saf. Environ. Prot. 2017, 111, 420–427. [Google Scholar] [CrossRef]
  83. Beguedou, E.; Narra, S.; Afrakoma Armoo, E.; Agboka, K.; Damgou, M.K. Alternative Fuels Substitution in Cement Industries for Improved Energy Efficiency and Sustainability. Energies 2023, 16, 3533. [Google Scholar] [CrossRef]
  84. Pueyo, A.; Bawakyillenuo, S.; Osiolo, H. Cost and Returns of Renewable Energy in Sub-Saharan Africa: A Comparison of Kenya and Ghana; Institute of Development Studies: Brighton, UK, 2016; pp. 2–65. [Google Scholar]
  85. Energy Commission. 2022 National Energy Statistics; Energy Commission: Accra, Ghana, 2022. [Google Scholar]
  86. Energy Commission. Integrated Power Sector Master Plan for Ghana; Energy Commission: Accra, Ghana, 2023; Volume 2. [Google Scholar]
  87. Ministry of Energy. Ghana Renewable Energy Master Plan; Ministry of Energy: Accra, Ghana, 2019. [Google Scholar]
  88. Ghana Statistical Service General Report (Volume 3M)—Water and Sanitation; Ghana Statistical Service: Accra, Ghana, 2022.
  89. Public Utilities Regulatory Commission. 2024 First Quarter Tariff Review Decision for Electricity, Natural Gas and Water; PURC: Accra, Ghana, 2024. [Google Scholar]
  90. Adaramola, M.S.; Quansah, D.A.; Agelin-Chaab, M.; Paul, S.S. Multipurpose Renewable Energy Resources Based Hybrid Energy System for Remote Community in Northern Ghana. Sustain. Energy Technol. Assess. 2017, 22, 161–170. [Google Scholar] [CrossRef]
  91. Odoi-Yorke, F.; Adu, T.F.; Ampimah, B.C.; Atepor, L. Techno-Economic Assessment of a Utility-Scale Wind Power Plant in Ghana. Energy Convers. Manag. X 2023, 18, 100375. [Google Scholar] [CrossRef]
  92. International Renewable Energy Agency. Renewable Power Generation Costs in 2022; International Renewable Energy Agency: Abu Dhabi, United Arab Emirates, 2023. [Google Scholar]
  93. Chineme, A.; Assefa, G.; Herremans, I.M.; Wylant, B.; Shumo, M. African Indigenous Female Entrepreneurs (IFÉs): A Closed-Looped Social Circular Economy Waste Management Model. Sustainability 2022, 14, 11628. [Google Scholar] [CrossRef]
  94. Afful-Dadzie, A.; Mallett, A.; Afful-Dadzie, E. The Challenge of Energy Transition in the Global South: The Case of Electricity Generation Planning in Ghana. Renew. Sustain. Energy Rev. 2020, 126, 109830. [Google Scholar] [CrossRef]
  95. IEA; IRENA; UNSD; World Bank; WHO. Tracking SDG 7: The Energy Progress Report; World Bank: Washington, DC, USA, 2021. [Google Scholar]
  96. Afrane, S.; Ampah, J.D.; Agyekum, E.B.; Amoh, P.O.; Yusuf, A.A.; Fattah, I.M.R.; Agbozo, E.; Elgamli, E.; Shouran, M.; Mao, G.; et al. Integrated AHP-TOPSIS under a Fuzzy Environment for the Selection of Waste-To-Energy Technologies in Ghana: A Performance Analysis and Socio-Enviro-Economic Feasibility Study. Int. J. Environ. Res. Public Health 2022, 19, 8428. [Google Scholar] [CrossRef]
Figure 1. Flow chart of methodology roadmap.
Sustainability 16 04976 g001
Figure 2. Population in the study area, showing the increasing population and geographical expansion between 2010 and 2021. Map (A)—location of study area in the Greater Accra Region of Ghana; Map (B)—population in 2010; Map (C)—population in 2021.
Sustainability 16 04976 g002
Figure 3. Plant design showing the various systems and directions of material flows and products.
Sustainability 16 04976 g003
Figure 4. Population increase in the study area between 2010 and 2021 and projected population in 2030.
Sustainability 16 04976 g004
Figure 5. The waste collection characteristics and waste recovery fractions in GAMA by 2030.
Sustainability 16 04976 g005
Figure 6. Mass flow of materials within the plant. Color codes for flows: Waste generation source (pink), Collected waste to energy recovery (blue), products (green), intermediary flows (black), landfill (brown).
Sustainability 16 04976 g006
Figure 7. Sensitivity assessment of the generation against the LCOE for Case 1 indicating the end-user tariff (white) and bulk generation charge (yellow).
Sustainability 16 04976 g007
Figure 8. Impact of reducing or increasing CAPEX on the LCOE.
Sustainability 16 04976 g008
Table 1. Estimated waste composition for the proposed WTE plant based on previous studies [23,55,62].
Waste ComponentUnitComposition
Organic%45–65
Plastic%10–20
Paper%5–10
Inert%3–8
Leather%1–1.5
Textile%1–4
Metals%1.2–2
Glass%1–3
E-waste%0.6
Wood%0.3
Sanitary waste%4.8–5
Miscellaneous%5–5.3
Table 2. The ratios for computation of the waste fractions from onsite material recovery, based on [60] and Table 1.
Input Waste Fraction (%)Primary Fraction Residual Fraction
% of PF% of Input % of RF % of Input
Organics 4865.03924.09.6
Plastics 2010.2634.713.9
Metals 1.22.011.30.5
Others 24.6018.71036.514.4
Inerts 5.606.144.81.9
% of input waste 100 60% 40
Table 3. Methodology for estimating the energy output from the AD system.
StepEquationDetails
Annual methane yield (m3/yr) y C H 4 = Q O F × C T S × B M P M S W   ×   C C H 4 (4) y C H 4 —methane yield (m3/yr)
Q O F —organic fraction in PF after manual and mechanical sorting (tons/yr)
C T S —concentration of total solids in the organic fraction, which is 31.40% and contains 85.45% volatile organic compounds [64]
B M P M S W —bio-methane potential of MSW, which is 320 m3 CH4/tonTS based on continuous mesophilic digestion [65]
C C H 4 —65.6%, which is the methane content of biogas [66]
Conversion   of   y C H 4 to mass (tons/year) m C H 4 = ŋ C H 4   ×   y C H 4 (5) m C H 4 —mass of methane (t/yr)
ŋ C H 4 —density of methane, which is 0.000717 t/m3 [67]
Energy   output   from   AD E A D (kWh/yr) E A D = y C H 4 × L C V × n (6) L C V C H 4 —lower calorific value of methane, which is assumed to be 9.94 (kWh/m3) [68]
n —efficiency of the CHP, which is taken as 35% from the pilot plant
Power capacity of AD (MW) C a p A D = E A D T (7) T —operational hours (h/yr)
Table 4. Methodology for estimating the energy output through pyrolysis.
Name of StepEquation Details
Balance of materials (tons) m p w = m f + m c + m g + m w (8)
  • m p w —mass of plastic waste
  • m f —mass of oil
  • m c —mass of char
  • m g —mass of gas
  • m w —mass of water
Bio-oil yield (tons/yr) y o i l = Q P w , P F × X% (9)
  • Q P w , P F —quantity of plastic waste in the primary fraction (Equation (3))
  • X%—bio-oil yield per ton of input mixed plastic waste, which is estimated to be 48 wt% ± 2 [70]
Energy in output (MWh/yr) E p y r = y o i l × L H V o i l × n   ŋ (10)
  • L H V o i l —lower heating value of bio-oil, estimated as 43,175 MJ/ton [25]
  • ŋ—3.6, which is the conversion factor of 1 kWh = 3.6 MJ [70]
  • n —efficiency of the CHP, which is taken as 35%
Table 5. Technical specifications of the selected PV module.
ParameterSpecification
Maximum Power (Pmax)440 W
Operating Voltage (Vmp)40.5 W
Operating Current (Imp)10.87 A
Open-Circuit Voltage (Voc)49.2 V
Short-Circuit Current (Isc)11.4 A
Module Efficiency (ηm)20.1%
Operating Temperature −40 °C–+85 °C
Temperature Coefficient (Pmax)−0.36%/°C
Temperature Coefficient (Voc)−0.26%/°C
Temperature Coefficient (Isc)+0.043%/°C
Nominal Operating Cell Temperature 43 ± 2 °C
Table 6. Input data for financial analysis.
Parameter Unit Value
Operating days days/yr 335
Economic lifespan Years 20
Depreciation rate %10
Debt to equity -70:30
Interest rate on debt %3.05
Inflation rate %15.14
Cooperate income tax (CIT)%1–25 1
Electricity tariff for bulk generationEUR/kWh0.0726
Annual revenue escalation rate (electricity)%25
1 According to the Ghana Revenue Authority, the CIT for waste management companies is 1% for the first 7 years and 25% from the 8th year onwards [75].
Table 7. Cost breakdown and resulting financial indicators of the cases from the proposed plant.
Case 1Case 2Case 3
Cost breakdown
CAPEX (EUR)367 million490 million489 million
Fixed O&M (% of CAPEX)131313
Variable O&M (% of gross revenue)141511
Financial indicators
Net present value (EUR)1030 million397 million470 million
Profitability index4.82.83.0
Payback period (years)101110
Levelized cost of electricity (EUR/kWh)0.180.110.11
Internal rate of return (%)22.0314.015
Return on investment (%)40.41419.5
Table 8. Comparison of daily generation and collection characteristics between previous studies and this study (tons/day).
Flow Characteristics (tons/day)2017
[15]
2020
[44]
2030
(This Study)
Waste generation173032934521
Waste collection
Formal collection71814862040
Informal collection49513701880
Municipal collection68142194
No collection449295405
Material flows for collected waste
Recycling118127174
Material recovery and composting (current plants)121234321
Material and energy recovery (new plant)--3719
Landfill11702856225
Disclaimer/Publisher’s Note: The statements, opinions and data contained in all publications are solely those of the individual author(s) and contributor(s) and not of MDPI and/or the editor(s). MDPI and/or the editor(s) disclaim responsibility for any injury to people or property resulting from any ideas, methods, instructions or products referred to in the content.

