
Analysis of Influencing Factors and Prediction of the Peak Value of Industrial Carbon Emission in the Sichuan-Chongqing Region

Abstract
1. Introduction
2. Research Status
2.1. Carbon Emissions Measurement Methods
2.2. Application of the STIRPAT Model in Influencing Factors of Carbon Emission
2.3. Application of the STIRPAT Model in Predicting Carbon Emissions
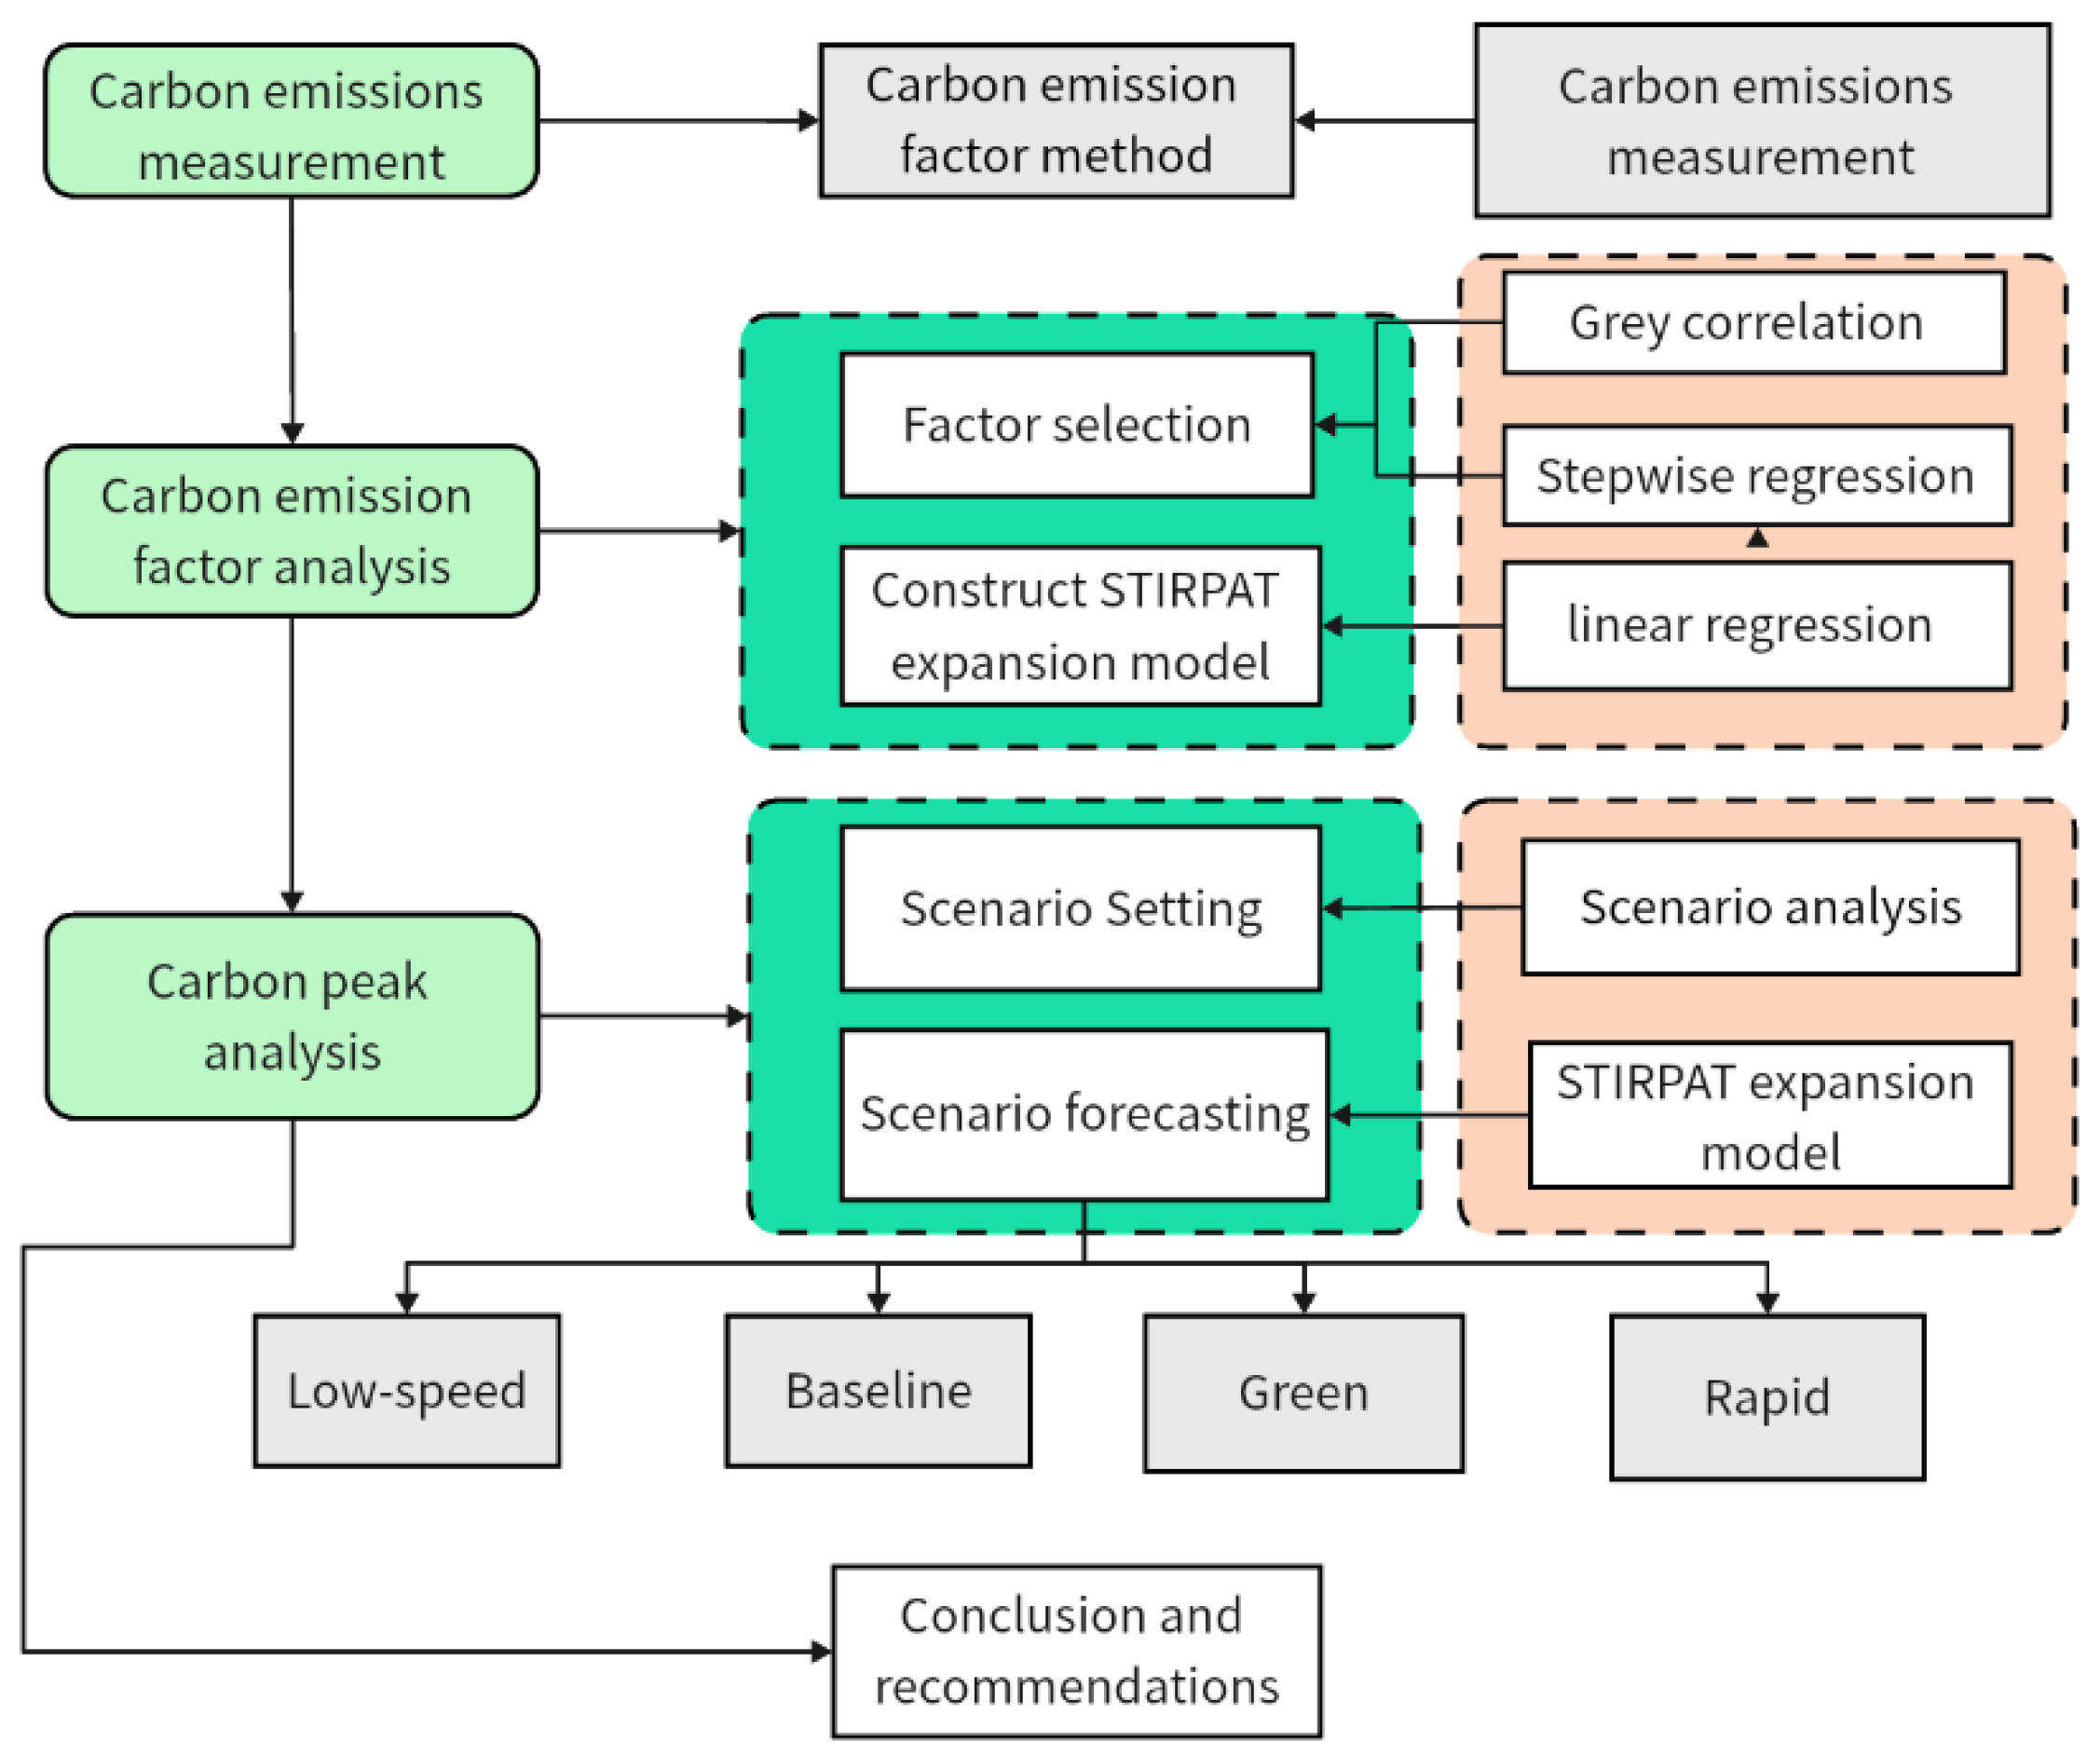
3. Industrial Carbon Emission Measurement
3.1. Carbon Emission Measurement Methods
3.2. Industrial Carbon Emission Measurement Results
3.3. Data Source Description
4. Analysis of Influencing Factors of Industrial Carbon Emission
4.1. Construct STIRPAT Extension Model
4.2. Model Analysis
4.2.1. Unit Root Test
4.2.2. Gray Correlation Analysis
- (1)
- The reference series is the total industrial carbon emissions from 2000 to 2022 and comparison series is the indicator of each influencing factor;
- (2)
- Dimensionless processing of data. The total industrial carbon emissions and their influencing factors have different unit attributes, some of which are numerical and some of which are ratios; direct comparisons between them require standardization of the data into dimensions;
- (3)
- The resolution coefficient is set to 0.5, the result is accurate to four decimal places, and the correlation degree is obtained using Formulas (5) and (6).
4.2.3. Stepwise Regression
- Sichuan Province:
- Chongqing Municipality
4.2.4. Co-Integration Test and Multicollinearity Test
- (1)
- EG test
- (2)
- Multicollinearity test
4.2.5. Linear Regression Analysis
4.2.6. Model Heteroscedasticity and Validity Test
- (1)
- Heteroscedasticity test
- (2)
- Validity test
5. Forecast of Peak Industrial Carbon Emissions
5.1. Scenario Design
- (1)
- Setting the scenario parameters for Sichuan Province
- 1.
- Industrial scaleIn the 14th Five-Year Plan and the outline of 2035 vision goals, it is pointed out that the cost and burden of manufacturing should be reduced, the structural upgrading of the secondary industry should be promoted, and the development of high-tech service industries should be emphasized. The goal is to achieve the added value of strategic emerging industries, accounting for more than 17% of the GDP by 2035. Combined with the study of Qichao et al. the study predicts that the primary industry will account for 5.0%, the secondary industry for 31.7%, and the tertiary industry for 63.3% in 2025 in Sichuan Province [30]. The proportion of secondary industry in the total economic volume of Sichuan Province shows a trend of fluctuating decline, indicating that the internal structure of the secondary industry in Sichuan Province is in the process of constant adjustment and transformation. Therefore, it is set that the average annual decline rate of the value-added of the secondary industry in GDP is −0.7% at low-speed growth, −0.85% at moderate-speed growth, and −1.0% at high-speed growth. The rate of decline was 0.3% every five years.
- 2.
- PopulationMacroeconomic factors include the population, urbanization rate, GDP, and industrial structure. The population factor is the key control object of government departments. Under the baseline scenario, the population develops according to the expected planning target. With the deepening of the scenario, the population growth rate gradually slows down. According to the Medium and Long Term Plan of Population Development of Sichuan Province, “the permanent population will reach about 84.3 million by 2025 and 84.7 million by 2030”, so the average annual growth rate of the population is set at 0.12% under the low growth rate. The average annual growth rate of medium-speed and high-speed growth is 0.15% and 0.18%, respectively. The rate of decline decreased by 0.2% every five years.
- 3.
- Foreign trade dependenceAccording to the Sichuan-Chongqing regional planning document, the import and export trade of the Shuangcheng economic circle in the Sichuan-Chongqing region continues to increase and the economy is booming, which means that the degree of opening up will also increase. Referring to the foreign trade statistics document of the Sichuan Provincial government, it is mentioned that “Sichuan’s foreign trade exports in 2021 will be 570.87 billion yuan, an increase of 22.7% over the previous year; Imports reached 380.49 billion yuan, up 10.8% over the previous year. Compared with 2019, Sichuan’s foreign trade import and export, export and import increased by 40.1%, 46.2% and 31.8% compared with the previous year, respectively.” Therefore, the average annual growth rates of total imports and exports in the GDP are 3%, 3.5%, and 4% under low-, moderate-, and high-speed growth, respectively. The growth rate increased by 0.5% every five years.
- (2)
- Setting scenario parameters in Chongqing
- 1.
- Energy structureThe “Action Plan for carbon Peak before 2030” points out that it is necessary to optimize the energy structure, reduce the use of coal and other fossil energy, promote the development of new energy, and improve energy efficiency. According to the “14th Five-Year Plan for Chongqing Energy Development (2021–2025)”, the expected growth rate of the proportion of non-fossil energy consumption, the proportion of coal consumption, and the proportion of natural gas consumption in 2020–2025 under the goal of energy green transformation is 4.1%, −4.3%, and 4.3% respectively. The average annual growth rate of clean energy use in total energy consumption of Chongqing is 0.9%, 1.0%, and 1.1% under low-, moderate-, and high-speed growth, respectively. The growth rate has increased by 0.6% every five years.
- 2.
- Per capita incomeAccording to the “14th Five-Year Plan” of Chongqing and the outline of the 2035 Vision Goal”, it is required that “the economy will continue to grow steadily, and the per capita GDP will change from 79,000 yuan in 2020 to 102,000 yuan in 2025”. The expected goal was achieved by calculating that the average annual growth rate of Chongqing would remain at 5.82%. According to Wen et al. China’s per capita GDP growth will gradually slow from to 2015–2040 but the average annual growth rate should be between 5.8% and 6.2% [31]. Therefore, the average annual growth rate of per-capita income was set at 5.5%, 6.0%, and 6.5% for low-, medium-, and high-speed growth, respectively. The growth rate decreased by 0.5% every five years.
5.2. Peak Prediction Results and Analysis
6. Conclusions and Recommendations
6.1. Conclusions
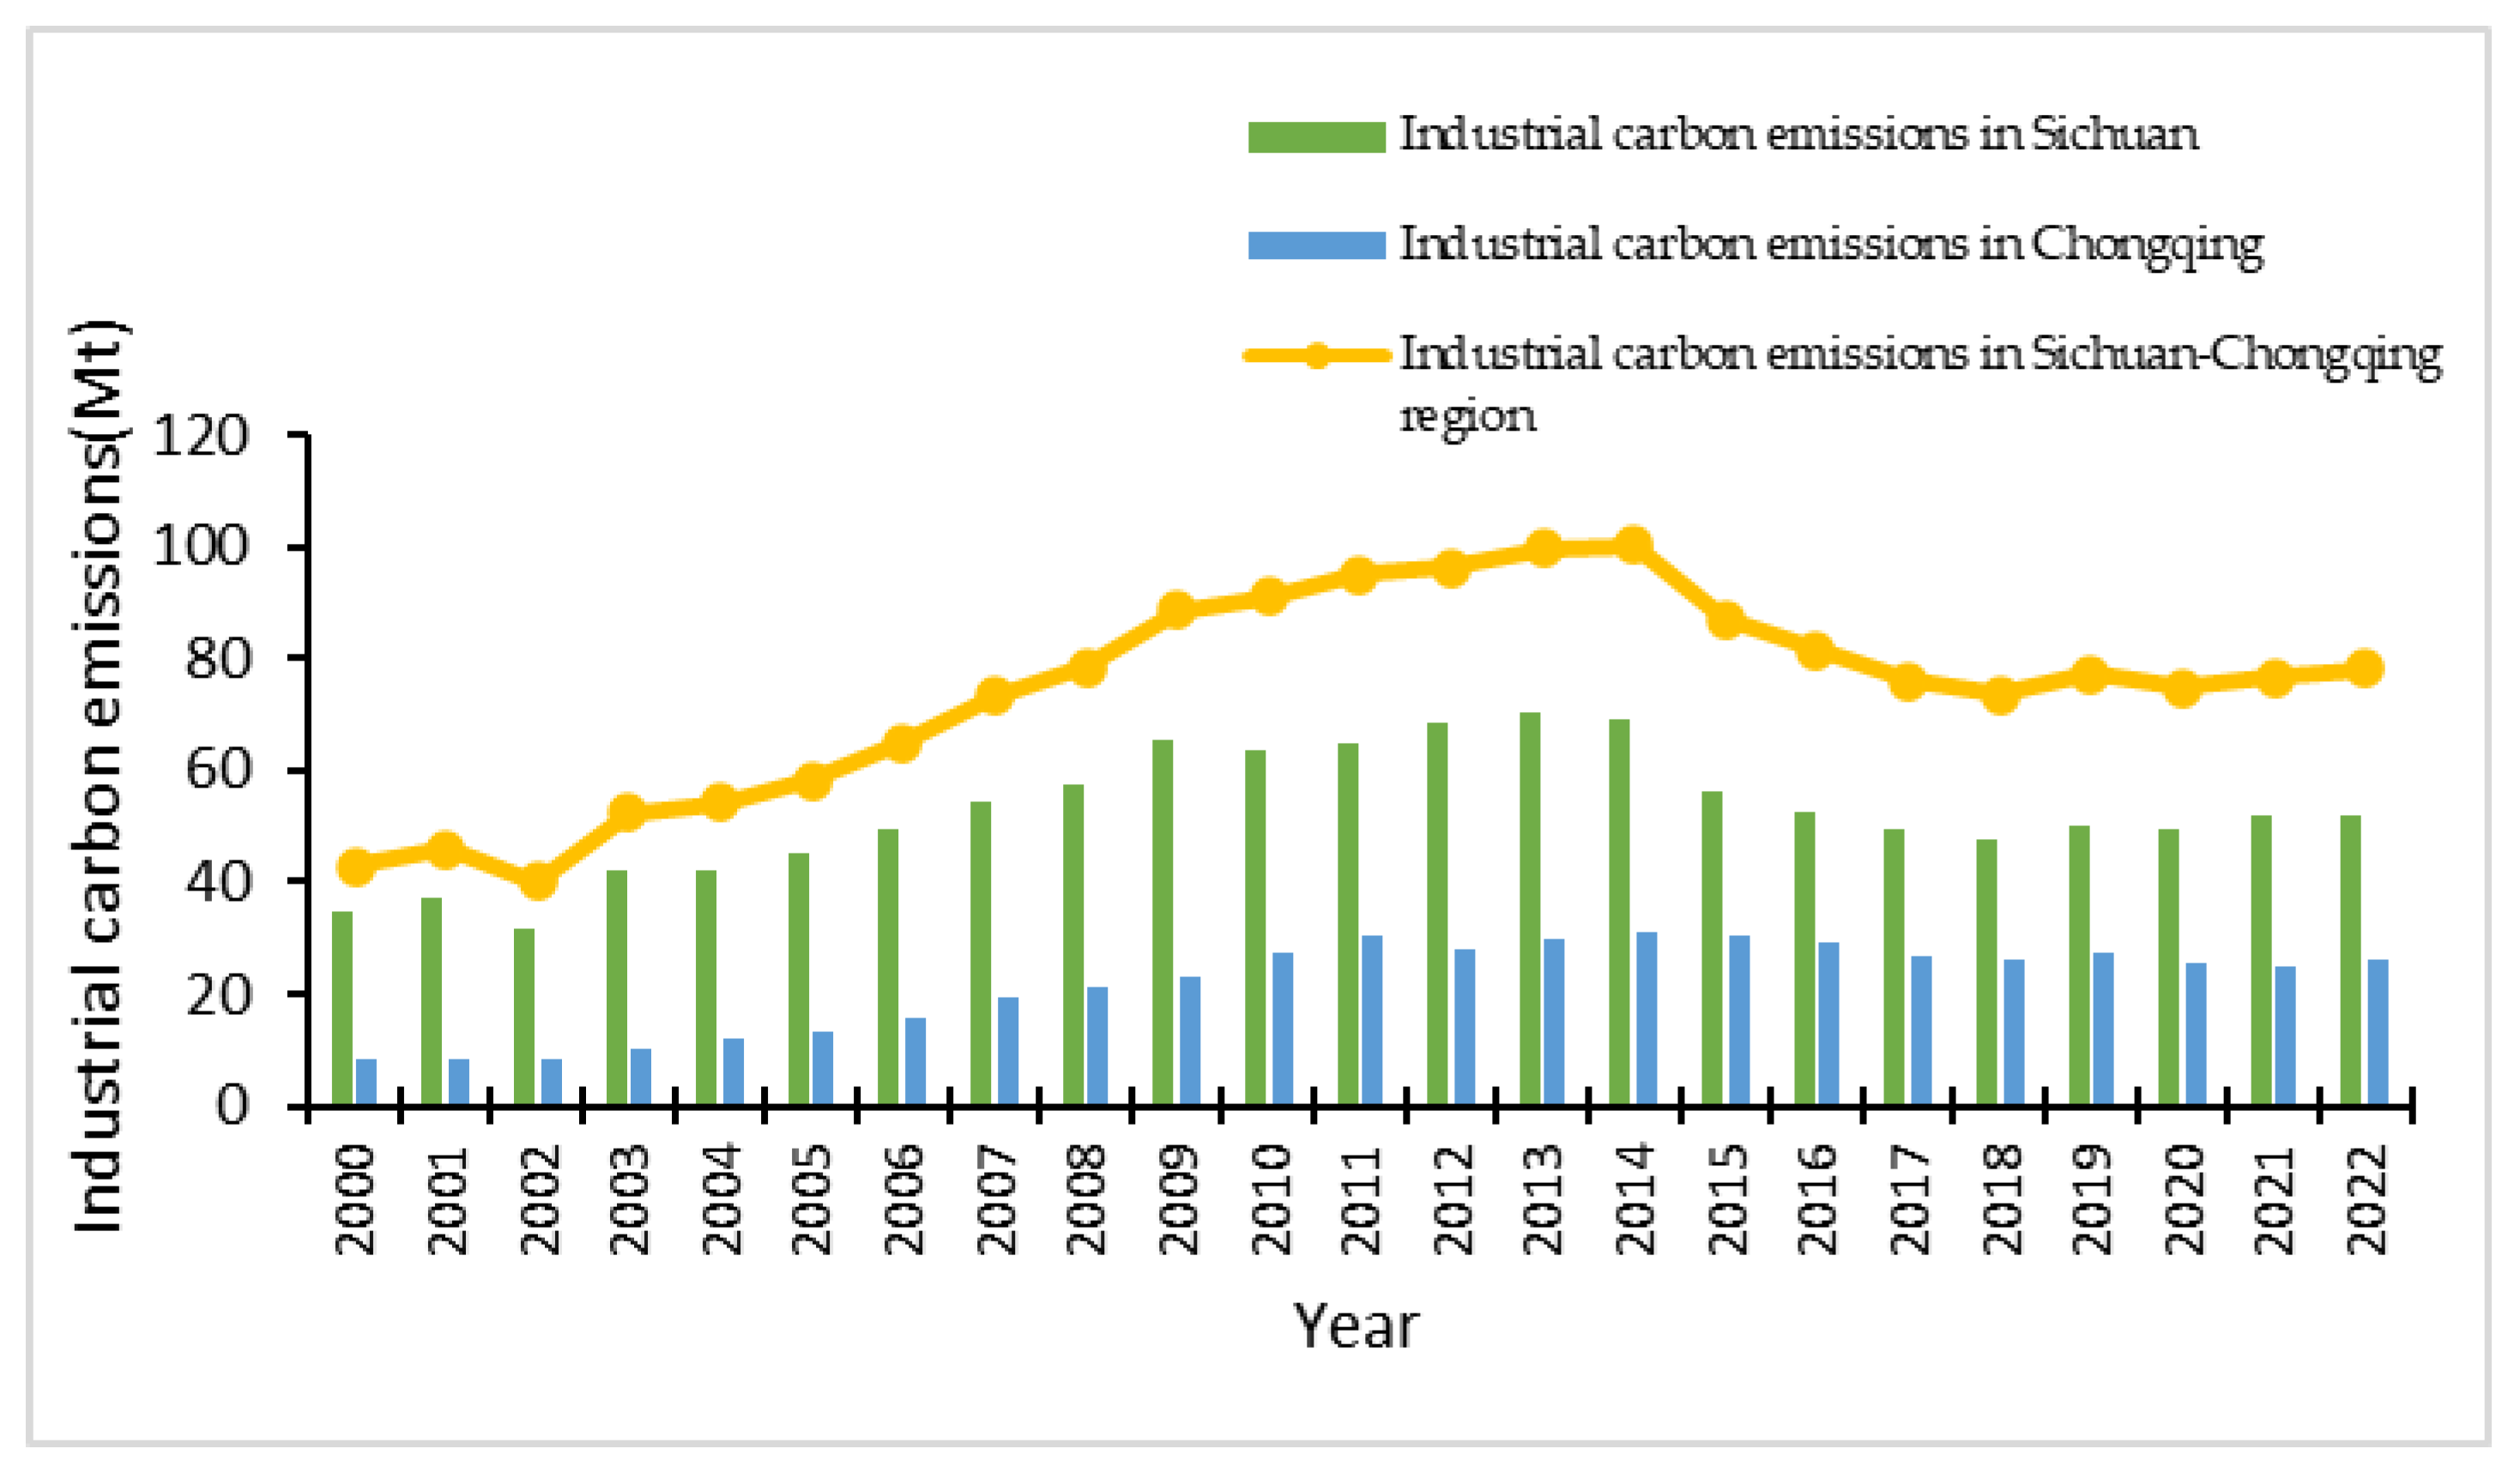
- (1)
- In the analysis of temporal changes in carbon emissions from energy consumption in Sichuan Province and Chongqing Municipality, carbon emissions from energy consumption in the two regions increased at a high rate from 2000 to 2014 and peaked in 2013 and 2014, respectively. After 2014, China introduced carbon emissions reduction policies to control the growth of carbon emissions. From 2015 to 2018, total industrial carbon emissions declined and the growth rate of industrial carbon emissions showed stable volatility in the following years. In 2022, the industrial consumption of coal, oil, natural gas, and electricity in Sichuan Province will account for 73.25%, 5.16%, 1.82%, and 19.77%, respectively, whereas those in Chongqing in the same year will account for 84.49%, 0.40%, 1.63%, and 13.07%, respectively. This indicates that coal remains the main source of industrial energy consumption in Sichuan and Chongqing. Therefore, accelerating the optimization of the energy structure and promoting the use of clean energy have become future development directions for the Sichuan-Chongqing region;
- (2)
- Retaining the effective factors that have a strong correlation with carbon emission by the grey degree of correlation and stepwise regression method, the extended STIRPAT model was constructed and the model fit well. The results of OLS show that the industrial scale has the highest contribution rate to industrial carbon emissions in Sichuan Province, followed by foreign trade dependence and population. It should be noticed that although the influence of population factors is large, the significance is low. All factors have a positive impact on regional carbon emissions and the influence degrees are 1.19, 0.309, and 2.986, respectively. Energy structure has the highest contribution rate to industrial carbon emissions in Chongqing, followed by per capita income. The energy structure has a negative effect on carbon emission while the per capita income has a positive effect; this shows that the increased use of clean energy can achieve industrial carbon emission reduction well and the influence degrees are −1.791 and 0.784, respectively;
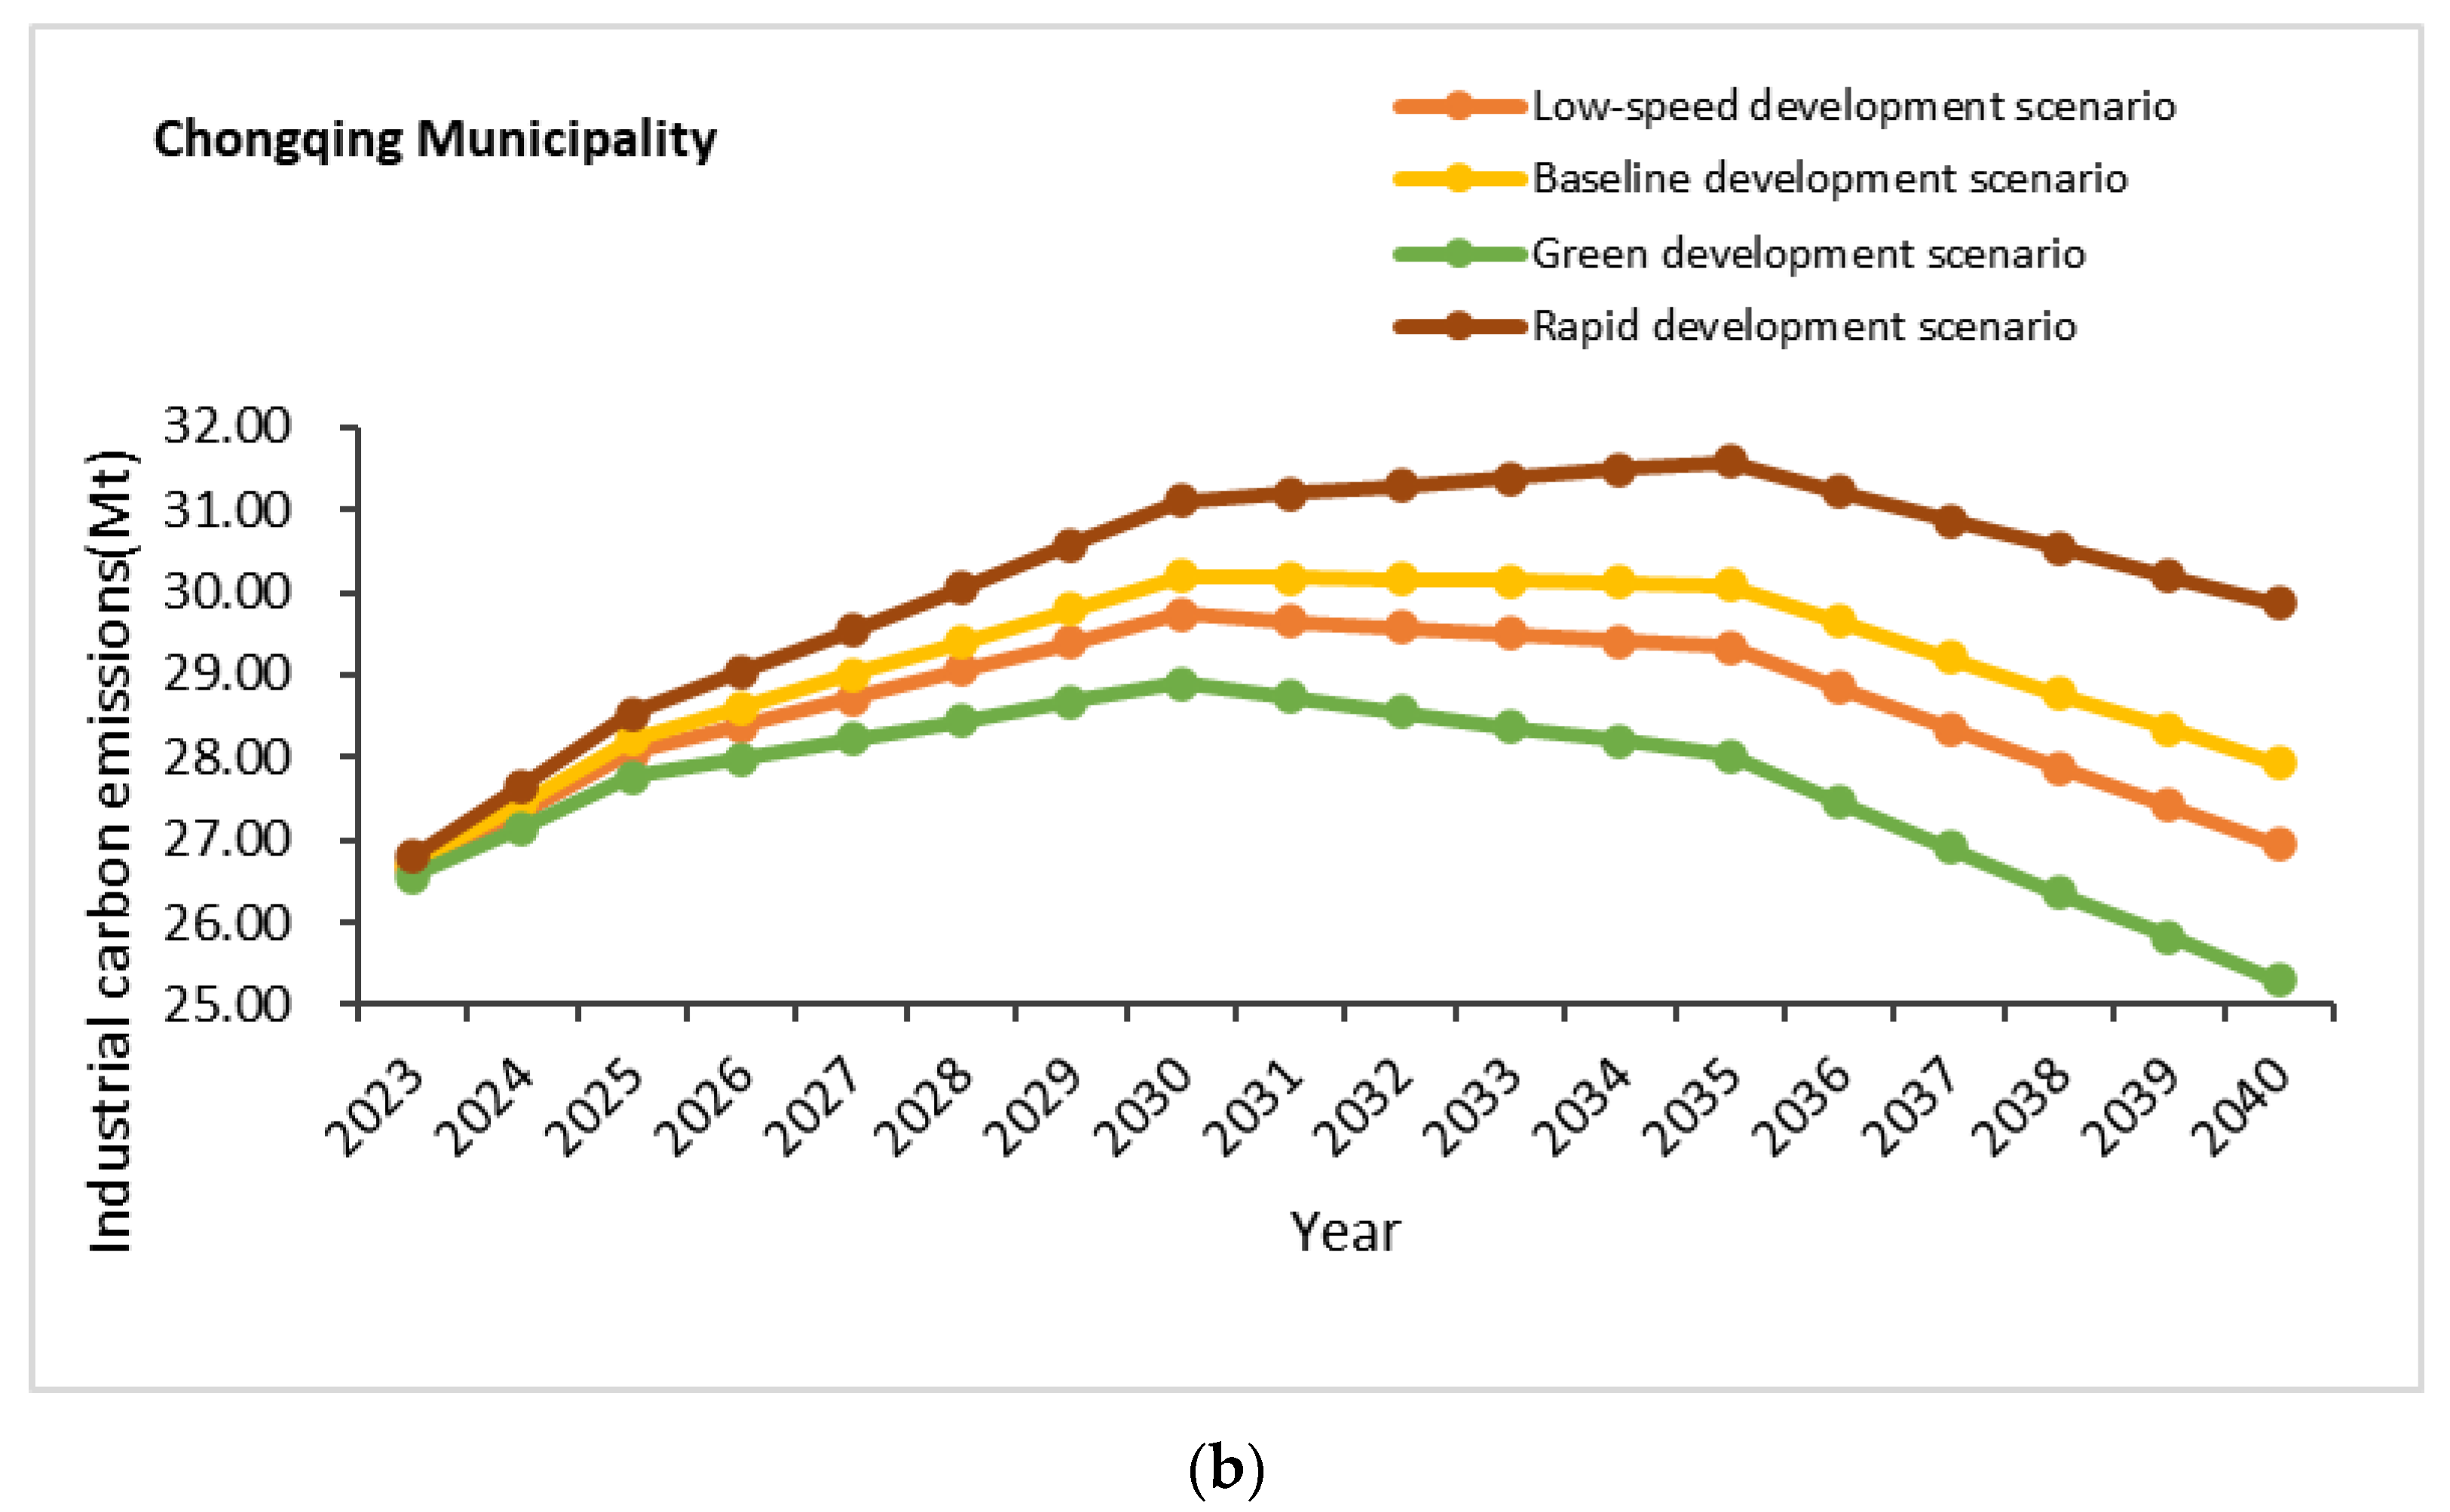
- (3)
- Four development scenarios were established using scenario analysis and the extended STIRPAT model was used to predict the total industrial carbon emissions of the two regions during 2023–2040. Under the low-speed and baseline development scenarios, both Sichuan and Chongqing will reach their peaks in 2030 and the peak carbon emissions are 54.24 (Sichuan, low-speed), 54.49 (Sichuan, baseline-speed), 29.74 (Chongqing, low-speed), and 30.20 (Chongqing, baseline-speed), respectively. Whereas, under the high-speed development scenario, they will reach their peaks in 2035 and the peak carbon emissions are 56.06 (Sichuan, high-speed), and 31.58 (Chongqing, high-speed), respectively. In the green development scenario, Chongqing will reach its peak in 2030 and Sichuan will reach its peak in 2025 and the peak carbon emissions are 28.91 (Chongqing, Green-speed) and 53.36 (Sichuan, Green-speed), respectively. In the case of low speed, baseline, and green and rapid development, the Sichuan-Chongqing region will reach its peak in 2030, 2030, 2030, and 2035 and the peak level is 83.97 Mt, 84.70 Mt, 81.98 Mt, and 87.64 Mt, respectively.
- (4)
- Overall, the change in total carbon emissions in Sichuan and Chongqing presents a double hump-shaped development trend from 2000 to 2040; however, the peak value may be a phased peak. When the optimization speed of the regional energy structure is accelerated and the reduction in energy consumption intensity is increased, industrial carbon emissions will return to the downward trend; however, when economic development is rapid, there is no reasonable optimization of energy structure and industrial scale adjustment and industrial carbon emissions will return to the upward trend. Therefore, if the two regions want to complete the carbon compliance task within a specified time, they must choose a green development scenario, that is, continuously optimizing the energy structure, adjusting the industrial scale, and accelerating scientific and technological progress to achieve high economic development and low carbon emissions.
6.2. Recommendations
- (1)
- Construction of green and low carbon pipe control application system in the Sichuan-Chongqing region includes carbon emission monitoring and evaluation of key energy-using enterprises, carbon emission data of key products throughout their life cycle, online monitoring of key energy-using equipment, supporting enterprises to build data-driven production methods and enterprise management models, and promoting smart energy management and carbon emission management information systems;
- (2)
- Support the application of renewable electricity in electric heating kilns and other fields, promote the exploration, development, and utilization of natural gas, accelerate the planning and construction of hydropower, wind power, and photovoltaic power generation, and build a clean, low-carbon, safe, and efficient energy system;
- (3)
- Strengthen the evaluation of cleaner production for projects with high energy consumption and high emissions. New and rebuilt projects should reach advanced levels of cleaner production and enterprises that exceed standards and total emissions and consume high energy will be included in the mandatory cleaner production audit list in accordance with the law;
- (4)
- Continue to optimize and adjust the industrial structure, resolutely curb the blind development of energy-intensive and high-emission projects, and carry out green digital transformation and upgrading of energy-intensive and high-emission industries such as petroleum processing, coking, and nuclear fuel processing.
6.3. Discussions
6.3.1. Discussion Result Analysis
6.3.2. Major Contribution
6.3.3. Study Limitation
- (1)
- The first limitation of the study is the error and significance of the data. In this paper, the total industrial carbon emission is estimated by the carbon emission coefficient method, which is an indirect estimation form, so there may be little difference between the actual value and the estimated value. Moreover, the calculated factors are not all strong and significant (p < 0.01) and the analyzed situation may need to be demonstrated in combination with the actual situation;
- (2)
- The second limitation is the lack of comparisons across multiple cities. This paper only takes the characteristics and prediction of industrial carbon emission in Sichuan and Chongqing as the research object. However, other cities in southwest China have not been analyzed and compared and few cities have been studied;
- (3)
- The third limitation is the lack of discussion on other influencing factors, such as the impact of urbanization rate, and the specific discussion on the factors excluded in the paper has not been performed.
6.3.4. Future Research Direction
Author Contributions
Funding
Institutional Review Board Statement
Informed Consent Statement
Data Availability Statement
Conflicts of Interest
References
- Gao, S.; Wang, S.; Mo, H. A comparative study of China’s urbanization process and its carbon emission effect from a global perspective. Sci. Geogr. Sin. 2024, 44, 204–215. [Google Scholar] [CrossRef]
- Wei, W.; Li, Y.; Ma, L.; Xie, B.; Hao, R.; Chen, D.; Yang, S. Carbon emission change based on land use in Gansu Province. Environ. Monit. Assess. 2024, 196, 311. [Google Scholar] [CrossRef] [PubMed]
- Chu, Y.Y.; Zhang, X.L.; Guo, Y.C.; Tang, L.J.; Zhong, C.Y.; Zhang, J.W.; Li, X.L.; Qiao, D.W. Spatial-temporal characteristics and driving factors’ contribution and evolution of agricultural non-CO2 greenhouse gas emissions in China: 1995–2021. Environ. Sci. Pollut. Res. Int. 2024, 31, 19779–19794. [Google Scholar] [CrossRef] [PubMed]
- Zhang, L.; Cai, C. Innovative measurement, trade-off-synergy relationship and influencing factors for agricultural net carbon emissions and effective supply of agricultural products in China. Heliyon 2024, 10, e24621. [Google Scholar] [CrossRef] [PubMed]
- Qi, P.; Lang, J.L.; Wang, X.Q.; Zhou, Y.; Qi, H.Y.; Chen, S.Y. The Coordinated Effects of CO2 and Air Pollutant Emission Changes Induced by Inter-Provincial Trade in China. Sustainability 2024, 16, 3274. [Google Scholar] [CrossRef]
- Li, X.; Zhu, L.; Ding, X.; Wu, X.; Wang, L. Climate change and the textile industry: The carbon footprint of dyes. AATCC J. Res. 2024, 11, 109–123. [Google Scholar] [CrossRef]
- Shen, Q.; Gu, J.; Shang, L.; Liu, S.; Song, X.; Yu, W.; Liu, Y.; Sun, N.; Wei, W. Carbon emissions and low-carbon development in Olefin industry. Environ. Res. 2024, 244, 117841. [Google Scholar] [CrossRef]
- Pouliasis, P.K.; Papapostolou, N.C.; Tamvakis, M.N.; Moutzouris, I.C. Carbon Emissions in the U.S. Factor Decomposition and Cross-State Inequality Dynamics: Factor Decomposition and Cross-State Inequality Dynamics. Energy J. 2023, 44, 135–162. [Google Scholar] [CrossRef]
- Liu, F.; Li, A.; Bilal, M.; Yang, Y. Synergistic effect of combating air pollutants and carbon emissions in the Yangtze River Delta of China: Spatial and temporal divergence analysis and key influencing factors. Environ. Sci. Pollut. Res. Int. 2024. [Google Scholar] [CrossRef]
- Tang, X.; Liu, S.; Wang, Y.; Wan, Y. Study on carbon emission reduction countermeasures based on carbon emission influencing factors and trends. Environ. Sci. Pollut. Res. Int. 2024, 31, 14003–14022. [Google Scholar] [CrossRef]
- Cai, T.; Li, Y.; Wang, P.; Huang, G.; Liu, J. A Taguchi-STIRPAT input-output model for unveiling the pathways of reducing household carbon emissions under dual-carbon target-A case study of Fujian Province. Environ. Sci. Pollut. Res. Int. 2024, 31, 15424–15442. [Google Scholar] [CrossRef] [PubMed]
- Wei, Z.; Wei, K.; Liu, J.; Zhou, Y. The relationship between agricultural and animal husbandry economic development and carbon emissions in Henan Province, the analysis of factors affecting carbon emissions, and carbon emissions prediction. Mar. Pollut. Bull. 2023, 193, 115134. [Google Scholar] [CrossRef] [PubMed]
- Wu, C.B.; Huang, G.H.; Xin, B.G.; Chen, J.K. Scenario analysis of carbon emissions’ anti-driving effect on Qingdao’s energy structure adjustment with an optimization model, Part I: Carbon emissions peak value prediction. J. Clean. Prod. 2018, 172, 466–474. [Google Scholar] [CrossRef]
- Li, Y.; Yang, X.; Ran, Q.; Wu, H.; Irfan, M.; Ahmad, M. Energy structure, digital economy, and carbon emissions: Evidence from China. Environ. Sci. Pollut. Res. Int. 2021, 28, 64606–64629. [Google Scholar] [CrossRef] [PubMed]
- Liu, M.; Zhang, X.; Zhang, M.; Feng, Y.; Liu, Y.; Wen, J.; Liu, L. Influencing factors of carbon emissions in transportation industry based on C[sbnd]D function and LMDI decomposition model: China as an example. Environ. Impact Assess. Rev. 2021, 90, 106623. [Google Scholar] [CrossRef]
- Kong, D.; Dai, Z.; Tang, J.; Zhang, H. Forecasting urban carbon emissions using an Adaboost-STIRPAT model. Front. Environ. Sci. 2023, 11, 1284028. [Google Scholar] [CrossRef]
- Yan, H.; Cordier, M.; Uehara, T. Future projections of global plastic pollution: Scenario analyses and policy implications. Sustainability 2024, 16, 643. [Google Scholar] [CrossRef]
- Feng, D.; Xu, W.; Gao, X.; Yang, Y.; Feng, S.; Yang, X.; Li, H. Carbon emission prediction and the reduction pathway in industrial parks: A scenario analysis based on the integration of the LEAP model with LMDI decomposition. Energies 2023, 16, 7356. [Google Scholar] [CrossRef]
- Zeng, Q.; Shi, C.; Zhu, W.; Zhi, J.; Na, X. Sequential data-driven carbon peaking path simulation research of the Yangtze River Delta urban agglomeration based on semantic mining and heuristic algorithm optimization. Energy 2023, 285, 129415. [Google Scholar] [CrossRef]
- Wu, Z.; Wang, Z.; Yang, Q.; Li, C. Prediction model of electric power carbon emissions based on extended system dynamics. Energies 2024, 17, 472. [Google Scholar] [CrossRef]
- Hou, K.; Sun, J.; Dong, M.; Zhang, H.; Li, Q. Simulation of carbon peaking process of high energy consumption manufacturing industry in Shaanxi Province: A hybrid model based on LMDI and TentSSA-ENN. Math. Biosci. 2023, 20, 18445–18467. [Google Scholar] [CrossRef] [PubMed]
- Zhang, J.; Yan, Z.; Bi, W.; Ni, P.; Lei, F.; Yao, S.; Lang, J. Prediction and scenario simulation of the carbon emissions of public buildings in the operation stage based on an energy audit in Xi’an, China. Energy Policy 2023, 173, 113396. [Google Scholar] [CrossRef]
- Ning, X.; He, Y.; Zhang, J.; Wu, C.; Zhang, Y. Analysis of carbon emission projections and reduction potential of resource-dependent urban agglomerations from the perspective of multiple scenarios—A case study of Hu-Bao-O-Yu urban agglomeration. Int. J. Environ. Res. Public Health 2023, 20, 4250. [Google Scholar] [CrossRef]
- Lan, S.; Li, W.; Zou, F. Prediction of peak carbon emissions from Industrial Energy consumption in China based on LMDI and STIRPAT model. West. Econ. Manag. Forum 2019, 34, 90–99. [Google Scholar]
- Lin, L.; Ma, T. Prediction of carbon peak time of construction industry in Jiangxi Province based on STIRPAT model. Environ. Pollut. Prev. 2024, 46, 430–434+442. [Google Scholar] [CrossRef]
- Jian, K.; Shi, R.; Zhang, Y.; Liao, Z. Research on carbon emission characteristics and differentiated carbon reduction pathways in the Yangtze River Delta region based on the STIRPAT model. Sustainability 2023, 15, 5659. [Google Scholar] [CrossRef]
- Yan, L.; Zheng, S.; Yang, Z.; Wang, X. Optimization of mix proportions for hybrid fiber engineered cementitious composites based on Box-Behnken design response surface model. Constr. Build. Mater. 2024, 421, 135697. [Google Scholar] [CrossRef]
- Zhu, H.; Wang, L. Research on carbon peak and neutralization of tourism in Jiangxi Province. Ecotourism 2022, 12, 617–631. [Google Scholar]
- Tang, C.; Zha, J.; Zhang, J.; Tao, Y.; Wang, L.; Wang, L.; Han, Y. The goal of China’s tourism industry carbon peak and neutrality (dual-carbon) in the context of high-quality development: Evaluation and prediction, major challenges, and approach. Ecotourism 2021, 11, 471–497. [Google Scholar]
- Long, Q.; He, M.; Chen, J.; Wang, B.; Tang, B.; Pan, Y.; Qian, J.; Liu, Z. Industrial structure characteristics and industrial development prediction in Sichuan Province. Resour. Ind. 2021, 23, 46–54. [Google Scholar] [CrossRef]
- Wang, W.; Bian, Y.; Liu, Y. Ranking and forecasting China’s GDP per capita. Contemp. Fin. Res. 2018, 6, 18–38. [Google Scholar]
- Lian, Y.; Su, D.; Shi, S. Prediction of carbon peak in Fujian Province based on STIRPAT and CNN-LSTM combined model. Environ. Sci. 2024, 1–15. [Google Scholar] [CrossRef]
- Liao, Z.; Zhang, J.; Chen, S. Factors influencing carbon emission and carbon peak reaching pathways: Evidence from Sichuan Province. Soft Sci. 2023, 37, 95–101. [Google Scholar] [CrossRef]


| Sichuan Province | Chongqing Municipality | ||||||||||
|---|---|---|---|---|---|---|---|---|---|---|---|
| Year | Coal | Oils | Natural Gas | Electricity | Total | Year | Coal | Oils | Natural Gas | Electricity | Total |
| 2000 | 32.62 | 0.61 | 0.30 | 1.30 | 34.84 | 2000 | 7.51 | 0.08 | 0.11 | 0.31 | 8.01 |
| 2001 | 34.90 | 0.69 | 0.32 | 1.44 | 37.35 | 2001 | 7.87 | 0.07 | 0.12 | 0.45 | 8.51 |
| 2002 | 29.17 | 0.48 | 0.42 | 1.80 | 31.87 | 2002 | 7.70 | 0.07 | 0.13 | 0.40 | 8.30 |
| 2003 | 38.74 | 0.63 | 0.44 | 2.07 | 41.88 | 2003 | 9.66 | 0.09 | 0.13 | 0.49 | 10.37 |
| 2004 | 39.47 | 0.84 | 0.35 | 1.71 | 42.37 | 2004 | 11.07 | 0.12 | 0.13 | 0.49 | 11.81 |
| 2005 | 41.76 | 0.92 | 0.37 | 1.84 | 44.88 | 2005 | 12.36 | 0.14 | 0.15 | 0.55 | 13.21 |
| 2006 | 45.24 | 1.27 | 0.46 | 2.22 | 49.19 | 2006 | 14.89 | 0.24 | 0.16 | 0.63 | 15.93 |
| 2007 | 49.80 | 1.45 | 0.45 | 2.38 | 54.09 | 2007 | 17.95 | 0.27 | 0.20 | 0.77 | 19.17 |
| 2008 | 52.45 | 2.05 | 0.46 | 2.39 | 57.34 | 2008 | 19.84 | 0.25 | 0.22 | 0.93 | 21.24 |
| 2009 | 60.38 | 2.04 | 0.55 | 2.64 | 65.61 | 2009 | 21.59 | 0.24 | 0.22 | 1.00 | 23.05 |
| 2010 | 57.66 | 2.14 | 0.72 | 3.02 | 63.54 | 2010 | 25.87 | 0.27 | 0.25 | 1.18 | 27.57 |
| 2011 | 57.91 | 2.57 | 0.57 | 3.90 | 64.95 | 2011 | 28.43 | 0.27 | 0.25 | 1.31 | 30.27 |
| 2012 | 61.16 | 2.68 | 0.43 | 3.99 | 68.26 | 2012 | 26.13 | 0.26 | 0.30 | 1.36 | 28.05 |
| 2013 | 60.32 | 5.05 | 0.74 | 4.06 | 70.17 | 2013 | 27.47 | 0.29 | 0.30 | 1.48 | 29.54 |
| 2014 | 57.07 | 7.68 | 0.64 | 3.87 | 69.26 | 2014 | 28.87 | 0.29 | 0.33 | 1.63 | 31.12 |
| 2015 | 47.75 | 10.53 | 0.62 | 3.65 | 62.55 | 2015 | 28.14 | 0.34 | 0.37 | 1.70 | 30.56 |
| 2016 | 43.87 | 4.31 | 0.77 | 3.64 | 52.59 | 2016 | 26.51 | 0.36 | 0.42 | 1.70 | 28.99 |
| 2017 | 40.39 | 4.52 | 0.80 | 3.75 | 49.46 | 2017 | 24.21 | 0.33 | 0.42 | 1.69 | 26.65 |
| 2018 | 38.92 | 3.69 | 0.87 | 4.16 | 47.64 | 2018 | 23.56 | 0.25 | 0.40 | 1.71 | 25.91 |
| 2019 | 40.35 | 4.28 | 0.97 | 4.45 | 50.05 | 2019 | 24.70 | 0.25 | 0.39 | 1.75 | 27.09 |
| 2020 | 39.23 | 4.19 | 1.01 | 4.84 | 49.26 | 2020 | 23.12 | 0.24 | 0.44 | 1.74 | 25.54 |
| 2021 | 40.83 | 4.49 | 1.13 | 5.53 | 51.98 | 2021 | 22.19 | 0.21 | 0.49 | 1.92 | 24.82 |
| 2022 | 40.85 | 4.51 | 1.13 | 5.62 | 52.11 | 2022 | 23.28 | 0.19 | 0.53 | 1.95 | 25.95 |
| Index | Indicator Meaning | Index Measurement | Selection Basis |
|---|---|---|---|
| P | Population | Total resident population at year-end (100 million) | The growth of urban population increases the total energy consumption, thus increasing the total carbon emission and carbon emission intensity [13] |
| A | Per capita income | Regional GDP per capita (ten thousand yuan) | Rapid economic development changes people’s consumption structure and affects carbon emission level and carbon intensity [10] |
| E | Energy structure | Clean consumption/Total energy consumption (104 tons) | The use of clean energy can effectively reduce the consumption of fossil energy, thus reducing the carbon emission intensity and pollutant emission level [14] |
| N | Energy intensity | Total energy consumption/GDP (104 tons/billion yuan) | Energy intensity reflects the economic benefits of energy utilization and becomes an important contributing factor to curbing the growth of carbon emissions [11] |
| IS | Industrial scale | Industrial added value/GDP (100 million yuan) | Industrial scale adjustment not only affects the overall industrial development but also affects the industrial structure, thus affecting the total carbon emission and carbon intensity [26] |
| FD | Foreign trade dependence | Total imports and exports/GDP (100 million yuan) | Rapid economic development has enhanced import and export trade, increased the output of capital-intensive and technology-intensive products, and significantly increased carbon emissions of various countries due to trade frictions [13] |
| Sichuan Province | Chongqing Municipality | |||||||||||
|---|---|---|---|---|---|---|---|---|---|---|---|---|
| Year | LnP | LnA | LnE | LnN | LnIS | LnFD | LnP | LnA | LnE | LnN | LnIS | LnFD |
| 2000 | −0.183 | −0.702 | −2.541 | 0.535 | −1.211 | −3.062 | −1.256 | −0.449 | −2.533 | −0.094 | −1.040 | −2.648 |
| 2001 | −0.205 | −0.621 | −2.517 | 0.517 | −1.217 | −2.954 | −1.263 | −0.343 | −2.267 | −0.121 | −1.046 | −2.722 |
| 2002 | −0.209 | −0.529 | −2.147 | 0.280 | −1.222 | −2.684 | −1.268 | −0.213 | −2.339 | −0.272 | −1.043 | −2.868 |
| 2003 | −0.201 | −0.421 | −2.282 | 0.423 | −1.189 | −2.576 | −1.272 | −0.071 | −2.371 | −0.198 | −1.010 | −2.636 |
| 2004 | −0.212 | −0.255 | −2.478 | 0.260 | −1.153 | −2.543 | −1.275 | 0.089 | −2.481 | −0.229 | −0.982 | −2.397 |
| 2005 | −0.197 | −0.125 | −2.462 | 0.186 | −1.076 | −2.535 | −1.274 | 0.094 | −2.462 | −0.250 | −0.979 | −2.409 |
| 2006 | −0.202 | 0.036 | −2.368 | 0.113 | −1.021 | −2.368 | −1.270 | 0.208 | −2.515 | −0.192 | −0.908 | −3.424 |
| 2007 | −0.207 | 0.260 | −2.397 | −0.011 | −0.997 | −2.320 | −1.267 | 0.383 | −2.507 | −0.213 | −0.941 | −2.184 |
| 2008 | −0.206 | 0.450 | −2.446 | −0.146 | −0.954 | −2.078 | −1.259 | 0.589 | −2.423 | −0.323 | −0.992 | −2.150 |
| 2009 | −0.200 | 0.553 | −2.473 | −0.118 | −0.926 | −2.096 | −1.252 | 0.829 | −2.437 | −0.365 | −0.990 | −2.480 |
| 2010 | −0.218 | 0.753 | −2.301 | −0.338 | −0.896 | −1.987 | −1.243 | 1.033 | −2.458 | −0.374 | −1.007 | −2.196 |
| 2011 | −0.215 | 0.961 | −2.116 | −0.507 | −0.912 | −1.810 | −1.223 | 1.238 | −2.456 | −0.507 | −1.010 | −1.572 |
| 2012 | −0.213 | 1.086 | −2.159 | −0.586 | −0.933 | −1.723 | −1.212 | 1.359 | −2.338 | −0.711 | −0.994 | −1.105 |
| 2013 | −0.210 | 1.186 | −2.124 | −0.674 | −0.945 | −1.738 | −1.200 | 1.464 | −2.311 | −0.775 | −1.004 | −0.966 |
| 2014 | −0.206 | 1.269 | −2.150 | −0.788 | −0.993 | −1.740 | −1.190 | 1.565 | −2.260 | −0.847 | −1.002 | −0.753 |
| 2015 | −0.199 | 1.312 | −2.021 | −1.023 | −1.039 | −2.105 | −1.181 | 1.655 | −2.194 | −0.957 | −1.049 | −1.093 |
| 2016 | −0.192 | 1.394 | −1.939 | −1.178 | −1.122 | −2.231 | −1.168 | 1.766 | −2.124 | −1.130 | −1.117 | −1.381 |
| 2017 | −0.188 | 1.522 | −1.851 | −1.372 | −1.198 | −2.042 | −1.157 | 1.848 | −2.057 | −1.309 | −1.174 | −1.429 |
| 2018 | −0.184 | 1.642 | −1.726 | −1.518 | −1.244 | −1.888 | −1.151 | 1.924 | −2.044 | −1.392 | −1.237 | −1.331 |
| 2019 | −0.180 | 1.716 | −1.702 | −1.547 | −1.259 | −1.876 | −1.143 | 2.006 | −2.068 | −1.438 | −1.282 | −1.360 |
| 2020 | −0.178 | 1.758 | −1.616 | −1.600 | −1.286 | −1.749 | −1.137 | 2.058 | −2.009 | −1.546 | −1.274 | −1.302 |
| 2021 | −0.178 | 1.866 | −1.544 | −1.648 | −1.247 | −1.626 | −1.136 | 2.162 | −1.894 | −1.679 | −1.263 | −1.144 |
| 2022 | −0.177 | 1.911 | −1.533 | −1.690 | −1.252 | −1.649 | −1.135 | 2.186 | −1.917 | −1.652 | −1.277 | −1.177 |
| Sichuan Province | Chongqing Municipality | |||||||||||||
|---|---|---|---|---|---|---|---|---|---|---|---|---|---|---|
| Variable | AIC Value | 1% Critical Value | 5% Critical Value | 10% Critical Value | t | p | Stationarity | AIC Value | 1% Critical Value | 5% Critical Value | 10% Critical Value | t | p | Stationarity |
| LnI | −30.336 | −3.77 | −3.005 | −2.643 | −1.895 | 0.334 | nonstationary | −40.163 | −3.964 | −3.085 | −2.682 | −2.966 | 0.038 ** | stationary |
| LnP | −109.355 | −4.069 | −3.127 | −2.702 | −1.451 | 0.558 | nonstationary | −104.441 | −3.809 | −3.022 | −2.651 | 0.629 | 0.988 | nonstationary |
| LnA | −49.354 | −4.012 | −3.104 | −2.691 | −1.367 | 0.598 | nonstationary | −70.514 | −4.138 | −3.155 | −2.714 | −3.078 | 0.028 ** | stationary |
| LnE | −37.314 | −4.069 | −3.127 | −2.702 | 0.093 | 0.966 | nonstationary | −37.118 | −3.809 | −3.022 | −2.651 | 0.615 | 0.988 | nonstationary |
| LnN | −34.792 | −3.77 | −3.005 | −2.64 | −0.002 | 0.958 | nonstationary | −33.037 | −3.964 | −3.085 | −2.682 | −2.593 | 0.094 * | stationary |
| LnIS | −56.332 | −4.069 | −3.127 | −2.702 | −1.494 | 0.537 | nonstationary | −63.266 | −4.138 | −3.155 | −2.714 | 0.396 | 0.981 | nonstationary |
| LnFD | −39.781 | −4.069 | −3.127 | −2.702 | −6.573 | 0.000 *** | stationary | −27.431 | −4.138 | −3.155 | −2.714 | −3.031 | 0.032 ** | stationary |
| DLnI | −29.796 | −4.138 | −3.155 | −2.714 | −1.537 | 0.515 | nonstationary | −36.146 | −4.223 | −3.189 | −2.73 | −2.333 | 0.162 | nonstationary |
| DLnP | −172.713 | −4.138 | −3.155 | −2.714 | −26.606 | 0.000 *** | stationary | −97.182 | −4.223 | −3.189 | −2.73 | 1.096 | 0.995 | nonstationary |
| DLnA | −41.589 | −3.788 | −3.013 | −2.646 | −2.216 | 0.201 | nonstationary | −73.639 | −4.223 | −3.189 | −2.73 | −3.078 | 0.028 ** | stationary |
| DLnE | −43.625 | −4.138 | −3.155 | −2.714 | −2.323 | 0.165 | nonstationary | −79.031 | −4.223 | −3.189 | −2.73 | −14.412 | 0.000 *** | stationary |
| DLnN | −32.068 | −3.788 | −3.013 | −2.646 | −5.957 | 0.000 *** | stationary | −28.174 | −3.859 | −3.042 | −2.661 | −2.738 | 0.068 * | stationary |
| DLnIS | −48.301 | −3.788 | −3.013 | −2.646 | −1.632 | 0.466 | nonstationary | −61.326 | −4.138 | −3.155 | −2.714 | −1.026 | 0.744 | nonstationary |
| DLnFD | −32.291 | −4.138 | −3.155 | −2.714 | −0.742 | 0.836 | nonstationary | −12.994 | −4.223 | −3.189 | −2.73 | 0.245 | 0.975 | nonstationary |
| DDLnI | −23.874 | −3.809 | −3.022 | −2.651 | −10.241 | 0.000 *** | stationary | −24.673 | −3.889 | −3.054 | −2.667 | −7.323 | 0.000 *** | stationary |
| DDLnP | −97.862 | −4.069 | −3.127 | −2.702 | −3.464 | 0.009 *** | stationary | −96.739 | −3.889 | −3.054 | −2.667 | −3.524 | 0.007 *** | stationary |
| DDLnA | −39.662 | −3.833 | −3.031 | −2.656 | −5.259 | 0.000 *** | stationary | −45.413 | −3.964 | −3.085 | −2.682 | −4.351 | 0.000 *** | stationary |
| DDLnE | −24.829 | −3.889 | −3.054 | −2.667 | −4.078 | 0.001 *** | stationary | −28.295 | −3.924 | −3.068 | −2.674 | −4.126 | 0.001 *** | stationary |
| DDLnN | −29.006 | −3.809 | −3.022 | −2.651 | −10.404 | 0.000 *** | stationary | −26.44 | −3.889 | −3.054 | −2.667 | −7.199 | 0.000 *** | stationary |
| DDLnIS | −44.6 | −3.809 | −3.022 | −2.651 | −5.279 | 0.000 *** | stationary | −55.369 | −4.138 | −3.155 | −2.714 | −4.894 | 0.000 *** | stationary |
| DDLnFD | −29.03 | −4.138 | −3.155 | −2.714 | −5.566 | 0.000 *** | stationary | −14.352 | −4.223 | −3.189 | −2.73 | −3.224 | 0.019 ** | stationary |
| Sichuan Province | Chongqing Municipality | ||||||||||||||
|---|---|---|---|---|---|---|---|---|---|---|---|---|---|---|---|
| LnI | LnP | LnA | LnE | LnN | LnIS | LnFD | LnI | LnP | LnA | LnE | LnN | LnIS | LnFD | ||
| LnI | 1 | LnI | 1 | ||||||||||||
| LnP | 0.837 | 1 | LnP | 0.854 | 1 | ||||||||||
| LnA | 0.554 | 0.557 | 1 | LnA | 0.566 | 0.527 | 1 | ||||||||
| LnE | 0.830 | 0.922 | 0.564 | 1 | LnE | 0.857 | 0.939 | 0.606 | 1 | ||||||
| LnN | 0.529 | 0.521 | 0.815 | 0.523 | 1 | LnN | 0.580 | 0.535 | 0.815 | 0.543 | 1 | ||||
| LnIS | 0.880 | 0.887 | 0.591 | 0.866 | 0.585 | 1 | LnIS | 0.788 | 0.831 | 0.651 | 0.814 | 0.653 | 1 | ||
| LnFD | 0.885 | 0.893 | 0.56 | 0.919 | 0.555 | 0.579 | 1 | LnFD | 0.844 | 0.678 | 0.507 | 0.725 | 0.502 | 0.574 | 1 |
| Sichuan Province | Chongqing Municipality | ||||||
|---|---|---|---|---|---|---|---|
| t-Statistic | Prob. | t-Statistic | Prob. | ||||
| ADF test | −6.143479 | 0.0000 | ADF test | −3.723464 | 0.0009 | ||
| Test critical values | 1% level | −2.674290 | Test critical values | 1% level | −2.699769 | ||
| 5% level | −1.957204 | 5% level | −1.961409 | ||||
| 10% level | −1.608175 | 10% level | −1.606610 | ||||
| Sichuan Province | Chongqing Municipality | ||
|---|---|---|---|
| VIF | VIF | ||
| lnFD | 1.440 | LnE | 3.356 |
| LnIS | 3.257 | LnA | 3.356 |
| LnP | 3.222 | ||
| Area | Variables | B | Std. Error | Beta | t | p | R2 | F |
|---|---|---|---|---|---|---|---|---|
| Sichuan Province | Adjust R2 = 0.939 | 0.948 | 114.343 (0.000 ***) | |||||
| Constant | 1.896 | 0.424 | 4.467 | 0.000 *** | ||||
| LnFD | 0.309 | 0.033 | 0.593 | 9.41 | 0.000 *** | |||
| LnIS | 1.19 | 0.153 | 0.738 | 7.782 | 0.000 *** | |||
| LnP | 2.986 | 1.564 | 0.18 | 1.909 | 0.071 * | |||
| Chongqing Municipalit | Adjust R2 = 0.968 | 0.972 | 308.273 (0.000 ***) | |||||
| Constant | −6.495 | 0.35 | −18.551 | 0.000 *** | ||||
| LnE | −1.791 | 0.139 | −0.938 | −12.893 | 0.000 *** | |||
| LnA | 0.784 | 0.035 | 1.628 | 22.386 | 0.000 *** |
| Sichuan Province | Chongqing Municipality | ||
|---|---|---|---|
| White Test | White Test | ||
| χ2 | p | χ2 | p |
| 14.759 | 0.098 | 3.866 | 0.569 |
| Sichuan Province | Chongqing Municipality | ||||
|---|---|---|---|---|---|
| Scenario combination | FD | IS | P | E | A |
| Low-speed development scenario | Low speed | Low speed | Low speed | Low speed | Low speed |
| Baseline development scenario | Moderate speed | Moderate speed | Moderate speed | Moderate speed | Moderate speed |
| Green development scenario | Low speed | High speed | Moderate speed | High speed | Low speed |
| Rapid development scenario | High speed | Moderate speed | High speed | Moderate speed | High speed |
| Sichuan Province | Chongqing Municipality | ||||||||||
|---|---|---|---|---|---|---|---|---|---|---|---|
| Year | Low-Speed Development Scenario | Baseline Development Scenario | Green Development Scenario | Rapid Development Scenario | Year | Low-Speed Development Scenario | Baseline Development Scenario | Green Development Scenario | Rapid Development Scenario | ||
| Industrial scale | 2023–2025 | −0.70% | −0.85% | −1.00% | −0.85% | Energy structure | 2023–2025 | 0.90% | 1.00% | 1.10% | 1.00% |
| 2026–2030 | −1.00% | −1.15% | −1.30% | −1.15% | 2026–2030 | 1.50% | 1.60% | 1.70% | 1.60% | ||
| 2031–2035 | −1.30% | −1.45% | −1.60% | −1.45% | 2031–2035 | 2.10% | 2.20% | 2.30% | 2.20% | ||
| 2036–2040 | −1.60% | −1.75% | −1.90% | −1.75% | 2036–2040 | 2.70% | 2.80% | 2.90% | 2.80% | ||
| Population | 2023–2025 | 0.12% | 0.15% | 0.15% | 0.18% | Per capita income | 2023–2025 | 5.50% | 6.00% | 5.50% | 6.50% |
| 2026–2030 | 0.10% | 0.13% | 0.13% | 0.16% | 2026–2030 | 5.00% | 5.50% | 5.00% | 6.00% | ||
| 2031–2035 | 0.08% | 0.11% | 0.11% | 0.14% | 2031–2035 | 4.50% | 5.00% | 4.50% | 5.50% | ||
| 2036–2040 | 0.06% | 0.09% | 0.09% | 0.12% | 2036–2040 | 4.00% | 4.50% | 4.00% | 5.00% | ||
| Foreign trade dependence | 2023–2025 | 3.00% | 3.50% | 3.00% | 4.00% | ||||||
| 2026–2030 | 3.50% | 4.00% | 3.50% | 4.50% | |||||||
| 2031–2035 | 4.00% | 4.50% | 4.00% | 5.00% | |||||||
| 2036–2040 | 4.50% | 5.00% | 4.50% | 5.50% | |||||||
Disclaimer/Publisher’s Note: The statements, opinions and data contained in all publications are solely those of the individual author(s) and contributor(s) and not of MDPI and/or the editor(s). MDPI and/or the editor(s) disclaim responsibility for any injury to people or property resulting from any ideas, methods, instructions or products referred to in the content. |
© 2024 by the authors. Licensee MDPI, Basel, Switzerland. This article is an open access article distributed under the terms and conditions of the Creative Commons Attribution (CC BY) license (https://creativecommons.org/licenses/by/4.0/).
Share and Cite
Fang, H.; Li, H. Analysis of Influencing Factors and Prediction of the Peak Value of Industrial Carbon Emission in the Sichuan-Chongqing Region. Sustainability 2024, 16, 4532. https://doi.org/10.3390/su16114532
Fang H, Li H. Analysis of Influencing Factors and Prediction of the Peak Value of Industrial Carbon Emission in the Sichuan-Chongqing Region. Sustainability. 2024; 16(11):4532. https://doi.org/10.3390/su16114532
Chicago/Turabian StyleFang, Hanyue, and Hongbing Li. 2024. "Analysis of Influencing Factors and Prediction of the Peak Value of Industrial Carbon Emission in the Sichuan-Chongqing Region" Sustainability 16, no. 11: 4532. https://doi.org/10.3390/su16114532
APA StyleFang, H., & Li, H. (2024). Analysis of Influencing Factors and Prediction of the Peak Value of Industrial Carbon Emission in the Sichuan-Chongqing Region. Sustainability, 16(11), 4532. https://doi.org/10.3390/su16114532