Abstract
Data are the core element of digital transformation. Data factor marketization (DFM) is critical in the process of digital transformation, which promotes urban green development. This paper analyzes the role of digitization in urban environmental sustainability. We investigate the effects of DFM on environmental pollution (EP) using a difference-in-differences approach and data from 283 cities in China from 2006 to 2019. The findings reveal that cities implementing DFM demonstrate an average reduction in EP of 2.67%. The mechanism behind DFM lowering EP involves fostering green innovation, increasing public awareness of environmental issues, attracting IT professionals, optimizing the industrial structure, and enhancing digital finance capabilities. Large cities, cities in the south, and those not primarily dependent on natural resources exhibit a more pronounced reduction in EP through DFM. Implementing policies related to digital infrastructure and enhancing the protection of urban intellectual property rights further amplifies the effect of DFM in reducing pollution. Additionally, this effect exhibits spatial spillover effects. This study contributes to the existing literature by (1) demonstrating DFM’s role in improving urban environmental quality in China through digital technology and market mechanisms, thereby aligning economic growth with ecological sustainability; (2) emphasizing the importance of public engagement in environmental stewardship through increased awareness and community participation in policymaking, as well as fostering social inclusion and ecological conservation; (3) emphasizing spatial spillover effects, the importance of inter-city collaboration in environmental policies, and advocating for comprehensive strategies to achieve broader environmental improvements across urban areas.
1. Introduction
Post reform and opening-up, China experienced a rapid economic surge and accelerated urbanization, adopting a growth model characterized by “high investment, high energy consumption, and high emissions”, which intensified urban resource limitations and environmental pollution (EP). This has presented substantial challenges to sustainable urban development [1,2]. Despite the Chinese government’s heightened focus on urban pollution and the implementations of policies to improve EP, the issues remain severe, as evidenced by the “China Ecological Environment Status Bulletin 2022” which noted that 37.2% of cities still exceed environmental standards.
Meanwhile, the digital economy plays a crucial role in facilitating the transformation of urban economic models and in advancing ecological civilization [3,4,5,6]. Data, as the digital economy’s central element [7], profoundly impact areas such as urban innovation, the traditional economy, and high-quality development, which can be attributed to their high permeability, integration, and network effects [8,9,10,11]. The “Digital China Development Report (2021)” (https://www.cac.gov.cn/2022-08/02/c_1661066515613920.htm, accessed on 25 May 2024) and the “National Data Resources Survey Report (2021)” (https://qikan.cqvip.com/Qikan/Article/Detail?id=7107990392, accessed on 24 May 2024) revealed that, in 2021, China’s data output (6.6ZB) grew by 29.4% year-on-year, ranking second globally after the United States (16ZB); additionally, China’s total data storage reached 598.4 EB, an increase of 27.4% from the previous year, accounting for 14.1% of global data storage. Nonetheless, challenges like “data monopolies” and “data islands”, ambiguity regarding data rights, and an incomplete legal and policy framework for data trading and application hinder the full utilization and value maximization of data elements. Addressing these issues is urgent if we are to capitalize on the latent value of data and support sustainable development.
Data factor marketization (DFM) aims to optimize data allocation and enable fair pricing and efficient trading via market mechanisms, fostering technological innovation and standardized regulation to maximize data’s economic and social value [12]. Internationally, initiatives like Germany’s “Industrial Data Space Initiative”, launched in 2014 and drew participation from over 20 countries to create a data exchange framework, reflect a global trend. The US, the EU, and Japan have introduced strategic plans, such as the “EU Digital Master Plan” and the “European Data Strategy”, and the “ICT Comprehensive Strategy for 2020”, all of which aim to establish cross-border data trading markets. In line with global trends, data factors are increasingly being focused on for marketization and value realization by China. The government’s efforts to foster a market for data factors are intensifying [13,14]. Unlike traditional market transactions, big data trading platforms are instrumental in efficiently allocating data factors through their synergy of online data transactions and offline services. This efficiency profoundly impacts urban economic growth and the transition towards greener economics. The term “big data” was first included in the Chinese government’s work report in 2014, leading to the first big data trading platform, Zhongguancun Shuhai Big Data Trading Platform, being established in February 2014. April 2015 saw the inception of the first big data exchange, the Guiyang Big Data Exchange, which marked the start of local government-led initiatives to create data exchanges. Since then, numerous big data trading institutions have emerged across the country. By 2021, there were nearly 80 big data trading platforms nationwide, with over 20 being established or coordinated by local governments, spanning three municipalities—Beijing, Shanghai, and Chongqing—and ten provinces, including Guizhou, Hubei, Zhejiang, Jiangsu, and Shaanxi.
The digital economy plays an important role in promoting the transformation of urban economic models. This raises the question of whether DFM can provide a sustainable solution to China’s EP challenges and, if so, what mechanisms are at play. To address this issue, we use the big data trading pilot platforms established by Chinese cities as a quasi-natural experiment of the DFM, and then investigate its impact on EP.
This study enriches the existing literature in three primary dimensions. (1) The role of DFM in environmental quality improvement: This research highlights the pivotal role of DFM in enhancing environmental quality, particularly in urban settings within China. The study outlines how DFM can contribute to sustainable urban development by leveraging digital technologies and market mechanisms. It demonstrates that DFM is crucial in mitigating EP by facilitating green development and optimizing industrial structures. This finding extends the theoretical framework on the intersection of digital economy and environmental governance, suggesting that cities can utilize DFM to align economic growth with ecological sustainability. (2) Inclusive approaches and public engagement: Another major contribution of this study is its focus on the role of public engagement in environmental stewardship. It underscores the importance of enhancing public environmental awareness and integrating community participation into policy-making processes. This approach aims to bolster the support for DFM and other green initiatives, highlighting the role of digital transformation in promoting not only technological and economic advancements but also in fostering social inclusion and ecological conservation. The study posits that involving the public in environmental decision making is crucial for the successful implementation of sustainable practices and for achieving a more environmentally resilient urban development. (3) Spatial spillover and inter-city collaboration: The study emphasizes the significance of spatial spillover effects where DFM initiatives in one city can influence environmental outcomes in neighboring areas. This aspect underlines the importance of inter-city cooperation in environmental policies, which could lead to more comprehensive and effective strategies for pollution reduction. By exploring the interconnectedness of urban centers, the research advocates for collaborative approaches, enhancing the scope of DFM to achieve broader environmental improvements across multiple urban jurisdictions.
2. Literature Review and Theoretical Framework
2.1. Literature Review
The digital economy comprises economic activities where data resources serve as key factors. Digital infrastructure is a crucial platform, and big data, AI, and 5G drive efficiency enhancements and economic structural optimization [15].
Prior research predominantly focused on particular facets of the digital economy in order to assess its impact on EP. Some studies have developed a comprehensive digital economy index system to explore its impact on EP empirically [16,17], including research focusing on specific aspects like artificial intelligence [18,19], digital finance [20,21], internet development [22,23], and the digitalization of governmental environmental management [24]. The literature with a policy evaluation perspective has assessed the digital economy’s impact on EP through various pilot policies, including the “National Big Data Comprehensive Experimental Zone” [25,26], smart city initiatives [27], “Broadband China” [28], and e-commerce demonstration city programs [29]. These studies have primarily examined the effect of the digital economy from the standpoint of data factor aggregation.
However, challenges such as ‘data monopolies’ and ‘data islands’ have restricted the full exploitation of data resources, potentially hindering their role in pollution reduction. With the rise in data resources and the need for data trading, the full unleashing of the value of data factors has garnered attention. Unlike traditional perspectives centered on the functionality of data factors and digital economy models, DFM treats data as a fundamental production element subject to market allocation. The acceleration of DFM, a crucial trend in digital economic evolution and production relation transformation, is anticipated to significantly boost the efficiency of data circulation and market dynamism, leading to a shift in the current digital economy paradigm. Thus, this study scrutinizes the potential of data factors to reduce pollution from the viewpoint of factor marketization. Existing research has discussed DFM’s definition, its operational mechanisms, and practical approaches [13], highlighting data trading platforms as central to enhancing market-oriented data factor allocation efficiency [30]. It has identified three typical DFM models [31]. Additionally, research has begun to explore DFM’s resource-saving effects on enterprises [32]. The effect of DFM on green innovation has also been verified [33]. However, DFM’s pollution reduction efficacy remains unexplored and unassessed.
2.2. Theoretical Framework
This research delves into the impact mechanisms of DFM on EP through five key dimensions: green technology innovation, public environmental concerns, digital talent, industrial structures, and digital inclusive finance.
Firstly, concerning green technology innovation, DFM enables data factors, like traditional production factors, to circulate freely in the market in response to supply and demand. It offers a flexible and efficient impetus for green innovation [33]. DFM broadens cooperative prospects in green technological advancements and facilitates the allocation of necessary resources like capital, knowledge, technology, and talent, fostering green technologies’ integration and collaborative evolution [34,35]. Additionally, establishing big data trading platforms enhances the analytical capabilities of environmental data, aiding in identifying bottlenecks and optimizing the strategies used in green technology innovation, thus effectively supporting it. The link between green technology innovation and reduced ecological pollution is well established in the literature, highlighting its role in diminishing emissions by advancing green technologies [36,37].
Secondly, regarding public environmental concerns, DFM creates avenues for public engagement in environmental governance. Marketized data trading expedites data circulation, enabling easier access to environmental data for the public. This accessibility positions environmental data as a crucial tool for acquiring environmental information and engaging in governance activities [38]. Through data analysis, public involvement in scrutinizing and influencing the environmental practices of businesses and governments fosters a heightened environmental awareness and participation in environmental protection [39,40]. Furthermore, DFM also encourages public attention towards individuals’ environmental conduct. The application of data technologies leads to the increased collection and analysis of personal environmental data, thus elevating public environmental consciousness. The escalation in public environmental awareness not only pressures governments and enterprises to intensify their pollution control efforts but also encourages public shifts in environmental behaviors and consumption patterns, contributing to reducing urban pollution emissions [41].
Thirdly, in the context of digital talent, DFM significantly enhances employment opportunities for training and development and bolsters professional skills. DFM’s expansion of the digital talent market is primarily due to increased enterprise demand for expertise in data analysis, processing, and mining, thus creating a robust digital ecosystem conducive to talent development [42]. Concurrently, the marketization of data factors results in larger data volumes and more complex data structures, necessitating digital professionals to continually elevate their skill sets and knowledge to meet evolving market demands [43]. This growth in digital talent is crucial for reducing pollution. Cultivating these people not only augments an enterprise’s resource pool but also enhances its capability for technological innovation [44] and facilitates inter-regional communication and collaboration. The mobility of digital talent plays a key role in disseminating knowledge and technology, thereby fostering the development of new technologies and contributing significantly to pollution reduction efforts.
Fourthly, in terms of the industrial structure of the country, DFM can contribute to industrial upgrading in three ways. Initially, under market mechanisms, DFM can facilitate allocating data resources to more efficient enterprises [45], thereby aiding in transforming and upgrading industrial structures. Subsequently, DFM can foster synergistic industry development by enabling marketized data trading, which encourages inter-industry cooperation and strengthens the integration and optimization of industrial and supply chains, boosting overall industry collaboration [46]. Lastly, DFM provides a platform for small and medium-sized enterprises to compete with large companies, enabling them to innovate and develop new technologies using shared data resources. Therefore, DFM can intensify the competition among enterprises, invigorating innovation and enhancing competitive capabilities by expediting the flow of data factors [47]. This competition leads to the exit of less competitive and efficient enterprises, steering the industrial structure towards efficiency-driven development. The role of industrial structure upgrading in mitigating pollution emissions is well established, and it can achieved through fostering cleaner industries and greener industrial chains, contributing to reduced pollution emissions [48,49,50].
Fifthly, DFM plays a pivotal role in digitally inclusive finance by providing essential data resources, thereby reducing information asymmetry and fostering growth. DFM enhances data flow and sharing, enriching the number of available data resources like personal consumption, mobile communications, and social media data. This enrichment enables digitally inclusive finance institutions to understand users’ creditworthiness better, facilitating more precise financial services. Moreover, DFM’s contribution to reducing information asymmetry [51] aids these institutions in conducting more accurate risk assessments and setting fairer interest rates and loan terms, ultimately lowering credit risks. Furthermore, DFM enables financial institutions to comprehend users’ needs and preferences more effectively, allowing for the creation of customized financial services that align with individual user profiles. Additionally, DFM-driven advancements in digitally inclusive finance are crucial in supporting sustainable energy efforts and environmental governance projects, enhancing enterprises’ clean production capacity, and promoting sustainable urban development [21,52]. The mechanical path of the research is shown in Figure 1.
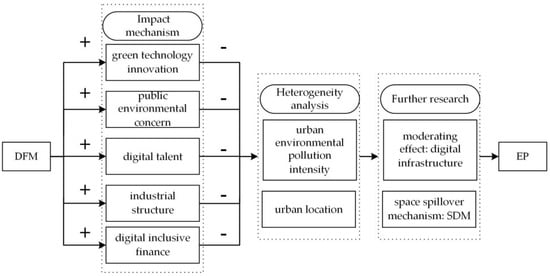
Figure 1.
Technical circuit diagram of the effect DFM on EP.
3. Design of the Research
3.1. Setting up the Model
The research model for this study is as follows:
This model’s subscripts and represent the city and year. EP denotes the level of environmental pollution. In alignment with the existing literature [53,54], we employed an entropy technique to measure EP for 283 cities in China. This index serves as an indicator of a city’s EP. Considering data accessibility and the significant pollution from industrial activities, the specific pollution metrics chosen include total industrial wastewater discharge, industrial SO2 emissions, and industrial particulate matter emissions in cities, all measured in ten thousand ton units.
The DFMit is Treatedi × Timet, where Treatedi is a dummy variable that indicates if a city is part of big data trading platform pilot, and Timet is a dummy time variable. Following the methodology outlined in the existing research [32], cities with established big data trading platforms are assigned one value, designating them as the treatment group. In contrast, those without such platforms are assigned a zero value, forming the control group. The dummy time variable is assigned values of zero and one, for periods before and after the establishment of the data trading platforms, respectively. The interaction term between the city and platform establishment time dummy variable quantifies DFM.
and are city and time’s fixed effects, respectively. represents random error.
Controlsit comprises a variety of control factors. The following additional control variables influencing EP were selected to evaluate DFM’s impact. (1) Population density (POP): High-population-density areas often face traffic congestion, leading to increased vehicular emissions and aggravating air pollution and greenhouse gas emissions. We represent POP by the logarithm of population per administrative unit. (2) Per capita wealth (WEALTH): Increasing wealth can lead to heightened personal consumption, particularly of energy-intensive products and services, thereby escalating greenhouse gas emissions and other pollution forms. This study quantifies WEALTH using the logarithm of average wages. (3) Openness (OPEN): Openness typically involves the influx of foreign investment and a surge in industrial activity, which can result in resource overuse and amplified EP, especially in countries with lenient environmental regulations. Conversely, openness can introduce advanced environmental technologies and management practices. Foreign enterprises with high environmental standards may induce higher environmental compliance in host countries. In this study, OPEN is measured using the proportion of imports and exports to GDP. (4) Government interference (GOV): The government may inadvertently bolster polluting industries through subsidies, tax breaks, or other supportive measures, potentially increasing pollutant emissions. GOV is assessed in this study by the proportion of fiscal expenditures to the total fiscal budget. (5) Environmental regulation (ER): Environmental regulations can effectively reduce EP by encouraging the adoption of clean technology, enhancing environmental consciousness, and establishing emission standards. This study calculates ER using the rate of sulfur dioxide elimination. (6) Energy efficiency (ENERY): Improved energy efficiency leads to a reduced demand for energy, which can decelerate non-renewable resource extraction, thereby lessening ecological damage and pollution. ENERGY in this study is measured by the GDP produced per energy consumption unit. (7) Financial development (FINA): FINA is critical in funding environmental and sustainable technology projects, such as renewable energy, clean technology, and energy conservation initiatives, contributing to reducing EP. However, there is a potential for FINA to increase EP, particularly when investments flow into high-pollution sectors. This study quantifies FINA using the ratio between financial loans and GDP. (8) Economic development level (AGDP): Economic growth is often linked to technological innovation, including advancements in energy efficiency and clean energy technologies. Such innovations can lessen the environmental impact per unit of economic production. AGDP in this study is represented by per capita GDP. (9) Manufacturing agglomeration (AGG): The environmental impact of manufacturing accumulation is influenced by factors such as the industry’s characteristics, and the administrative efficiency of local governments. Effective management and technological interventions can mitigate the adverse environmental effects of manufacturing agglomeration. AGG is assessed in this study through the location quotient of the manufacturing sector.
We ran a correlation analysis on the control variables, and the results are reported in Table 1. The variables show a connection. However, after performing the multicollinearity test, the average VIF value is 1.66, with each variable having a VIF value of less than 10. This suggests that the empirical model of this study does not contain significant multicollinearity, and that the control variables were chosen appropriately.

Table 1.
Correlation analysis.
Building on model (1), this study further explores the mechanisms through which DFM influences EP. The mechanism-testing model is structured as follows:
where M represents the mechanism variable. The research assesses green technological innovation (INNOV) using the number of green invention patent applications per 10,000 humans [55], digital talent (DTALENT) as the percentage of employees in information transmission, computer services, and software industries compared to the total city employment [56,57], industrial structure (INDUSTR) as the ratio of tertiary to secondary industry employment [58], and digital inclusive finance (DIFINA) which is the index released by Peking University’s Digital Finance Research Center [59].
The coefficient measures the impact of DFM upon M, while assesses the influence of M upon EP. If DFM impacts EP through M, then the coefficients , , , should be statistically significant, indicating the presence of a causal pathway from DFM to EP via the mechanism variable M.
3.2. Sample Selection
This study uses panel data from 283 cities in China from 2006 to 2019. These samples have covered most of China ‘s cities, and the sample deadline of 2019 can effectively avoid COVID-19 distorting the estimation results. Data pertinent to big data trading platforms were primarily sourced from the official website of the ICT department of the Chinese government (http://www.caict.ac.cn/english/research/whitepapers/202112/P020211228472393829284.pdf, accessed on 1 August 2023). Other variables were derived from sources including the China City Statistical Yearbook (2007–2020), the China Environmental Statistics Yearbook (2007–2020), and the China Regional Economic Statistical Yearbook (2007–2020). Table 2 shows the descriptive statistical results. There were 3692 observations during the sample period. The explained variable EP is a standardized index, with a maximum value of 0.53 and an average value of 0.04, indicating a significant difference in EP across Chinese cities. The core explanatory variable DFM has a mean value of 0.02, indicating that DFM directly affected 2% of Chinese cities during the sample period. The range of other variables is reasonable.
Table 2.
Descriptive statistics.
4. Empirical Results
4.1. Parallel Trend Test
A fundamental assumption of the DID method is that the treatment and control groups exhibit similar trends before the intervention. It presupposes that, in the absence of intervention, the outcome indicators for both groups would follow comparable trajectories. The test assesses the validity of this critical assumption. Discrepancies in pre-intervention trends between the groups can lead to biased DID estimations. Figure 2 displays the test results. The estimated coefficients are insignificant, although there was a downward trend until 2012. Before 2012, there were no differences between the two groups. Post-2012, the coefficients were significantly negative, suggesting an early manifestation of DFM’s adverse impact on EP. This finding implies that implementing DFM policies has led to a marked reduction in urban EP.
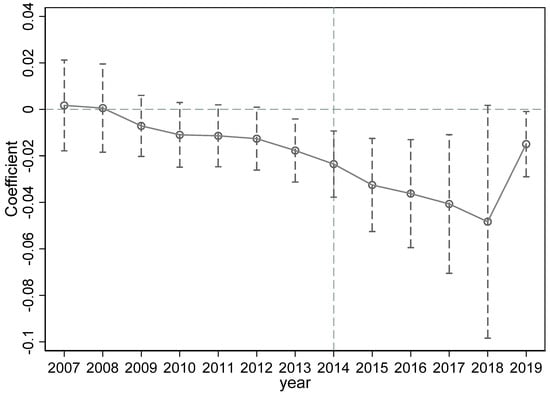
Figure 2.
Parallel trend test.
4.2. Baseline Regression
The results in Table 3 consistently show that DFM significantly reduces EP, regardless of whether control variables are included and city and time-fixed effects are accounted for. For instance, as illustrated in column (4), cities implementing DFM exhibit an average decline in EP of 2.67%, compared to those without DFM. DFM facilitates environmental protection through multiple avenues, such as optimizing resource allocation, fostering environmental technology innovation, enhancing regulatory mechanisms, elevating public consciousness, and encouraging green consumption and production practices.
Table 3.
Baseline regression.
4.3. Robustness Analysis
4.3.1. Placebo Test
We conducted a placebo test to negate the possibility that other policy initiatives or random factors influence DFM’s impact on EP. It involved randomly selecting several cities equivalent to the pilot cities as the treatment and creating a virtual DFM based on arbitrarily generated times. This process was replicated 1000 times for the regression of the baseline model shown in column (4). The kernel density plot of these 1000 DFM coefficient estimations (shown in Figure 3) reveals that the mean of the simulated coefficients centers around zero, closely aligning with the −0.0267 coefficient in column (4) of Table 3. The actual coefficient significantly exceeds the simulated coefficients, positioning it as an outlier. This outcome suggests that obtaining a coefficient of −0.0267 is highly improbable, reinforcing the conclusion that DFM’s influence in reducing EP is robust.
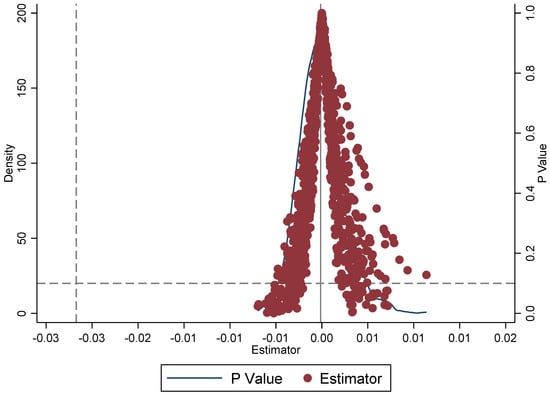
Figure 3.
Placebo test.
4.3.2. Additional Robustness Tests
(1) Bacon decomposition test: Following [60], this study addresses the biases in the multi-time point DID estimates amidst the two-way fixed effects. The Bacon decomposition results show that the estimation for the inappropriate treatment group is −0.003, with a weight of 0.3%. In contrast, the unsuitable treatment group holds a significant weight of 98.8%, indicating a minor impact of inappropriate treatment (See Table 4).
Table 4.
Bacon decomposition.
(2) Two-stage DID estimation: The Bacon decomposition test identified sources of bias in overlapping DID models, but does not rectify the bias issue. Thus, a two-stage DID approach was adopted for a more robust analysis. The results in Table 5, column (1) show that accounting for TWFE bias results in a core explanatory variable coefficient (−0.0270) that is higher than the baseline regression (−0.0267).
Table 5.
Robustness tests.
(3) Altering the dependent variable: The study also investigates DFM’s effect on air quality by using the Air Quality Index (AQI) as an alternative dependent variable. The AQI, which incorporates factors like SO2, NO2, PM2.5, CO, PM10, and O3, shows that DFM significantly lowers the AQI, as seen in Table 5, column (2).
(4) Controlling other pilot policies: To isolate DFM’s influence, the study controls for other potentially confounding pilot policies, including the local government data opening pilot policy (LGDOPP), the national big data comprehensive experimental zone pilot policy (NBDCEZPP), the smart city pilot policy (SCPP), the civilized city pilot policy (CCPP), the low-carbon city pilot policy (LCCPP), the innovative city pilot policy (ICPP), and the green finance pilot policy (GFPP). Table 5, column (3) shows that the coefficients of each of these policy pilots were significant, and the magnitude of the coefficients was much lower than that of the DFM. It confirms that DFM’s negative impact on EP persists even after accounting for these policies.
(5) PSM–DID test: Utilizing existing control variables as covariates, we performed annual matching through the 1:1 nearest neighbor method. As shown in Table 5, column (4), the subsequent baseline analysis of the matched samples confirms that DFM’s coefficient remains negative, affirming the basic conclusions.
(6) Exclusion of special samples: Considering that municipalities and sub-provincial cities might skew results due to their higher administrative status, these cities were excluded. The results in Table 5, column (5) indicate that, even after this exclusion, DFM’s impact coefficient remains significantly negative.
4.4. Endogeneity Analysis
This study utilized data from 283 cities in China, encompassing all prefecture-level cities, thereby minimizing potential sample selection bias. The primary variable of interest was the implementation of data transaction pilot programs, with the rationale that the EP is unlikely to influence policy enactment. This assumption enhances the exogeneity of our primary explanatory variable, ensuring that our analysis is not compromised by simultaneity bias. The data employed in this research were acquired through official means, and were predominantly compiled by the Chinese government, ensuring that measurement errors do not significantly impact our estimations. To address potential endogeneity, this study incorporates instrumental variables for DFM, complemented by a 2SLS approach. Instrumental variables include the number of post offices, telecommunication services, and telephones in each city in 1984 [32]. On the one hand, the development of DFM is based on traditional communication technology. The presence of post offices, telecommunication services, and telephones as the main telecommunication infrastructure will affect the development of the DFM from technical-level aspects and habit formation, so the instrumental variable meets the correlation requirements; on the other hand, the main function of post offices, telecommunication services, and telephones is to provide communication services for the society, which does not directly affect EP, so these instrumental variables also meet the exclusion requirements. These variables, being time-invariant, interact with the dummy time variable to serve as IV. The regression results (Table 6) illustrate that, irrespective of the chosen instrumental variable, statistical tests confirm the instruments’ validity, dismissing weak instrument concerns. The negative coefficient of DFM in the second-stage regression aligns with prior findings, suggesting that overlooking the model’s endogeneity tends to underestimate DFM’s mitigating effect on EP.
Table 6.
Endogeneity test.
4.5. Impact Mechanism Test
From columns (1) and (2) of Table 7, DFM fosters INNOV (innovation), which in turn notably reduces EP. It indicates that DFM can suppress EP by enhancing innovative activities. Columns (3) and (4) show that DFM boosts CONCER (public environmental concern), which significantly lowers EP. This finding suggests that DFM can reduce EP by elevating public concern about environmental issues. Further, columns (5) and (6) reveal that DFM effectively attracts TALENT (digital talent), and this influx of talent significantly curtails EP. It implies that DFM contributes to reducing EP by drawing in digital talent. Additionally, columns (7) and (8) indicate that DFM significantly advances INDUSTR (industrial structure optimization), which substantially suppresses EP. It means that DFM can mitigate EP by promoting the optimization of industrial structures. Lastly, columns (9) and (10) demonstrate that DFM significantly encourages DIFINA (digital inclusive finance), which significantly diminishes EP. Therefore, DFM can suppress EP by fostering digitally inclusive finance.
Table 7.
Mechanism tests.
4.6. Heterogeneity Analysis
4.6.1. Variability in Urban Environmental Pollution Intensity
We performed quantile regression analyses to explore the effects of urban pollution levels. To conduct these, we categorized pollution levels into five quantiles, 10%, 25%, 50%, 75%, and 95%, and subsequently conducted regression analyses to examine the variability in these effects across various pollution intensities. Table 8 assesses the variability in the impact of DFM depending on the intensity of urban EP. The effectiveness of DFM in curbing EP diminishes as the pollution levels escalate. This attenuation could be attributed to the limitations of data analysis and technological innovation, which, while beneficial to addressing environmental challenges, may fall short in more severe pollution scenarios. Advanced technologies and comprehensive data, which are potentially undeveloped or inaccessible, might be necessary to tackle intensified pollution effectively.
Table 8.
Test results for variability in the intensity of urban EP.
4.6.2. Variability Based on Urban Location
The results in Table 9, examining urban location heterogeneity, reveal that DFM implementation is more effective at reducing EP in larger cities than in smaller cities. This is likely because larger cities can access more resources, including financial funding, technological infrastructure, and skilled personnel. These resources enable larger cities to invest more efficiently in DFM projects, like environmental monitoring systems, data analysis platforms, and developing green technologies.
Table 9.
Heterogeneity test.
The study also finds that DFM initiatives in southern cities are more effective in reducing EP compared to northern cities. This difference may stem from variations in their economic structures: southern cities often lean more towards service and high-tech industries, whereas northern cities may be more reliant on heavy industry. These economic discrepancies influence the type and intensity of pollution and, consequently, the effectiveness of DFM in mitigating it. Specifically, the northern region’s industry is more concentrated, particularly the heavy and mineral processing industries, which are more developed. For example, industries like coal, steel, and chemicals are more concentrated in the north, typically emitting large amounts of sulfur dioxide and particulate matter. At the same time, the northern region experiences cold winters and relies heavily on coal for its heating and energy supply. Coal combustion is the leading cause of air pollution. In contrast, the southern region’s industries are dominated by light and high-tech industries, including electronics, machinery manufacturing, chemical fiber, and food processing. These industries usually emit fewer pollutants than heavy industries. The climate in the southern region is milder, coal is rarely used for heating, and pollution levels are lower than in the north. In conclusion, southern cities tend to favor service and high-tech industries, with high-tech industries producing more tradable data elements that can help reduce pollution. Most of these are traditional heavy industries in the north, and industrial pollution is worse than in the south. These pollutants are difficult to reduce though DFM.
DFM in non-resource-based cities appears to have a greater impact on lowering EP. These cities likely enforce stricter policies and more actively engage in data-driven environmental management practices. On the other hand, resource-based cities may need to emphasize addressing the environmental impacts of resource extraction and transitioning related industries toward sustainability.
4.7. Additional Research
4.7.1. Modulatory Mechanism Test
In this study, the “Broadband China” pilot policy is utilized as a proxy for assessing a city’s digital infrastructure policy (INFAR), exploring its ability to modulate the effectiveness of DFM in curtailing EP. Table 10, column (1) shows that INFAR notably bolsters DFM’s capacity to suppress EP. This enhancement is likely because DFM depends on precise data for optimal resource distribution, and digital infrastructure facilitates effective resource allocation in areas like environmental management and pollution reduction.
Table 10.
Results of the regulatory mechanism test.
In this study, intellectual property protection in cities (TIUP) is measured using the ratio of the city’s IP trial closure cases to GDP, normalized by the national ratio of IP trial closure cases to GDP. The results for testing the TIUP modulatory mechanism, in column (2) of Table 11, show that the interaction coefficient between TIUP and DFM is −0.0202. This finding suggests that TIUP strengthens the inhibitory effect of DFM on EP. A possible explanation for this phenomenon is that the clarity of data factor property rights is reinforced in cities with higher levels of IP protection. This enhancement reduces the risks associated with data usage by businesses, including minimizing the risks of infringement and unauthorized copying or theft of data. Consequently, this clarity in property rights encourages businesses to engage more actively in the innovative application of data, which in turn is conducive to amplifying the suppressive impact of DFM on EP.
Table 11.
Results of the full distance spatial spillover effects.
4.7.2. Spatial Spillover Mechanism
The spatial Durbin model (SDM) is utilized to examine the spatial spillover mechanism by which DFM influences EP. The SDM assesses the spatial spillover effects of DFM on EP, and the total marginal effects are further dissected into direct, indirect, and total effects using the partial differential approach. The study constructs three spatial weight matrices: the distance-based spatial weight matrix (W1), the economic spatial weight matrix (W2), and a combined economic–distance spatial weight matrix (W3). W1 and W2 feature diagonal elements set to zero, with non-diagonal elements inversely related to inter-city distances and differences in per capita GDP, respectively; W3 = 0.5W1 + 0.5W2. Following LM, Wald, and LR tests, the SDM was the appropriate choice for the model setting. The study employs maximum likelihood estimation (MLE) for the SDM estimation (Table 11).
The study findings indicate that the direct and indirect impacts of digital financial markets (DFMs) on environmental performance (EP) are statistically significant, with the latter exhibiting a more pronounced effect. This outcome suggests that the influences of cross-regional interactions and spatial spillover may exceed local determinants’ extent and intensity. The underlying mechanisms are multifaceted, and can be explained as follows:
- (1)
- Enhanced spatial connectivity and interaction: Establishing DFMs boosts information flow and technology dissemination across regions. First, the data market’s standardization and interoperability have significantly reduced the barriers to data acquisition and application, improving data availability and accessibility while also accelerating information flow. Second, by encouraging open data sharing, DFMs provide valuable resources for scientific research and business innovation while also promoting cross-domain technical cooperation and development. Furthermore, DFMs increase R&D efficiency and accelerate the adoption of new technologies by lowering data acquisition costs. Policy support and the establishment of legal frameworks, such as data protection laws and transparency requirements, help to ensure data flow security and compliance while also facilitating the widespread dissemination of technology and information. In summary, the DFM facilitates the swift propagation of environmental management strategies and pollution control technologies, implying that market developments in one region could substantially influence the environmental landscape of adjacent areas. Consequently, indirect effects are observed to be considerably larger than direct impacts.
- (2)
- Policy and technological spillovers: DFMs might introduce advanced environmental technologies and management practices. Their influence could extend to other regions through collaborative projects, policy emulation, and technology transfers, engendering broad spatial effects.
- (3)
- The Spatial influence of economic structural adjustment: The advent of DFMs fosters regional economic structural optimization, with impacts other areas via market dynamics and supply chain linkages. It includes fostering environmentally friendly industries and adjusting high-pollution sectors, with spatially significant indirect effects.
- (4)
- Variability in regional responses to environmental policies: Implementing DFMs may encourage some regions to adopt more stringent environmental protection measures. These effects could be disseminated to other areas through social networks, economic connections, and demonstrations of the effect of policies, thereby further amplifying the indirect impacts.
5. Discussion
5.1. Theoretical Implications
DFM aims to optimize data allocation and enable fair pricing and efficient trading via market mechanisms, fostering technological innovation and standardized regulation to maximize data’s economic and social value [12]. Internationally, initiatives like Germany’s “Industrial Data Space Initiative”, which was launched in 2014 and drew participation from over 20 countries to create a data exchange framework, reflect a global trend. The US, the EU, and Japan have introduced strategic plans, such as the “Federal Big Data Research and Development Strategic Plan”, the “EU Digital Master Plan” and the “European Data Strategy”, and the “ICT Comprehensive Strategy for 2020”, all of which aim to establish cross-border data trading markets. Similarly, China is proactively developing its data factor market, exemplified by the 2022 release of the “Opinions on Constructing Data Basic Systems to Better Play the Role of Data Factors”, which highlights the concept of leveraging big data and application scenarios to unlock data factors’ potential. Policies like the “Data Twenty Articles” have clarified the intention to nurture the data factor market and enable the large-scale circulation of data resources, significantly contributing to the optimal allocation and value maximization of data resources. This raises the question: can DFM provide a sustainable solution to China’s EP challenges, and if so, what are the mechanisms at play? Investigating these questions offers valuable insights and evidence for other nations seeking to address EP issues by valorizing data factors.
This study’s empirical examination of the effects of DFM on EP not only sheds light on the transformative potential of digitalization in environmental governance but also adds to the larger conversation on environmental economics and urban development. This research emphasizes the essential need for sustainable solutions by placing DFM in the context of China’s growing urbanization and environmental issues, as illustrated by the historical “high investment, high energy consumption, and high emissions” growth model [1,2]. The Chinese government’s focus on pollution control and green development, as evidenced by policies emanating from significant national directives [61,62] and the alarming statistics on air quality levels in urban centers [63], serves a pertinent backdrop for our study. The “Data Elements Action Plan” for 2024–2026, published jointly by the China Data Bureau and 17 other departments, identifies the use of data elements to facilitate green and low-carbon production processes as a critical goal. The plan advocates for increased resource efficiency by consolidating data from the entire solid waste lifecycle—including collection, transfer, utilization, and disposal—to improve the effective integration of waste generation, transportation, and resource conversion, as well as promoting resource-based utilization of both solid and hazardous wastes. In Anhui Province, the Hefei Environmental Protection Big Data Platform collects comprehensive ecological and environmental monitoring data for the city, including construction site dust, storm and sewer systems, and meteorological and urban spatial data. This platform fully integrates the monitoring of data and visuals, overcoming previous challenges with data isolation. The platform’s manager reports that it has successfully integrated data from approximately 40 government departments, including urban planning, construction, and water management, totaling over 2.1 billion data entries. This extensive dataset contributes to significant environmental initiatives such as air quality management and blue-green algae control in Chaohu Lake. This information confirms the role of DFM in reducing pollution.
Our findings extend the theoretical framework by demonstrating how DFM is a pivotal mechanism for enhancing environmental quality across different urban settings. This comprehensive view of DFM’s significance is consistent with the growing awareness of the digital economy’s influence on ecological civilization progress and urban economic model change [3,4,5]. The differential effects observed across various city types underline the importance of context-specific strategies in leveraging DFM for environmental improvement. This insight is particularly relevant given the challenges and opportunities presented by data monopolies, data islands, and the evolving legal and policy landscape.
Moreover, the study’s emphasis on the spatial spillover effect of DFM initiatives reinforces the value of inter-city cooperation in environmental governance, echoing the findings from recent policy evaluations and digital economy impacts on EP [22,23]. This aspect highlights how urban planners and policymakers can craft more effective, collaborative approaches to pollution reduction, leveraging urban areas’ interconnectedness to magnify DFM’s benefits.
The evidence pointing to the advantages of large, southern, and resource-based cities adopting DFM for sustainable development strategies complements the literature’s call for green innovation and the optimization of industrial structures [3,4,5]. It suggests a pathway for these cities to transition towards a more sustainable, data-driven economy, thus addressing the urgent need for pollution mitigation and sustainable urban development highlighted in the literature [1,2].
Finally, by advocating for enhancing public environmental concerns, this study aligns with the broader discourse on the significance of public engagement in environmental stewardship. It reinforces the argument for a more inclusive approach to environmental policy-making, where public awareness and support are crucial for successfully implementing DFM and other green initiatives [24]. This approach aligns with the global trend towards data-driven environmental solutions, and offers a blueprint for harnessing the power of digital transformation in achieving sustainable urban development.
In conclusion, although existing studies have acknowledged the role of DFM in energy conservation and green innovation [33,45], they do not account for the spatial spillover effect of DFM and do not recognize the critical role of public attention in DFM. Our research adds to the continuing discussion about the effectiveness of digital economy methods, such as DFM, in addressing environmental challenges. By integrating and building upon the rich tapestry of the previous literature in this field, we offer a comprehensive view on the possibilities of digital transformation to foster a harmonious balance between urban economic growth and ecological sustainability. It contributes significantly to sustainable development by underscoring the potential of DFM to mitigate EP challenges, which are critical to achieving sustainable urban development. By analyzing the impact of DFM construction on urban pollution emissions, the study not only expands the scope of research into urban pollution determinants but also provides empirical insights that could guide the concurrent advancement of digitalization and environmental sustainability. Furthermore, the investigation into the mechanisms through which DFM influences EP, including green innovation, public environmental engagement, and digitally inclusive finance, elucidates the multifaceted role of data in enhancing economic and social value while promoting ecological conservation. We underscore the importance of integrating digital economic models with ecological sustainability efforts, offering a nuanced understanding of how digital transformation can facilitate a transition towards more sustainable urban economies. Through this study’s pioneering research perspective and methodology, we contribute to sustainable development literature, advocating for a harmonized approach to leveraging digital economies in addressing contemporary environmental challenges.
5.2. Practical Implications
In light of our research findings, we advocate for the following policies. We advocate for the encouragement and support of establishing and developing big data platforms in additional cities, specifically for environmental data exchange and analysis. These platforms should consolidate environmental monitoring data, making them accessible to government entities, corporations, and the public, thereby facilitating data-driven environmental decision-making. In urban planning and budget allocation, special emphasis should be placed on building and upgrading digital infrastructures that enhance the efficiency of environmental data collection and processing, particularly in resource-dependent and smaller municipalities. Moreover, we recommend incentivizing businesses to innovate green technologies through fiscal incentives, tax breaks, and funding, bolstering the growth of low-carbon and eco-friendly sectors. Leveraging digital platforms for environmental education and public engagement can significantly raise awareness and participation in environmental conservation. Opportunities for training and career advancement should be provided to IT professionals, particularly in environmental data analysis and management, to foster the commercial use and application of such data. Establishing and enforcing more stringent intellectual property laws are essential to safeguard data and technological innovations, thus stimulating further research and development. It is also vital to create inter-city collaborative platforms for sharing experiences and best practices, particularly in data sharing and environmental management strategies, to capitalize on the spatial spillover benefits of DFM. Lastly, developing and refining the regulatory frameworks and evaluation mechanisms for DFM’s implementation is crucial to ensuring DFM’s effectiveness in mitigating EP is consistently monitored and assessed.
5.3. Limitations and Future Research
This research is primarily based on data from specific regions or cultural contexts, which might limit the applicability of its conclusions to different geographic or cultural settings. Future studies could expand their scope to include cross-regional and cross-cultural research, to verify the applicability of DFM in diverse environments. The limited period of this study may not fully capture the long-term impact of DFM on EP; therefore, subsequent research could incorporate long-term longitudinal studies, to better understand DFM’s sustained and potential effects on EP. Future research could also focus on feedback mechanisms within policy and practical applications. It could provide deeper insights into optimizing DFM strategies to enhance environmental benefits. Such research would contribute to a more nuanced understanding of DFM’s role in urban environmental governance and its interplay with various economic, cultural, and policy factors.
6. Conclusions
Data are an important part of urban environmental governance. However, the specific impact of DFM on EP requires further investigation. This study utilizes the construction of big data trading platforms as a quasi-natural experiment, and conducts an empirical analysis of DFM’s impact on EP and its mechanisms. The key finding is that DFM has a significant effect on reducing EP. Cities implementing DFM experienced an average reduction in EP of 2.67% compared to those without DFM. DFM reduces EP through several pathways: promoting green innovation, enhancing public awareness of environmental issues, attracting information technology talent, optimizing industrial structures, and improving digital finance. The effectiveness of DFM in reducing EP varies among different types of cities. Larger, southern, and resource-based cities exhibit a more pronounced effect of DFM in reducing EP. Policies enhancing digital infrastructure and strengthening urban intellectual property protection augment DFM’s pollution-reducing effects. Additionally, DFM’s pollution-reducing effect demonstrates spatial spillover, meaning that the development of DFM in one city benefits its local environment and positively impacts surrounding cities.
Author Contributions
Conceptualization, H.L. and X.D.; methodology, X.-W.Y.; software, N.X.; validation, H.L. and X.D.; formal analysis, X.-W.Y.; investigation, H.L.; resources, H.L.; data curation, N.X.; writing—original draft preparation, X.D. and N.X.; visualization, X.-W.Y.; supervision, H.L.; project administration, H.L.; funding acquisition, N.X. All authors have read and agreed to the published version of the manuscript.
Funding
This research was funded by the Philosophy and Social Science Project of Henan Province, grant numbers 2021CJJ149.
Data Availability Statement
Data will be made available on request.
Acknowledgments
The authors are grateful for the support from Henan Normal University.
Conflicts of Interest
The authors declare no conflicts of interest.
References
- Feng, T.; Du, H.; Lin, Z.; Zuo, J. Spatial spillover effects of environmental regulations on air pollution: Evidence from urban agglomerations in China. J. Environ. Manag. 2020, 272, 110998. [Google Scholar] [CrossRef] [PubMed]
- Huang, X.; Meng, F. Digital finance mitigation of resource curse’ effect: Evidence from resource-based cities in China. Resour. Policy 2023, 83, 103711. [Google Scholar] [CrossRef]
- Guo, B.; Wang, Y.; Zhang, H.; Liang, C.; Feng, Y.; Hu, F. Impact of the digital economy on high-quality urban economic development: Evidence from Chinese cities. Econ. Model. 2023, 120, 106194. [Google Scholar] [CrossRef]
- Huang, L.; Zhang, H.; Si, H.; Wang, H. Can the digital economy promote urban green economic efficiency? Evidence from 273 cities in China. Ecol. Indic. 2023, 155, 110977. [Google Scholar] [CrossRef]
- Zhu, W.; Chen, J. The spatial analysis of digital economy and urban development: A case study in Hangzhou, China. Cities 2022, 123, 103563. [Google Scholar] [CrossRef]
- Xue, L.; Zhang, Q.; Zhang, X.; Li, C. Can Digital Transformation Promote Green Technology Innovation? Sustainability 2022, 14, 7497. [Google Scholar] [CrossRef]
- Xu, N.; Zhang, H.; Li, T.X.; Ling, X.; Shen, Q. How Big Data Affect Urban Low-Carbon Transformation—A Quasi-Natural Experiment from China. Int. J. Environ. Res. Public Health 2022, 19, 16351. [Google Scholar] [CrossRef]
- Tao, C.; Yi, M.; Wang, C. Coupling coordination analysis and Spatiotemporal heterogeneity between data elements and green development in China. Econ. Anal. Policy 2023, 77, 1–15. [Google Scholar] [CrossRef]
- Gao, D.; Yan, Z.; Zhou, X.; Mo, X. Smarter and Prosperous: Digital Transformation and Enterprise Performance. Systems 2023, 11, 329. [Google Scholar] [CrossRef]
- Perelet, R.A. Environmental issues in a digital economy. World New Econ. 2019, 12, 39–45. [Google Scholar] [CrossRef]
- Yousaf, Z.; Radulescu, M.; Sinisi, C.I.; Serbanescu, L.; Păunescu, L.M. Towards Sustainable Digital Innovation of SMEs from the Developing Countries in the Context of the Digital Economy and Frugal Environment. Sustainability 2021, 13, 5715. [Google Scholar] [CrossRef]
- He, Y.C.; Wang, W. Theoretical Explanation of Marketization of Data Elements. Contemp. Econ. Res. 2021, 33–44. [Google Scholar]
- Kong, Y.F.; Liu, J.X.; Zhao, Z.X. Research on Market-oriented Allocation of Data Elements: Connotation Deconstruction, Operation Mechanism and Practice Path. Economist 2021, 24–32. [Google Scholar] [CrossRef]
- Li, M.S.; Sun, X.H.; Sun, R. Factor Marketization, Structural Adjustment and Economic Efficiency. Manag. Rev. 2019, 31, 40–52. [Google Scholar]
- Xu, M.; Deng, C.; Liu, D.Y. Digital Economy Leading High-quality Economic Development: Mechanism and Prospect. Contemp. Econ. Manag. 2023, 45, 66–72. [Google Scholar]
- Xu, S.; Yang, C.; Huang, Z.; Failler, P. Interaction between digital economy and environmental pollution: New evidence from a spatial perspective. Int. J. Environ. Res. Public Health 2022, 19, 5074. [Google Scholar] [CrossRef]
- Zhang, X.; Zhong, J.; Wang, H. Does the Development of Digital Economy Affect Environmental Pollution? Sustainability 2023, 15, 9162. [Google Scholar] [CrossRef]
- Hoang, T.; Ky, N.M.; Thuong, N.T.N.; Nhan, H.Q.; Ngan, N.V.C. Artificial intelligence in pollution control and management: Status and future prospects. In Artificial Intelligence and Environmental Sustainability: Challenges and Solutions in the Era of Industry 4.0; Springer: Singapore, 2022; pp. 23–43. [Google Scholar]
- Ye, Z.; Yang, J.; Zhong, N.; Tu, X.; Jia, J.; Wang, J. Tackling environmental challenges in pollution controls using artificial intelligence: A review. Sci. Total Environ. 2020, 699, 134279. [Google Scholar] [CrossRef] [PubMed]
- Du, M.; Hou, Y.; Zhou, Q.; Ren, S. Going green in China: How does digital finance affect environmental pollution? Mechanism discussion and empirical test. Environ. Sci. Pollut. Res. 2022, 29, 89996–90010. [Google Scholar] [CrossRef]
- Tang, Y.; Zhang, X.; Lu, S.; Taghizadeh-Hesary, F. Digital finance and air pollution in China: Evolution characteristics, impact mechanism and regional differences. Resour. Policy 2023, 86, 104073. [Google Scholar] [CrossRef]
- Ren, S.; Hao, Y.; Wu, H. Digitalization and environment governance: Does internet development reduce environmental pollution? J. Environ. Plan. Manag. 2023, 66, 1533–1562. [Google Scholar] [CrossRef]
- Yang, X.; Wu, H.; Ren, S.; Ran, Q.; Zhang, J. Does the development of the internet contribute to air pollution control in China? Mechanism discussion and empirical test. Struct. Chang. Econ. Dyn. 2021, 56, 207–224. [Google Scholar] [CrossRef]
- Zhao, X.; Lu, S.; Yuan, S. How does the digitization of government environmental governance affect environmental pollution? Spatial and threshold effects. J. Clean. Prod. 2023, 415, 137670. [Google Scholar] [CrossRef]
- Hu, J. Synergistic effect of pollution reduction and carbon emission mitigation in the digital economy. J. Environ. Manag. 2023, 337, 117755. [Google Scholar] [CrossRef] [PubMed]
- Zhang, Y.; Ran, C. Effect of digital economy on air pollution in China? New evidence from the “National Big Data Comprehensive Pilot Area” policy. Econ. Anal. Policy 2023, 79, 986–1004. [Google Scholar] [CrossRef]
- Wu, D.; Xie, Y.; Lyu, S. Disentangling the complex impacts of urban digital transformation and environmental pollution: Evidence from smart city pilots in China. Sustain. Cities Soc. 2023, 88, 104266. [Google Scholar] [CrossRef]
- Zou, W.; Pan, M. Does the construction of network infrastructure reduce environmental pollution?—Evidence from a quasi-natural experiment in “Broadband China”. Environ. Sci. Pollut. Res. 2023, 30, 242–258. [Google Scholar] [CrossRef] [PubMed]
- Wang, H.; Fang, L.; Mao, H.; Chen, S. Can e-commerce alleviate agricultural non-point source pollution?—A quasi-natural experiment based on a China’s E-Commerce Demonstration City. Sci. Total Environ. 2022, 846, 157423. [Google Scholar] [CrossRef] [PubMed]
- Chen, Z.; Zheng, Q.; Wu, Z.S. The Practical Dilemma and Solutions of China’s Data Trading Platform Construction. Reform Renaiss. Rev. 2022, 76–87. [Google Scholar]
- Tao, Z.; Huang, W.D.; Wen, C.Q. The Inspiration and Prospect of the Typical Model of Market-Based Allocation of Data Element. Reform Econ. Syst. 2021, 37–42. [Google Scholar]
- Wang, D.; Liao, H.; Liu, A.; Li, D. Natural resource saving effects of data factor marketization: Implications for green recovery. Resour. Policy 2023, 85, 104019. [Google Scholar] [CrossRef]
- Liu, Y.J. Empowering Urban Green Innovation Development Through Data Factor Marketization: Empirical Evidence from Chinese Cities. Guizhou Soc. Sci. 2023, 124–133. [Google Scholar]
- Chen, Z.; Liang, M. How do external and internal factors drive green innovation practices under the influence of big data analytics capability: Evidence from China. J. Clean. Prod. 2023, 404, 136862. [Google Scholar] [CrossRef]
- Gao, Q.; Cheng, C.; Sun, G. Big data application, factor allocation, and green innovation in Chinese manufacturing enterprises. Technol. Forecast. Soc. Chang. 2023, 192, 122567. [Google Scholar] [CrossRef]
- Shen, Y.; Zhang, X. Intelligent manufacturing, green technological innovation and environmental pollution. J. Innov. Knowl. 2023, 8, 100384. [Google Scholar] [CrossRef]
- Song, Y.; Zhu, J.; Yue, Q.; Zhang, M.; Wang, L. Industrial agglomeration, technological innovation and air pollution: Empirical evidence from 277 prefecture-level cities in China. Struct. Chang. Econ. Dyn. 2023, 66, 240–252. [Google Scholar] [CrossRef]
- Cheng, J.; Liu, Y. The effects of public attention on the environmental performance of high-polluting firms: Based on big data from web search in China. J. Clean. Prod. 2018, 186, 335–341. [Google Scholar] [CrossRef]
- Liu, M.; Luo, X.; Lu, W. Public perceptions of environmental, social, and governance (ESG) based on social media data: Evidence from China. J. Clean. Prod. 2023, 387, 135840. [Google Scholar] [CrossRef]
- Wei, Y.; Gong, P.; Zhang, J.; Wang, L. Exploring public opinions on climate change policy in” Big Data Era”—A case study of the European Union Emission Trading System (EU-ETS) based on Twitter. Energy Policy 2021, 158, 112559. [Google Scholar] [CrossRef]
- Zhou, B.; Ding, H. How public attention drives corporate environmental protection: Effects and channels. Technol. Forecast. Soc. Chang. 2023, 191, 122486. [Google Scholar] [CrossRef]
- Lu, J.; Xiao, Q.; Wang, T. Does the digital economy generate a gender dividend for female employment? Evidence from China. Telecommun. Policy 2023, 47, 102545. [Google Scholar] [CrossRef]
- Huaping, G.; Binhua, G. Digital economy and demand structure of skilled talents—Analysis based on the perspective of vertical technological innovation. Telemat. Inform. Rep. 2022, 7, 100010. [Google Scholar] [CrossRef]
- Marchesani, F.; Masciarelli, F.; Bikfalvi, A. Smart city as a hub for talent and innovative companies: Exploring the (dis) advantages of digital technology implementation in cities. Technol. Forecast. Soc. Chang. 2023, 193, 122636. [Google Scholar] [CrossRef]
- Zhu, Q.; Wu, J.; Li, X.; Xiong, B. China’s regional natural resource allocation and utilization: A DEA-based approach in a big data environment. J. Clean. Prod. 2017, 142, 809–818. [Google Scholar] [CrossRef]
- Hu, B.; Wang, Y.Y. Network Infrastructure Construction, Industrial Co-agglomeration, and Urban Industrial Upgrading: Based on the Elements of “People” and “Land”. J. Financ. Econ. 2023, 49, 95–109. [Google Scholar]
- Xu, X.; Zhao, M.F.; Li, T.; Li, S.Z. Data Factor and Enterprise Innovation: The Perspective of R&D Competition. Econ. Res. J. 2023, 58, 39–56. [Google Scholar]
- Bai, T.; Qi, Y.; Li, Z.; Xu, D. Digital economy, industrial transformation and upgrading, and spatial transfer of carbon emissions: The paths for low-carbon transformation of Chinese cities. J. Environ. Manag. 2023, 344, 118528. [Google Scholar] [CrossRef]
- Chang, H.; Ding, Q.; Zhao, W.; Hou, N.; Liu, W. The digital economy, industrial structure upgrading, and carbon emission intensity—Empirical evidence from China’s provinces. Energy Strategy Rev. 2023, 50, 101218. [Google Scholar] [CrossRef]
- Shi, T.; Zhang, W.; Zhou, Q.; Wang, K. Industrial structure, urban governance and haze pollution: Spatiotemporal evidence from China. Sci. Total Environ. 2020, 742, 139228. [Google Scholar] [CrossRef]
- Fang, J.C.; Liu, Y.; Gao, H.Y.; Dong, J.C.; Lu, B.F. Does Public Data Access Promote Regional Harmonious Development? On a Quasi-natural Experiment of Government Data Platform Access. J. Manag. World 2023, 39, 124–142. [Google Scholar]
- Xie, Q.; Ma, D.; Raza, M.Y.; Tang, S.; Bai, D. Toward carbon peaking and neutralization: The heterogeneous stochastic convergence of CO2 emissions and the role of digital inclusive finance. Energy Econ. 2023, 125, 106841. [Google Scholar] [CrossRef]
- Yu, Y.; Li, K.; Duan, S.; Song, C. Economic growth and environmental pollution in China: New evidence from government work reports. Energy Econ. 2023, 124, 106803. [Google Scholar] [CrossRef]
- Zhang, M.; Yang, Y.; Du, P.; Wang, J.; Wei, Y.; Qin, J.; Yu, L. The effect of public environmental participation on pollution governance in China: The mediating role of local governments’ environmental attention. Environ. Impact Assess. Rev. 2024, 104, 107345. [Google Scholar] [CrossRef]
- Xu, N.; Zhao, D.; Zhang, W.; Zhang, H.; Chen, W.; Ji, M.; Liu, M. Innovation-Driven Development and Urban Land Low-Carbon Use Efficiency: A Policy Assessment from China. Land 2022, 11, 1634. [Google Scholar] [CrossRef]
- Chen, T.; Duan, Y.Q.; Wu, J.; Aaker, D.A. Can the Marketization of Data Elements Improve Urban Innovation? Evidence from A Quasi-natural Experiment. Sci. Technol. Prog. Policy 2023, 1–10. [Google Scholar]
- Xie, D.X.; Wei, W.S.; Li, Y.; Zhu, X.W. Data Allocation, Credit Market Competition and Welfare Analysis. China Ind. Econ. 2022, 25–43. [Google Scholar] [CrossRef]
- Lv, K.; Pan, M.; Huang, L.; Song, D.; Qian, X. Can intellectual property rights protection reduce air pollution? A quasi-natural experiment from China. Struct. Chang. Econ. Dyn. 2023, 65, 210–222. [Google Scholar] [CrossRef]
- Zhao, H.; Chen, S.; Zhang, W. Does digital inclusive finance affect urban carbon emission intensity: Evidence from 285 cities in China. Cities 2023, 142, 104552. [Google Scholar] [CrossRef]
- Baker, A.C.; Larcker, D.F.; Wang, C.C. How much should we trust staggered difference-in-differences estimates? J. Financ. Econ. 2022, 144, 370–395. [Google Scholar] [CrossRef]
- Cheng, Y.; Xu, Z. Fiscal centralization and urban industrial pollution emissions reduction: Evidence from the vertical reform of environmental administrations in China. J. Environ. Manag. 2023, 347, 119212. [Google Scholar] [CrossRef]
- Guo, K.; Cao, Y.; Wang, Z.; Li, Z. Urban and industrial environmental pollution control in China: An analysis of capital input, efficiency and influencing factors. J. Environ. Manag. 2022, 316, 115198. [Google Scholar] [CrossRef] [PubMed]
- Ren, S.; Li, X.; Yuan, B.; Li, D.; Chen, X. The effects of three types of environmental regulation on eco-efficiency: A cross-region analysis in China. J. Clean. Prod. 2018, 173, 245–255. [Google Scholar] [CrossRef]
Disclaimer/Publisher’s Note: The statements, opinions and data contained in all publications are solely those of the individual author(s) and contributor(s) and not of MDPI and/or the editor(s). MDPI and/or the editor(s) disclaim responsibility for any injury to people or property resulting from any ideas, methods, instructions or products referred to in the content. |
© 2024 by the authors. Licensee MDPI, Basel, Switzerland. This article is an open access article distributed under the terms and conditions of the Creative Commons Attribution (CC BY) license (https://creativecommons.org/licenses/by/4.0/).