Article

Exploration or Exploitation? Corporate Green Innovation Strategy for Carbon Emission Reduction-Evidence from Pilot Enterprises in China

Department of Business Administration, School of Business, East China University of Science and Technology, Shanghai 200237, China
*
Author to whom correspondence should be addressed.
Sustainability 2024, 16(11), 4486; https://doi.org/10.3390/su16114486
Submission received: 25 April 2024 / Revised: 16 May 2024 / Accepted: 23 May 2024 / Published: 25 May 2024

Abstract

:
Green innovation has become a key strategy for reducing emissions. However, existing research mainly examines this phenomenon through the resource and institutional perspectives, often ignoring the changes in corporate green innovation behavior under industry peer pressure. Therefore, this study draws on the policy framework of China’s carbon trading pilot and uses a multi-period difference-in-difference (DID) fixed effects model to explore how carbon trading shapes enterprises’ green innovation strategies. The survey used data from pilot enterprises from 2008 to 2019 and found that carbon trading policies are conducive to green innovation, and both exploratory green innovation and exploitative green innovation have been reflected. It is worth noting that under the influence of peer pressure, this positive effect is more prominent in exploratory green innovation. Furthermore, it was found that firms facing carbon pressure can skillfully find an equilibrium between exploratory green innovation and exploitative green innovation. The research results demonstrate the green innovation strategies and trade-offs of Chinese enterprises facing the impact of carbon trading policies, with the hope that the research conclusions will have certain theoretical reference significance for future corporate green transformation and increased investment in green innovation.

1. Introduction

To cope with global warming, controlling carbon dioxide emissions has become urgent. Currently, measures to control carbon emissions are divided into government-commanded, market-incentivized, and voluntary [1]. However, due to the obvious social externality of this behavior, the enthusiasm of enterprises is not high. Therefore, the market incentive type has gradually become an important way [2], i.e., the government takes the lead in controlling the regional carbon emission balance by decentralizing carbon emission quotas to enterprises and commercializing them in the market [3]. The success of the European Union’s carbon trading market provides a practical reference for Chinese enterprises to explore the path of low-carbon development.
Then how can enterprises, as the main body of carbon trading, fulfill their carbon emission commitments? Green innovation becomes an important way [4,5,6]. For the relationship between carbon trading and enterprise green innovation, some scholars take Chinese state-owned enterprises as samples and present a structural equation model, pointing out that there is a cost-following effect of carbon trading [7], i.e., enterprises increase the cost of pollution management by updating equipment, introducing technologies, reducing production, etc., which is not favorable to enterprise green innovation; some scholars also use the difference-in-differences method, pointing out that carbon trading has a crowding-out effect on innovation investment, which inhibits enterprise green innovation [8,9]. However, some scholars hold different views on this. Some studies use the spatial Durbin model to study the impact of green innovation on the region and surrounding areas, and propose that moderate environmental regulation can stimulate the green innovation ability of enterprises, i.e., through the optimization of processes and technological upgrading to offset the cost of compliance brought by the environmental governance. Also, some studies construct the logic chain of “environmental regulation–green innovation intention–green innovation behavior” and conclude that green innovation has an industrial agglomeration effect. There are even scholars who use the panel data and adopt the difference-in-difference (DDD) model, which concludes that carbon trading has a positive effect on the quality and quantity of innovation and so on [10,11,12]. It can be seen that the relationship between carbon trading and enterprise green innovation is complicated. Reviewing the previous studies, there are both administrative-based and market-based environmental regulations; both regional- and industry-level studies; and both spatial econometric modeling and panel data analyses, and the diversity of research topics and methodologies has confused the research conclusions. Based on this, this paper mainly focuses on the policy research of carbon trading on enterprises’ green innovation, and at the same time considers whether enterprises’ green innovation behavior is biased in the face of the impact of carbon trading.
The peer pressure effect suggests that firms will tend to adopt similar innovative activities with other firms to reduce the uncertainty and riskiness caused by individual uniqueness in the external environment [13]. With the improvement in China’s carbon trading market, more and more enterprises are included in the list of carbon trading; will there also be a peer pressure effect of green innovation among enterprises in different regions? Especially when the pilot enterprises are threatened by other competitors in the limited market environment, and the enterprises are in a constant innovation race to catch up with each other, will this learning–improvement–relearning pressure invariably affect the enterprises’ green innovation decisions? This paper argues that considering the impact of the peer group pressure on firms’ innovation decisions brought about by carbon trading policies can help to understand the innovation incentive role and effects of carbon markets more comprehensively.
The research goal of this article is to deepen the understanding of the impact of carbon trading on firms’ green innovation, especially to explore the role and effect of carbon trading on incentivizing green dual innovation. Therefore, to achieve this goal, the article proposes two specific research directions: refining the concept of green innovation and focusing on the impact of peer pressure on corporate green innovation.
The main research contributions of this paper include the following: First, it deepens the understanding of the impact of carbon trading on dual green innovation. Although existing studies have analyzed the impact of carbon trading policy on corporate decision-making [14] and clarified the incentive role of carbon trading policy in green innovation [15,16], they have not deeply explored the impact of different types of green innovation and its equilibrium. Therefore, this study refines the concept of green innovation, divides it into exploratory green innovation and exploitative green innovation, and investigates the impact of carbon trading on dual green innovation and its equilibrium, thus enriching the theoretical literature in this field. Second, existing studies on the relationship between carbon trading and innovation mainly focus on the resource perspective and stakeholder perspective [17,18], and rarely consider the impact of competitive pressure in the same industry. Trading policy as a market incentive mechanism, the participating subjects will unintentionally generate competitive pressure to reduce carbon emissions, which will affect the innovation decisions of firms. Therefore, it is of great research significance to understand the impact of peer pressure on green innovation in the industry, which can help to better understand the incentives and effects of innovation in the carbon trading market, and thus promote the development of the carbon trading market.

2. Theoretical Analysis and Hypothesis Formulation

2.1. Carbon Trading and Green Innovation

Green innovation is to improve or reduce environmental damage by optimizing production, manufacturing, and other links or the entire manufacturing process [19]. However, the relationship between carbon trading policies and green innovation is not clear at present. Some studies have pointed out that carbon trading policies internalize the cost of environmental pollution and increase corporate compliance costs [7]. Therefore, to obtain the legitimacy of carbon emissions, some companies would rather cut production and upgrade technology than invest in green innovation [8,9,20]. This is very common among non-state-owned enterprises and small-scale enterprises and is affected by factors such as corporate cash flow, future profitability, government subsidies, and supervision [21,22]. Also, some scholars argue that carbon trading may impose significant environmental governance pressure on pilot enterprises, potentially leading to resource misallocation and flow to the process innovation with terminal governance, thus crowding out the investment in green innovation [23,24,25,26], contributing to the cautious approach toward green innovation among Chinese enterprises. Coupled with the low level of technological innovation of Chinese enterprises [27], the uncertainty and risks of green innovation will force pilot enterprises to increase operating costs, so they are more cautious about green innovation. But Coase pointed out that as long as property rights are clear, market transactions can automatically achieve the optimal state of resource allocation and solve the problem of negative externalities. Therefore, scholars have proposed the “innovation offsets” effect to offset the cost of environmental compliance through “innovation offsets” to achieve a win–win situation for environmental protection and efficiency [28]. This coincides with the “Porter hypothesis”.
Firstly, carbon trading has a cost-forcing effect [28]. The government allocates carbon emission credits to pilot enterprises, and pilot enterprises can freely buy and sell carbon emission credits in the carbon trading market [29]. This uses the price mechanism to internalize the external cost of environmental pollution [11,30]; that is, when a company exceeds its emission quota, it needs to make additional purchases. However, China’s carbon trading market is still in its preliminary stage [3], and market prices are highly volatile. This part of the funds is additional expenditure for enterprises [31]. In order to maintain profits, enterprises can only transfer environmental costs to consumers, resulting in an increase in product prices and a decrease in market competitiveness. Forced by the requirements of profitability, enterprises are more likely to increase investment in green innovation to fundamentally meet environmental compliance requirements.
Secondly, there is the incentive effect of innovation. Carbon trading encourages companies to sell additional carbon emission shares. The more remaining credits, the higher the additional benefits. This incentive policy encourages enterprises to increase investment in green innovation and continuously optimize production processes with the help of clean technology or energy-saving equipment [32], allowing enterprises to not only reduce carbon emissions but also obtain additional carbon benefits [1].
Finally, there is the signaling role. Enterprises participating in carbon trading show the public and investors a social image of actively participating in environmental governance. To increase consumer trust and loyalty [33,34,35], pilot enterprises will pay better attention to consumers’ green needs and increase green investment. Therefore, based on the above analysis, the following hypothesis is put forward:
H1. 
Carbon trading policies promote green innovation among enterprises.

2.2. Exploratory Green Innovation and Exploitative Green Innovation

According to the ambidextrous innovation theory, scholars define it as exploratory innovation and exploitative innovation [36,37]. Among them, exploratory innovation emphasizes the complete transformation of technology, aiming to develop new products, new technologies, and new markets, while exploitative innovation emphasizes small and incremental innovation, that is, upgrading and reengineering based on original product technology. It can be seen that exploratory innovation requires companies to bear great uncertainty and invest a lot of money in research and development to achieve disruptive changes. On the contrary, exploitative innovation optimizes and upgrades based on original products or services, with less risk and immediate returns. It is more similar to design-based or process innovation and can quickly obtain short-term results [38,39,40].
In the short term, the impact of the implementation of carbon trading policies on pilot companies is not only reflected in the increase in environmental governance pressure and adjustments in resource allocation but also the changes in the green innovation direction preferences of corporate managers. First, the pressure on environmental governance has increased. The implementation of carbon trading policies has caused enterprises to face more stringent environmental regulatory requirements and policy cost pressures [31]. Pilot companies are forced by environmental regulatory requirements and must take measures to reduce carbon emissions as soon as possible to avoid regulatory penalties, which adds tremendous pressure to corporate managers [11,41]. Secondly, there is resource allocation adjustments. To meet the requirements for controlling carbon emissions as soon as possible, managers of pilot enterprises may adjust the allocation strategy of productive resources. More resources may be invested in exploitative green innovation focusing on end-of-pipe governance [37] to achieve the goals of rapidly reducing pollution emissions and improving energy efficiency. Finally, the preference for green innovation direction changes. Due to tight time and huge pressure, managers are more inclined to choose exploitative green innovation solutions that are relatively mature and easy to implement, such as waste treatment, energy conservation, and technological improvement. Therefore, based on the above analysis, the following hypothesis is put forward:
H2a. 
Carbon trading policies promote firms’ exploitative green innovation.
Although companies may pursue exploitative green innovation in response to environmental regulatory requirements, this is not a long-term solution. In the long term, it is inevitable for the Chinese government to build a carbon trading market to achieve its goals of “carbon neutrality and carbon peaking.” Therefore, for enterprises, only by establishing green technology advantages as soon as possible can they stabilize their position in the future carbon market. First of all, although exploratory innovation requires a large investment in scientific research funds in the early stage and is highly uncertain and risky, it is more innovative. This is because it requires enterprises to break through the existing knowledge base and create new green technologies, and this innovativeness can bring competitive advantages to enterprises [37,42]. Secondly, as environmental issues become more and more important, consumer demand for green products and services is also increasing [34,35]. Consumers will be pursuing environmental protection, sustainability, and social responsibility, which also puts forward new requirements for the green development of enterprises. Therefore, in the fierce market competition, companies have to carry out green innovation with technical barriers to ensure their long-term competitiveness in the market. Finally, the carbon trading policy has an innovation incentive effect [32] and promotes companies to sell remaining carbon emission credits. Obtaining unexpected income from selling remaining carbon emission credits will, to a certain extent, stimulate the enthusiasm of enterprises for green innovation and make corporate management more likely to develop green innovation with technical barriers. Therefore, based on this, the following hypothesis is put forward:
H2b. 
Carbon trading policies promote firms’ exploratory green innovation.
It is worth mentioning that enterprises need to pay attention to the equilibrium between exploratory and exploitative innovation during the green innovation investment process [36,43,44]. This is because an excessive pursuit of exploration will lead to a waste of resources and low utilization efficiency; an excessive pursuit of utilization will lead to short-sightedness and inertia of the organization, causing the enterprise to lose its growth vitality [45]. Therefore, it is extremely important to pursue an equilibrium between the two innovations. In this way, enterprises can reduce the uncertainty of investment projects and avoid risks; at the same time, it can alleviate the preemption of idle resources by different types of innovation to ensure that enterprise resources are fully utilized and form a competitive advantage [44,46]. In particular, when companies face the impact of carbon trading policies, whether companies develop new carbon emission reduction technologies, add carbon emission reduction functions based on existing technologies, or carry out both requires further discussion. Therefore, based on this, the following hypothesis is put forward:
H3. 
Under the pressure of carbon trading, enterprises maintain a relative balance between exploratory green innovation and utilization-oriented green innovation.

2.3. Peer Pressure and Green Innovation

The traditional strategic perspective believes that an enterprise’s competitive advantage is durable [47], but the dynamic competition theory believes that its advantages are short-lived and changing. To maintain competitive advantages among enterprises, it is not limited to simple imitation, but also the process of continuous optimization and innovation [48]. This is similar to the Red Queen theory [49] proposed by Barnett and Hansen, which emphasizes the co-evolution between organizations; that is, organizations must constantly compete and learn to achieve the survival of the fittest. In other words, enterprises do not exist alone. In the market competition environment, the reciprocal interaction between enterprises determines their survival status [50,51]. Therefore, when the target enterprise is subject to peer pressure from competitors, the enterprise will continuously improve its survivability through search learning. At the same time, it will react to competitors, causing optimization learning among competitors to form a virtuous cycle [13]. From an individual perspective, when the target company ignores peer pressure from competitors or fails to respond on time, the company’s viability will be significantly reduced, eventually leading to the company being eliminated [52].
The same applies to the impact of carbon trading policies on corporate green innovation. In a market with limited resources, pilot firms in the same industry will pay close attention to the behavioral decisions of other competitors to make quick strategic responses and maintain their market position to maintain their competitive advantage [52,53]. However, most of the existing studies believe that carbon trading policies have a certain bias on the impact of corporate green innovation [17]. However, according to the concept of synergistic organizational evolution, in this competitive relationship, every successful enterprise is continuously learning to improve organizational viability [13]. Therefore, when the target firm chooses to avoid or abandon its innovation strategy, it will soon be forced out of the market by the pressure from competitors. Similarly, when enterprises are subjected to the external shock of carbon trading policy, their behavioral decisions will be influenced by peer pressure from other enterprises in the same industry [50,54]. To capture the market and build defense barriers, these pilot enterprises will actively participate in the innovation race, when the enterprises may not only stick to the short-term benefits of low-quality innovations such as process modification but also focus on exploratory green innovations, to form green technological barriers against the threat of competitors, so based on the above analysis, the following hypothesis is proposed:
H4. 
Peer pressure plays a positive moderating role between carbon trading and green innovation.

3. Methodology of Research

3.1. Sample Selection

Carbon trading policy provides a good natural experimental background for studying the differences in corporate green innovation. The Chinese government has carried out carbon trading pilot programs in eight provinces and cities, including Beijing, Shanghai, Tianjin, Chongqing, Hubei, Guangdong, and Shenzhen, since 2011. Based on the data availability of listed companies, first, this paper organizes the data of all listed companies in the pilot region from 2008 to 2019. Second, the enterprises participating in carbon trading are identified, and the data of these enterprises come from the relevant pilot lists published by each government. Finally, the missing data are obtained by consulting relevant information to supplement.
The relevant variables are from the CSMAR database. Among them, the green patent data are from the website of the State Intellectual Property Office (SIPO). At the same time, according to the “Green List of International Patent Classification” introduced by the World Intellectual Property Organization (WIPO) in 2010, the patent classification number is used to determine whether the patents applied by listed companies belong to green patents [55]. Finally, Stata/MP 14.0 software was used to process and statistically analyze the data as follows: (1) deleting the residual data; (2) excluding the data of financial and insurance industries; (3) Winsorizing the data to reduce the influence of extreme values. Finally, the data from 264 pilot enterprises were obtained.

3.2. Definition of Variables

Green innovation: The mainstream research methods mostly use the number of patent applications as a measure of green innovation [56]. Therefore, this paper firstly recognizes the level of green patents based on the classification number of patents according to WIPO’s definition of green patents. Secondly, for the classification of exploratory and exploitative innovations, it is usually considered that the technological impact is in the period of 5 years [57]. Therefore, drawing on the method of other scholars to take the first four digits of the IPC classification number of the patent as a guideline, assuming that the patent classification number of the patent applied by the enterprise in the current year was repeated in the period of the previous five years, then it is defined as exploitative innovation, or else it is defined as exploratory innovation [58,59]. In addition, drawing on other scholars’ studies [60], exploratory green innovation is multiplied by exploitative innovation to measure the innovation equilibrium indicator.
Peer pressure: Peer pressure among enterprises is affected by the intensity of industry competition [60]. This article refers to previous research and uses the Lerner index to mitigate the corresponding competitive intensity [61].
Control variables: Referring to previous studies [11], firm size, capital structure, equity concentration, years of operation, and growth capacity are included. The following is in general terms: (1) Firm Size—the larger the firm’s asset size, the stronger its economic strength, and the more capital it has to engage in green innovation activities; (2) Liability—the higher the firm’s debt-to-asset ratios, the more it hinders the firm from investing in green innovation; (3) Firm Age—the longer the firm has been established, the higher the firm’s own ability to control its innovation risks; (4) Growth Ability—the higher the growth ability, the faster the asset accumulation speed and the stronger the risk resistance ability; (5) Nature of Equity—with a different nature of equity, corporate innovation decisions have differences; (6) Equity Concentration—this involves using the proportion of shares held by the first largest shareholder; (7) Percentage of Independent Directors—independent directors can provide reasonable advice for corporate innovation decisions; (8) Capital Intensity—this represents the enterprise risk level and cost of capital, which affects the enterprise’s green innovation investment; (9) Profitability—the larger the value, the stronger the profitability, and the more conducive to the enterprise to increase green innovation investment; (10) Board Activity—the number of board of directors’ meetings is taken as a logarithmic number. At the same time, to reduce the impact of industry and the economic cycle on corporate green innovation, the industry and year of the enterprise control the specific description of Table 1.

3.3. Design of the Model

The difference-in-differences (DID) method is commonly used to estimate the causal effect of a treatment or policy intervention. This is because the DID method can effectively control time invariance and unobserved heterogeneity, which can reduce the endogeneity of the results. Therefore, this method is used in this paper to analyze the impact of carbon trading on corporate green innovation [62]. First, refer to Hu et al. (2020) and other scholars’ studies to set up the treatment and control groups: the treatment group is set as the pilot enterprises in the eight carbon pilot regions, defining Treati = 1, while the non-pilot enterprises in the pilot regions are set as the control group, with Treati = 0.
In addition, it is necessary to consider that carbon trading will not have much impact on the control group sample and to ensure that the treatment group and the control group have as many similar characteristics as possible. Therefore, to reduce the bias caused by sample selection, this article first conducts Propensity Score Matching (PSM) on the data year by year and uses the matched samples for empirical evidence. Finally, 120 pilot enterprises were selected as the treatment group and 144 non-pilot enterprises were selected as the control group.
Second, determine the implementation time of carbon trading policy in each region. Due to the different policy unfolding times in each pilot region, referring to other and other scholars’ research, set the launch time of the pilot carbon market in Beijing, Shanghai, Shenzhen, Guangdong, and Tianjin to be 2013, and when the enterprises are in these five cities and in 2013 and later, Time = 1. The start of the pilot carbon market in Hubei and Chongqing is in 2014, and when the enterprises are in these two cities and in 2014 and later, Time = 1, while the start of the carbon market in Fujian is in 2016, and when the enterprises are in the region and in 2016 and later, Time = 1; other than that, Time = 0. Finally, based on the above settings, the model is constructed:
I n n o v a t i o n i t = α 0 + α 1 T i m e i t × T r e a t i + α i C o n t r o l i t + i + γ t + ϵ i t
where
Innovationit represents the green innovation strategy of firm i in year t, Innovationit includes exploratory innovation and exploitative innovation, Timeit × Treati is a multi-period difference variable, Timeit represents the time of policy implementation, Treati is the treatment variable, Controlit represents the control variable, γ t represents the year fixed effect, and i represents the individual fixed effect. Model (1) tests the impact of carbon trading on corporate green innovation.

4. Data Analysis

4.1. Descriptive Statistics

The descriptive statistics of each variable are shown in Table 2: among them, the mean value of innovation is 0.264, the maximum value is 3.807, the mean value of exploratory innovation is 0.119, and the mean value of exploitative innovation is 0.237, which indicates that the overall level of green innovation technology of enterprises in the pilot region is not high. Enterprises are more inclined to exploitative green innovation and pay less attention to exploratory green innovation, which still has more room for improvement.
The mean value of peer pressure is 0.026 and the standard deviation is only 0.053, which shows that the peer pressure suffered by the enterprises is basically equal. For other variables, 56.8% of the pilot firms are state-owned enterprise samples, with an average debt-to-asset ratio as high as 45.9%, a mean asset growth rate of 18.2%, and a net asset profit of only 3.7%. In addition, the proportion of shares held by the first largest shareholder is 36.7%, and the proportion of independent directors is 38.3%, with a small overall standard deviation, suggesting that there is not much difference between the pilot firms.

4.2. Correlation Analysis of Key Variables

Table 3 presents the results of the Pearson correlation analysis. Notably, the correlation coefficients of all variables, excluding the green innovation indicators, are below 0.4, indicating a weak covariance between these variables. Of particular interest is the positive influence of peer pressure on corporate green innovation, as evidenced in both exploitative and exploratory innovation. However, it is essential to acknowledge the inherent limitations of a correlation analysis, necessitating further validation and robustness checks to substantiate these findings.

4.3. Benchmark Regression

Columns (1)–(3) of Table 4 show the impact of carbon trading policy on pilot enterprises’ green innovation strategy and dual innovation based on the inclusion of control variables with firm and year fixed effect controls, respectively. As shown in Table 4, column (1), the coefficients of the multi-period difference variables are significantly positive at the 1% level, indicating that China’s carbon trading policy has a positive impact on pilot enterprises’ green innovation, which is consistent with Hypothesis 1.
In order to further study the impact on the dual innovation of enterprises, we continue to regress the exploratory green innovation and exploitative green innovation separately on this basis, and the specific results are shown in columns (2) and (3). The coefficient of exploitative green innovation is 0.152, which is significantly positively correlated at the 1% level; the coefficient of exploratory green innovation is significantly positively correlated only at the 10% level. It indicates that carbon trading promotes enterprises’ green innovation, but in a short period, to accomplish the effect of carbon emission reduction and avoid regulatory penalties, enterprises pay more attention to exploitative green innovation compared with exploratory green innovation, which is basically consistent with Hypotheses H2a and H2b.
Next, based on model (1), we examine how the carbon trading policy affects the equilibrium between exploratory green innovation and exploitative green innovation in enterprises. The empirical results are shown in column (7) of Table 4. The results show that the regression coefficient is 0.141 and is significant at the 5% level. It shows that carbon trading has a significant promoting effect on enterprises to balance exploratory green innovation and exploitative green innovation. That is to say, companies facing the impact of carbon trading policies need to take into account both short-term and long-term innovation and development, not only to quickly fulfill the commitment of emission control and reduction but also to establish a competitive advantage for future green development. Therefore, managers are encouraged to focus on both exploratory green innovation and exploitative green innovation and to pay more attention to both types of innovations.
In addition, this article uses the Variance Inflation Factor (VIF) to test whether the model has multicollinearity problems. The final result of VIF is 1.95, which is much smaller than 10, so there is no multicollinearity problem (results are limited to space and not shown).

4.4. Moderating Effects Test

To further verify the role of peer pressure in the relationship between carbon trading and corporate green innovation, based on model (1), the following regression model is constructed to verify the moderating effect of the peer effect:
I n n o v a t i o n i t = β 0 + β 1 T i m e i t × T r e a t i + β 2 P r e s s u r e i + β 3 T i m e i t × T r e a t i × P r e s s u r e i + β i C o n t r o l i t + i + γ t + ϵ i t
Among them, Innovationit represents the green innovation strategy of enterprise i in year t, Innovationit includes exploratory innovation and exploitative innovation, i represents the enterprise, t represents the year, T i m e i t × T r e a t i is the intersection of time variables and treatment variables, Controlit represents the control variable, and γt represents year fixed effects and i represents individual fixed effects. The regression results are shown in Table 4.
In Table 4, columns (4)–(6) test the impact of carbon trading policy on firms’ green innovation and dual green innovation under peer pressure. According to the empirical results, it can be seen that the coefficients of the cohort pressure cross-terms are all positive. Among them, exploratory green innovation is significant at a 5% level, but the coefficients of green innovation and exploitative green innovation are not significant. It indicates that under the pressure of peer group effects, carbon trading policy plays a significant positive role in the exploratory green innovation of enterprises, but has little effect on the exploitative green innovation and overall green innovation of enterprises, which is basically consistent with hypothesis H4.

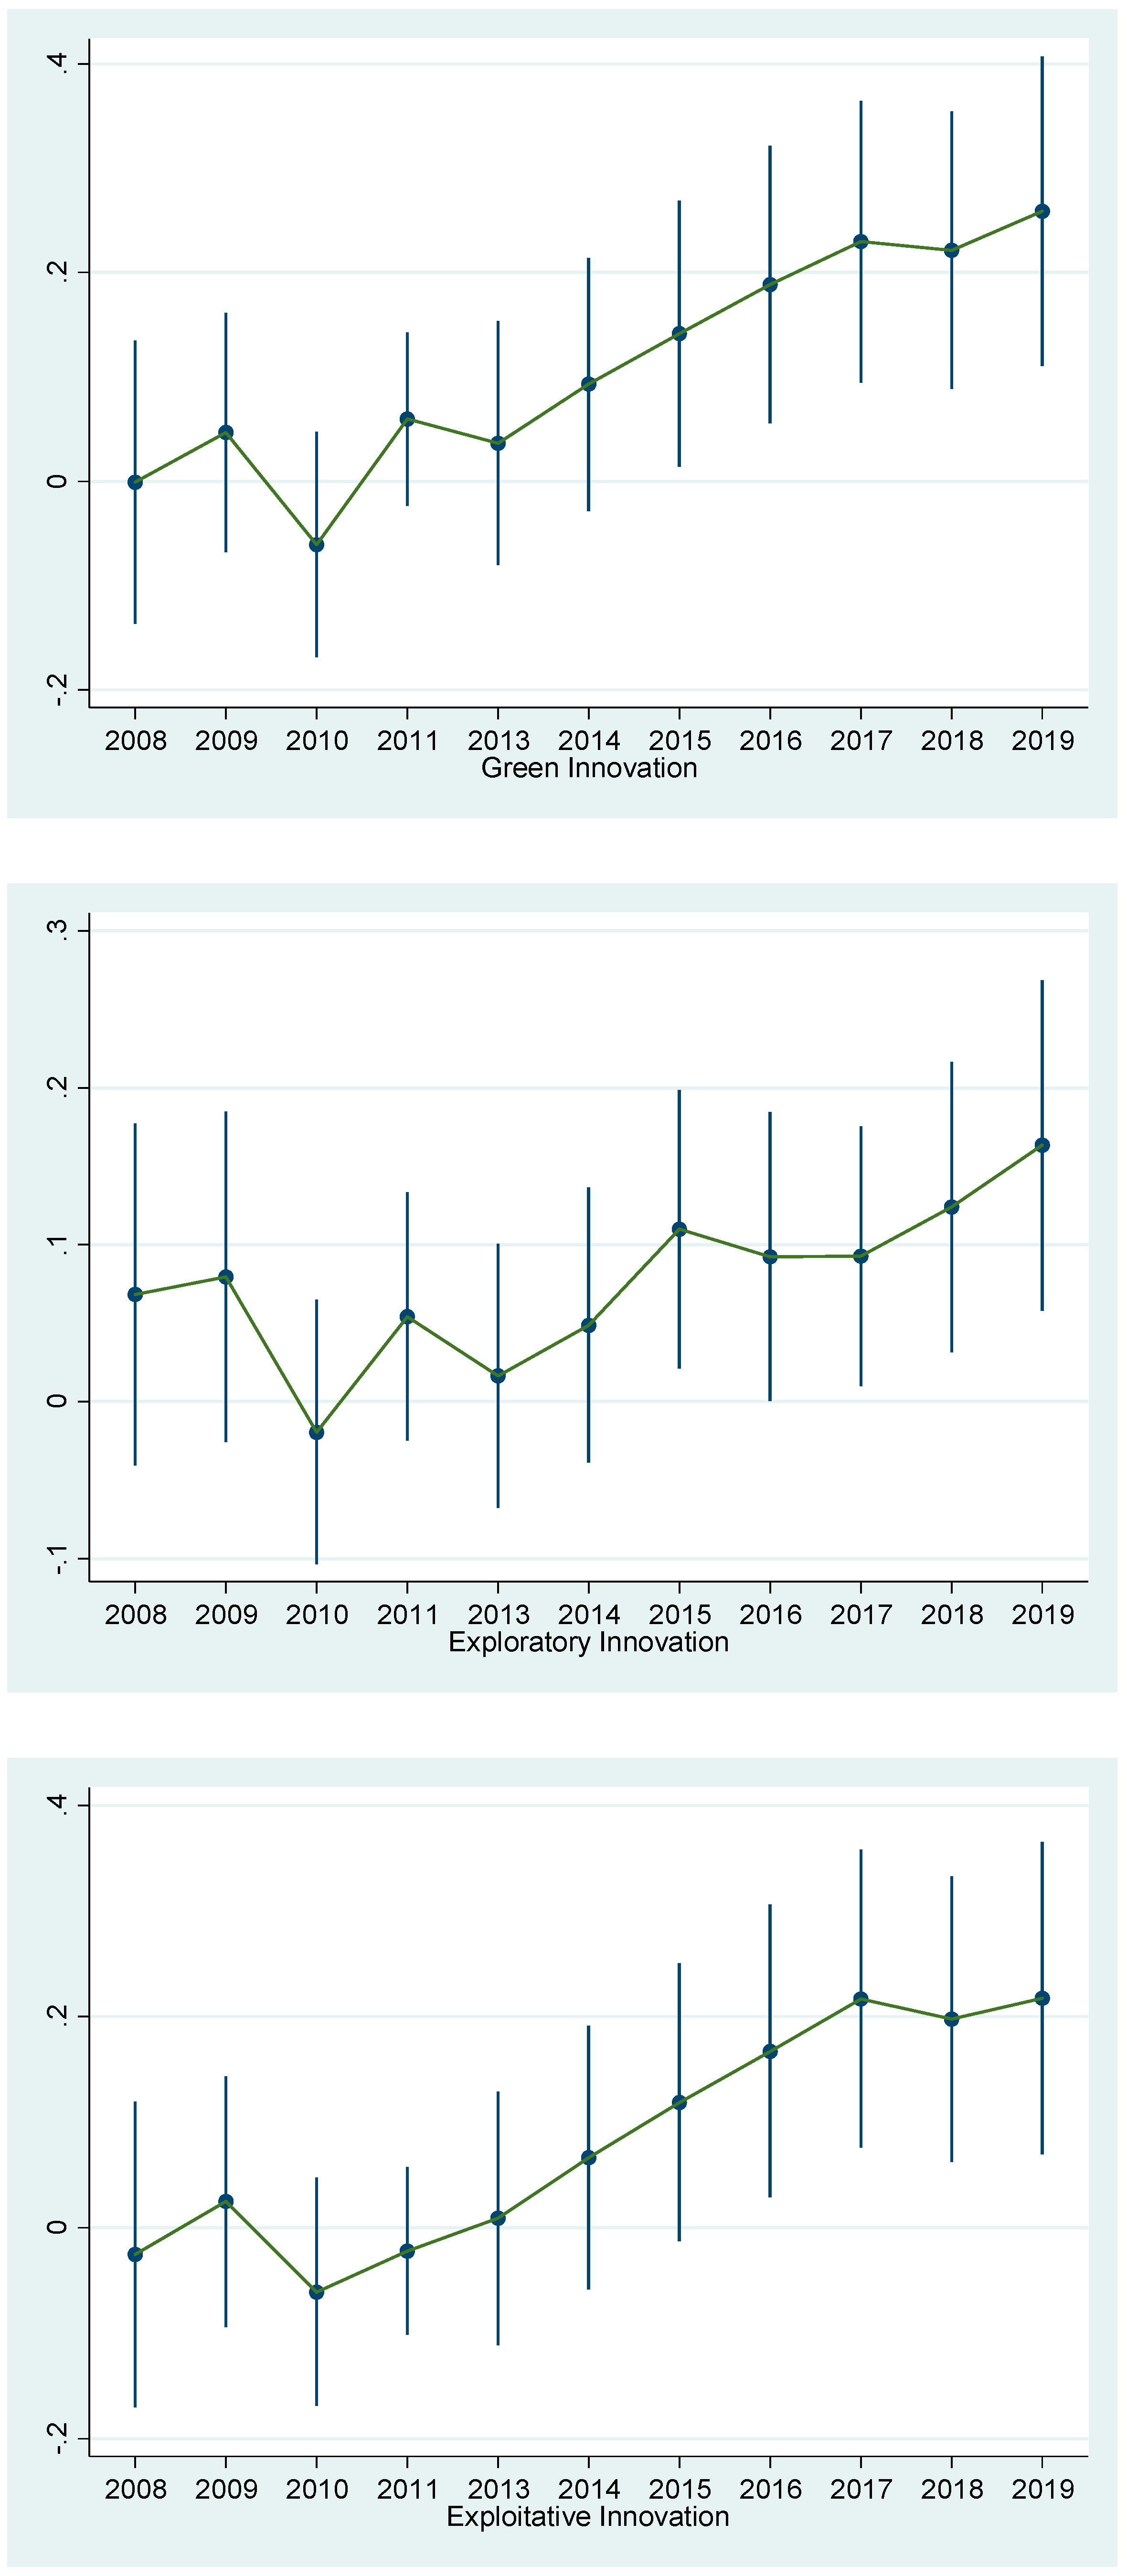
4.5. Tests for Parallel Trends and Dynamic Effects

The basic requirement of multi-period DID as an effective means of policy evaluation is that the experimental and control groups satisfy the parallel trend assumption, i.e., the change trends of the experimental and control groups are consistent before the government carries out the carbon trading policy. Therefore, this paper is inspired by the previous work to construct the interaction term between the year and treatment variable by taking the first 4 years of carbon trading policy as the benchmark of comparison [63]. In addition, considering the problem of multicollinearity, the variables in the year before the implementation of the policy are excluded from existing studies. If the model satisfies the parallel trend assumption, then the coefficient of the interaction term before the implementation of the carbon trading policy is not significant, while there is a significant difference after the implementation of the carbon trading policy.
The results of the parallel trend hypothesis test are shown in Figure 1 below, where none of the coefficients of the interaction terms are significant in the first five years of policy implementation. However, it is worth noting that the exploratory green innovation passed the significance test at the 5% level in 2015, while the exploitative green innovation also passed the significance test at the 10% level in 2015. This suggests that the green innovations in the experimental and control groups satisfy the parallel trend hypothesis, but due to information asymmetry, resulting in a lag in the market response, managers often begin to launch green innovation actions only after receiving policy warnings, resulting in a later policy effect. In the long run, the coefficients of the cross-terms are all significantly positive after the enactment of the carbon trading policy, which indicates that the carbon trading policy has a long-term impact on the green innovation behavior of en-terprises.

4.6. Robustness Tests

4.6.1. Control the Time Variability of Carbon Trading Policies

In the benchmark regression, carbon trading has been gradually carried out on pilot projects since 2013. Considering that the policy may have signal warnings and cumulative learning effects, the regions that will carry out carbon trading pilots in the future can adapt to this mechanism in advance. Therefore, the samples of enterprises in the Hubei, Chongqing, and Fujian regions were screened out, and there was a significant gap in the green innovation level of enterprises in the five pilot areas of Beijing, Shanghai, Shenzhen, Guangdong, and Tianjin. The empirical results are shown in Table 5, columns (1)–(3), and the coefficients T i m e i t × T r e a t i are positive, although the coefficients of green exploratory innovation are not significant; considering the impact of the exploratory innovation input cycle, its output effect has a lag, which is negligible, so it is basically consistent with the results of Hypotheses H1 and H2b mentioned above. The coefficient on exploratory green innovation in columns (4)–(6) is significantly positive. It indicates that firms pay more attention to exploratory green innovation under peer pressure, which is consistent with hypothesis H4 and results are robust.

4.6.2. Exclude the Impact of the SO2 Emissions Trading Pilot Policy

Since 2007, the Chinese government has approved 11 provinces and municipalities, including Hubei, Chongqing, and Zhejiang, to conduct pilot SO2 emissions trading. The mechanism is similar to carbon trading, i.e., to control SO2 emissions through market incentives. To avoid the impact of this policy on this study, this paper excludes the enterprises located in the SO2 emissions trading pilot areas and regresses the sample again. The empirical results are shown in columns (1)–(3) of Table 6, which show that the coefficients T i m e i t × T r e a t i are all positive, and the coefficients are positive for exploratory green innovations, but not significant, taking into account the impact of exploratory green innovations’ large inputs and long cycles, and their output effects have a certain lag, and thus can be ignored. Therefore, the experimental results of H1 and H2b are still robust. The results of hypothesis H4 are verified in columns (4)–(6), and the coefficients of the cross-terms of all three are significantly positive under the influence of peer pressure, which again proves the robustness of the empirical results.

4.6.3. Exclude the Impact of Low-Carbon Pilot Cities

In addition to the carbon trading pilot policy, the Chinese government also successively proposed the pilot work of low-carbon cities in 2010, 2012, and 2017. This policy requires each pilot region to accelerate the R&D and promotion of low-carbon technology innovation in order to accelerate the green development of cities. Therefore, to eliminate the bias brought by low-carbon cities, this paper treats low-carbon cities as dummy variables, i.e., if city n is selected as a low-carbon city pilot in year t, assign a value of 1, and otherwise 0. Since Xiamen is on the list of the first batch of low-carbon pilot cities, the policy will produce some early warnings on the transformation of the entire Fujian Province’s low-carbon economy, and therefore Fujian Province was set to be controlled in 2010, and regressed again. The final empirical evidence is shown in Table 7, in which the T i m e i t × T r e a t i coefficients are all significantly positive at a certain level, which is basically consistent with H1 and H2. The coefficients of the cross-terms of exploratory green innovations in columns (4)–(6) are significantly positive, indicating that firms pay more attention to exploratory green innovations under the cohort pressure, which is consistent with the results of H4, and once again proves that the conclusions are robust.

4.6.4. Replace the Peer Pressure Variable

Considering that the intensity of industry competition is an important reason for inducing peer pressure, this paper further verifies the robustness of the empirical results by introducing the Helfinda index to replace the Lerner index. The empirical results are shown in Table 8. The T i m e i t × T r e a t i coefficients in models (1)–(3) are all significantly positive, which is consistent with the empirical results of H1 and H2. In columns (4) to (6), the coefficients of the three cross-terms are all positive, but only exploratory green innovation passes the significance test, which is basically consistent with the previous empirical results.

5. Conclusions and Recommendations

5.1. Conclusions and Discussion

Taking the 2013 carbon trading pilot as the research background, this paper explores how carbon trading will affect the green innovation of Chinese enterprises. By adopting the multi-period DID method, the following conclusions are drawn from the samples of carbon trading pilot enterprises from 2008 to 2019: carbon trading is indeed conducive to corporate green innovation, which not only shows in exploitative green innovation, but also has an obvious promotion effect on corporate exploratory green innovation, and the two maintain a relatively balanced situation. Meanwhile, peer pressure has a significant positive moderating effect on carbon trading and exploratory green innovation, but not on exploitative green innovation.
It is easy to understand that the problem of global warming has become more and more serious in recent years, and more countries have participated in global governance. China naturally assumes important environmental governance responsibilities. Therefore, to achieve low-carbon development, the Chinese government continues to implement various policies to encourage innovation to mobilize the enthusiasm of enterprises for green innovation. In addition, affected by the innovation incentive effect, pilot companies can fulfill their low-carbon emission commitments through green technology innovation. They can not only freely buy and sell carbon emission credits in the carbon trading market and obtain additional income, but they can also show a positive social image to stakeholders such as investors and the public, increase customer loyalty, and stabilize their market position, which is beneficial to corporate development.
In a short period, the pilot enterprises, when facing the impact of carbon trading, have difficulty adapting to the harsh regulatory environment for a while. Therefore, to meet the current requirements of controlling carbon emissions as soon as possible and to avoid being penalized by the regulation, the enterprises will pay more attention to the short and quick exploitative green innovations, such as the waste treatment, the improvement in the efficiency of the energy use, and the improvement in the clean technology, and other measures.
However, in the long run, building a carbon market is a general trend, and China’s carbon trading system will be continuously improved in the future. Therefore, managers will show forward-looking awareness of green innovation, although exploratory green innovation requires radical technological change, high risk and uncertainty, and higher requirements for knowledge, talent, and capital investment of the enterprise; the enterprise is only limited to the exploitation of a green innovation company that may end up with the ability to trap [45]. Especially a low-threshold, low-technology approach will soon be imitated and copied to catch up with the pilot companies, and ultimately lose a competitive advantage. Therefore, investing in core technology and building barriers to green innovation is the long-term way [64], so the carbon trading policy can also have a certain incentive effect on the exploratory green innovation of enterprises. Therefore, in the face of the impact of carbon trading policy, enterprises pay attention to the exploitative green innovation to meet the requirements of controlling carbon emissions but also take into account the exploratory green innovation to form technological barriers, and push managers to pay more attention to both types of innovation.
Finally, enterprises are not independent individuals, but dynamic competition and synergistic development among enterprises. When facing the impact of carbon trading policies, green innovation among competitors in the same industry is a two-way influence. Following the principle of “action–feedback–action”, enterprises are forced to participate in the atmosphere of the innovation competition. At this time, managers will change the enterprise’s green innovation decision, reduce the focus on exploitative green innovation, try to break through the “patent bubble” trap [65], and turn to exploratory green innovation to ensure the value, scarcity, and difficulty of the imitation of technology, and form a sustainable green first-mover advantage. Therefore, under the pressure of a cohort, enterprises will pay more attention to exploratory green innovation.

5.2. Research Recommendations

  • Policy recommendations:
Continuously improve the carbon trading mechanism and mobilize the enthusiasm of enterprises for green innovation. Carbon trading policy does have a positive incentive effect on corporate green innovation. Therefore, as an effective means of environmental governance, it should gradually include more high-polluting and high-energy-consuming industries, give full play to the main role of the market incentive mechanism, and mobilize corporate enthusiasm for green innovation. Promote regional green development to achieve the goal of “carbon peaking and carbon neutrality” faster. In addition, refine the criteria for identifying green innovation and break the patent bubble. At present, to fulfill their commitment to reduce carbon emissions within this year, some enterprises tend to adopt short and quick exploitation innovations, and the economic spillover effect is not obvious. Therefore, while playing the role of the carbon market, the government can consider optimizing the green innovation patent identification criteria and refining the incentive policy for exploitative green innovations and exploratory innovations, to reduce the patent bubble.
  • Managerial recommendations:
Managers must be forward-looking and alert to dynamic competition. As a future development trend of the carbon trading market, it is difficult for any company to be immune, especially as companies in the same industry are always in dynamic competition, and it is difficult to maintain long-term competitive advantages only by imitation, optimization, and other methods. At the same time, managers should have a sense of urgency, focus on exploratory innovation investment, and form technical barriers to seize the initiative in market competition.

5.3. Limitations and Future Prospects

The shortcomings of this study include the following: First, carbon emissions trading policy belongs to the national level, but this article focuses on corporate innovation behavior and belongs to the micro-level. Therefore, this study uses key enterprises in the pilot area as a sample. Although the sample is representative, it may deviate from the reality to a certain extent. With the improvement in the carbon market system, future research can further study the impact mechanism of carbon emission trading policies on corporate green innovation using national carbon market samples. Second, the impact of carbon trading policies on corporate green innovation behavior is complex and may be influenced by other factors, which are not discussed because of space. In the future, we can continue to explore the deep-seated mechanism of carbon policies in corporate green innovation behavior, thereby providing a theoretical basis for the improvement in the carbon market system. Third, the research focuses on the impact of corporate green innovation behavior and does not translate it into the actual effect of controlling carbon emissions. Future research can explore this aspect in depth.

Author Contributions

Conceptualization, S.L. and Y.L.; Methodology, S.L.; Software, S.L.; Writing—original draft preparation, S.L.; Writing—review and editing, S.L.; Visualization, Y.L. Funding acquisition, Y.L. All authors have read and agreed to the published version of the manuscript.

Funding

This work was supported by Humanities and Social Sciences Research Project of the Ministry of Education (Grant number 20YJA630039).

Institutional Review Board Statement

An ethical approval does not apply to this article.

Informed Consent Statement

Not applicable.

Data Availability Statement

The original data presented in the study are openly available in the CSMAR database.

Acknowledgments

The conceptualization and design of the study were collaboratively developed by all authors. The initial draft of the manuscript was composed by Shanshan Liu, with subsequent versions receiving insightful feedback from all contributors. We thank Yugang Li for his comments on the manuscript. In addition, we are grateful to Jintao Zhang for his valuable suggestions, and his patience. Finally, we are very grateful to our English major friend Kelly for carefully revising and polishing our article and helping us improve our English writing skills.

Conflicts of Interest

The authors declare no conflict of interest.

References

  1. Ren, S.; Li, X.; Yuan, B.; Li, D.; Chen, X. The effects of three types of environmental regulation on eco-efficiency: A cross-region analysis in China. J. Clean. Prod. 2018, 173, 245–255. [Google Scholar] [CrossRef]
  2. Ellerman, A.D.; Buchner, B.K. Over-allocation or abatement? A preliminary analysis of the EU ETS based on the 2005–2006 emissions data. Environ. Resour. Econ. 2008, 41, 267–287. [Google Scholar] [CrossRef]
  3. Liu, L.; Chen, C.; Zhao, Y.; Zhao, E. China’s carbon-emissions trading: Overview, challenges and future. Renew. Sustain. Energy Rev. 2015, 49, 254–266. [Google Scholar] [CrossRef]
  4. Lee, K.-H.; Min, B. Green R&D for eco-innovation and its impact on carbon emissions and firm performance. J. Clean. Prod. 2015, 108, 534–542. [Google Scholar]
  5. Rubashkina, Y.; Galeotti, M.; Verdolini, E. Environmental regulation and competitiveness: Empirical evidence on the Porter Hypothesis from European manufacturing sectors. Energy Policy 2015, 83, 288–300. [Google Scholar] [CrossRef]
  6. Deng, Y.; You, D.; Wang, J. Optimal strategy for enterprises’ green technology innovation from the perspective of political competition. J. Clean. Prod. 2019, 235, 930–942. [Google Scholar] [CrossRef]
  7. Zhao, X.; Zhao, Y.; Zeng, S.; Zhang, S. Corporate behavior and competitiveness: Impact of environmental regulation on Chinese firms. J. Clean. Prod. 2015, 86, 311–322. [Google Scholar] [CrossRef]
  8. Petroni, G.; Bigliardi, B.; Galati, F. Rethinking the Porter hypothesis: The underappreciated importance of value appropriation and pollution intensity. Rev. Policy Res. 2019, 36, 121–140. [Google Scholar] [CrossRef]
  9. Zhang, W.; Li, G.; Guo, F. Does carbon emissions trading promote green technology innovation in China? Appl. Energy 2022, 315, 119012. [Google Scholar] [CrossRef]
  10. Du, G.; Yu, M.; Sun, C.; Han, Z. Green innovation effect of emission trading policy on pilot areas and neighboring areas: An analysis based on the spatial econometric model. Energy Policy 2021, 156, 112431. [Google Scholar] [CrossRef]
  11. Hu, J.; Pan, X.; Huang, Q. Quantity or quality? The impacts of environmental regulation on firms’ innovation–Quasi-natural experiment based on China’s carbon emissions trading pilot. Technol. Forecast. Soc. Chang. 2020, 158, 120122. [Google Scholar] [CrossRef]
  12. Peng, H.; Shen, N.; Ying, H.; Wang, Q. Can environmental regulation directly promote green innovation behavior?—Based on situation of industrial agglomeration. J. Clean. Prod. 2021, 314, 128044. [Google Scholar] [CrossRef]
  13. Barnett, W.P.; Greve, H.R.; Park, D.Y. An evolutionary model of organizational performance. Strateg. Manag. J. 1994, 15, 11–28. [Google Scholar] [CrossRef]
  14. Feng, C.; Shi, B.; Kang, R. Does environmental policy reduce enterprise innovation?—Evidence from China. Sustainability 2017, 9, 872. [Google Scholar] [CrossRef]
  15. Fang, G.; Tian, L.; Liu, M.; Fu, M.; Sun, M. How to optimize the development of carbon trading in China—Enlightenment from evolution rules of the EU carbon price. Appl. Energy 2018, 211, 1039–1049. [Google Scholar] [CrossRef]
  16. Borghesi, S.; Cainelli, G.; Mazzanti, M. Linking emission trading to environmental innovation: Evidence from the Italian manufacturing industry. Res. Policy 2015, 44, 669–683. [Google Scholar] [CrossRef]
  17. Guo, Y.; Xia, X.; Zhang, S.; Zhang, D. Environmental regulation, government R&D funding and green technology innovation: Evidence from China provincial data. Sustainability 2018, 10, 940. [Google Scholar] [CrossRef]
  18. Yang, X.; Jiang, P.; Pan, Y. Does China’s carbon emission trading policy have an employment double dividend and a Porter effect? Energy Policy 2020, 142, 111492. [Google Scholar] [CrossRef]
  19. Dai, J.; Cantor, D.E.; Montabon, F.L. How Environmental Management Competitive Pressure Affects a Focal Firm’s Environmental Innovation Activities: A Green Supply Chain Perspective. J. Bus. Logist. 2015, 36, 242–259. [Google Scholar] [CrossRef]
  20. Palmer, K.; Oates, W.E.; Portney, P.R. Tightening environmental standards: The benefit-cost or the no-cost paradigm? J. Econ. Perspect. 1995, 9, 119–132. [Google Scholar] [CrossRef]
  21. Chen, Z.; Zhang, X.; Chen, F. Do carbon emission trading schemes stimulate green innovation in enterprises? Evidence from China. Technol. Forecast. Soc. Chang. 2021, 168, 120744. [Google Scholar] [CrossRef]
  22. Lian, G.; Xu, A.; Zhu, Y. Substantive green innovation or symbolic green innovation? The impact of ER on enterprise green innovation based on the dual moderating effects. J. Innov. Knowl. 2022, 7, 100203. [Google Scholar] [CrossRef]
  23. Ambec, S.; Cohen, M.A.; Elgie, S.; Lanoie, P. The Porter hypothesis at 20: Can environmental regulation enhance innovation and competitiveness? Rev. Environ. Econ. Policy 2013, 7, 1. [Google Scholar] [CrossRef]
  24. Li, C. How does environmental regulation affect different approaches of technical progress?—Evidence from China’s industrial sectors from 2005 to 2015. J. Clean. Prod. 2019, 209, 572–580. [Google Scholar] [CrossRef]
  25. Jaffe, A.B.; Palmer, K. Environmental regulation and innovation: A panel data study. Rev. Econ. Stat. 1997, 79, 610–619. [Google Scholar] [CrossRef]
  26. Lanoie, P.; Laurent-Lucchetti, J.; Johnstone, N.; Ambec, S. Environmental policy, innovation and performance: New insights on the Porter hypothesis. J. Econ. Manag. Strategy 2011, 20, 803–842. [Google Scholar] [CrossRef]
  27. Zhang, G.; Lv, X.; Zhou, J. Private value of patent right and patent infringement: An empirical study based on patent renewal data of China. China Econ. Rev. 2014, 28, 37–54. [Google Scholar] [CrossRef]
  28. Porter, M.E.; Linde, C.v.d. Toward a new conception of the environment-competitiveness relationship. J. Econ. Perspect. 1995, 9, 97–118. [Google Scholar] [CrossRef]
  29. Zhao, X.; Shang, Y.; Ma, X.; Xia, P.; Shahzad, U. Does carbon trading lead to green technology innovation: Recent evidence from Chinese companies in resource-based industries. IEEE Trans. Eng. Manag. 2022, 71, 2506–2523. [Google Scholar] [CrossRef]
  30. Harford, J.D. Firm behavior under imperfectly enforceable pollution standards and taxes. J. Environ. Econ. Manag. 1978, 5, 26–43. [Google Scholar] [CrossRef]
  31. Clarkson, P.M.; Li, Y.; Richardson, G.D. The market valuation of environmental capital expenditures by pulp and paper companies. Account. Rev. 2004, 79, 329–353. [Google Scholar] [CrossRef]
  32. Hall, B.H.; Helmers, C. Innovation and diffusion of clean/green technology: Can patent commons help? J. Environ. Econ. Manag. 2013, 66, 33–51. [Google Scholar] [CrossRef]
  33. Hart, S.L. A natural-resource-based view of the firm. Acad. Manag. Rev. 1995, 20, 986–1014. [Google Scholar] [CrossRef]
  34. Barney, J. Firm resources and sustained competitive advantage. J. Manag. 1991, 17, 99–120. [Google Scholar] [CrossRef]
  35. Buysse, K.; Verbeke, A. Proactive environmental strategies: A stakeholder management perspective. Strateg. Manag. J. 2003, 24, 453–470. [Google Scholar] [CrossRef]
  36. Benner, M.J.; Tushman, M.L. Exploitation, exploration, and process management: The productivity dilemma revisited. Acad. Manag. Rev. 2003, 28, 238–256. [Google Scholar] [CrossRef]
  37. March, J.G. Exploration and exploitation in organizational learning. Organ. Sci. 1991, 2, 71–87. [Google Scholar] [CrossRef]
  38. Damanpour, F. Organizational complexity and innovation: Developing and testing multiple contingency models. Manag. Sci. 1996, 42, 693–716. [Google Scholar] [CrossRef]
  39. Jansen, J.J.; Van Den Bosch, F.A.; Volberda, H.W. Exploratory innovation, exploitative innovation, and performance: Effects of organizational antecedents and environmental moderators. Manag. Sci. 2006, 52, 1661–1674. [Google Scholar] [CrossRef]
  40. Danneels, E. The dynamics of product innovation and firm competences. Strateg. Manag. J. 2002, 23, 1095–1121. [Google Scholar] [CrossRef]
  41. Zhang, J.; Su, T.; Meng, L. Retreat in order to advance: Environmental performance below legality aspiration and corporate disclosure strategy. Int. Rev. Financ. Anal. 2024, 93, 103135. [Google Scholar] [CrossRef]
  42. Manso, G. Motivating innovation. J. Financ. 2011, 66, 1823–1860. [Google Scholar] [CrossRef]
  43. Ahuja, G.; Morris Lampert, C. Entrepreneurship in the large corporation: A longitudinal study of how established firms create breakthrough inventions. Strateg. Manag. J. 2001, 22, 521–543. [Google Scholar] [CrossRef]
  44. He, Z.-L.; Wong, P.-K. Exploration vs. exploitation: An empirical test of the ambidexterity hypothesis. Organ. Sci. 2004, 15, 481–494. [Google Scholar] [CrossRef]
  45. Levinthal, D.A.; March, J.G. The myopia of learning. Strateg. Manag. J. 1993, 14, 95–112. [Google Scholar] [CrossRef]
  46. Lumpkin, G.T.; Dess, G.G. Linking two dimensions of entrepreneurial orientation to firm performance: The moderating role of environment and industry life cycle. J. Bus. Ventur. 2001, 16, 429–451. [Google Scholar] [CrossRef]
  47. Porter Michael, E. Competitive Strategy: Techniques for Analyzing Industries and Competitors; The Free Press: New York, NY, USA, 1980. [Google Scholar]
  48. Chen, M.-J. Competitive dynamics: Eastern roots, Western growth. Cross Cult. Strateg. Manag. 2016, 23, 510–530. [Google Scholar] [CrossRef]
  49. Barnett, W.P.; Hansen, M.T. The red queen in organizational evolution. Strateg. Manag. J. 1996, 17, 139–157. [Google Scholar] [CrossRef]
  50. Barnett, W.P.; McKendrick, D.G. Why are some organizations more competitive than others? Evidence from a changing global market. Adm. Sci. Q. 2004, 49, 535–571. [Google Scholar] [CrossRef]
  51. Manski, C.F. Identification of endogenous social effects: The reflection problem. Rev. Econ. Stud. 1993, 60, 531–542. [Google Scholar] [CrossRef]
  52. Cao, J.; Liang, H.; Zhan, X. Peer effects of corporate social responsibility. Manag. Sci. 2019, 65, 5487–5503. [Google Scholar] [CrossRef]
  53. Lieberman, M.B.; Asaba, S. Why do firms imitate each other? Acad. Manag. Rev. 2006, 31, 366–385. [Google Scholar] [CrossRef]
  54. Marquis, C.; Glynn, M.A.; Davis, G.F. Community isomorphism and corporate social action. Acad. Manag. Rev. 2007, 32, 925–945. [Google Scholar] [CrossRef]
  55. Park, H.; Yoon, J. Assessing coreness and intermediarity of technology sectors using patent co-classification analysis: The case of Korean national R&D. Scientometrics 2014, 98, 853–890. [Google Scholar]
  56. Amore, M.D.; Bennedsen, M. Corporate governance and green innovation. J. Environ. Econ. Manag. 2016, 75, 54–72. [Google Scholar] [CrossRef]
  57. Podolny, J.M.; Stuart, T.E. A role-based ecology of technological change. Am. J. Sociol. 1995, 100, 1224–1260. [Google Scholar] [CrossRef]
  58. Guan, J.; Liu, N. Exploitative and exploratory innovations in knowledge network and collaboration network: A patent analysis in the technological field of nano-energy. Res. Policy 2016, 45, 97–112. [Google Scholar] [CrossRef]
  59. Geerts, A.; Leten, B.; Belderbos, R.; Van Looy, B. Does spatial ambidexterity pay off? On the benefits of geographic proximity between technology exploitation and exploration. J. Prod. Innov. Manag. 2018, 35, 151–163. [Google Scholar] [CrossRef]
  60. Elzinga, K.G.; Mills, D.E. The Lerner index of monopoly power: Origins and uses. Am. Econ. Rev. 2011, 101, 558–564. [Google Scholar] [CrossRef]
  61. Zhang, Q.; Yang, H.; Wang, Q.; Zhang, A.; Zhang, Y. Impact of high-speed rail on market concentration and Lerner index in China’s airline market. J. Air Transp. Manag. 2020, 83, 101755. [Google Scholar] [CrossRef]
  62. Gao, Y.; Li, M.; Xue, J.; Liu, Y. Evaluation of effectiveness of China’s carbon emissions trading scheme in carbon mitigation. Energy Econ. 2020, 90, 104872. [Google Scholar] [CrossRef]
  63. Li, P.; Lu, Y.; Wang, J. Does flattening government improve economic performance? Evidence from China. J. Dev. Econ. 2016, 123, 18–37. [Google Scholar] [CrossRef]
  64. Uotila, J.; Maula, M.; Keil, T.; Zahra, S.A. Exploration, exploitation, and financial performance: Analysis of S&P 500 corporations. Strateg. Manag. J. 2009, 30, 221–231. [Google Scholar]
  65. Fisch, C.; Sandner, P.; Regner, L. The value of Chinese patents: An empirical investigation of citation lags. China Econ. Rev. 2017, 45, 22–34. [Google Scholar] [CrossRef]
Figure 1. Parallel trend test results.
Sustainability 16 04486 g001
Table 1. Description of variables.
Variable NameDefinition
Green InnovationLogarithmic number of corporate green patent applications
Exploratory InnovationLogarithmic number of green patents with patent classification numbers not repeated in the previous 5 years
Exploitative InnovationLogarithmic number of green patents with patent classification number repeating in the previous 5 years
Innovation EquilibriumThe logarithm of exploratory green innovation × the logarithm of exploitative green innovation
Peer PressureOperating income of individual company/total operating income of the industry × cumulative Lerner index of individual stocks
Firm SizeLogarithmic total assets of enterprises
LiabilityTotal Liabilities/Total Assets × 100%
Firm AgeLogarithmic number of years of establishment
Growth AbilityTotal Assets Growth Rate
Nature of EquityState-owned enterprises are assigned a value of 1, and non-state-owned enterprises are assigned a value of 0
Percentage of Independent DirectorsProportion of independent directors to the number of directors
Equity ConcentrationThe shareholding ratio of the top 1 shareholder
Capital IntensityTotal Assets/Gross Sales × 100
ProfitabilityNet Profit/Total Assets × 100
Board ActivityLogarithmic number of board meetings
Table 2. Descriptive statistics.
VariableObsMeanStd. Dev.MinMax
Green Innovation27610.2640.729 03.807
Exploratory Innovation27610.1190.360 01.792
Exploitative Innovation27610.2370.706 03.761
Peer Pressure27610.0260.053 00.404
Firm Size276122.5411.662 19.076 27.686
Liability27610.4590.214 0.048 0.955
Firm Age27612.7000.464 0.693 3.434
Growth Ability27610.1820.387 −0.363 2.531
Nature of Equity27610.5680.495 01
Percentage of Independent Directors27610.3830.062 0.3 0.6
Equity Concentration27610.3670.161 0.084 0.789
Capital Intensity27612.5232.324 0.43 15.47
Profitability27610.0370.055 −0.192 0.213
Board Activity27612.2490.3971.386 3.296
Table 3. Correlation coefficients of variables.
Green InnovationExploratory InnovationExploitative InnovationPeer PressureFirm SizeLiabilityFirm Age
Green Innovation1.000
Exploratory Innovation0.857 ***1.000
Exploitative Innovation0.984 ***0.793 *** 1.000
Peer Pressure0.233 ***0.227 *** 0.218 *** 1.000
Firm Size0.160 ***0.150 *** 0.162 *** 0.127 *** 1.000
Liability0.105 ***0.079 *** 0.108 *** 0.027 0.431 *** 1.000
Firm Age0.0030.002 0.008 0.176 *** 0.043 ** 0.144 *** 1.000
Growth Ability−0.005−0.001 −0.004 −0.077 *** −0.073 *** −0.124 *** −0.231 ***
Nature of Equity−0.111 ***−0.075 *** −0.110 *** −0.036 * 0.393 *** 0.268 *** 0.194 ***
Percentage of Independent Directors0.0060.009 0.010 −0.023 0.183 *** 0.068 *** −0.206 ***
Equity Concentration0.045 **0.052 *** 0.043 ** 0.010 0.312 *** −0.001 −0.238 ***
Capital Intensity−0.1388 ***−0.114 *** −0.131 *** −0.033 * −0.071 *** −0.112 *** 0.083 ***
Profitability−0.0190.005 −0.020 0.011 −0.030 −0.336 *** −0.108 ***
Board Activity0.053 ***0.036 * 0.057 *** 0.051 *** 0.181 *** 0.235 *** 0.060 ***
Growth AbilityNature of EquityPercentage of Independent DirectorsEquity ConcentrationCapital IntensityProfitabilityBoard Activity
Growth Ability1.000
Nature of Equity−0.197 *** 1.000
Percentage of Independent Directors0.043 ** −0.105 *** 1.000
Equity Concentration−0.008 0.334 *** 0.091*** 1.000
Capital Intensity0.068 *** −0.117 *** −0.030 −0.124 *** 1.000
Profitability0.190 *** −0.043 ** −0.011 0.143 *** −0.119 *** 1.000
Board Activity0.022 −0.031 0.065 *** −0.175 *** 0.051 *** −0.119 *** 1.000
Note: Regression coefficients in the table; *, **, and *** indicate significance at 10%, 5%, and 1%, respectively.
Table 4. Benchmark regression and moderating effect results.
Variables(1)(2)(3)(4)(5)(6)(7)
Green Innovation Exploratory InnovationExploitative InnovationGreen Innovation Exploratory InnovationExploitative InnovationInnovation Equilibrium
Timeit × Treati  × Pressurei 0.970
(0.589)
0.936 **
(0.415)
0.917
(0.567)
Peer Pressurei −0.120−0.097−0.124
(0.158)(0.088)(0.158)
Timeit × Treati0.143 ***0.050 *0.152 ***0.045−0.0450.0600.141 **
(0.046)(0.026)(0.047)(0.071)(0.047)(0.067)(0.069)
Firm Size0.067 **0.025 *0.064 **0.067 **0.025 *0.065 **0.072 **
(0.027)(0.014)(0.027)(0.027)(0.014)(0.027)(0.035)
Liability−0.103−0.036−0.096−0.102−0.035−0.094−0.116
(0.103)(0.061)(0.100)(0.101)(0.060)(0.098)(0.169)
Firm Age0.020−0.0230.0410.018−0.0250.0390.000
(0.075)(0.046)(0.074)(0.074)(0.046)(0.074)(0.125)
Growth Ability−0.006
(0.013)
−0.002
(0.011)
0.001
(0.012)
−0.006
(0.013)
−0.002
(0.011)
−0.000
(0.012)
0.022
(0.025)
Nature of Equity−0.013
(0.031)
0.018
(0.035)
−0.027
(0.043)
−0.004
(0.030)
0.026
(0.036)
−0.019
(0.042)
−0.013
(0.037)
Percentage of Independent Directors−0.226
(0.218)
−0.138
(0.129)
−0.143
(0.222)
−0.202
(0.216)
−0.116
(0.128)
−0.121
(0.221)
−0.046
(0.291)
Equity Concentration−0.137
(0.219)
−0.067
(0.119)
−0.104
(0.205)
−0.149
(0.222)
−0.080
(0.120)
−0.115
(0.208)
−0.308
(0.320)
Capital Intensity−0.002
(0.004)
0.002
(0.002)
−0.002
(0.004)
−0.001
(0.004)
0.002
(0.002)
−0.002
(0.004)
−0.000
(0.005)
Profitability0.1490.192 *0.1440.1370.1790.1330.412 *
(0.197)(0.113)(0.195)(0.199)(0.113)(0.196)(0.239)
Board Activity0.024
(0.023)
0.011
(0.016)
0.016
(0.023)
0.025
(0.023)
0.012
(0.016)
0.017
(0.023)
−0.027
(0.038)
YearControl
IndustryControl
Observations2761276127612761276127612761
R-squared0.0450.0180.0500.0490.0240.0530.024
Note: Regression coefficients in the table; *, **, and *** indicate significance at 10%, 5%, and 1%, respectively.
Table 5. Results of robustness test (1).
Variables(1)(2)(3)(4)(5)(6)
Green Innovation Exploratory InnovationExploitative InnovationGreen Innovation Exploratory InnovationExploitative Innovation
Timeit × Treati × Pressurei 0.867
(0.601)
0.941 **
(0.421)
0.811
(0.577)
Pressurei −0.155−0.137−0.124
(0.185)(0.101)(0.183)
Timeit × Treati0.118 **0.0240.137 ***0.032−0.0710.056
(0.049)(0.027)(0.049)(0.074)(0.046)(0.071)
Firm Size0.079 **0.0320.072 **0.081 **0.034 *0.073 **
(0.036)(0.019)(0.035)(0.036)(0.019)(0.036)
Liability0.0010.011−0.012−0.0020.008−0.015
(0.126)(0.073)(0.123)(0.125)(0.072)(0.122)
Firm Age0.000−0.0220.021−0.002−0.0250.019
(0.079)(0.049)(0.079)(0.079)(0.049)(0.079)
Growth Ability−0.002
(0.015)
0.001
(0.014)
0.004
(0.013)
−0.003
(0.016)
0.000
(0.014)
0.003
(0.014)
Nature of Equity−0.007
(0.025)
−0.011
(0.011)
−0.002
(0.025)
−0.003
(0.025)
−0.007
(0.017)
0.002
(0.024)
Percentage of Independent Directors−0.437 *
(0.231)
−0.266 **
(0.135)
−0.364
(0.228)
−0.414 *
(0.229)
−0.240 *
(0.135)
−0.342
(0.227)
Equity Concentration−0.194
(0.299)
−0.140
(0.161)
−0.150
(0.280)
−0.206
(0.304)
−0.154
(0.163)
−0.162
(0.285)
Capital Intensity0.000
(0.005)
0.003
(0.003)
−0.000
(0.004)
0.000
(0.005)
0.003
(0.003)
0.000
(0.004)
Profitability0.1860.257 *0.2290.1720.240 *0.214
(0.238)(0.141)(0.234)(0.241)(0.141)(0.236)
Board Activity0.034
(0.024)
0.014
(0.019)
0.032
(0.024)
0.035
(0.024)
0.015
(0.019)
0.032
(0.024)
Observations235323532353235323532353
R-squared0.0450.0180.0500.0480.0240.053
Year fixed effectscontrol
Corporate fixed effectscontrol
Note: Regression coefficients in the table; *, **, and *** indicate significance at 10%, 5%, and 1%, respectively.
Table 6. Results of robustness test (2).
Variables(1)(2)(3)(4)(5)(6)
Green Innovation Exploratory InnovationExploitative InnovationGreen Innovation Exploratory InnovationExploitative Innovation
Timeit × Treati × Pressurei 1.113 *
(0.639)
1.068 **
(0.437)
1.077 *
(0.622)
Peer Pressurei −0.117
(0.177)
−0.117
(0.097)
−0.103
(0.176)
Timeit × Treati0.132 ***0.0330.147 ***0.020−0.0740.039
(0.048)(0.027)(0.049)(0.074)(0.047)(0.072)
Firm Size0.072 **0.0290.066 **0.073 **0.030 *0.067 **
(0.033)(0.018)(0.033)(0.033)(0.018)(0.033)
Liability−0.017−0.002−0.023−0.017−0.003−0.024
(0.117)(0.068)(0.114)(0.115)(0.067)(0.112)
Firm Age−0.004−0.0280.019−0.008−0.0310.015
(0.078)(0.048)(0.077)(0.077)(0.048)(0.077)
Growth Ability−0.002
(0.014)
0.002
(0.012)
0.002
(0.012)
−0.002
(0.014)
0.001
(0.013)
0.002
(0.013)
Nature of Equity−0.030
(0.036)
−0.018
(0.016)
−0.023
(0.035)
−0.024
(0.035)
−0.012
(0.020)
−0.017
(0.034)
Percentage of Independent Directors−0.427 *−0.259 *−0.355−0.397*−0.231 *−0.326
(0.228)(0.133)(0.225)(0.225)(0.132)(0.224)
Equity Concentration−0.156−0.114−0.122−0.176−0.134−0.142
(0.278)(0.151)(0.260)(0.283)(0.153)(0.266)
Capital Intensity0.0020.0030.0010.0020.0030.002
(0.004)(0.002)(0.004)(0.004)(0.002)(0.004)
Profitability0.1680.243 *0.1950.1500.226 *0.177
(0.222)(0.130)(0.218)(0.225)(0.130)(0.221)
Board Activity0.0300.0150.0250.0310.0150.025
(0.023)(0.018)(0.023)(0.024)(0.018)(0.023)
Observations245524552455245524552455
R-squared0.0470.0190.0510.0520.0260.056
Year fixed effectscontrol
Corporate fixed effectscontrol
Note: Regression coefficients in the table; *, **, and *** indicate significance at 10%, 5%, and 1%, respectively.
Table 7. Results of robustness test (3).
Variables(1)(2)(3)(4)(5)(6)
Green Innovation Exploratory InnovationExploitative InnovationGreen Innovation Exploratory InnovationExploitative Innovation
Timeit × Treati × Pressurei 0.9690.936 **0.916
(0.589)(0.415)(0.567)
Peer Pressurei −0.120−0.097−0.125
(0.157)(0.087)(0.158)
Timeit × Treati0.143 ***0.050 *0.152 ***0.045−0.0450.060
(0.046)(0.026)(0.047)(0.071)(0.047)(0.067)
Firm Size0.067 **0.025 *0.065 **0.068**0.025*0.065 **
(0.027)(0.014)(0.027)(0.027)(0.014)(0.027)
Liability−0.104−0.037−0.097−0.103−0.035−0.095
(0.103)(0.061)(0.100)(0.101)(0.060)(0.098)
Firm Age0.019−0.0240.0410.017−0.0250.039
(0.075)(0.046)(0.074)(0.074)(0.046)(0.074)
Growth Ability−0.006−0.0020.000−0.007−0.002−0.000
(0.013)(0.011)(0.012)(0.013)(0.011)(0.012)
Nature of Equity−0.0130.018−0.027−0.0050.025−0.019
(0.031)(0.036)(0.043)(0.030)(0.036)(0.042)
Percentage of Independent Directors−0.223−0.136−0.140−0.199−0.114−0.117
(0.218)(0.129)(0.221)(0.215)(0.128)(0.220)
Equity Concentration−0.137−0.068−0.104−0.150−0.080−0.115
(0.219)(0.119)(0.205)(0.222)(0.121)(0.208)
Capital Intensity−0.0020.002−0.002−0.0010.002−0.002
(0.004)(0.002)(0.004)(0.004)(0.002)(0.004)
Profitability0.1470.191 *0.1420.1340.1770.131
(0.197)(0.113)(0.195)(0.199)(0.113)(0.196)
Board Activity0.0240.0110.0160.0250.0120.017
(0.023)(0.016)(0.023)(0.023)(0.016)(0.023)
City * year fixed effects0.0240.0140.0220.0240.0140.022
(0.024)(0.018)(0.023)(0.024)(0.017)(0.023)
Observations276127612761276127612761
R-squared0.0460.0180.0500.0490.0240.053
Year fixed effectscontrol
Corporate fixed effectscontrol
Note: Regression coefficients in the table; *, **, and *** indicate significance at 10%, 5%, and 1%, respectively.
Table 8. Results of Robustness Test (4)-HHI.
Variables(1)(2)(3)(4)(5)(6)
Green Innovation Exploratory InnovationExploitative InnovationGreen Innovation Exploratory InnovationExploitative Innovation
Timeit × Treati × Pressurei 0.9700.936 **0.917
(0.589)(0.415)(0.567)
Peer Pressurei −0.120−0.097−0.124
(0.158)(0.088)(0.158)
Timeit × Treati0.143 ***0.050 *0.152 ***0.045−0.0450.060
(0.046)(0.026)(0.047)(0.071)(0.047)(0.067)
Firm Size0.067 **0.025 *0.064 **0.067 **0.025 *0.065 **
(0.027)(0.014)(0.027)(0.027)(0.014)(0.027)
Liability−0.103−0.036−0.096−0.102−0.035−0.094
(0.103)(0.061)(0.100)(0.101)(0.060)(0.098)
Firm Age0.020−0.0230.0410.018−0.0250.039
(0.075)(0.046)(0.074)(0.074)(0.046)(0.074)
Growth Ability−0.006−0.0020.001−0.006−0.002−0.000
(0.013)(0.011)(0.012)(0.013)(0.011)(0.012)
Nature of Equity−0.0130.018−0.027−0.0040.026−0.019
(0.031)(0.035)(0.043)(0.030)(0.036)(0.042)
Percentage of Independent Directors−0.226−0.138−0.143−0.202−0.116−0.121
(0.218)(0.129)(0.222)(0.216)(0.128)(0.221)
Equity Concentration−0.137−0.067−0.104−0.149−0.080−0.115
(0.219)(0.119)(0.205)(0.222)(0.120)(0.208)
Capital Intensity−0.0020.002−0.002−0.0010.002−0.002
(0.004)(0.002)(0.004)(0.004)(0.002)(0.004)
Profitability0.1490.192 *0.1440.1370.1790.133
(0.197)(0.113)(0.195)(0.199)(0.113)(0.196)
Board Activity0.0240.0110.0160.0250.0120.017
(0.023)(0.016)(0.023)(0.023)(0.016)(0.023)
Observations276127612761276127612761
R-squared0.0450.0180.0500.0490.0240.053
Year fixed effectscontrol
Corporate fixed effectscontrol
Note: Regression coefficients are shown in the table; *, **, and *** indicate significance at 10%, 5%, and 1% levels, respectively.
Disclaimer/Publisher’s Note: The statements, opinions and data contained in all publications are solely those of the individual author(s) and contributor(s) and not of MDPI and/or the editor(s). MDPI and/or the editor(s) disclaim responsibility for any injury to people or property resulting from any ideas, methods, instructions or products referred to in the content.

