Abstract
This study addresses the challenges of the expanding global online retail market by developing an innovative inventory management strategy that promotes sustainable development. We propose an integrated planning model that utilizes a newly enhanced Parallel Chicken Swarm Optimization (PCSO) algorithm alongside the established Economic Order Quantity (EOQ) model and the (s, S) inventory policy. Our model demonstrates its effectiveness through simulation experiments, showcasing its ability to dynamically adjust inventory thresholds based on daily forecasted demand, which significantly optimizes replenishment strategies. Notably, our model achieves a total cost reduction while maintaining a high service level of 0.761467 and reduces computational time to 82.32 s, highlighting its efficiency and adaptability. The innovation of this research lies in the application of the PCSO algorithm to dynamically manage inventory in real-time, aligning with sustainable inventory management practices. This study significantly contributes to the field by enhancing the economic and environmental sustainability of supply chain operations.
1. Introduction
Under the current trends of global digitalization and increased environmental awareness, sustainable supply chain practices are becoming imperative for businesses across all sectors. As highlighted by Becerra, P. et al. [1], the adoption of sustainable inventory management is essential not only for reducing costs but also for minimizing environmental impacts. This shift is driving companies to re-evaluate their traditional inventory practices to align with more sustainable, efficient, and adaptable models. Salas-Navarro, K. et al. [2] further emphasize that sustainable inventory management practices can significantly enhance a company’s ability to manage resources more efficiently while also supporting broader ecological and social goals. These practices involve optimizing inventory levels to reduce waste and resource consumption, which are crucial for the transition towards a circular economy. Moreover, Gonzalez-Ayala, P. et al. [3] discuss advanced algorithmic approaches, such as a Modified Simulated Annealing (MSA) algorithm, which help solve complex inventory problems like supplier selection and order quantity allocation. These technological advancements are pivotal in enabling more precise and dynamic inventory management, reducing unnecessary stock levels, and, therefore, decreasing the environmental burden. In addition, Piao, M. et al. [4] illustrate the application of multi-agent reinforcement learning in inventory management for the civil aircraft manufacturing industry. This approach underscores the potential of machine learning technologies to enhance the accuracy of demand forecasting and inventory allocation in real-time, further contributing to sustainable practices by mitigating overproduction and excess inventory. Finally, the research by Nobil, A.H. et al. [5] introduces a discontinuous economic growing quantity inventory model that adapts to varying market conditions and demand fluctuations. This model is particularly relevant for industries looking to optimize their supply chain operations in an environmentally and economically sustainable manner, highlighting how smart inventory solutions can align with global sustainability objectives. These insights collectively demonstrate a significant shift in supply chain management towards sustainable practices, underscoring the importance of integrating innovative technologies and strategies to enhance both economic and environmental outcomes. The continuous development and application of such sustainable inventory management models are crucial for ensuring the resilience and sustainability of global supply chains in the face of rapid market changes and environmental challenges.
This paper aims to develop a comprehensive planning model for inventory control management, tailored to accommodate known demand volumes and commodity prices over a specific period. This model incorporates strategies for inventory control and replenishment with the dual objectives of reducing total costs and fulfilling customer requirements. To sustainably achieve these goals, online retailers have implemented various strategies such as out-of-stock policies, inventory classification strategies, mixed strategies, pre-purchase inventory strategies, and post-order inventory purchasing strategies [6]. Our study aims to construct simulation scenarios and collect real-world supply chain data, integrating these with advanced and precise inventory control policies. The goal is to create a comprehensive operational management framework that not only optimizes inventory decision-making but also promotes environmental sustainability. By incorporating sustainability into the inventory management process, this model strives to minimize waste, reduce unnecessary resource consumption, and lower the carbon footprint associated with overproduction and excess inventory. This approach contributes to a more sustainable supply chain ecosystem, aligning with global efforts to promote environmental responsibility while maintaining economic viability and customer satisfaction. Through this holistic approach, this study aims to demonstrate that effective inventory management can achieve cost reduction and meet consumer demand in an environmentally sustainable manner.
This study innovates a dynamic optimization method for inventory decisions, bringing fresh perspectives and methods to inventory management in the e-commerce retail domain. By employing the EOQ (Economic Order Quantity) model [7], in conjunction with the (s, S) inventory strategy [8], and utilizing the Parallel Chicken Swarm Optimization (PCSO) algorithm [9] to dynamically optimize daily inventory levels, this research further enhances the efficiency and accuracy of inventory strategy adjustments, while achieving the minimization of inventory costs and maintaining a high level of service. Considering the variability of the market environment, this study also conducts sensitivity analysis on lead times and prices to verify the model’s adaptability to market fluctuations. By improving cost-effectiveness in inventory management and reducing resource wastage, economic sustainability is facilitated. Additionally, conducting sensitivity analysis on lead times, optimizing replenishment cycles, and reducing carbon emissions during transportation contribute to environmental sustainability. The flowchart of this paper is as follows (see Figure 1).
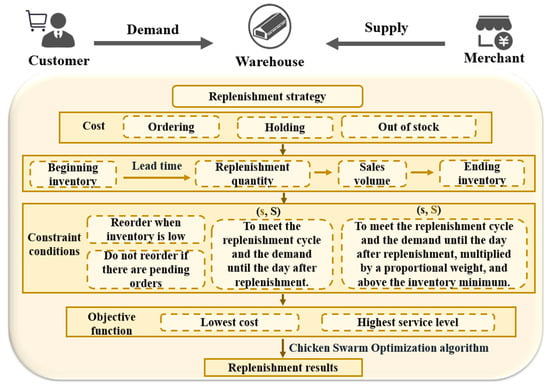
Figure 1.
Process architecture.
2. Literature Review
The core concept of this article is the optimization of inventory control strategies for minimizing costs and maximizing service levels in supply chain inventory management. It explores the theory and application of the Economic Order Quantity (EOQ) model, the operational mechanisms of the (s, S) inventory policy, and the innovative application of the Parallel Chicken Swarm Optimization (PCSO) algorithm in inventory management. The aim is to adjust inventory strategies to adapt to changes in market demand, providing more efficient and economical solutions to support effective supply chain management, thus achieving sustainable development both economically and environmentally.
2.1. The Inventory Management Challenges in the E-Commerce Retail Industry
With the development of e-commerce and internet technology, the retail industry is constantly facing inventory management challenges and is gradually moving towards omnichannel retailing. Manjunath S. Vhatkar and others explored the relationship between digitization and omnichannel retail, emphasizing sustainability issues [10]. Ma Baomei and others investigated the increasing adoption of omnichannel strategies in the retail industry against the backdrop of e-commerce growth, proposing four return policies based on return channels and using the newsboy model to construct an optimal profit function considering offline return profits, uncertain demand, and inventory costs [11]. According to Zhang Yue and others, facing the post-pandemic era where consumers are more price-sensitive, omnichannel coupons issued by e-commerce platforms that can be used online or offline are becoming increasingly popular. He explored the promotional and inventory strategies of suppliers in online exclusive, brick-and-mortar, and BOPS (Buy Online, Pickup in Store) channels considering platform omnichannel coupons [12]. However, for the uncertainty of demand and inventory risk in e-commerce retail, Guan Zhimin and others adopted the Worst-Case Mean-Conditional Value at Risk (WMCVaR) as the objective function to balance expected profit and risk, providing effective management strategies for the omnichannel retail network [13]. Nevertheless, the expansion of business scope and the acceleration of goods circulation generally lead to a shortage of funds for retailers, especially small- and medium-sized enterprises (SMEs). Li Ming proposed a blockchain-driven logistics finance execution platform to support the funding needs of e-commerce retail [14].
2.2. Inventory Management Strategies
Traditional inventory management research, especially the Economic Order Quantity (EOQ) model, has become the cornerstone for understanding and optimizing inventory strategies [15]. Since Harris proposed the classical square-root EOQ model in 1913 [7], this model has demonstrated significant efficiency in optimizing costs and profits at various logistics and inventory stages. The EOQ model assumes constant market demand [16], allowing businesses to derive an optimal ordering quantity based on determined annual market demand to maximize profit or minimize total costs. However, the real market is full of unpredictability, leading to actual demands that are often difficult to characterize as constants or deterministic functions. This can cause significant deviations in traditional EOQ models when their assumptions are not met [17,18]. Compared to manufacturing, remanufacturing systems involve a complex structure including consumers, suppliers, remanufacturers, retailers, and customers, where uncertainty is an inherent and inevitable feature [19,20,21,22,23]. Among many uncertainties, market demand variability is the most common, with its impact on operations management being difficult to accurately predict, potentially leading to errors in the decision-making process [24,25,26]. Thinakaran and others have conducted comprehensive studies on inventory models under full and partial backordering conditions for both the Economic Order Quantity (EOQ) and Economic Production Quantity (EPQ) models, exploring optimal backorder strategies and reviewing the effects of key parameters on inventory models including cycle time variations, inventory demands, batch sizes, and substitutable items [27]. Liao and Li’s research extended the application of the traditional Economic Order Quantity (EOQ) model to Closed Loop Supply Chain (CLSC) systems, quantifying through stochastic analysis the impact of market uncertainties on remanufacturing and operational processes. By converting all production indicators into carbon equivalent emissions in different acquisition scenarios, they conducted a comparative analysis of environmental efficiency, providing a theoretical basis for formulating optimal ordering strategies to maximize environmental benefits from the perspective of the entire closed-loop supply chain under market uncertainty conditions [28]. However, these models perform well under stable market conditions but less so in dynamic and uncertain promotional environments. These studies often overlook the volatility and uncertainty of demand during promotional periods and its impact on inventory strategies.
In supply chain inventory management, the management process begins with forecasting the demand for products, followed by calculating the replenishment quantity based on this demand and adjusting the inventory accordingly. While demand forecasting has improved significantly with the advent of machine learning, optimizing inventory management strategies, especially replenishment strategies, still has considerable room for improvement. In previous literature, K.L. Mak and others in 2005 proposed an (s, S) strategy incorporating a maximum issuance limit for inventory items with high demand variability, considering the possibility of opportunistic replenishment. This strategy aims to reduce order costs by coordinating inventory replenishment while avoiding excessive inventory depletion, thereby lowering total operational costs [29]. Mualla Gonca Avci and Hasan Selim’s research addressed the inventory replenishment problem involving premium freight through the application of a multi-objective simulation optimization approach. They utilized a decomposition-based multi-objective differential evolution algorithm (MODE/D), effectively balancing the total holding costs and the ratio of in-and-out premium freight, demonstrating the method’s effectiveness in handling multinational automobile supply chains [30]. In the realm of dynamic pricing and replenishment policies for fresh agricultural products, Tijun Fan and others proposed a revenue management dynamic programming model based on consumer choice behavior. This model not only focuses on product freshness and inventory levels but also simplifies replenishment operations through the development of simplified heuristic replenishment strategies, thereby enhancing overall profit [31]. H.Y. Lam and his team explored an inventory replenishment strategy adapted to e-commerce demands, namely the Responsive Picking Face Replenishment (RPFR) strategy. They effectively dealt with the variability of order demands and the spatial limitations of the picking face area by dividing the high-bay warehouse into an upper reserve area and a picking face front area, combined with predictive analytics algorithms, an Adaptive Network-based Fuzzy Inference System (ANFIS), and an adaptive genetic algorithm [32]. Ran Tian and others proposed the IACPPO model, which, by integrating advanced deep reinforcement learning algorithms, specifically the Advantage Actor-Critic (A2C) and Proximal Policy Optimization (PPO) algorithms, successfully addressed the spatiotemporal heterogeneity problem in inventory cost control, thereby improving the predictive accuracy and cost efficiency of replenishment strategies [33].
Although the inventory strategies in the aforementioned literature are innovative, they are almost exclusively based on single replenishment strategy models and lack flexibility, failing to achieve dynamic optimization. Future research should focus on enhancing the adaptability of strategies, integrating innovations across multiple models, and improving the interpretability and operability of these models.
Facing the complexities and uncertainties of the real world, especially in remanufacturing systems and dynamic market environments, the development of dynamic inventory management strategies has become increasingly pertinent. Unlike traditional inventory models, dynamic inventory management strategies incorporate advanced techniques such as machine learning, time-series analysis, and combinatorial optimization, offering more accurate and adaptable solutions. For instance, research by Khalil Namir and others on forecasting inventory prices and demand not only ensures effective production planning but also optimizes the utilization of remaining inventory, thereby maximizing organizational profit while reducing risk [34]. Further, the work of Chi-Ming Tsou highlights the importance of supply chain collaboration and dynamic inventory level adjustments in dynamic inventory management. Employing time-series data mining techniques, this strategy can precisely detect market demand changes and adjust inventory levels in a timely manner, effectively reducing the risks associated with rapid market changes [35]. Similarly, research by Baris Tan and Selcuk Karabati confirms that in retail environments, considering the complexities of stockouts and dynamic demand substitution, dynamic inventory management can significantly enhance expected profits by optimizing holding and substitution costs [36]. In addressing global challenges, such as vaccine distribution during the COVID-19 pandemic, dynamic inventory management strategies have demonstrated their key role. By developing an adaptable bi-objective framework, as shown by Jamal Nahofti Kohneh and others, dynamic planning and the ability to respond to uncertainties provided strategic adjustments for large-scale vaccination programs, achieving a balance between cost minimization and high service levels [37]. Research conducted by Issei Suemitsu employing a three-stage approach, including mixed-integer linear programming and policy learning, formulated cost-effective replenishment plans responsive to fluctuations in logistical conditions [38]. Moreover, the study by Emilio J. Alarcon Ortega and others broadened the application fields of dynamic inventory management, focusing on solving the inventory routing problem with various stochastic dynamic demand distributions, such as supermarket demand on different weekdays and times of the day. By structuring the problem as a finite horizon stochastic dynamic program and dividing time into sub-periods with distinct demand distributions; the study proposed an iterative lookahead algorithm and an adaptive large-neighborhood search strategy for formulating more efficient replenishment plans, effectively reducing costs compared to traditional replenishment strategies [39].
While previous research has emphasized the effectiveness and application range of the traditional EOQ model, and demand forecasting has become mature and refined, it also highlights the model’s limitations when facing market demand uncertainty. However, these improvements are still focused on single or static replenishment strategies, lacking flexibility in adapting to market dynamics and demand uncertainty. Future research should focus on enhancing the adaptability of strategies, integrating and innovating across multiple models, and improving the interpretability and operability of models, thereby fostering innovation and development in supply chain management practices.
2.3. Application of Optimization Algorithms in Inventory Management
In the field of inventory management, the application of optimization algorithms has enhanced decision-making efficiency and operational performance, especially when facing uncertainty and complexity. Chinmay Saha and others explored the application of fuzzy optimization strategies and differential evolution algorithms in managing the production inventory of imperfect items. By integrating demand forecasting, production planning, quality inspection, and inventory control into a customized mathematical model, they demonstrated the potential of hybrid intelligent algorithms in reducing expected costs and enhancing operational reliability [40]. Sohaib Afifi and his team proposed a memetic algorithm-based approach for simultaneously optimizing preventive maintenance scheduling and spare parts inventory management in manufacturing systems. Introducing a new mixed-integer linear programming (MILP) model, their hybrid memetic algorithm (HMA) achieved outstanding performance in computational efficiency and solution quality [41]. Guilherme Henrique de Paula Vidala and colleagues developed an inventory management decision support framework combining fuzzy multicriteria methods, genetic algorithms, and artificial neural networks. Applied to the maintenance, repair, and operations (MRO) inventory management of a railway logistics operator, this framework significantly improved the accuracy of SKU demand forecasting and enhanced decision flexibility and quality through a management dashboard [42]. Tamás Varga and his team enhanced nonlinear optimization performance in complex supply chain inventory management by improving the Particle Swarm Optimization (PSO) algorithm. Their memory-based gradient search algorithm made significant progress in estimating gradients, improving the algorithm’s convergence [43]. In addressing supply and demand uncertainties, Joohyun Shin and others formulated the inventory management problem as a Markov Decision Process (MDP) and obtained decision policies through precise value iteration and approximation methods, highlighting the importance of systematic supplier selection [44]. Vincent F. Yu and colleagues explored the joint optimization problem of spare parts inventory and planned maintenance, proposing a two-stage genetic algorithm. Their research effectively balanced inventory costs and spare parts availability when dealing with uncertain failures [45]. Affonso T. B. and her team introduced a novel hybrid forecasting method for spare parts inventory management. By enhancing spare parts forecasts through heuristics and bootstrapping, their method showed significant advantages in reducing total costs [46].
Reviewing the research on the application of optimization algorithms in inventory management by scholars such as Chinmay Saha and Sohaib Afifi, the contributions of previous researchers in enhancing decision-making efficiency and operational performance, especially in the face of uncertainty and complexity, are significant. Notable progress has been made in managing the production inventory of imperfect items, spare parts inventory management, and complex supply chain inventory management. These methods have not only reduced expected costs and enhanced operational reliability but also demonstrated their effectiveness in systematic supplier selection and the joint optimization of spare parts inventory and planned maintenance. However, despite these significant achievements in algorithm application and inventory management optimization, there are still areas for improvement. Most studies remain focused on specific scenarios or conditions, lacking consideration for adaptability to broader or dynamically complex environments. Furthermore, there is substantial room for the optimization and innovation of the algorithms themselves, especially in enhancing algorithm efficiency, reducing computational resource consumption, and improving the algorithms’ generalization capabilities. Future research should focus on improving algorithm performance and adaptive adjustment mechanisms, as well as addressing multi-objective optimization problems, to achieve more efficient, flexible, and sustainable inventory management solutions.
Based on an in-depth literature review of inventory management in the e-commerce retail sector, this paper comprehensively discusses inventory management strategies and the application of various optimization algorithms in inventory management. Through theoretical modeling and algorithm optimization, previous scholars have provided a series of effective solutions for inventory management, highlighting the limitations of traditional models and inventory strategies and demonstrating the potential of optimization algorithms in reducing expected costs and enhancing operational reliability. However, despite progress in individual models or static strategies, these method slack flexibility in real-time response to market dynamics and uncertainty in demand. Moreover, the adaptive adjustment mechanisms of algorithms and the capability to handle multi-objective optimization problems need further enhancement. Addressing the shortcomings identified in the literature review, this paper innovatively combines the EOQ model, the (s, S) inventory strategy, and the Parallel Chicken Swarm Optimization (PCSO) algorithm, proposing a dynamic optimization method for inventory decision-making. This method can quickly decide daily inventory levels based on daily demand, effectively enhancing the efficiency and accuracy of inventory strategy adjustments, while minimizing inventory costs and maximizing service levels. Additionally, sensitivity analysis on lead times and prices in a simulation environment verifies the model’s adaptability to market changes, promoting economic sustainability.
3. Model Establishment
The supply chain inventory management model proposed in this paper aims to achieve cost minimization and service-level maximization. To cope with the high intensity of market dynamics, the model improves the precision of decision-making and the efficiency of operations through the integration of the EOQ ordering model and the (s, S) inventory policy. To effectively address the challenges of complexity and dynamic change, this paper also introduces the Chicken Swarm Optimization algorithm. This algorithm has shown significant potential in enhancing the efficiency and performance of inventory management decisions. In summary, the supply chain inventory management algorithm proposed in this paper, through model integration and optimization algorithm, effectively enhances the cost efficiency and service level of inventory management in response to market dynamics. This integrated model not only improves operational efficiency but also enables businesses to better adapt to market dynamics, thereby driving organizational success forward.
The proposed supply chain inventory management model is characterized by dynamic adaptability, complexity, the ability to enhance cost efficiency, and strong environmental adaptability. By integrating the Economic Order Quantity (EOQ) model and the (s, S) strategy, and introducing the Chicken Swarm Optimization algorithm, it can flexibly respond to market demand fluctuations, while minimizing total costs, improving the accuracy of replenishment, and enhancing the robustness of decisions. This method is particularly suitable for coping with dynamic market changes, reducing operational costs, improving service levels, and enhancing decision support, allowing businesses to better adapt to market dynamics and future challenges, thereby driving organizational success forward. The computational architecture of the complete model is shown below (see Figure 2), which shows the steps arranged in chronological order: if the demand is greater than the initial inventory under the known forecasted demand, replenishment is done using the (s, S) inventory policy (Step ①), and then the replenished amount is added to the initial inventory for calculation. Otherwise, skip replenishment and calculate inventory (Step ②), and the initial inventory for the day minus the demand is the ending inventory (Steps ③–④), with the ending inventory of the day becoming the initial inventory for the following day (Step ⑤).
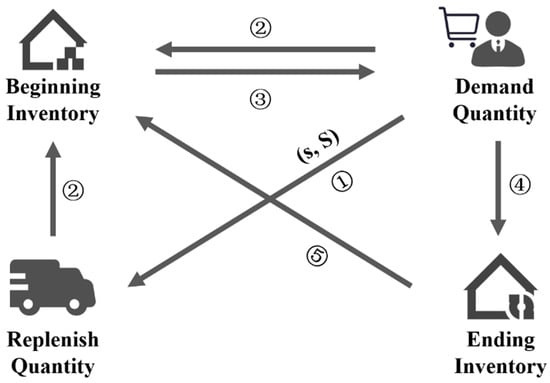
Figure 2.
Model computational architecture.
3.1. Complete Planning Inventory Control Model
When building a comprehensive planning inventory control model, we first need to review and integrate existing classic models and strategies, and then adjust these models according to specific circumstances to fit the current business needs and market environment. Below are the steps and components involved in constructing this model.
3.1.1. Basic EOQ Model
Previous discussions in traditional inventory management research, particularly regarding the Economic Order Quantity (EOQ) model, have considered it a key tool for optimizing inventory strategies since the early 20th century, with models in the literature being based on stable market demand to achieve minimized costs and maximized profits. Based on the Economic Order Quantity (EOQ) model proposed by Ayu A (2022) [47], this model determines the optimal order quantity by minimizing total costs (including ordering costs, holding costs, and shortage costs) with the aim of achieving sustainable low costs and high quality, thereby realizing cost efficiency and economic growth.
- Ordering Costs:
Let the ordering cost of the goods be ;
- Holding Costs:
Let the storage fee , which is the unit holding cost, be part of the purchasing cost , meaning the daily depreciation rate of the goods is , which can be expressed as ;
- Shortage Loss:
Let the shortage loss per unit of goods be , which is part of the purchasing cost , meaning the profit per good is , which can be expressed as ;
- Beginning Inventory:
Let the inventory level at the beginning of day i for each unit of goods be ;
- Ending Inventory:
Let the ending inventory for each unit of goods on day i be , which also represents the beginning inventory for day i + 1. The ending inventory for each day is equal to the beginning inventory of that day minus the demand . When the beginning inventory is less than the demand, the ending inventory is cleared to 0. The replenished goods will arrive at the warehouse after a certain number of days; the lead time is the time difference from placing the replenishment order to its arrival at the warehouse. For each i, the inventory update formula needs to consider the delay in replenishment arrival. If we place an order on day i, the batch of goods will arrive on day . Therefore, if there is replenishment on the day, the quantity of goods ordered days ago, , should be added, which means the following:
which can be simplified as follows:
When there is replenishment, the cost for the goods on day i is the ordering cost plus the storage cost, which means the following:
When there is no replenishment and the demand exceeds the beginning inventory, the cost consists of storage costs plus shortage losses, which means the following:
When there is no replenishment and the demand is less than or equal to the beginning inventory, the cost consists of storage costs, which means the following:
3.1.2. EOQ Total Cost Calculation Formula
The total cost of the goods can be expressed as follows:
3.1.3. Replenishment Mechanism of the (s, S) Strategy
Based on the (s, S) strategy proposed by Bo Dai et al. in their research [48], multiple products are replenished jointly at each inventory location, with the inventory of each product at each location controlled via the (s, S) strategy. The (s, S) replenishment strategy is a dynamic inventory control method, where (s) is the inventory lower limit triggering replenishment, and (S) is the target upper limit of inventory after replenishment. The inventory control of each product at every inventory location adopts the s strategy, and due to the limitations of transportation capacity and storage costs of each distribution channel, the quantity of products replenished jointly at each time cannot exceed a given maximum number S, thereby maximizing service levels and minimizing total costs under the constraint of maximum joint-replenishment quantity.
Under the (s, S) replenishment strategy, consider the following situation:
- When there are no orders in transit, the initial inventory meets the inventory upper and lower limits from LT days ago;
When there are no orders in transit on day i, that is, there was replenishment LT days ago, the initial inventory for day i should meet the inventory upper and lower limits from LT days ago, which is expressed as follows:
- Inventory Lower Limit:
Let the inventory lower limit on day i be higher than the total demand from that day to the day of replenishment, ensuring that there is stock during the replenishment cycle, and not exceeding the total demand from that day to the day after the next replenishment, which means the following:
- Inventory Upper Limit:
The inventory upper limit should be higher than the total demand from that day to the day of replenishment and should not exceed the total demand from that day to the day after the next replenishment multiplied by a proportional weight. Furthermore, the inventory upper limit should be higher than the inventory lower limit, which means the following:
- Replenishment Situation:
When there are orders in transit, no replenishment is made, meaning that after replenishment on day , no replenishment is made for the next LT days, which can be expressed as follows:
When there are no orders in transit and the initial inventory is below the inventory lower limit, replenishment is carried out, with the replenishment quantity being the inventory upper limit minus the ending inventory, which means the following:
- Natural Number Constraint:
The inventory quantity, replenishment quantity, and inventory upper and lower limits are all non-negative integers rounded up, which means the following:
3.1.4. Service-Level Calculation Formula
The service level is measured by the proportion of demand that is met:
In summary, we establish the model as follows:
3.2. Dynamic Optimization of the Planning Inventory Control Model
To further enhance the efficiency of inventory management and adapt to dynamic market changes, we propose a dynamic optimization inventory control model integrated with the Chicken Swarm Optimization (CSO) algorithm. This model aims to achieve cost minimization and service-level maximization through dynamically adjusting inventory decisions.
The Chicken Swarm Optimization (CSO) algorithm is a meta-heuristic algorithm that simulates the behavior of a chicken swarm [49]. It models the social behavior and hierarchy system of the chicken swarm, dividing the entire swarm into several subgroups, each consisting of roosters, hens, and chicks. Roosters, hens, and chicks follow different iteration formulas respectively. The algorithm steps and flowchart are as follows (see Figure 3):
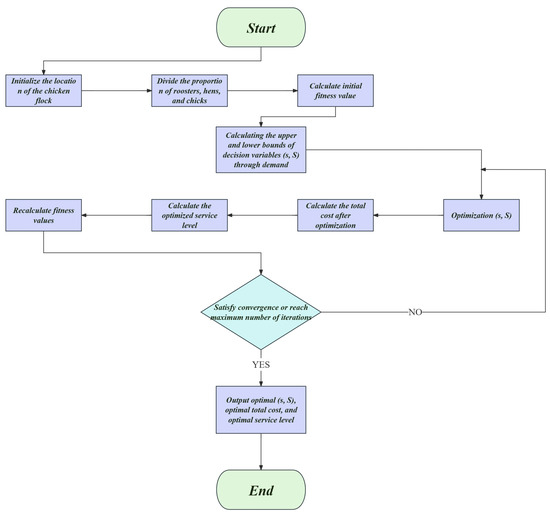
Figure 3.
Chicken Swarm Optimization algorithm flowchart.
- Initialize the chicken swarm: Initialize a group of chickens based on the problem, where each chicken represents a potential solution in the inventory decision, with the initial position of each chicken being ;
- Define leaders and followers: Select leaders (optimal inventory strategies) and followers based on fitness (here referring to the difference in minimizing total cost and maximizing service level), with the fitness value expressed as follows:
- Update positions: By simulating the social behavior of the chicken swarm, update the position of each chicken, that is, the updated inventory strategy. Let represent the j-th component of the i-th chicken in the t-th generation and represents the optimal position of the i-th chicken in the previous t-th generations. Different chickens follow different motion laws, with better roosters being closer to food than poorer roosters. The position update formula is as follows:where is a Gaussian distribution with a mean of zero and variance of . is a very small quantity to prevent the denominator of the fraction from being zero. k is a random number in the chicken swarm that is not i, and is the fitness value corresponding to the i-th chicken.The update formula for hens is as follows:where is a random number between 0 and 1, represents the rooster of the sub-swarm where the i-th hen is located, represents a hen randomly selected from the swarm, and .The update formula for chicks is as follows:where m is the corresponding hen for the i-th chick, and FL is a random number between 0 and 2;
- Determine if convergence has occurred: if the current number of iterations has reached the preset maximum number of iterations, then stop iterating and output the optimal solution; otherwise, recalculate the fitness values.
Applying the Chicken Swarm Optimization algorithm to inventory control models can dynamically adjust order quantities and restocking times to adapt to constantly changing market demands. By simulating the searching behavior of a chicken swarm, the algorithm is able to find the optimal balance between total costs and service levels.
4. Simulation and Results
4.1. Case Data Introduction
In the e-commerce sector, sensible inventory management is crucial for maintaining business continuity, optimizing costs, and enhancing customer satisfaction. For online retail merchants, an efficient inventory optimization strategy can significantly enhance their competitiveness. This case focuses on how to devise effective replenishment plans based on known demand data, aiming to reduce costs, improve service levels, and decrease inventory turnover days.
In this case, we used a dataset specifically designed for e-commerce retail demand forecasting and inventory optimization issues. The dataset includes sales data for multiple merchants, inventory status, and known demand volumes, among other information. The detailed introduction of the dataset is as follows (see Table 1).

Table 1.
Dataset introduction.
Case data description can be seen in Table 2.
Table 2.
Data field name.
In this case, a periodic inventory review strategy (s, S) was adopted, which means that under a fixed inventory review period NRT = 1, daily replenishment plans are formulated based on predicted demand, holding costs, and shortage costs. The lead time for replenishment is LT = 3 days, meaning it takes 3 days from placing an order for the arrival of goods. The initial inventory for all products is set at 5.
The goal is to minimize the total cost of inventory management while enhancing customer satisfaction through known demand volumes and effective inventory replenishment strategies. The challenge lies in devising economical and efficient replenishment plans amidst uncertain market demand and potential supply chain fluctuations.
This case data introduction provides an overview of an e-commerce retail inventory management problem, covering the structure and significance of the required data, as well as the core problem that needs to be solved. Following this, the design and implementation of solutions to achieve the objectives will be discussed based on this information.
The left side of the above figure shows the boxplot of commodity prices (see Figure 4), which reveals the presence of some outliers with significantly high values, with the maximum and minimum values differing by about 375. The upper quartile is positioned lower, indicating that a higher proportion of large values exist in the data, and the box is wider, suggesting that the distribution of price data is more dispersed and volatile. The whiskers are shorter in the lower half, indicating that the distribution of lower-priced goods is more concentrated. On the right side, the boxplot of demand volumes also shows a significant number of outliers, but the range of data is smaller, and the box is narrower, indicating that the distribution of product demand volumes is relatively concentrated, less volatile, and more stable.
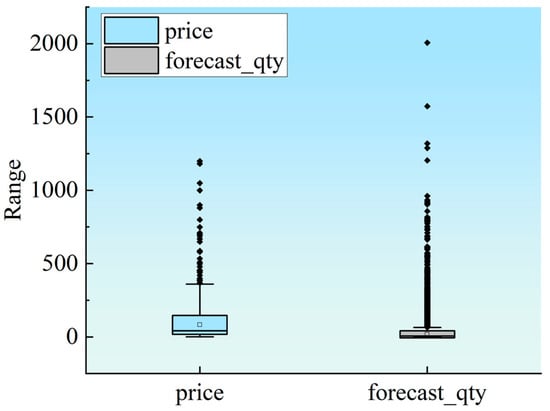
Figure 4.
Boxplot of commodity prices and demand volumes.
The above figure is a filled line chart of product demand volumes (see Figure 5), which describes the daily total demand volume fluctuations for the period from 16 May 2023 to 30 May 2023, with the overall trend fluctuating between 30,000 and 45,000.
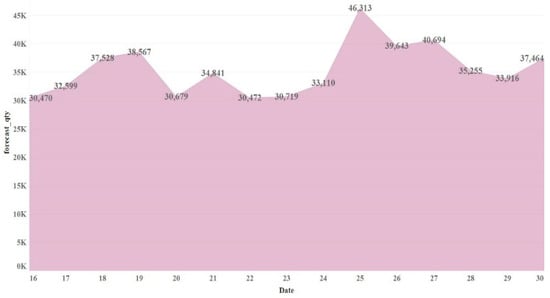
Figure 5.
Demand volume filled line chart.
4.2. Simulation Environment
The simulation experiment was conducted on the following hardware configuration (see Table 3).
Table 3.
Configuration introduction.
All simulation experiments were conducted in a Python 3.9 environment, primarily relying on the following libraries (see Table 4).
Table 4.
Simulation experiment libraries.
For the sake of ensuring the repeatability of the experiments, the following are the initial parameter settings for several key algorithms (see Table 5).
Table 5.
Initial parameter settings.
When evaluating the performance of the model, we used the following key indicators:
To consider holding costs and shortage costs, we calculate the total cost to assess the economy of inventory strategies. The total cost calculation formula is as follows:
the service-level formula:
By synthesizing these evaluation indicators, we are able to comprehensively assess the performance of the demand forecasting model and inventory optimization strategy, as well as their applicability in real e-commerce retail environments.
4.3. Model Validation
Firstly, the model is initialized by setting basic parameters such as ordering cost, holding cost, shortage loss, and initial inventory level.
- Ordering Cost:
The ordering cost of goods is ;
- Holding Cost:
, meaning the unit holding cost is 1% of the purchase fee, and the daily spoilage rate of goods storage is 1%, which can be represented as ;
- Shortage Loss:
, where the shortage loss per unit of goods is , 30% of the purchase fee, and the profit of goods is 30%, which can be represented as ;
- Initial Inventory Level:
The inventory amount of goods on the first day is 5, that is ;
In this case, to optimize inventory decision parameters, including order quantities and replenishment strategies, the Chicken Swarm Optimization algorithm was employed. This is an optimization algorithm that simulates the social behavior of chicken flocks, searching for optimal solutions by imitating the hierarchy and behavior patterns within chicken flocks. During the iterative process, the Chicken Swarm Optimization algorithm continuously updates the position of each solution (i.e., inventory strategy), adjusting order quantities and replenishment strategies until finding the optimal inventory strategy that minimizes costs. Furthermore, to save on computation time, a parallel computing strategy was adopted to improve the Chicken Swarm Optimization algorithm. This takes advantage of parallel processing to accelerate the process of finding the optimal inventory strategy. This method significantly enhances the efficiency of the algorithm by evaluating multiple solutions (i.e., multiple inventory strategies) simultaneously and updating the positions of chickens (i.e., adjusting strategies) in parallel. The PCSO algorithm pseudocode is presented as follows (see Algorithm 1).
| Algorithm 1 PCSO pseudocode. |
| Input: P Chicken Swarm Size N, Maximum Number of Iterations T, Hierarchy Division Ratio P. Output: Optimal Inventory Strategy S*. Initialization Parallel generation of N chicken’s initial positions representing potential inventory strategy solutions for t = 1 to T do Parallel fitness evaluation: for each chicken i in N do Fi←calculate fitness (Si) end for Sort the flock according to {Fi} and divide into roosters, hens, and chicks based on P Select the chicken with the top Fi as the leader Parallel position updates: for each rooster i do Parallel execution Si← update rooster position (Si, Fi) end for for each hen i do Parallel execution Si← update hen position (Si, Fi) end for for each chick i do Parallel execution Si← update chick position (Si, Fi) end for Parallel re-evaluation of fitness: for each chicken i in N do Fi←calculate fitness (Si) end for if termination conditions are met then Output current optimal solution S* and exit end if end for Output final optimal solution S* |
Through this process, the Parallel Chicken Swarm Optimization algorithm is able to find the optimal strategy with the lowest cost among multiple potential inventory strategies.
4.4. Result
The following table presents the optimal inventory strategy obtained in this case (see Table 6), describing the daily inventory level, demand volume, initial replenishment quantity, and the decided (s, S) parameters. Due to the total test data comprising 29,355 items, and because it is inconvenient to display all data fully, only 30 items are shown here.
Table 6.
Partial simulation results of the optimal inventory strategy.
From the results (see Table 7), the total cost was significantly reduced to approximately 33.5 million, while maintaining a service level of 76.15%. This indicates that the adopted strategy can effectively reduce inventory holding and operational costs while maintaining customer satisfaction. The total program running time was 182 s, demonstrating the efficiency of this optimization algorithm in practical applications. Overall, the precise adjustment of inventory strategy parameters in our model achieves an optimal balance between cost efficiency and service level, even amid significant demand fluctuations. This highlights the PCSO algorithm’s effectiveness in enhancing both the responsiveness and flexibility of inventory strategies. Crucially, the algorithm contributes significantly to sustainable development within supply chain operations. By dynamically adjusting inventory parameters in real time, our model minimizes unnecessary stock levels and reduces waste, thereby mitigating the environmental impact associated with overproduction and excess inventory. This strategy aligns closely with sustainable business practices, offering a robust tool for companies aiming to achieve economic efficiency without compromising environmental responsibilities. The results emphasize the PCSO algorithm’s capability to tackle complex inventory challenges in dynamic market conditions, establishing it as an essential component in the pursuit of sustainable supply chain management.
Table 7.
Objective function results table.
To verify the superiority of the model under sustainable inventory strategy management, this experiment also compared two algorithms used in inventory management optimization, Zhao W et al. used PSO [50] and Zeng Yet al. used DE [51]. The effectiveness and efficiency of PCSO and these two algorithms were analyzed, and the results are shown in Table 8.
Table 8.
Comparison of the effectiveness and efficiency of algorithm iteration 50 times.
After running 50 consecutive algorithm comparisons, DE and PSO showed lower total costs, but PCSO performed well in terms of service level, achieving an excellent service level of 0.761. In contrast, DE was 0.706 and PSO was 0.695. In addition, PCSO shows significant advantages in runtime efficiency, with an average of only about 83 s, while DE is 516 s and PSO is 146 s. This comparison highlights the excellent balance between service quality and operational efficiency of PCSO, making it a valuable tool for companies aimed at enhancing supply chain sustainability in dynamic market environments.
Next, we conduct sensitivity analysis on different parameters to achieve a more realistic simulation environment, thereby testing the adaptability of the model.
- When the price is fixed and LT = 1:
Changing the lead time from 3 to 1 affects the supply chain’s response speed and flexibility. By comparing these two scenarios, one can evaluate the impact of changes in lead time length on supply chain operational efficiency, including inventory management and order fulfillment speed. Secondly, a shorter lead time typically means lower inventory levels and higher inventory turnover rates, but this may require higher logistics efficiency and costs. By comparison, the specific impact of longer versus shorter lead times on inventory costs and service levels can be assessed;
- When price fluctuates and LT = 3:
Comparing situations with price fluctuations to those with fixed prices, the supply chain requires more complex risk management strategies to cope with the uncertainty brought about by price changes. Comparative analysis helps evaluate the effectiveness of risk management under the same lead times in different pricing environments. Additionally, facing price fluctuations, the supply chain might need to adjust its replenishment strategies to adapt to price changes. By comparing with fixed price scenarios, one can assess the supply chain’s service level and cost-control capabilities when facing price volatility.
The sensitivity analysis on lead time and price demonstrates that when the lead time is shortened (see Figure 6 and Figure 7), there is a decrease in initial total cost and replenishment quantity, but an increase in service level, which eventually stabilizes. This indicates the model’s capability to adapt promptly to changes in lead time. When price fluctuations occur, the result indicators remain relatively stable, suggesting that the model can adapt well to price changes. Therefore, the sensitivity analysis of these two parameters shows a high level of adaptability of the model to different changes.
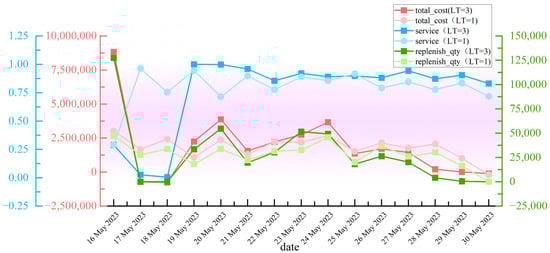
Figure 6.
Comparison of results under lead time changes (The comparison data of sensitivity calculation results are stored in: https://datadryad.org/stash/share/GpBNnow4kL5uGnCjg9NaItNlRmljcS68zM3J6DfeUy8 (accessed on 1 April 2024)).
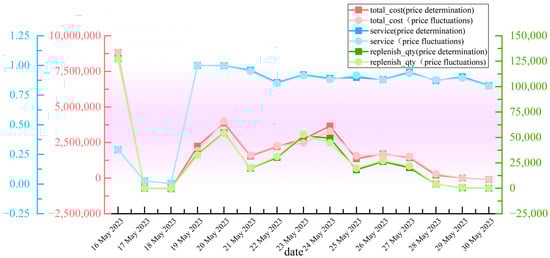
Figure 7.
Comparison of results under price fluctuations (The comparison data of sensitivity calculation results are stored in: https://datadryad.org/stash/share/GpBNnow4kL5uGnCjg9NaItNlRmljcS68zM3J6DfeUy8 (accessed on 1 April 2024)).
Through the analysis and application of the optimal inventory strategy, businesses can achieve automation and intelligence in inventory management, which enhances operational efficiency and customer service levels while simultaneously reducing costs. Importantly, this approach contributes to sustainability by optimizing inventory levels to reduce waste and minimize the environmental impact associated with overproduction and excess inventory. Moreover, the benefits of this method extend beyond the e-commerce retail industry, offering significant advantages to any sector requiring precise inventory management. By implementing these strategies, companies can not only improve their economic performance but also support sustainable business practices that are crucial in today’s environmentally conscious market. This broad applicability underscores the potential of advanced inventory management techniques to contribute to a more sustainable and efficient global supply chain.
5. Conclusions and Recommendations
In this study, we propose an innovative supply chain inventory management model tailored for the e-commerce retail sector, addressing the critical challenges of inventory management. This model integrates the Economic Order Quantity (EOQ) model, the (s, S) inventory policy, and the Parallel Chicken Swarm Optimization (PCSO) algorithm to optimize inventory costs and service levels, significantly reducing resource wastage and advancing towards a circular economy. By optimizing the supply volume, our model effectively reduces carbon emissions, contributing substantially to sustainable development both economically and environmentally.
A key innovation in this study is the application of the PCSO algorithm to inventory management. This algorithm enhances the efficiency and accuracy of inventory decisions by simulating the social behavior of chicken swarms, thereby allowing for dynamic and precise adjustments to inventory parameters in response to market fluctuations such as lead time reductions and price changes. This method not only provides a robust framework for handling large volumes of data but also improves the adaptability and flexibility of supply chain operations, making it a potent tool in promoting sustainability in inventory management.
Additionally, our recommendations for enhancing supply chain management emphasize the importance of maintaining flexible and adaptable inventory strategies to respond effectively to dynamic market conditions, thereby promoting economic sustainability. By leveraging advanced optimization algorithms, businesses can elevate the automation and intelligence of inventory decisions, ensuring the continued effectiveness and relevance of these strategies through regular monitoring and adjustment.
However, this model still has shortcomings, and future research needs to make improvements in the following aspects: Firstly, empirical research and case analysis of the model can be further enriched to verify its applicability and effectiveness in different industries and market environments. Additionally, exploring the integration of this model with other optimization techniques and machine learning methods can further enhance the model’s performance and application range. Through these improvements, the inventory management model proposed in this study will provide a more effective and practical solution for the e-commerce retail industry and even the broader field of supply chain management sustainability.
Author Contributions
Conceptualization, H.Z. and X.M.; methodology, S.L. and X.M.; software, S.L.; validation, S.T. and H.Z.; formal analysis, S.T.; investigation, S.T.; resources, S.L.; data curation, S.L.; writing—original draft preparation, S.T.; writing—review and editing, H.Z.; visualization, S.L.; supervision, H.Z.; project administration, H.Z.; funding acquisition, H.Z. and X.M. All authors have read and agreed to the published version of the manuscript.
Funding
This research was funded by the National Science Foundation of Zhejiang Province (grant number: LY20A010012) and the Ningbo Philosophy and Social Science Research Base Project (grant number: JD6-017).
Institutional Review Board Statement
Not applicable.
Informed Consent Statement
Not applicable.
Data Availability Statement
Data are contained within the article and https://datadryad.org/stash/share/b_WroGElo3QmfnnkxdHlCjIF7izMEYvP2TvDkvVDW8c (accessed on 1 April 2024).
Acknowledgments
We would like to show our greatest appreciation to anonymous reviewers editors, the County Industrial Digitization Research Base (the sixth round of Ningbo Philosophy and Social Science Research Base), and those who have helped to contribute to writing this paper.
Conflicts of Interest
The authors declare no conflicts of interest.
References
- Becerra, P.; Mula, J.; Sanchis, R. Sustainable inventory management in supply chains: Trends and further research. Sustainability 2022, 14, 2613. [Google Scholar] [CrossRef]
- Salas-Navarro, K.; Serrano-Pájaro, P.; Ospina-Mateus, H.; Zamora-Musa, R. Inventory models in a sustainable supply chain: A bibliometric analysis. Sustainability 2022, 14, 6003. [Google Scholar] [CrossRef]
- Gonzalez-Ayala, P.; Alejo-Reyes, A.; Cuevas, E.; Mendoza, A. A modified simulated annealing (MSA) algorithm to solve the supplier selection and order quantity allocation problem with non-linear freight rates. Axioms 2023, 12, 459. [Google Scholar] [CrossRef]
- Piao, M.; Zhang, D.; Lu, H.; Li, R. A supply chain inventory management method for civil aircraft manufacturing based on multi-agent reinforcement learning. Appl. Sci. 2023, 13, 7510. [Google Scholar] [CrossRef]
- Nobil, A.H.; Nobil, E.; Cárdenas-Barrón, L.E.; Garza-Núñez, D.; Treviño-Garza, G.; Céspedes-Mota, A.; Loera-Hernández, I.d.J.; Smith, N.R. Discontinuous economic growing quantity inventory model. Mathematics 2023, 11, 3258. [Google Scholar] [CrossRef]
- Patil, H.; Divekar, B.R. Inventory management challenges for B2C e-commerce retailers. Procedia Econ. Financ. 2014, 11, 561–571. [Google Scholar] [CrossRef]
- Harris, F.W. How many parts to make at once. Oper. Res. 1990, 38, 947–950. [Google Scholar] [CrossRef]
- Li, M.; Mizuno, S. Comparison of dynamic and static pricing strategies in a dual-channel supply chain with inventory control. Transp. Res. Part E Logist. Transp. Rev. 2022, 165, 102843. [Google Scholar] [CrossRef]
- Meng, X.; Liu, Y.; Gao, X.; Zhang, H. A new bio-inspired algorithm: Chicken swarm optimization. In Advances in Swarm Intelligence: 5th International Conference, ICSI 2014, Part I; Springer International Publishing: Cham, Switzerland, 2014; pp. 86–94. [Google Scholar]
- Vhatkar, M.S.; Raut, R.D.; Gokhale, R.; Cheikhrouhou, N.; Akarte, M. A glimpse of the future sustainable digital omnichannel retailing emerges—A systematic literature review. J. Clean. Prod. 2024, 18, 141111. [Google Scholar] [CrossRef]
- Ma, B.; Mao, B.; Liu, S.; Meng, F.; Liu, J. Managing physical inventory and return policies in omnichannel retailing. Comput. Ind. Eng. 2024, 42, 109986. [Google Scholar] [CrossRef]
- Zhang, Y.; Hu, X.; Yao, G.; Xu, L. Coupon promotion and inventory strategies of a supplier considering an e-commerce platform’s omnichannel coupons. J. Retail. Consum. Serv. 2024, 77, 103625. [Google Scholar] [CrossRef]
- Guan, Z.; Mou, Y.; Zhang, J. Incorporating risk aversion and time preference into omnichannel retail operations considering assortment and inventory optimization. Eur. J. Oper. Res. 2024, 314, 579–596. [Google Scholar] [CrossRef]
- Li, M.; Shao, S.; Ye, Q.; Xu, G.; Huang, G.Q. Blockchain-enabled logistics finance execution platform for capital-constrained E-commerce retail. Robot. Comput.-Integr. Manuf. 2020, 65, 101962. [Google Scholar] [CrossRef]
- Taleizadeh, A.A.; Khanbaglo MP, S.; Cárdenas-Barrón, L.E. An EOQ inventory model with partial backordering and reparation of imperfect products. Int. J. Prod. Econ. 2016, 182, 418–434. [Google Scholar] [CrossRef]
- Tang, O.; Grubbström, R.W. Considering stochastic lead times in a manufacturingremanufacturing system with deterministic demands and returns. Int. J. Prod. Econ. 2005, 93, 285–300. [Google Scholar] [CrossRef]
- Chuang, C.H.; Chiang, C.Y. Dynamic and stochastic behavior of coefficient of demand uncertainty incorporated with EOQ variables: An application in finished-goods inventory from General Motors’ dealerships. Int. J. Prod. Econ. 2016, 172, 95–109. [Google Scholar] [CrossRef]
- Bakal, İ.S.; Bayındır, Z.P.; Emer, D.E. Value of disruption information in an EOQ environment. Eur. J. Oper. Res. 2017, 263, 446–460. [Google Scholar] [CrossRef]
- Deng, Q.W.; Liao, H.L.; Xu, B.W.; Liu, X.H. The resource benefits evaluation model on remanufacturing processes of end-of-life construction machinery under the uncertainty in recycling price. Sustainability 2017, 9, 256–282. [Google Scholar] [CrossRef]
- Lee, D.H.; Dong, M.; Bian, W. The design of sustainable logistics network under uncertainty. Int. J. Prod. Econ. 2010, 128, 159–166. [Google Scholar] [CrossRef]
- Giri, B.C.; Sharma, S. Optimal production policy for a closed-loop hybrid system with uncertain demand and return under supply disruption. J. Clean. Prod. 2016, 112, 2015–2028. [Google Scholar] [CrossRef]
- Jena, S.K.; Sarmah, S.P. Price and service co-opetiton under uncertain demand and condition of used items in a remanufacturing system. Int. J. Prod. Econ. 2016, 173, 1–21. [Google Scholar] [CrossRef]
- Peng, H.; Shen, N.; Liao, H.; Xue, H.; Wang, Q. Uncertainty factors, methods, and solutions of closed-loop supply chain—A review for current situation and future prospects. J. Clean. Prod. 2020, 254, 120032. [Google Scholar] [CrossRef]
- Amin, S.H.; Zhang, G. A multi-objective facility location model for closed-loop supply chain network under uncertain demand and return. Appl. Math. Model. 2013, 37, 4165–4176. [Google Scholar] [CrossRef]
- Zhai, H.; Liu, Y.K.; Yang, K. Modeling two-stage UHL problem with uncertain demands. Appl. Math. Model. 2016, 40, 3029–3048. [Google Scholar] [CrossRef]
- Mutha, A.; Bansal, S.; Guide, V.D.R. Managing demand uncertainty through core acquisition in remanufacturing. Prod. Oper. Manag. 2016, 25, 1449–1464. [Google Scholar] [CrossRef]
- Thinakaran, N.; Jayaprakas, J.; Elanchezhian, C. Survey on inventory model of EOQ & EPQ with partial backorder problems. Mater. Today Proc. 2019, 16, 629–635. [Google Scholar]
- Liao, H.; Li, L. Environmental sustainability EOQ model for closed-loop supply chain under market uncertainty: A case study of printer remanufacturing. Comput. Ind. Eng. 2021, 151, 106525. [Google Scholar] [CrossRef]
- Mak, K.L.; Lai, K.K.; Ng, W.C.; Yiu, K.F. Analysis of optimal opportunistic replenishment policies for inventory systems by using a (s, S) model with a maximum issue quantity restriction. Eur. J. Oper. Res. 2005, 166, 385–405. [Google Scholar] [CrossRef]
- Avci, M.G.; Selim, H. A multi-objective simulation-based optimization approach for inventory replenishment problem with premium freights in convergent supply chains. Omega 2018, 80, 153–165. [Google Scholar] [CrossRef]
- Fan, T.; Xu, C.; Tao, F. Dynamic pricing and replenishment policy for fresh produce. Comput. Ind. Eng. 2020, 139, 106127. [Google Scholar] [CrossRef]
- Lam, H.Y.; Ho, G.T.; Mo, D.Y.; Tang, V. Responsive pick face replenishment strategy for stock allocation to fulfil e-commerce order. Int. J. Prod. Econ. 2023, 264, 108976. [Google Scholar] [CrossRef]
- Tian, R.; Lu, M.; Wang, H.; Wang, B.; Tang, Q. IACPPO: A deep reinforcement learning-based model for warehouse inventory replenishment. Comput. Ind. Eng. 2024, 187, 109829. [Google Scholar] [CrossRef]
- Namir, K.; Labriji, H. Decision support tool for dynamic inventory management using machine learning, time series and combinatorial optimization. Procedia Comput. Sci. 2022, 198, 423–428. [Google Scholar] [CrossRef]
- Tsou, C.M. On the strategy of supply chain collaboration based on dynamic inventory target level management: A theory of constraint perspective. Appl. Math. Model. 2013, 37, 5204–5214. [Google Scholar] [CrossRef]
- Tan, B.; Karabati, S. Retail inventory management with stock-out based dynamic demand substitution. Int. J. Prod. Econ. 2013, 145, 78–87. [Google Scholar] [CrossRef]
- Kohneh, J.N.; Amirdadi, M.; Teimoury, E. An optimization framework for COVID-19 vaccine allocation and inventory management: A case study. Appl. Soft Comput. 2023, 132, 109801. [Google Scholar] [CrossRef] [PubMed]
- Suemitsu, I.; Miyashita, N.; Hosoda, J.; Shimazu, Y.; Nishikawa, T.; Izui, K. Integration of sales, inventory, and transportation resource planning by dynamic-demand joint replenishment problem with time-varying costs. Comput. Ind. Eng. 2024, 188, 109922. [Google Scholar] [CrossRef]
- Ortega, E.J.; Malicki, S.; Doerner, K.F.; Minner, S. Stochastic inventory routing with dynamic demands and intra-day depletion. Comput. Oper. Res. 2024, 163, 106503. [Google Scholar] [CrossRef]
- Saha, C.; Jana, D.K.; Duary, A. Enhancing production inventory management for imperfect items using fuzzy optimization strategies and Differential Evolution (DE) algorithms. Frankl. Open 2023, 5, 100051. [Google Scholar] [CrossRef]
- Afifi, S.; Hrouga, M.; Mjirda, A.; Allaoui, H. A memetic based algorithm for simultaneous preventive maintenance scheduling and spare-parts inventory management for manufacturing systems. Appl. Soft Comput. 2024, 151, 111161. [Google Scholar] [CrossRef]
- de Paula Vidal, G.H.; Caiado, R.G.; Scavarda, L.F.; Ivson, P.; Garza-Reyes, J.A. Decision support framework for inventory management combining fuzzy multicriteria methods, genetic algorithm, and artificial neural network. Comput. Ind. Eng. 2022, 174, 108777. [Google Scholar] [CrossRef]
- Varga, T.; Király, A.; Abonyi, J. Improvement of PSO Algorithm by Memory-Based Gradient Search—Application in Inventory Management. In Swarm Intelligence and Bio-Inspired Computation; Elsevier: Amsterdam, The Netherlands, 2013; Volume 15, pp. 403–422. [Google Scholar]
- Shin, J.; Lee, J.H. MDP formulation and solution algorithms for inventory management with multiple suppliers and supply and demand uncertainty. Comput. Aided Chem. Eng. 2015, 37, 1907–1912. [Google Scholar]
- Yu, V.F.; Salsabila, N.Y.; Siswanto, N.; Kuo, P.-H. A two-stage genetic algorithm for joint coordination of spare parts inventory and planned maintenance under uncertain failures. Appl. Soft Comput. 2022, 130, 109705. [Google Scholar] [CrossRef]
- Affonso, T.B.; Conceição, S.V.; Muniz, L.R.; de Freitas Almeida, J.F.; de Lima, J.C. A new hybrid forecasting method for spare part inventory management using heuristics and bootstrapping. Decis. Anal. J. 2024, 24, 100415. [Google Scholar] [CrossRef]
- Komariah, K. Penerapan Metode EOQ (Economic Order Quantity) dalam Pengendalian Persediaan Bahan Baku. J. Manag. Bussines 2022, 4, 42–49. [Google Scholar]
- Dai, B.; Chen, H.; Li, Y.; Zhang, Y.; Wang, X.; Deng, Y. An alternating direction method of multipliers for optimizing (s, S) policies in a distribution system with joint replenishment volume constraints. Omega 2023, 116, 102800. [Google Scholar] [CrossRef]
- Shi, X. Research on Swarm Intelligence Algorithms Based on Particle Swarm Optimization and Chicken Swarm Optimization; Ningxia University: Yinchuan, China, 2018. [Google Scholar]
- Zhao, W.; Zhang, M. Supply Chain Inventory Optimization Based on Dual-Strategy Search Particle Swarm Algorithm. Autom. Instrum. 2023, 5, 110–113+123. [Google Scholar] [CrossRef]
- Zeng, Y.; Wan, J.; Lü, S.; Wang, S.; Wang, L. Collaborative Optimization of Supplier Selection and Order Quantity Allocation Under Joint Replenishment Strategy. Control. Decis. 2019, 8, 1714–1722. [Google Scholar] [CrossRef]
Disclaimer/Publisher’s Note: The statements, opinions and data contained in all publications are solely those of the individual author(s) and contributor(s) and not of MDPI and/or the editor(s). MDPI and/or the editor(s) disclaim responsibility for any injury to people or property resulting from any ideas, methods, instructions or products referred to in the content. |
© 2024 by the authors. Licensee MDPI, Basel, Switzerland. This article is an open access article distributed under the terms and conditions of the Creative Commons Attribution (CC BY) license (https://creativecommons.org/licenses/by/4.0/).