
Digital Technologies Adoption and Economic Benefits in Agriculture: A Mixed-Methods Approach


Abstract
1. Introduction
- (1)
- What internal and external factors influence the intensity of DTs adoption among growers?
- (2)
- How do these factors contribute to enhancing growers’ adoption intensity of DTs?
- (3)
- Has the heightened adoption intensity of DTs led to improved economic benefits for growers?
2. Research Design
3. Quantitative Study
3.1. Materials and Methods
3.1.1. Research Hypothesis
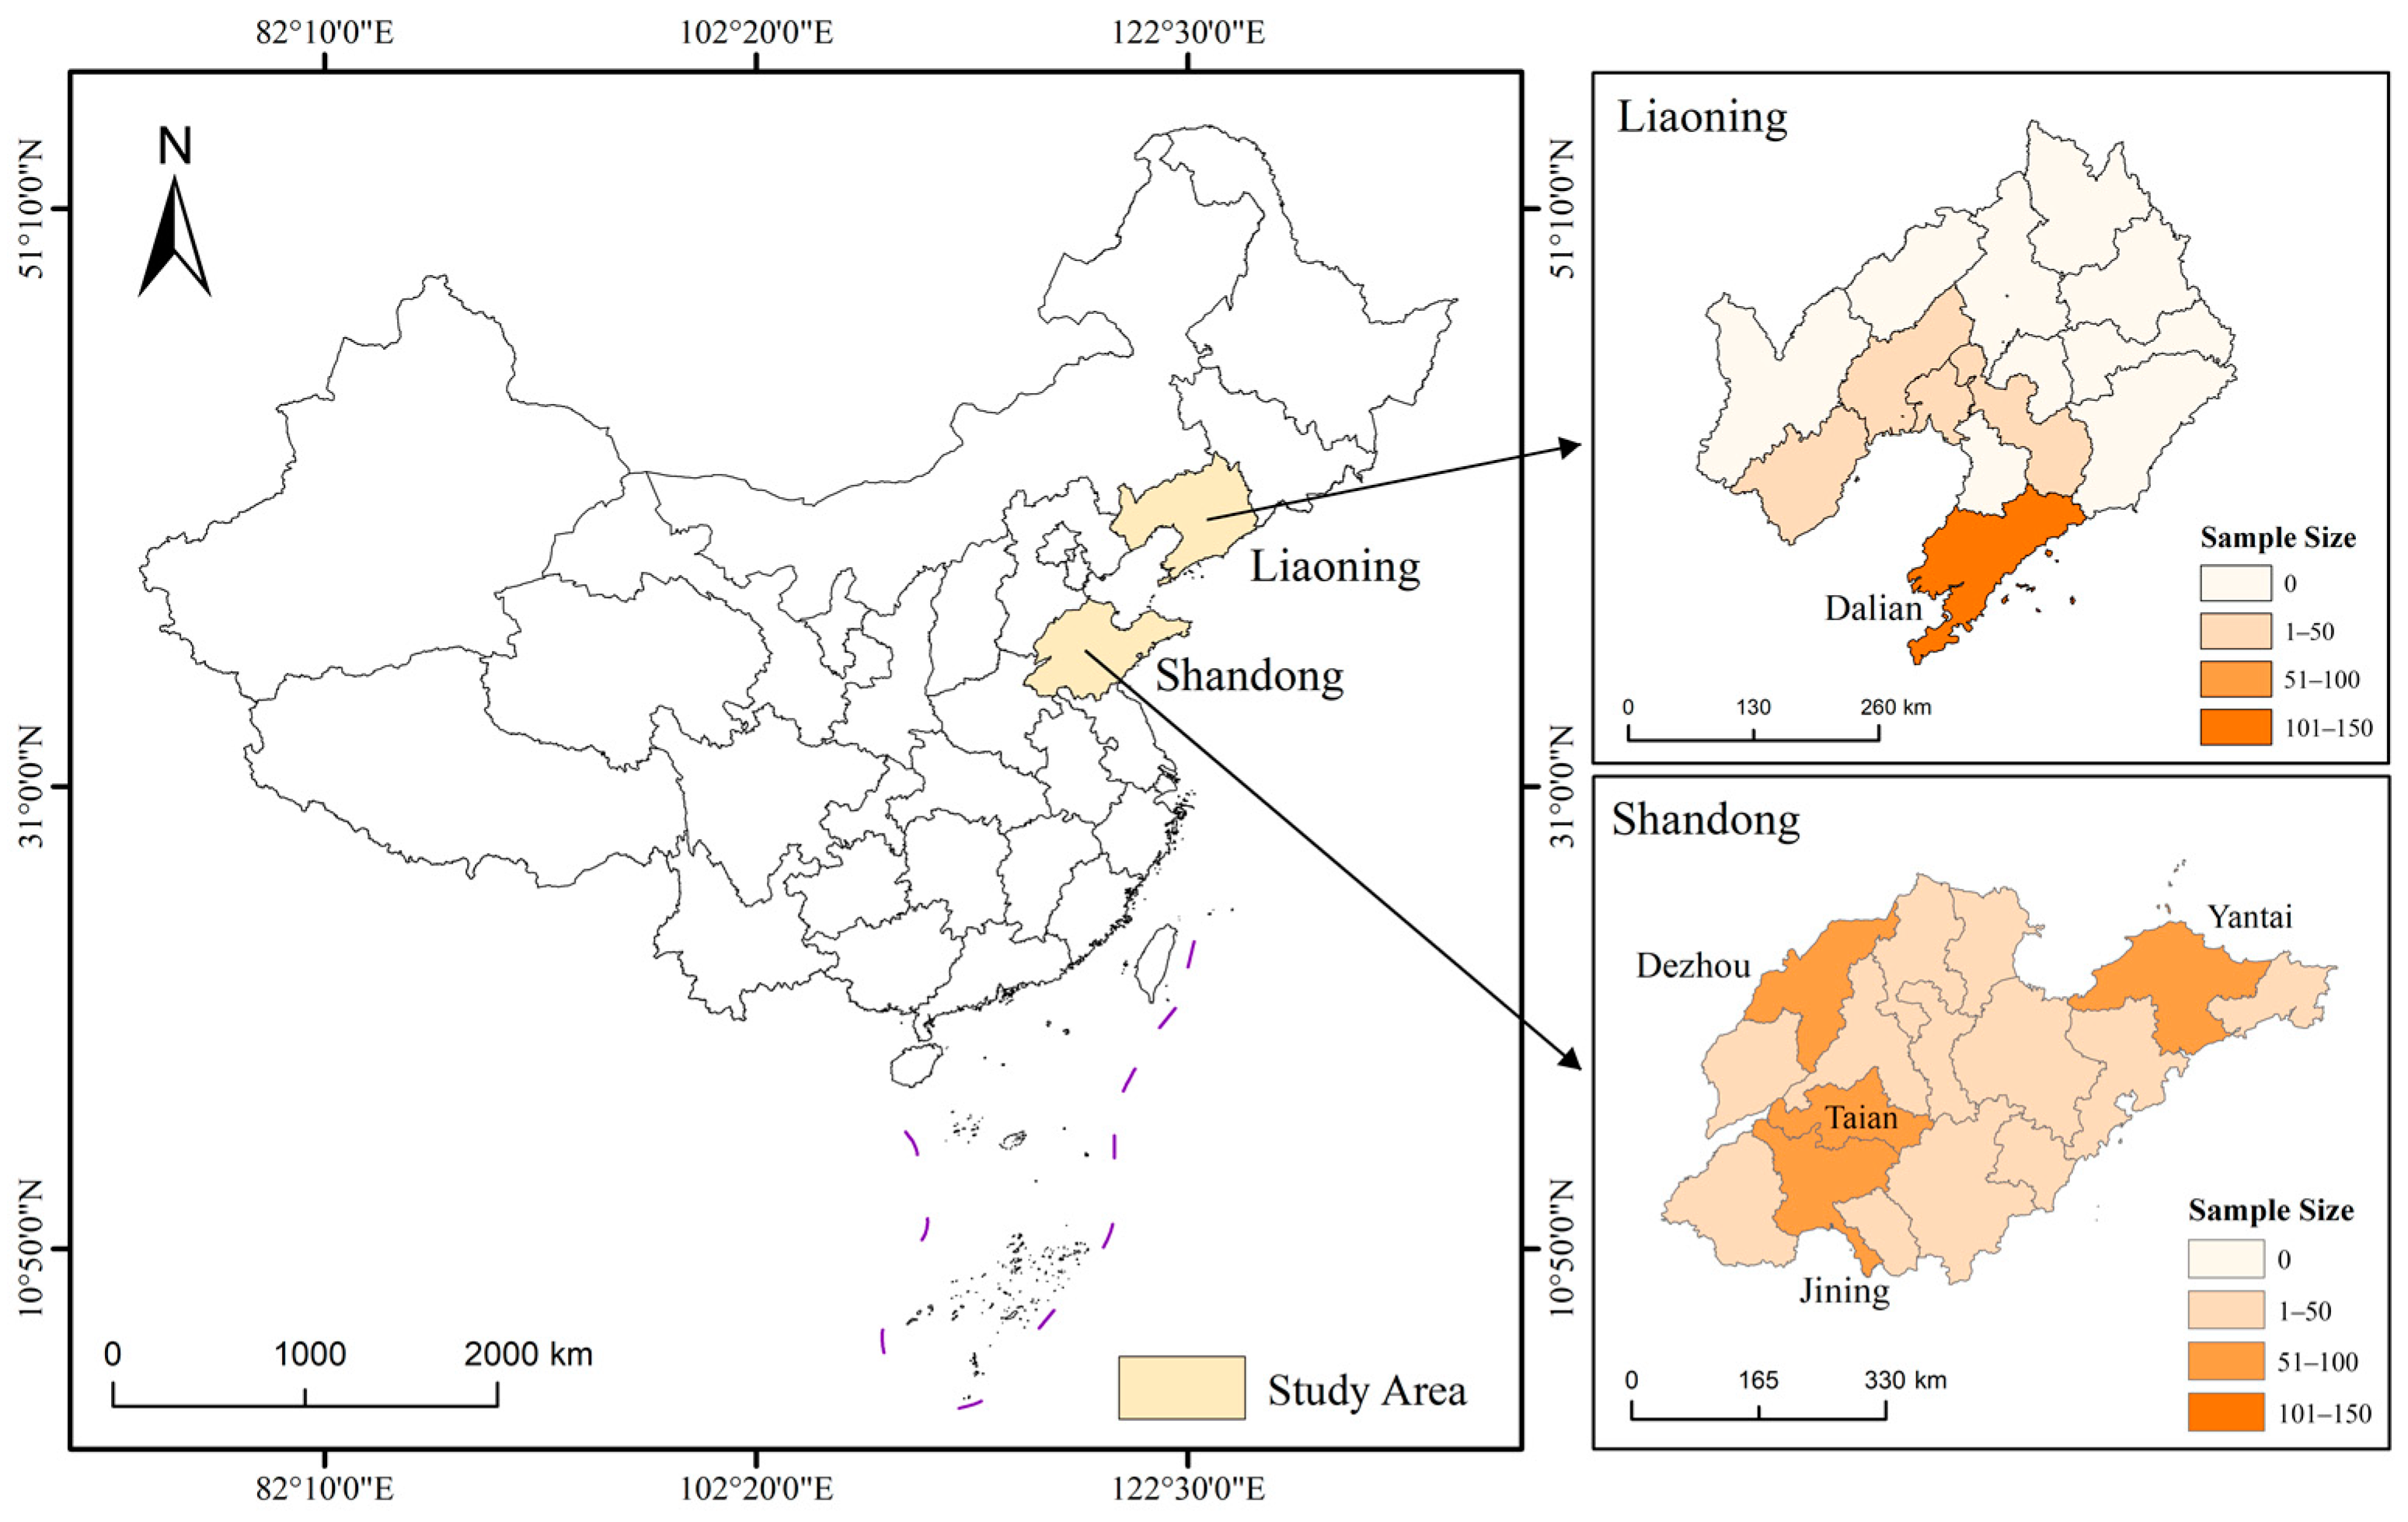
3.1.2. Data Collection
3.1.3. Variable Measure
3.1.4. Regression Analysis
3.2. Results of Quantitative Study
3.2.1. Descriptive Statistics
3.2.2. Test of Reliability and Validity
3.2.3. Factors Influencing DTs Adoption Intensity
3.2.4. Impact of DTs Adoption Intensity on Economic Benefits
3.2.5. Sensitivity Analysis
4. Qualitative Study
4.1. Method and Material
4.1.1. Data Collection
4.1.2. Data Analysis
4.2. Results of Qualitative Study
4.2.1. Factors Influencing DTs Adoption Intensity
4.2.2. Impact of DTs Adoption Intensity on Economic Benefits
5. Discussion
5.1. Discussion of Factors Influencing DTs Adoption Intensity
5.2. DTs Adoption Intensity on Economic Benefit
5.3. Limitation
6. Conclusions and Policy Implications
Author Contributions
Funding
Institutional Review Board Statement
Informed Consent Statement
Data Availability Statement
Acknowledgments
Conflicts of Interest
Appendix A. Survey Questionnaire on Growers’ Digital Technology Adoption

| Part 1. Individual and Agricultural Production Characteristics | |||||
| 1. Sex: | |||||
| 2. Age: | |||||
| 3. Years of education: | |||||
| 4. Geographical location: | |||||
| 5. Ho many years you involved in cultivation: | |||||
| 6. What is the main crop you cultivated: | |||||
| 7. What is the area you cultivation (mu): | |||||
| 8. The fixed laborers you employ: | |||||
| 9. The number of digital technology training sessions attended over the past three years: | |||||
| 10. What is the output value of cultivation over the past three years (yuan/mu/year): | |||||
| 11. What is the total cost of cultivation over the past three years (yuan/mu/year): | |||||
| 12. Over the last three years, has agricultural production and operations been impacted by COVID-19: ◯ No impacts ◯ Low impacts ◯ Moderate impacts ◯ High impacts | |||||
| Part 2. The digital technology adoption status | |||||
| 13. The digital technologies you currently adopted are as follows: | |||||
| ◯ Digital sensors | |||||
| ◯ Precision irrigation systems | |||||
| ◯ Precision fertilization systems | |||||
| ◯ Unmanned aerial vehicles | |||||
| 14. The proportion of peers in your county applying digital technologies for agricultural production: | |||||
| 15. Over the next five years, what is the likely trend regarding your adoption of digital technologies: ◯ Decrease ◯ Maintain status quo ◯ Increase ◯ Uncertain | |||||
| Part 3. Influencing factors | |||||
| 16. In terms of factors, please choose the option that best suits you: | |||||
| Grower’s knowledge | Strongly disagree | Disagree | Neutral | Agree | Strongly agree |
| You have heard about and gained knowledge about these digital technologies. | ◯ | ◯ | ◯ | ◯ | ◯ |
| You are very familiar with the functionalities and prospects of these digital technologies in the agricultural sector. | ◯ | ◯ | ◯ | ◯ | ◯ |
| You are willing to undergo training in digital technologies when given the opportunity. | ◯ | ◯ | ◯ | ◯ | ◯ |
| Technology compatibility | Strongly disagree | Disagree | Neutral | Agree | Strongly agree |
| The application of digital technologies can solve the difficulties currently faced by your farm. | ◯ | ◯ | ◯ | ◯ | ◯ |
| Digital technologies can be compatible with your farm’s existing software and hardware. | ◯ | ◯ | ◯ | ◯ | ◯ |
| The application of digital technologies aligns with the organizational culture and value system of your farm. | |||||
| Government support | Strongly disagree | Disagree | Neutral | Agree | Strongly agree |
| Your farm’s adoption of digital technologies can benefit from government policies and financial support. | ◯ | ◯ | ◯ | ◯ | ◯ |
| The government supports various agricultural information and digitization projects of your farm. | ◯ | ◯ | ◯ | ◯ | ◯ |
| The government encourages farms to adopt digital technologies by promoting successful cases and technical training. | ◯ | ◯ | ◯ | ◯ | ◯ |
| Competitive pressure | Strongly disagree | Disagree | Neutral | Agree | Strongly agree |
| Under competitive pressure, you have no choice but to adopt digital technologies. | ◯ | ◯ | ◯ | ◯ | ◯ |
| Applying digital technologies can provide you with more competitive advantages. | ◯ | ◯ | ◯ | ◯ | ◯ |
| If peers or competitors adopt digital technologies, you are also inclined to adopt it. | ◯ | ◯ | ◯ | ◯ | ◯ |
| The questionnaire concludes here. Thank you once more for your support and cooperation. Wishing you a productive and enjoyable work ahead! | |||||
References
- Klerkx, L.; Rose, D. Dealing with the Game-Changing Technologies of Agriculture 4.0: How Do We Manage Diversity and Responsibility in Food System Transition Pathways? Glob. Food Secur. 2020, 24, 100347. [Google Scholar] [CrossRef]
- Lezoche, M.; Hernandez, J.E.; Alemany Díaz, M.d.M.E.; Panetto, H.; Kacprzyk, J. Agri-Food 4.0: A Survey of the Supply Chains and Technologies for the Future Agriculture. Comput. Ind. 2020, 117, 103187. [Google Scholar] [CrossRef]
- Gebresenbet, G.; Bosona, T.; Patterson, D.; Persson, H.; Fischer, B.; Mandaluniz, N.; Chirici, G.; Zacepins, A.; Komasilovs, V.; Pitulac, T.; et al. A Concept for Application of Integrated Digital Technologies to Enhance Future Smart Agricultural Systems. Smart Agric. Technol. 2023, 5, 100255. [Google Scholar] [CrossRef]
- Regan, Á. ‘Smart Farming’ in Ireland: A Risk Perception Study with Key Governance Actors. NJAS—Wagening. J. Life Sci. 2019, 90–91, 100292. [Google Scholar] [CrossRef]
- Rotz, S.; Gravely, E.; Mosby, I.; Duncan, E.; Finnis, E.; Horgan, M.; LeBlanc, J.; Martin, R.; Neufeld, H.T.; Nixon, A.; et al. Automated Pastures and the Digital Divide: How Agricultural Technologies Are Shaping Labour and Rural Communities. J. Rural Stud. 2019, 68, 112–122. [Google Scholar] [CrossRef]
- Kitole, F.A.; Mkuna, E.; Sesabo, J.K. Digitalization and Agricultural Transformation in Developing Countries: Empirical Evidence from Tanzania Agriculture Sector. Smart Agric. Technol. 2024, 7, 100379. [Google Scholar] [CrossRef]
- Carolan, M. Publicising Food: Big Data, Precision Agriculture, and Co-Experimental Techniques of Addition. Sociol. Rural. 2017, 57, 135–154. [Google Scholar] [CrossRef]
- Wolfert, S.; Ge, L.; Verdouw, C.; Bogaardt, M.-J. Big Data in Smart Farming—A Review. Agric. Syst. 2017, 153, 69–80. [Google Scholar] [CrossRef]
- Lioutas, E.D.; Charatsari, C.; De Rosa, M. Digitalization of Agriculture: A Way to Solve the Food Problem or a Trolley Dilemma? Technol. Soc. 2021, 67, 101744. [Google Scholar] [CrossRef]
- Abiri, R.; Rizan, N.; Balasundram, S.K.; Shahbazi, A.B.; Abdul-Hamid, H. Application of Digital Technologies for Ensuring Agricultural Productivity. Heliyon 2023, 9, e22601. [Google Scholar] [CrossRef]
- McFadden, J. Precision Agriculture in the Digital Era: Recent Adoption on U.S. Farms; USDA Economic Research Service: Washington, DC, USA, 2023.
- Zul Azlan, Z.H.; Junaini, S.N.; Bolhassan, N.A.; Wahi, R.; Arip, M.A. Harvesting a Sustainable Future: An Overview of Smart Agriculture’s Role in Social, Economic, and Environmental Sustainability. J. Clean. Prod. 2024, 434, 140338. [Google Scholar] [CrossRef]
- Koutsos, T.; Menexes, G. Economic, Agronomic, and Environmental Benefits from the Adoption of Precision Agriculture Technologies: A Systematic Review. Int. J. Agric. Environ. Inf. Syst. (IJAEIS) 2019, 10, 40–56. [Google Scholar] [CrossRef]
- Wolfert, S.; Isakhanyan, G. Sustainable Agriculture by the Internet of Things—A Practitioner’s Approach to Monitor Sustainability Progress. Comput. Electron. Agric. 2022, 200, 107226. [Google Scholar] [CrossRef]
- Kayad, A.; Sozzi, M.; Gatto, S.; Whelan, B.; Sartori, L.; Marinello, F. Ten Years of Corn Yield Dynamics at Field Scale under Digital Agriculture Solutions: A Case Study from North Italy. Comput. Electron. Agric. 2021, 185, 106126. [Google Scholar] [CrossRef]
- Far, S.T.; Rezaei-Moghaddam, K. Impacts of the Precision Agricultural Technologies in Iran: An Analysis Experts’ Perception & Their Determinants. Inf. Process. Agric. 2018, 5, 173–184. [Google Scholar]
- Abate, G.T.; Abay, K.A.; Chamberlin, J.; Kassim, Y.; Spielman, D.J.; Tabe-Ojong, M.P., Jr. Digital Tools and Agricultural Market Transformation in Africa: Why Are They Not at Scale yet, and What Will It Take to Get There? Food Policy 2023, 116, 102439. [Google Scholar] [CrossRef]
- Deichmann, U.; Goyal, A.; Mishra, D. Will Digital Technologies Transform Agriculture in Developing Countries? Agric. Econ. 2016, 47, 21–33. [Google Scholar] [CrossRef]
- Visser, O.; Sippel, S.R.; Thiemann, L. Imprecision Farming? Examining the (in)Accuracy and Risks of Digital Agriculture. J. Rural Stud. 2021, 86, 623–632. [Google Scholar] [CrossRef]
- Yi, Y.; Xu, W.; Fan, Y.; Wang, H.-X. Drosophila as an Emerging Model Organism for Studies of Food-Derived Antioxidants. Food Res. Int. 2021, 143. [Google Scholar] [CrossRef]
- Li, L.; Paudel, K.P.; Guo, J. Understanding Chinese Farmers’ Participation Behavior Regarding Vegetable Traceability Systems. Food Control 2021, 130, 108325. [Google Scholar] [CrossRef]
- Yang, C.; Ji, X.; Cheng, C.; Liao, S.; Obuobi, B.; Zhang, Y. Digital Economy Empowers Sustainable Agriculture: Implications for Farmers’ Adoption of Ecological Agricultural Technologies. Ecol. Indic. 2024, 159, 111723. [Google Scholar] [CrossRef]
- Jiang, K.; Chen, Z.; Rughoo, A.; Zhou, M. Internet Finance and Corporate Investment: Evidence from China. J. Int. Financ. Mark. Inst. Money 2022, 77, 101535. [Google Scholar] [CrossRef]
- Carrer, M.J.; Filho, H.M.d.S.; Vinholis, M.d.M.B.; Mozambani, C.I. Precision Agriculture Adoption and Technical Efficiency: An Analysis of Sugarcane Farms in Brazil. Technol. Forecast. Soc. Chang. 2022, 177, 121510. [Google Scholar] [CrossRef]
- Dressler, M.; Paunovic, I. Sensing Technologies, Roles and Technology Adoption Strategies for Digital Transformation of Grape Harvesting in SME Wineries. J. Open Innov. Technol. Mark. Complex. 2021, 7, 123. [Google Scholar] [CrossRef]
- Allahyari, M.S.; Mohammadzadeh, M.; Nastis, S.A. Agricultural Experts’ Attitude towards Precision Agriculture: Evidence from Guilan Agricultural Organization, Northern Iran. Inf. Process. Agric. 2016, 3, 183–189. [Google Scholar] [CrossRef]
- Kolady, D.E.; Van der Sluis, E.; Uddin, M.M.; Deutz, A.P. Determinants of Adoption and Adoption Intensity of Precision Agriculture Technologies: Evidence from South Dakota. Precis. Agric. 2021, 22, 689–710. [Google Scholar] [CrossRef]
- Paudel, K.P.; Mishra, A.K.; Pandit, M.; Larkin, S.; Rejesus, R.; Velandia, M. Modeling Multiple Reasons for Adopting Precision Technologies: Evidence from U.S. Cotton Producers. Comput. Electron. Agric. 2020, 175, 105625. [Google Scholar] [CrossRef]
- Drewry, J.L.; Shutske, J.M.; Trechter, D.; Luck, B.D.; Pitman, L. Assessment of Digital Technology Adoption and Access Barriers among Crop, Dairy and Livestock Producers in Wisconsin. Comput. Electron. Agric. 2019, 165, 104960. [Google Scholar] [CrossRef]
- Michels, M.; von Hobe, C.-F.; Musshoff, O. A Trans-Theoretical Model for the Adoption of Drones by Large-Scale German Farmers. J. Rural Stud. 2020, 75, 80–88. [Google Scholar] [CrossRef]
- Schnebelin, É. Linking the Diversity of Ecologisation Models to Farmers’ Digital Use Profiles. Ecol. Econ. 2022, 196, 107422. [Google Scholar] [CrossRef]
- Ammann, J.; Umstaetter, C.; El Benni, N. The Adoption of Precision Agriculture Enabling Technologies in Swiss Outdoor Vegetable Production: A Delphi Study. Precis. Agric. 2022, 23, 1354–1374. [Google Scholar] [CrossRef]
- Fan, X.; Wang, Z.; Wang, Y. Rural Business Environments, Information Channels, and Farmers’ Pesticide Utilization Behavior: A Grounded Theory Analysis in Hainan Province, China. Agriculture 2024, 14, 196. [Google Scholar] [CrossRef]
- Ji, J.; Zhuo, K.; Zeng, Y.; Su, J.; Xie, Y. The Impact of Multi-Subjective Governance on Tea Farmers’ Green Production Behavior Based on the Improved Theory of Planned Behavior. Sustainability 2023, 15, 15811. [Google Scholar] [CrossRef]
- Creswell, J.D. Creswell Research Design: Qualitative, Quantitative, and Mixed Methods Approaches, 5th ed.; SAGE Publications: New York, NY, USA, 2017. [Google Scholar]
- Malina, M.A.; Nørreklit, H.S.O.; Selto, F.H. Lessons Learned: Advantages and Disadvantages of Mixed Method Research. Qual. Res. Account. Manag. 2011, 8, 59–71. [Google Scholar] [CrossRef]
- Stathakopoulos, V.; Kottikas, K.G.; Painesis, G.; Theodorakis, I.G.; Kottika, E. Why Shape a Market? Empirical Evidence on the Prominent Firm-Level and Market-Level Outcomes of Market-Driving Strategy. J. Bus. Res. 2022, 139, 1240–1254. [Google Scholar] [CrossRef]
- Kurtaliqi, F.; Lancelot Miltgen, C.; Viglia, G.; Pantin-Sohier, G. Using Advanced Mixed Methods Approaches: Combining PLS-SEM and Qualitative Studies. J. Bus. Res. 2024, 172, 114464. [Google Scholar] [CrossRef]
- Garrido-Moreno, A.; Martín-Rojas, R.; García-Morales, V.J. The Key Role of Innovation and Organizational Resilience in Improving Business Performance: A Mixed-Methods Approach. Int. J. Inf. Manag. 2024, 77, 102777. [Google Scholar] [CrossRef]
- Balogh, P.; Bai, A.; Czibere, I.; Kovach, I.; Fodor, L.; Bujdos, A.; Sulyok, D.; Gabnai, Z.; Birkner, Z. Big Data in Smart Farming—A Review. Agricultural Systems. Agronomy 2021, 11, 1112. [Google Scholar] [CrossRef]
- Wang, Y.; Jin, L.; Mao, H. Farmer Cooperatives’ Intention to Adopt Agricultural Information Technology—Mediating Effects of Attitude. Inf. Syst. Front. 2019, 21, 565–580. [Google Scholar] [CrossRef]
- Lin, H.-F.; Lin, S.-M. Determinants of E-Business Diffusion: A Test of the Technology Diffusion Perspective. Technovation 2008, 28, 135–145. [Google Scholar] [CrossRef]
- Yadav, S.; Kaushik, A.; Sharma, M.; Sharma, S. Disruptive Technologies in Smart Farming: An Expanded View with Sentiment Analysis. AgriEngineering 2022, 4, 424–460. [Google Scholar] [CrossRef]
- Annosi, M.C.; Brunetta, F.; Monti, A.; Nati, F. Is the Trend Your Friend? An Analysis of Technology 4.0 Investment Decisions in Agricultural SMEs. Comput. Ind. 2019, 109, 59–71. [Google Scholar] [CrossRef]
- Shi, P.; Yan, B. Factors Affecting RFID Adoption in the Agricultural Product Distribution Industry: Empirical Evidence from China. SpringerPlus 2016, 5, 2029. [Google Scholar] [CrossRef]
- Wang, Y.-M.; Wang, Y.-S.; Yang, Y.-F. Understanding the Determinants of RFID Adoption in the Manufacturing Industry. Technol. Forecast. Soc. Chang. 2010, 77, 803–815. [Google Scholar] [CrossRef]
- Yoon, C.; Lim, D.; Park, C. Factors Affecting Adoption of Smart Farms: The Case of Korea. Comput. Hum. Behav. 2020, 108, 106309. [Google Scholar] [CrossRef]
- Kuan, K.K.Y.; Chau, P.Y.K. A Perception-Based Model for EDI Adoption in Small Businesses Using a Technology-Organization-Environment Framework. Inf. Manag. 2001, 38, 507–521. [Google Scholar] [CrossRef]
- Dixit, K.; Aashish, K.; Kumar Dwivedi, A. Antecedents of Smart Farming Adoption to Mitigate the Digital Divide—Extended Innovation Diffusion Model. Technol. Soc. 2023, 75, 102348. [Google Scholar] [CrossRef]
- Low, C.; Chen, Y.; Wu, M. Understanding the Determinants of Cloud Computing Adoption. Ind. Manag. Data Syst. 2011, 111, 1006–1023. [Google Scholar] [CrossRef]
- Wei, J.; Lowry, P.B.; Seedorf, S. The Assimilation of RFID Technology by Chinese Companies: A Technology Diffusion Perspective. Inf. Manag. 2015, 52, 628–642. [Google Scholar] [CrossRef]
- de Prieelle, F.; de Reuver, M.; Rezaei, J. The Role of Ecosystem Data Governance in Adoption of Data Platforms by Internet-of-Things Data Providers: Case of Dutch Horticulture Industry. IEEE Trans. Eng. Manag. 2022, 69, 940–950. [Google Scholar] [CrossRef]
- Garbach, K.; Lubell, M.; DeClerck, F.A.J. Payment for Ecosystem Services: The Roles of Positive Incentives and Information Sharing in Stimulating Adoption of Silvopastoral Conservation Practices. Agric. Ecosyst. Environ. 2012, 156, 27–36. [Google Scholar] [CrossRef]
- Piñeiro, V.; Arias, J.; Dürr, J.; Elverdin, P.; Ibáñez, A.M.; Kinengyere, A.; Opazo, C.M.; Owoo, N.; Page, J.R.; Prager, S.D.; et al. A Scoping Review on Incentives for Adoption of Sustainable Agricultural Practices and Their Outcomes. Nat. Sustain. 2020, 3, 809–820. [Google Scholar] [CrossRef]
- Bahn, R.A.; Yehya, A.A.K.; Zurayk, R. Digitalization for Sustainable Agri-Food Systems: Potential, Status, and Risks for the MENA Region. Sustainability 2021, 13, 3223. [Google Scholar] [CrossRef]
- Schimmelpfennig, D. (Ed.) Farm Profits and Adoption of Precision Agriculture; Economic Research Report; USDA: Washington, DC, USA, 2016.
- Erdem, M.; Ağır, H.B. Enhancing Dairy Farm Welfare: A Holistic Examination of Technology Adoption and Economic Performance in Kahramanmaraş Province, Turkey. Sustainability 2024, 16, 2989. [Google Scholar] [CrossRef]
- Prause, L.; Hackfort, S.; Lindgren, M. Digitalization and the Third Food Regime. Agric. Hum. Values 2021, 38, 641–655. [Google Scholar] [CrossRef]
- Boursianis, A.D.; Papadopoulou, M.S.; Diamantoulakis, P.; Liopa-Tsakalidi, A.; Barouchas, P.; Salahas, G.; Karagiannidis, G.; Wan, S.; Goudos, S.K. Internet of Things (IoT) and Agricultural Unmanned Aerial Vehicles (UAVs) in Smart Farming: A Comprehensive Review. Internet Things 2022, 18, 100187. [Google Scholar] [CrossRef]
- Kakkavou, K.; Gemtou, M.; Fountas, S. Drivers and Barriers to the Adoption of Precision Irrigation Technologies in Olive and Cotton Farming—Lessons from Messenia and Thessaly Regions in Greece. Smart Agric. Technol. 2024, 7, 100401. [Google Scholar] [CrossRef]
- Chen, C.; Pan, J.; Lam, S.K. A Review of Precision Fertilization Research. Environ. Earth Sci 2014, 71, 4073–4080. [Google Scholar] [CrossRef]
- Friha, O.; Ferrag, M.A.; Shu, L.; Maglaras, L.; Wang, X. Internet of Things for the Future of Smart Agriculture: A Comprehensive Survey of Emerging Technologies. IEEE/CAA J. Autom. Sin. 2021, 8, 718–752. [Google Scholar] [CrossRef]
- Isgin, T.; Bilgic, A.; Forster, D.L.; Batte, M.T. Using Count Data Models to Determine the Factors Affecting Farmers’ Quantity Decisions of Precision Farming Technology Adoption. Comput. Electron. Agric. 2008, 62, 231–242. [Google Scholar] [CrossRef]
- Tiago, O. Assessing the Determinants of Cloud Computing Adoption: An Analysis of the Manufacturing and Services Sectors. Inf. Manag. 2014, 51, 497–510. [Google Scholar]
- Junior, C.H.; Oliveira, T.; Yanaze, M. The Adoption Stages (Evaluation, Adoption, and Routinisation) of ERP Systems with Business Analytics Functionality in the Context of Farms. Comput. Electron. Agric. 2019, 156, 334–348. [Google Scholar] [CrossRef]
- Aubert, B.A.; Schroeder, A.; Grimaudo, J. IT as Enabler of Sustainable Farming: An Empirical Analysis of Farmers’ Adoption Decision of Precision Agriculture Technology. Decis. Support Syst. 2012, 54, 510–520. [Google Scholar] [CrossRef]
- Balogh, P.; Bai, A.; Czibere, I.; Kovách, I.; Fodor, L.; Bujdos, Á.; Sulyok, D.; Gabnai, Z.; Birkner, Z. Economic and Social Barriers of Precision Farming in Hungary. Agronomy 2021, 11, 1112. [Google Scholar] [CrossRef]
- Carrer, M.J.; de Souza Filho, H.M.; Batalha, M.O. Factors Influencing the Adoption of Farm Management Information Systems (FMIS) by Brazilian Citrus Farmers. Comput. Electron. Agric. 2017, 138, 11–19. [Google Scholar] [CrossRef]
- Ofori, E.; Griffin, T.; Yeager, E. Balogh. Agric. Financ. Rev. 2020, 80, 647–664. [Google Scholar] [CrossRef]
- Pierpaoli, E.; Carli, G.; Pignatti, E.; Canavari, M. Drivers of Precision Agriculture Technologies Adoption: A Literature Review. Procedia Technol. 2013, 8, 61–69. [Google Scholar] [CrossRef]
- Sridhar, A.; Balakrishnan, A.; Jacob, M.M.; Sillanpää, M.; Dayanandan, N. Global Impact of COVID-19 on Agriculture: Role of Sustainable Agriculture and Digital Farming. Environ. Sci. Pollut. Res. 2023, 30, 42509–42525. [Google Scholar] [CrossRef]
- Li, W.; Wang, F.; Liu, T.; Xue, Q.; Liu, N. Peer Effects of Digital Innovation Behavior: An External Environment Perspective. Manag. Decis. 2023, 61, 2173–2200. [Google Scholar] [CrossRef]
- An, W.H. Instrumental Variables Estimates of Peer Effects in Social Networks. Soc. Sci. Res. 2015, 50, 382–394. [Google Scholar] [CrossRef]
- Chernozhukov, V.; Hansen, C. Instrumental Variable Quantile Regression: A Robust Inference Approach. Rodríguez 2008, 142, 379–398. [Google Scholar] [CrossRef]
- Niu, Z.; Chen, C.; Gao, Y.; Wang, Y.; Chen, Y.; Zhao, K. Peer Effects, Attention Allocation and Farmers’ Adoption of Cleaner Production Technology: Taking Green Control Techniques as an Example. J. Clean. Prod. 2022, 339, 130700. [Google Scholar] [CrossRef]
- Fávero, L.P.; Belfiore, P. Chapter 15—Regression Models for Count Data: Poisson and Negative Binomial. In Data Science for Business and Decision Making; Fávero, L.P., Belfiore, P., Eds.; Academic Press: Cambridge, MA, USA, 2019; pp. 617–703. ISBN 978-0-12-811216-8. [Google Scholar]
- Cameron, A.C.; Trivedi, P.K. Regression-Based Tests for Overdispersion in the Poisson Model. J. Econ. 1990, 46, 347–364. [Google Scholar] [CrossRef]
- Lawless, J.F. Negative Binomial and Mixed Poisson Regression. Can. J. Stat. 1987, 15, 209–225. [Google Scholar] [CrossRef]
- Yao, J.; Wang, D. The Impact of Analyst Attention on the Firms’ Innovation Paths from a Life Cycle Perspective: Evidence from China. Heliyon 2023, 9, e18940. [Google Scholar] [CrossRef]
- Cronbach, L.J. Coefficient Alpha and the Internal Structure of Tests. Psychometrika 1951, 16, 297–334. [Google Scholar] [CrossRef]
- Bartlett, M.S. Tests of Significance in Factor Analysis. Br. J. Stat. Psychol. 1950, 3, 77–85. [Google Scholar] [CrossRef]
- Kaiser, H.F. An Index of Factorial Simplicity. Psychometrika 1974, 39, 31–36. [Google Scholar] [CrossRef]
- Leguina, A. A Primer on Partial Least Squares Structural Equation Modeling (PLS-SEM). Int. J. Res. Method Educ. 2015, 38, 220–221. [Google Scholar] [CrossRef]
- de Jongh, P.; de Jongh, E.; Pienaar, M.; Gordon-Grant, H.; Oberholzer, M.; Santana, L. The Impact of Pre-Selected Variance Inflation Factor Thresholds on the Stability and Predictive Power of Logistic Regression Models in Credit Scoring. ORiON 2015, 31, 17–37. [Google Scholar] [CrossRef]
- Staffini, A.; Fujita, K.; Svensson, A.K.; Chung, U.-I.; Svensson, T. Statistical Methods for Item Reduction in a Representative Lifestyle Questionnaire: Pilot Questionnaire Study. Interact. J. Med. Res. 2022, 11, e28692. [Google Scholar] [CrossRef]
- Oster, E. Unobservable Selection and Coefficient Stability: Theory and Evidence. J. Bus. Econ. Stat. 2019, 37, 187–204. [Google Scholar] [CrossRef]
- Zeidan, R.; Van Holt, T.; Whelan, T. Existence Inductive Theory Building to Study Coordination Failures in Sustainable Beef Production. J. Clean. Prod. 2020, 267, 122137. [Google Scholar] [CrossRef]
- Byrne, D. A Worked Example of Braun and Clarke’s Approach to Reflexive Thematic Analysis. Qual. Quant. 2022, 56, 1391–1412. [Google Scholar] [CrossRef]
- Hansen, B.D.; Leonard, E.; Mitchell, M.C.; Easton, J.; Shariati, N.; Mortlock, M.Y.; Schaefer, M.; Lamb, D.W. Current Status of and Future Opportunities for Digital Agriculture in Australia. Crop Pasture Sci. 2022, 74, 524–537. [Google Scholar] [CrossRef]
- Lin, D.; Lee, C.K.M.; Lin, K. Research on Effect Factors Evaluation of Internet of Things (IOT) Adoption in Chinese Agricultural Supply Chain. In Proceedings of the 2016 IEEE International Conference on Industrial Engineering and Engineering Management (IEEM), Bali, Indonesia, 4–6 December 2016; pp. 612–615. [Google Scholar]
- Marra, M.; Pannell, D.J.; Abadi Ghadim, A. The Economics of Risk, Uncertainty and Learning in the Adoption of New Agricultural Technologies: Where Are We on the Learning Curve? Agric. Syst. 2003, 75, 215–234. [Google Scholar] [CrossRef]
- Carolan, M. Digitization as Politics: Smart Farming through the Lens of Weak and Strong Data. J. Rural Stud. 2022, 91, 208–216. [Google Scholar] [CrossRef]
- Gerli, P.; Clement, J.; Esposito, G.; Mora, L.; Crutzen, N. The Hidden Power of Emotions: How Psychological Factors Influence Skill Development in Smart Technology Adoption. Technol. Forecast. Soc. Chang. 2022, 180, 121721. [Google Scholar] [CrossRef]
- Abdollahzadeh, G.; Damalas, C.A.; Sharifzadeh, M.S.; Ahmadi-Gorgi, H. Selecting Strategies for Rice Stem Borer Management Using the Analytic Hierarchy Process (AHP). Crop Prot. 2016, 84, 27–36. [Google Scholar] [CrossRef]
- Rezaei, R.; Safa, L.; Ganjkhanloo, M.M. Understanding Farmers’ Ecological Conservation Behavior Regarding the Use of Integrated Pest Management—An Application of the Technology Acceptance Model. Glob. Ecol. Conserv. 2020, 22, e00941. [Google Scholar] [CrossRef]
- Oyibo, K.; Morita, P.P. COVID Alert: Factors Influencing the Adoption of Exposure Notification Apps Among Canadian Residents. Front. Digit. Health 2022, 4, 842661. [Google Scholar] [CrossRef]
- Scur, G.; da Silva, A.V.D.; Mattos, C.A.; Gonçalves, R.F. Analysis of IoT Adoption for Vegetable Crop Cultivation: Multiple Case Studies. Technol. Forecast. Soc. Chang. 2023, 191, 122452. [Google Scholar] [CrossRef]
- Rose, D.C.; Sutherland, W.J.; Parker, C.; Lobley, M.; Winter, M.; Morris, C.; Twining, S.; Ffoulkes, C.; Amano, T.; Dicks, L.V. Decision Support Tools for Agriculture: Towards Effective Design and Delivery. Agric. Syst. 2016, 149, 165–174. [Google Scholar] [CrossRef]
- Sun, S.; Cegielski, C.G.; Jia, L.; Hall, D.J. Understanding the Factors Affecting the Organizational Adoption of Big Data. J. Comput. Inf. Syst. 2018, 58, 193–203. [Google Scholar] [CrossRef]
- Taheri, F.; D’Haese, M.; Fiems, D.; Azadi, H. The Intentions of Agricultural Professionals towards Diffusing Wireless Sensor Networks: Application of Technology Acceptance Model in Southwest Iran. Technol. Forecast. Soc. Chang. 2022, 185, 122075. [Google Scholar] [CrossRef]
- Lee, C.-L.; Strong, R.; Dooley, K.E. Analyzing Precision Agriculture Adoption across the Globe: A Systematic Review of Scholarship from 1999–2020. Sustainability 2021, 13, 10295. [Google Scholar] [CrossRef]
- Shang, L.; Heckelei, T.; Gerullis, M.K.; Börner, J.; Rasch, S. Adoption and Diffusion of Digital Farming Technologies—Integrating Farm-Level Evidence and System Interaction. Agric. Syst. 2021, 190, 103074. [Google Scholar] [CrossRef]
- Malik, S.; Chadhar, M.; Chetty, M.; Vatanasakdakul, S. Adoption of Blockchain Technology: Exploring the Factors Affecting Organizational Decision. Hum. Behav. Emerg. Technol. 2022, 2022, 1–14. [Google Scholar] [CrossRef]
- Zhu, K.; Kraemer, K.L.; Xu, S. The Process of Innovation Assimilation by Firms in Different Countries: A Technology Diffusion Perspective on E-Business. Manag. Sci. 2006, 52, 1557–1576. [Google Scholar] [CrossRef]
- Krishnan, P.; Patnam, M. Neighbors and Extension Agents in Ethiopia: Who Matters More for Technology Adoption? Am. J. Agric. Econ. 2014, 96, 308–327. [Google Scholar] [CrossRef]
- Ferrali, R.; Grossman, G.; Platas, M.R.; Rodden, J. It Takes a Village: Peer Effects and Externalities in Technology Adoption. Am. J. Political Sci. 2020, 64, 536–553. [Google Scholar] [CrossRef]
- Aparo, N.O.; Odongo, W.; De Steur, H. Unraveling Heterogeneity in Farmer’s Adoption of Mobile Phone Technologies: A Systematic Review. Technol. Forecast. Soc. Chang. 2022, 185, 122048. [Google Scholar] [CrossRef]
- Barnes, A.P.; Soto, I.; Eory, V.; Beck, B.; Balafoutis, A.; Sánchez, B.; Vangeyte, J.; Fountas, S.; van der Wal, T.; Gómez-Barbero, M. Exploring the Adoption of Precision Agricultural Technologies: A Cross Regional Study of EU Farmers. Land Use Policy 2019, 80, 163–174. [Google Scholar] [CrossRef]
- Tamirat, T.W.; Pedersen, S.M.; Lind, K.M. Farm and Operator Characteristics Affecting Adoption of Precision Agriculture in Denmark and Germany. Acta Agric. Scand. Sect. B—Soil Plant Sci. 2018, 68, 349–357. [Google Scholar] [CrossRef]
- Weltin, M.; Zasada, I.; Hüttel, S. Relevance of Portfolio Effects in Adopting Sustainable Farming Practices. J. Clean. Prod. 2021, 313, 127809. [Google Scholar] [CrossRef]
- Symeonaki, E.; Arvanitis, K.; Piromalis, D. A Context-Aware Middleware Cloud Approach for Integrating Precision Farming Facilities into the IoT toward Agriculture 4.0. Appl. Sci. 2020, 10, 813. [Google Scholar] [CrossRef]
- Chandio, A.A.; Ozdemir, D.; Gokmenoglu, K.K.; Usman, M.; Jiang, Y. Digital Agriculture for Sustainable Development in China: The Promise of Computerization. Technol. Soc. 2024, 76, 102479. [Google Scholar] [CrossRef]
- Chinseu, E.; Dougill, A.; Stringer, L. Why Do Smallholder Farmers Dis-adopt Conservation Agriculture? Insights from Malawi. Land Degrad. Dev. 2019, 30, 533–543. [Google Scholar] [CrossRef]
- Trujillo-Barrera, A.; Pennings, J.M.E.; Hofenk, D. Understanding Producers’ Motives for Adopting Sustainable Practices: The Role of Expected Rewards, Risk Perception and Risk Tolerance. Eur. Rev. Agric. Econ. 2016, 43, 359–382. [Google Scholar] [CrossRef]
| Phase | Procedure | Outcome |
|---|---|---|
 | Literature study | Research hypothesis construction |
| Structured questionnaire design | ||
| Pre-survey for 20 growers | ||
| Formal survey of 435 growers in China | Sample size identify | |
| Software used: Stata 16 | ||
| Confirmatory factors analysis | Reliability and validity | |
| Multicollinearity test | ||
| Negative binomial regression | Factors of DTs adoption | |
| Ordered Probit | ||
| Two-stage least squares (2SLS) and IV-Tobit | Economic benefits of DTs | |
| Semi-structured interview protocol design | ||
| Triangulation | ||
| Formal interview of 15 growers | Sample size identify | |
| Qualitative data extraction | ||
| Inductive approach | Codes and themes | |
| Compare, analyze, explain and discuss qualitative and quantitative results. | Confirmation of hypothesis | |
| Complementary findings | ||
| Digital Technologies | Descriptions |
|---|---|
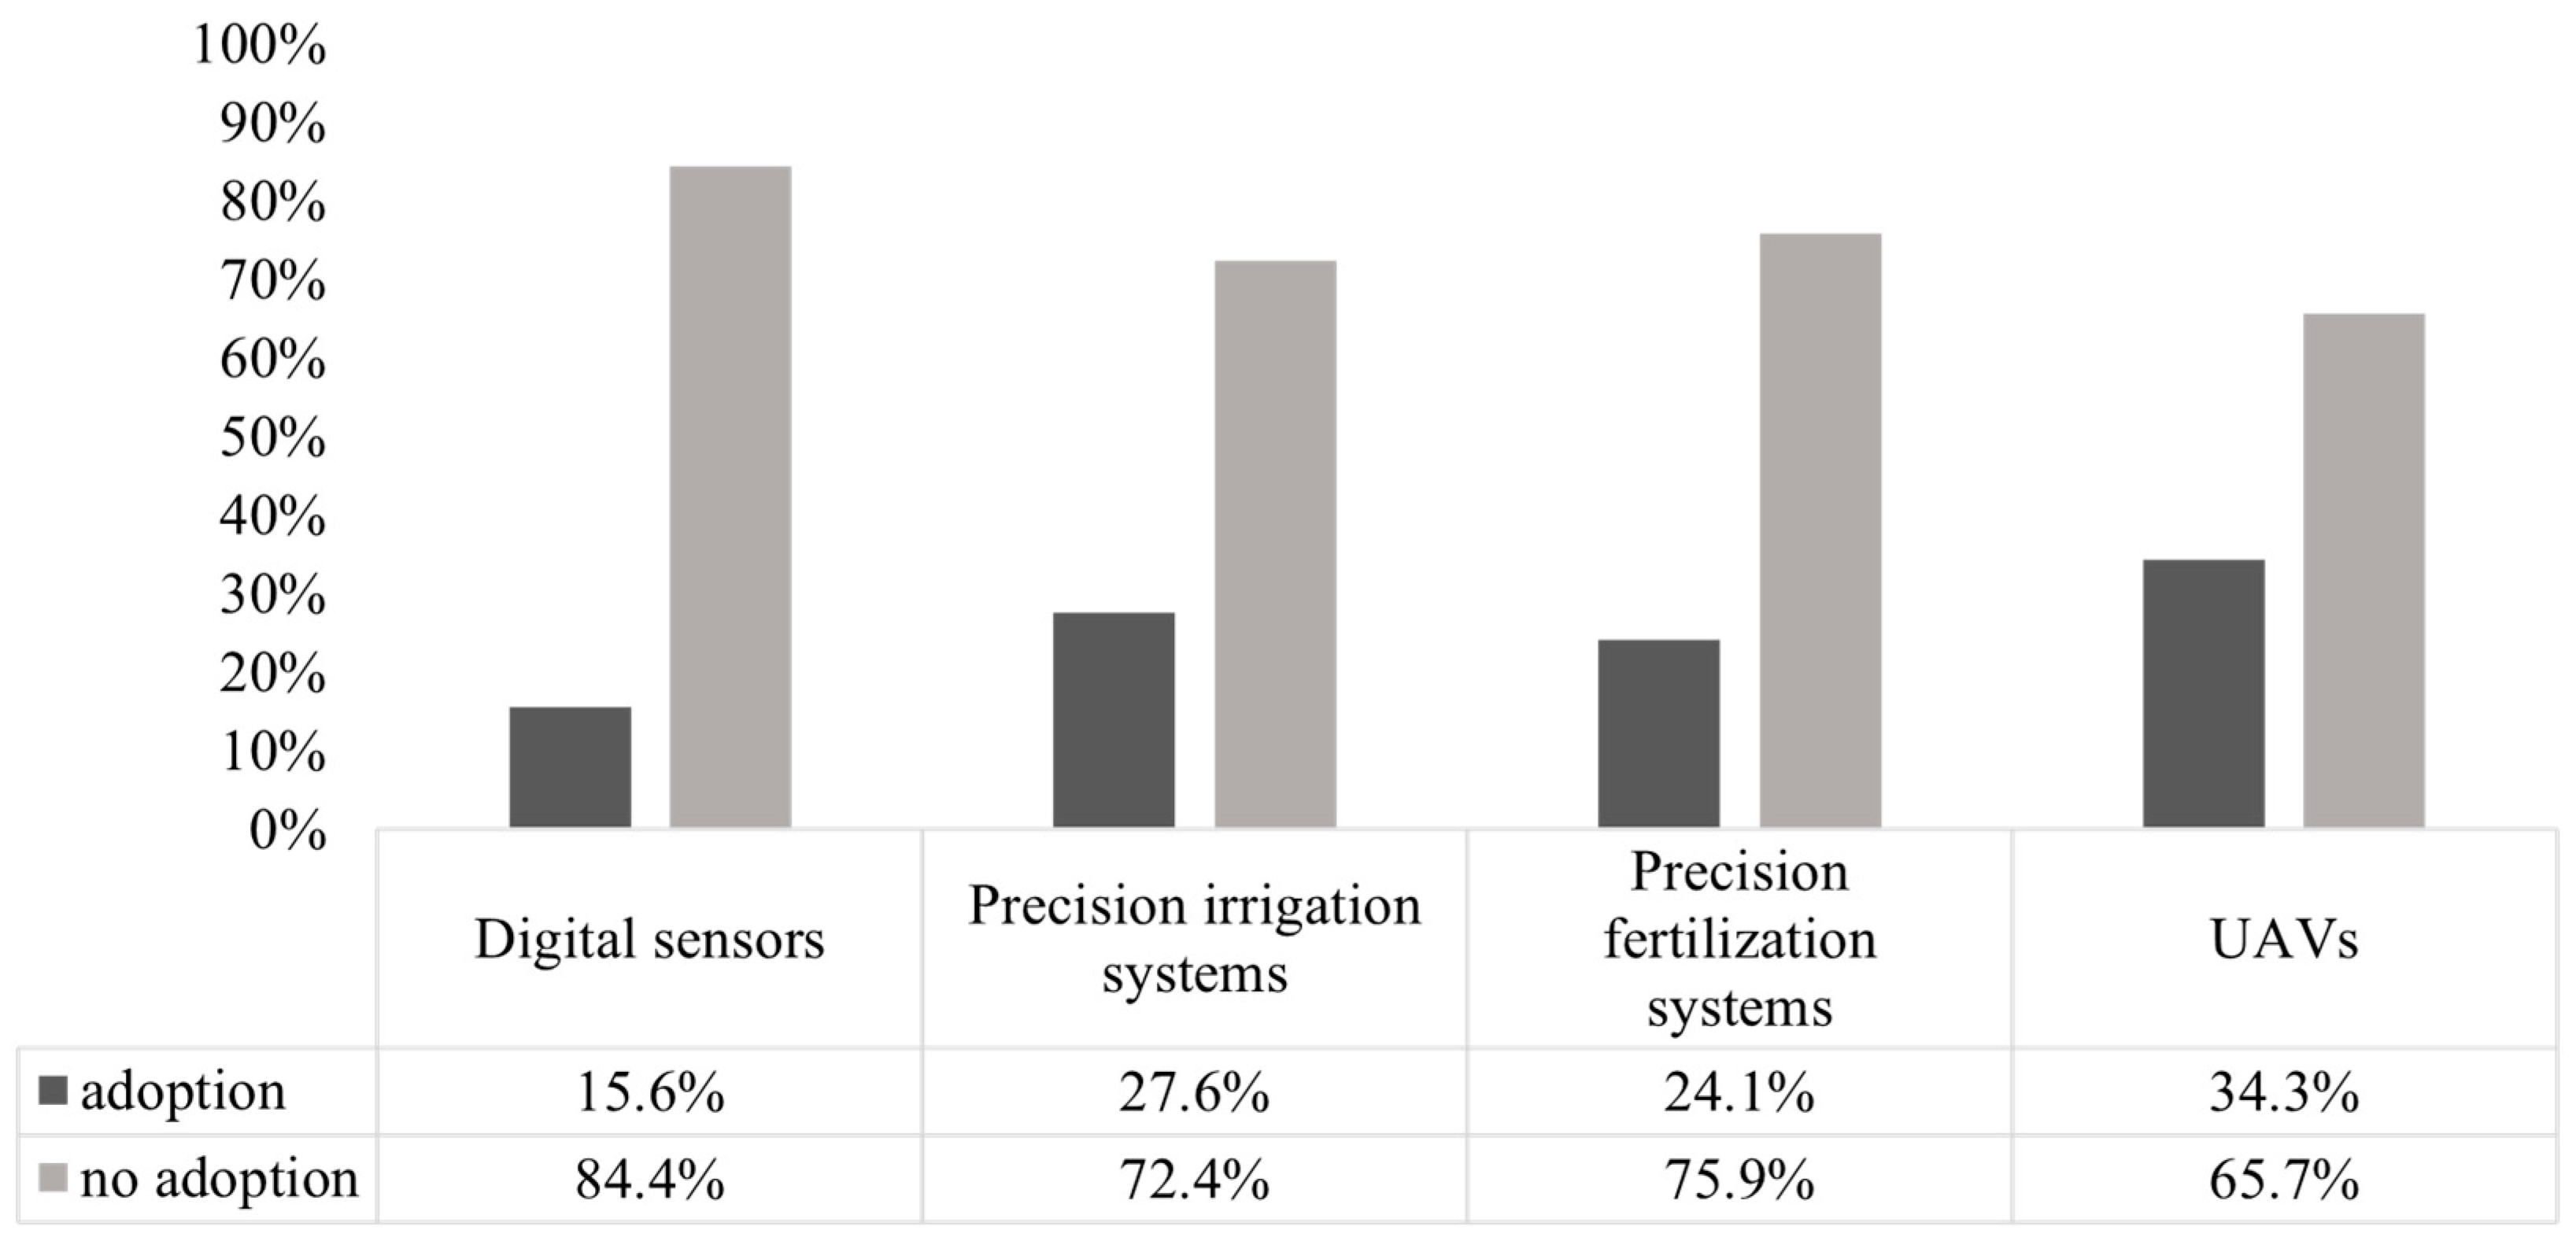
| Digital sensors | Real-time monitoring, collecting, transmitting, and storing data on temperature, humidity, soil moisture, nutrient levels, and carbon dioxide concentration in designated areas, while also automatically controlling and providing feedback based on preset conditions [59]. |
| Precision irrigation systems | Based on crop water requirements and soil moisture conditions, irrigation schedules, timing, and water flow rates should be systematically devised to achieve precise control and management of irrigation [60]. |
| Precision fertilization systems | By monitoring factors such as soil nutrient levels, crop growth status, and meteorological conditions, rational adjustments to fertilizer formulations and application rates have been made, resulting in increased fertilizer efficiency and nutrient utilization by crops [61]. |
| Unmanned aerial vehicles | UAVs are utilized in agricultural production to facilitate tasks such as field monitoring, crop growth analysis, and precision spraying [62]. |
| Variables | Descriptions | Mean | Standard Deviation |
|---|---|---|---|
| Age | Age of the growers in years. | 49.230 | 9.021 |
| Sex | Sex of the growers (1 = male, 0 = female). | 0.726 | 0.446 |
| Education years | Years of formal education of growers. | 10.897 | 2.580 |
| Cultivation experience (10 years) | Years of experience in cultivation for growers. | 2.835 | 1.054 |
| Training participation | The number of times growers have participated in digital technology training organized by government and agricultural industry associations over the past three years. | 3.051 | 3.587 |
| Cultivation area (1000 mu) | Cultivation area of growers. | 0.206 | 0.331 |
| Labor size (×100) | Fixed number of labor force. | 0.099 | 0.243 |
| Crop type | Primary type of cultivated crop (Grains = 1, Fruits = 2, Vegetables = 3). | 1.708 | 1.292 |
| Economic benefits (10,000 yuan/mu) | Average net profit from cultivation over the past three years. | 0.683 | 0.768 |
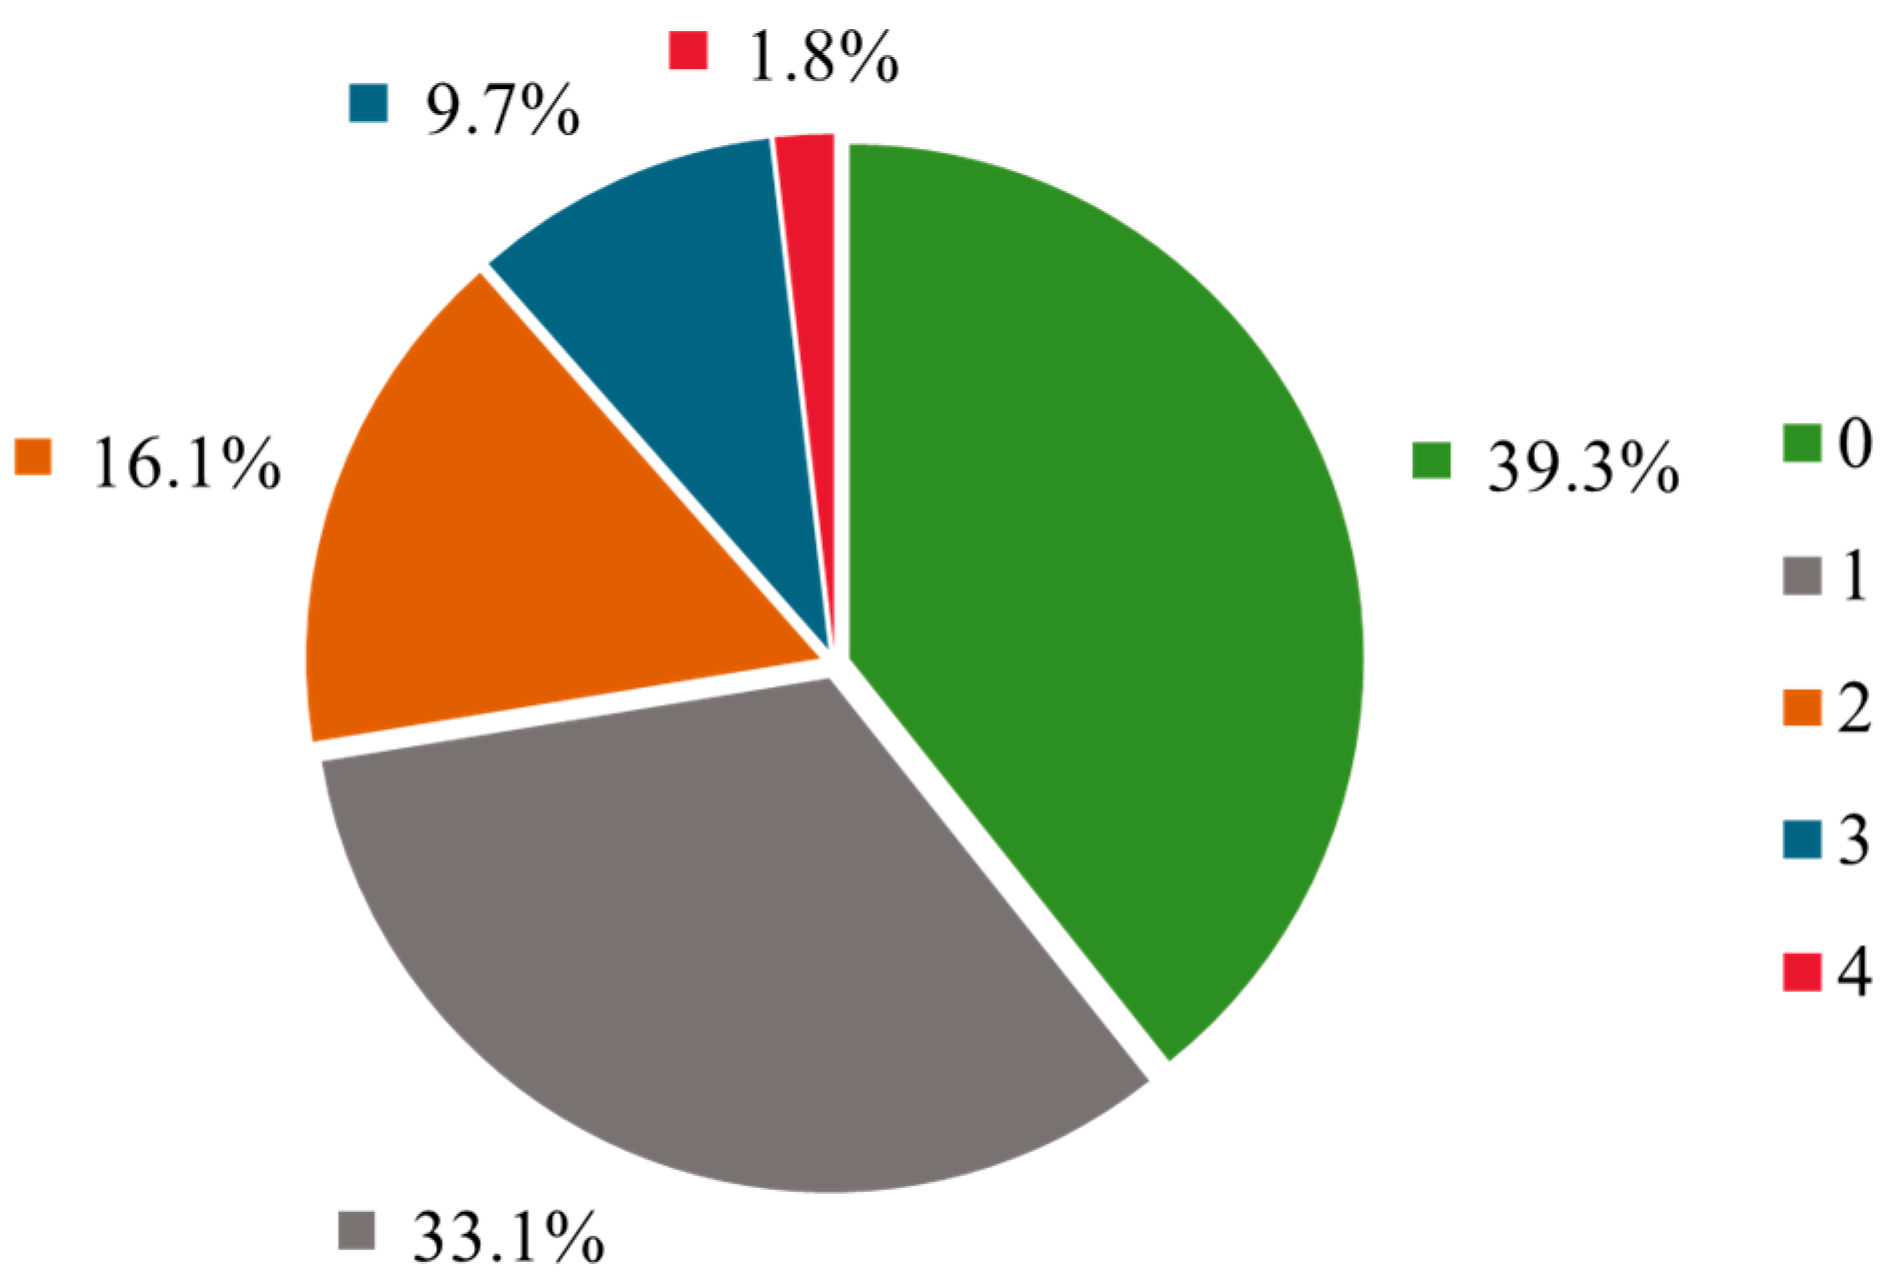
| DTs adoption intensity | Number of digital technologies (DTs) adopted by growers. | 1.016 | 1.053 |
| DTs adoption rate of local peers (0~1) | Proportion of growers engaged in digitalized cultivation within the same county. | 0.324 | 0.299 |
| Impacts of COVID-19 | Impact of COVID-19 on agricultural production and operations over the past three years (No impacts = 1, Low impacts = 2, Moderate impacts = 3, High impacts = 4). | 2.131 | 0.822 |
| Grower’s knowledge | The grower’s degree of understanding, proficiency, and utilization of a DT. | 11.531 | 2.268 |
| Technology compatibility | The degree to which a DT fits with the existing values, previous practices, and current needs. | 10.189 | 1.922 |
| Government support | The degree of policy, finance, and technical support from government to process DTs. | 11.340 | 2.259 |
| Competitive pressure | The degree of perceived pressure experienced by growers from competitors within the industry. | 11.407 | 1.979 |
| Variables | Standardized Factor Loadings | KMO | Bartlett (p) | α | AVE | CR |
|---|---|---|---|---|---|---|
| Grower’s knowledge | ||||||
| Grower’s knowledge 1 | 0.915 | |||||
| Grower’s knowledge 2 | 0.850 | 0.680 | 0.000 | 0.830 | 0.753 | 0.901 |
| Grower’s knowledge 3 | 0.836 | |||||
| Technology compatibility | ||||||
| Technology compatibility 1 | 0.912 | 0.657 | 0.000 | 0.828 | 0.746 | 0.898 |
| Technology compatibility 2 | 0.910 | |||||
| Technology compatibility 3 | 0.761 | |||||
| Government support | ||||||
| Government support 1 | 0.943 | |||||
| Government support 2 | 0.956 | 0.769 | 0.000 | 0.944 | 0.899 | 0.964 |
| Government support 3 | 0.946 | |||||
| Competitive pressure | ||||||
| Competitive pressure 1 | 0.867 | 0.703 | 0.000 | 0.886 | 0.817 | 0.930 |
| Competitive pressure 2 | 0.940 | |||||
| Competitive pressure 3 | 0.903 | |||||
| Factors Influence on DTs Adoption Intensity | DTs Adoption Intensity on Economic Benefits | ||||
|---|---|---|---|---|---|
| Variable | VIF | 1/VIF | Variable | VIF | 1/VIF |
| Technology compatibility | 2.170 | 0.460 | Age | 1.260 | 0.795 |
| Competitive pressure | 2.160 | 0.463 | Education years | 1.240 | 0.809 |
| Government support | 1.590 | 0.629 | Crop type | 1.230 | 0.814 |
| Grower’s knowledge | 1.420 | 0.704 | Labor size | 1.210 | 0.827 |
| Age | 1.270 | 0.786 | Cultivation area | 1.190 | 0.842 |
| Education years | 1.240 | 0.803 | DTs adoption intensity | 1.190 | 0.843 |
| Labor size | 1.230 | 0.811 | Cultivation experience | 1.150 | 0.872 |
| Cultivation area | 1.200 | 0.835 | Training participation | 1.050 | 0.954 |
| Crop type | 1.190 | 0.842 | Impacts of COVID-19 | 1.030 | 0.972 |
| Cultivation experience | 1.160 | 0.861 | Sex | 1.020 | 0.978 |
| Training participation | 1.060 | 0.946 | |||
| Impacts of COVID-19 | 1.030 | 0.967 | |||
| Sex | 1.030 | 0.974 | |||
| Mean VIF | 1.370 | Mean VIF | 1.160 | ||
| Variables | Negative Binomial Regression Model | Ordered Probit | |
|---|---|---|---|
| Model 1 | Model 2 | Model 3 | |
| Grower’s knowledge | 0.177 ** | 0.160 ** | 0.185 *** |
| (0.081) | (0.063) | (0.056) | |
| Technology compatibility | 0.135 *** | 0.118 *** | 0.111 ** |
| (0.035) | (0.039) | (0.056) | |
| Government support | 0.138 *** | 0.102 ** | 0.115 ** |
| (0.052) | (0.046) | (0.048) | |
| Competitive pressure | 0.122 *** | 0.100 *** | 0.104 ** |
| (0.047) | (0.039) | (0.043) | |
| Age | −0.009 | −0.007 | −0.006 |
| (0.006) | (0.007) | (0.008) | |
| Sex | 0.198 ** | 0.187 ** | 0.238 ** |
| (0.080) | (0.090) | (0.099) | |
| Education years | 0.066 ** | 0.039 | 0.043 |
| (0.026) | (0.027) | (0.051) | |
| Cultivation experience | −0.017 | −0.006 | 0.004 |
| (0.035) | (0.038) | (0.052) | |
| Training participation | 0.017 | 0.019 | |
| (0.018) | (0.024) | ||
| Cultivation areas | 0.251 * | 0.289 | |
| (0.153) | (0.213) | ||
| Labor size | 0.184 | 0.398 ** | |
| (0.118) | (0.194) | ||
| Fruits | −0.233 *** | −0.378 *** | |
| (0.070) | (0.084) | ||
| Vegetables | −0.842 * | −0.931 *** | |
| (0.453) | (0.339) | ||
| Impacts of COVID-19 | Controlled | Controlled | Controlled |
| _cons | −0.435 | −0.242 | |
| (0.643) | (0.514) | ||
| Pseudo R2 | 0.047 | 0.081 | 0.094 |
| Wald chi2 | 323.480 | 18,324.830 | 10,861.520 |
| Prob > chi2 | 0.000 | 0.000 | 0.000 |
| N | 435 | 435 | 435 |
| Variables | IV | Economic Benefits | |
|---|---|---|---|
| Model 4 (2SLS) | Model 5 (2SLS) | Model 6 (IV-Tobit) | |
| DTs adoption intensity | 1.140 *** | 0.304 ** | 0.304 ** |
| (0.422) | (0.150) | (0.154) | |
| Control variables | Controlled | Controlled | Controlled |
| _cons | 0.268 | −0.558 | −0.527 |
| (0.472) | (0.371) | (0.421) | |
| Centered R2 | 0.241 | ||
| Wald chi2 | 4761.65 | ||
| Prob > F | 0.000 | ||
| Prob > chi2 | 0.000 | ||
| N | 435 | 435 | 435 |
| Dependent Variables Standards | Check | Estimation Results | Test Results |
|---|---|---|---|
| Economic benefits | δ > 1 | δ = 8.165 | Yes |
| Grower ID | Cultivation Area (mu) | Cultivation Experience | Digital Technology Adoption | Crop Type |
|---|---|---|---|---|
| HG 01 | 5 | 40 | Digital sensors | Vegetable |
| HG 02 | 11 | 10 | Digital sensors | Fruit |
| HG 03 | 18 | 21 | Digital sensor, precision irrigation system, precision fertilization system | Fruit |
| HG04 | 30 | 24 | Digital sensor, precision irrigation system, precision fertilization system | Fruit |
| HG 05 | 40 | 35 | Digital sensor, precision irrigation system, precision fertilization system | Fruit |
| HG 06 | 100 | 38 | Precision irrigation system; precision fertilization systems | Vegetable |
| HG 07 | 100 | 25 | UAVs | Vegetable |
| HG 08 | 106 | 29 | Precision irrigation systems, precision fertilization systems | Fruit |
| HG 09 | 200 | 31 | Digital sensor, precision irrigation system, precision fertilization system | Fruit |
| HG 10 | 1000 | 10 | Precision irrigation systems; precision fertilization systems | Fruit |
| HG 11 | 3 | 36 | Non-adopter | Vegetable |
| HG 12 | 7 | 37 | Non-adopter | Vegetable |
| HG 13 | 8 | 18 | Non-adopter | Vegetable |
| HG 14 | 16 | 31 | Non-adopter | Fruit |
| HG 15 | 24.5 | 29 | Non-adopter | Vegetable |
| Grower’s Knowledge | |
|---|---|
| HG05 | [...] I’m an early adopter of DTs. I’m always willing to learn and try new technologies, and I plan to use some more precise and intelligent devices in the next 5 years. [...] |
| HG11 | [...] I’ve heard about and have some understanding of DTs, but I’m not clear on the specific benefits it can bring to me. [...] |
| HG13 | [...] I don’t understand the intricacies of DTs, I can determine when to ventilate and when to irrigate based on my experience. [...] |
| Technology Compatibility | |
|---|---|
| HG07 | [...] UAVs spraying is only suitable for large-scale farmland. With 100 mu of land on my farm, we meet the scale requirements for drone spraying. [...] |
| HG09 | [...] The growth of trees varies, so precise irrigation can only result in uniform spraying, while manual application allows for dosage adjustment based on different trees. [...] |
| HG12 | [...] I believe technology compatibility is very important. For example, manual labor is the only option for cultivating onions, while DTs are more suitable for cucumbers and tomatoes. [...] |
| Government Support | |
|---|---|
| HG04 | [...] Nine years ago, I installed precision irrigation devices during greenhouse construction, subsidized by the government at ten thousand yuan per mu for circuitry and equipment. [...] |
| HG06 | [...] The government supports through the provision of network infrastructure and DTs equipment to demonstration households. [...] |
| HG08 | [...] The government facilitates exchanges on technologies among local producers, offering brief on-site training sessions to encourage technology adoption. [...] |
| Competitive Pressure | |
|---|---|
| HG01 | [...] I observed the effects on my peers in the same village who implemented precision irrigation. They were able to save 10–20% on water and fertilizer costs, which prompted me to follow suit. [...] |
| HG14 | [...] Once demonstration households demonstrate positive economic benefits, everyone will be motivated to learn from and emulate their adoption. [...] |
| HG15 | [...] China is currently vigorously promoting digital agriculture, and competitors and partners in the vicinity did have impacts on me. [...] |
| Economic Benefits | Grower |
|---|---|
| Increase yield | HG01, HG05, HG06, HG07 |
| Improve quality | HG01, HG05, HG06, HG07, HG10 |
| Reduce labor costs | HG02, HG04, HG05, HG07, HG08 |
| Decrease irrigation water usage | HG04, HG05 |
| Decrease pesticide usage | HG04 |
| No effects | HG03 |
| Economic Benefits | |
|---|---|
| HG02 | [...] I am relatively satisfied with the use of UAVs for spraying pesticides on vegetables. Labor costs can be reduced by 20% to 30%, yield and quality were improved. [...] |
| HG04 | [...] The benefits of using DTs are evident in water and pesticide savings, with a reduction of 30% in both. [...] |
| HG05 | [...] After applied precision irrigation systems, labor costs for three greenhouses can be reduced by over 10,000 yuan, and yield and quality can increase by 20%. [...] |
Disclaimer/Publisher’s Note: The statements, opinions and data contained in all publications are solely those of the individual author(s) and contributor(s) and not of MDPI and/or the editor(s). MDPI and/or the editor(s) disclaim responsibility for any injury to people or property resulting from any ideas, methods, instructions or products referred to in the content. |
© 2024 by the authors. Licensee MDPI, Basel, Switzerland. This article is an open access article distributed under the terms and conditions of the Creative Commons Attribution (CC BY) license (https://creativecommons.org/licenses/by/4.0/).
Share and Cite
Geng, W.; Liu, L.; Zhao, J.; Kang, X.; Wang, W. Digital Technologies Adoption and Economic Benefits in Agriculture: A Mixed-Methods Approach. Sustainability 2024, 16, 4431. https://doi.org/10.3390/su16114431
Geng W, Liu L, Zhao J, Kang X, Wang W. Digital Technologies Adoption and Economic Benefits in Agriculture: A Mixed-Methods Approach. Sustainability. 2024; 16(11):4431. https://doi.org/10.3390/su16114431
Chicago/Turabian StyleGeng, Wenxuan, Liping Liu, Junye Zhao, Xiaoru Kang, and Wenliang Wang. 2024. "Digital Technologies Adoption and Economic Benefits in Agriculture: A Mixed-Methods Approach" Sustainability 16, no. 11: 4431. https://doi.org/10.3390/su16114431
APA StyleGeng, W., Liu, L., Zhao, J., Kang, X., & Wang, W. (2024). Digital Technologies Adoption and Economic Benefits in Agriculture: A Mixed-Methods Approach. Sustainability, 16(11), 4431. https://doi.org/10.3390/su16114431