Abstract
The intensity of carbon dioxide can vary depending on land management practices, temperature of the soil, and soil moisture. The soil CO2 efflux per non-growing season was 61% lower than per growing season. The CO2 efflux, averaged across data, tended to decrease in the following orders: grassland > forest > no-tillage > reduced tillage > conventional tillage (per non-growing season and measurement period) and grassland > forest > no-tillage > conventional tillage > reduced tillage (per growing season). Soil temperature averaged; in the natural land uses, it was 18% lower than in the anthropogenic land uses. Soil temperature averaged; in the non-growing season, it was 55% lower than under the growing season. The temperature (up to 25 °C) increased the soil CO2 efflux per measurement period. By increasing the temperature in the soil, the soil efflux decreased in natural land use under growing season, but in anthropogenic land use, it increased per measurement period. The volumetric water content averaged; in the non-growing season, it was 3% lower than under the growing season. The volumetric water content had a positive effect on CO2 efflux, but when the water content was higher than 15% in anthropogenic land use, and 20% in natural land use per growing season, the relationships were negative.
1. Introduction
The productivity of agricultural land depends on soil type, climatic conditions, and human activities. The Central Lithuanian Lowland is dominated by Cambisols [1]. The preliminary assessment showed that Cambisols occupy 16.8% of the territory of Lithuania [2]. This type of soil is intensively used in agriculture.
Agriculture has been closely linked to environmental research in recent decades, including climate change research. Agriculture consists of many different processes; however, tillage is one of the most important and has a significant impact on soils and the environment [3]. Thus, it is very important to understand the influence of agricultural practices on elevated atmospheric concentrations of greenhouse gas (GHG) emissions, particularly soil carbon dioxide (CO2). Quantifying soil CO2 efflux is a key process for understanding the dynamics of carbon in different ecosystems. However, soil carbon dioxide effluxes may vary annually as fluxes respond differently to changes in environmental variables such as nutrient availability, soil water content and soil temperature, macroporosity [4], and volume roots [5]. The effect of temperature on the exchange of carbon dioxide efflux into the soil and atmosphere is largely direct, and increasing soil temperature leads to increased soil carbon dioxide efflux unless other factors are limiting. The influence of soil moisture on CO2 release is more complex [5,6]. The intensity of CO2 emissions can vary depending on the tillage systems, meteorological conditions, properties of the soil, plant residue, and other factors [6,7]. However, the precise effects of soil tillage on CO2 emissions remain controversial and greatly vary among past studies [8]. Some experimental studies revealed that tillage increases CO2 emissions [9,10], and the technology of plough less tillage, such as direct drilling, is mentioned as a means of reducing CO2 efflux from the soil [11,12], while others reported a significant increase or no difference [13,14]. Some hypotheses have been proposed to explain the various carbon dioxide efflux responses due to different soil tillage systems. For example, a decrease in soil CO2 emissions might be due to decreased soil temperature [12], while acceleration in carbon dioxide efflux might be due to the increased activity of the microbes caused by more moisture in the soil [15]. That means that environmental factors have a considerable effect on soil respiration processes efflux [16] because soil temperature and soil water content are the factors that have a great effect on the intensity of soil gas [17]. Soil temperature and humidity are influenced by meteorological conditions and functions for a specific year. So, the input of CO2 emissions into the atmosphere depends not only on tillage but also on meteorological conditions [18]. Putramentaite et al.’s [19] experimental studies showed that soil temperature in conventional tillage and no-tillage systems was the main determinant for respiration from the soil; however, the total effect of content water in the soil, air temperature, and other environmental factors was also suppressed. The other experimental results also showed that soil moisture and temperatures of the soil are the main factors affecting the rate of soil gas formation [20]. Kochiieru et al.’s [4] experimental resulted displayed that soil CO2 efflux has a nonlinear dependence with the temperature of the soil, but the relation is very weak. Research by Buragiene et al. [9] showed the negative effect that the temperature of the soil has on carbon dioxide from soil, but Rey et al.’s [21] studies did not find an influence of soil temperature on soil carbon dioxide but rather found a positive effect of soil moisture on soil CO2. The experimental results of Pergrina [22] also showed that, due to heterotrophic respiration, the water content on the soil surface influenced carbon dioxide release, and this effect increases after precipitation.
Summarizing the experimental results, it could be stated that the influence of various land uses on CO2 efflux is very difficult, because the release of CO2 from the soil is influenced by many other factors. The aim of this research was to study the consequences of changing the meteorological condition per growing season and non-growing season on soil CO2 efflux in natural (forest and grassland) and anthropogenic (no-tillage, reduced tillage, and conventional tillage) land use on Cambisol in Central Lithuania.
2. Materials and Methods
2.1. Site and Soil Description
This research was carried out in Central Lithuania (55°23′38″ N, 23°51′35″ E) Institute of Agriculture, Lithuanian Research Centre for Agriculture and Forestry (Figure 1a). The soil of the local site is classified as Cambisol (loam, drained, Endocalcaric, Endogleyic), according to WRB [23]. Three soil tillage systems (no-tillage (NT), reduced tillage (RT), and conventional tillage (CT)) fertilized with mineral NPK fertilizers according to the soil properties and target yield, and with plant residues returned, were investigated in a long-term field experiment established in 1999 (Table 1).
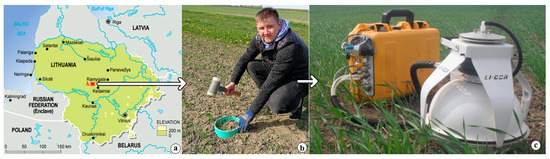
Figure 1.
The investigation soil CO2 efflux ((a)—long-term field experiment site (A); (b)—preparation for CO2 measurement; (c)—measurement of CO2 efflux by LI-COR 8100A).

Table 1.
Treatments of soil tillage systems at the long-term field experiment under investigation.
During the growing season, spring wheat (Triticum aestivum L.) was grown in 2018 (4 April 2018 (BBCH 0); 8 May 2018 (BBCH 12–13); 28 May 2018 (BBCH 33); 27 June 2018 (BBCH 75–77); 25 July 2018 (BBCH 87–89); 3 August 2018 (BBCH 97–99)). Two types of natural land use were investigated: grassland and forest (more details in Kochiieru et al. [4]).
2.2. Measurements of Carbon Dioxide Efflux and Environmental Factors
To study the CO2 efflux into soil, 3 cylinders (diameter 20 cm) were prepared for each treatment (Figure 1b). The soil carbon dioxide efflux (µmol m−2 s−1) was measured using a closed CO2 efflux measurement chamber LI-8100A (Figure 1c). Soil carbon dioxide efflux (3 replications) was measured 6 times per growing season and 5 times per non-growing season in 2018 (more details in Kochiieru et al. [4]). The content of water in the soil and temperature of the soil were recorded by portable sensor HH2 WET (more information in Kochiieru et al. [4]).
2.3. Meteorological Conditions
In 2018, the weather conditions of the growing season were warm and dry. The mean air temperature during the spring wheat growth season was 16.6 °C, and it was 3.1 °C higher than the long-term mean. The total amount of rainfall during the 2018 crop growing period was 265.8 mm, and it was 24.5% lower than the long-term mean. Warm and dry weather conditions were unfavorable for the growth of spring wheat.
2.4. Statistical Analysis
The statistical software package SAS 7.1 was used to calculate the mean (carbon dioxide, temperature, and water content) values and standard errors. The soil CO2 efflux, temperature, and water content were subjected to a one-way analysis of variance (ANOVA) according to land use. Mean values were compared by Duncan’s multiple range tests at a probability level of p < 0.05. Correlation–regression analysis was also implemented.
3. Results
3.1. The Dynamics of CO2 Efflux, Soil Temperature, and Volumetric Water Content
The dynamics of carbon dioxide (CO2), temperature of the soil, and volumetric water content per growing season and non-growing season in different land uses are presented in Table 2, Table 3 and Table 4. The dynamics of the soil CO2 efflux in different land uses are shown in Table 2. After crop sowing, the soil CO2 effluxes increased gradually by reaching the maximum between the beginning of May until the end of June in all land uses (Table 2). The soil CO2 efflux varied from 0.20 ± 0.03 µmol CO2 m−2 s−1 to 3.41 ± 0.39 µmol CO2 m−2 s−1 during the growing season, from 0.10 ± 0.01 µmol CO2 m−2 s−1 to 2.18 ± 0.21 µmol CO2 m−2 s−1 during the non-growing season, with averages during the measurement period of 0.94 ± 0.15 µmol CO2 m−2 s−1, 0.95 ± 0.15 µmol CO2 m−2 s−1, 1.13 ± 0.13 µmol CO2 m−2 s−1, 1.35 ± 0.13 µmol CO2 m−2 s−1, and 1.87 ± 0.21 µmol CO2 m−2 s−1 at the topsoil layer in the conventional tillage, reduced tillage, no-tillage, forest, and grassland, respectively (Table 2). The soil CO2 efflux per growing season was 61% higher than per non-growing season. The CO2 effluxes, averaged across data, in the grassland were 47%, 59%, and 50% higher than in the conventional tillage, 48%, 54%, and 49% higher than in the reduced tillage, 45%, 20%, and 40% higher than in the no-tillage, and 33%, 12%, and 28% higher than in the forest at the topsoil layer per growing season, non-growing season, and measurement period, respectively (Table 2). The CO2 efflux, averaged across data, tended to increase in the following order: conventional tillage (0.39 ± 0.10 µmol CO2 m−2 s−1) < reduced tillage (0.43 ± 0.07 µmol CO2 m−2 s−1) < no-tillage (0.75 ± 0.10 µmol CO2 m−2 s−1) < forest (0.83 ± 0.15 µmol CO2 m−2 s−1) < grassland (0.94 ± 0.18 µmol CO2 m−2 s−1) per non-growing season, reduced tillage (1.38 ± 0.21 µmol CO2 m−2 s−1) < conventional tillage 1.40 ± 0.21 µmol CO2 m−2 s−1) < no-tillage (1.44 ± 0.19 µmol CO2 m−2 s−1) < forest (1.77 ± 0.13 µmol CO2 m−2 s−1) < grassland (2.64 ± 0.22 µmol CO2 m−2 s−1) per growing season, and conventional tillage (0.94 ± 0.15 µmol CO2 m−2 s−1) < reduced tillage (0.95 ± 0.15 µmol CO2 m−2 s−1) < no-tillage (1.13 ± 0.13 µmol CO2 m−2 s−1) < forest (1.35 ± 0.13 µmol CO2 m−2 s−1) < grassland (1.87 ± 0.21 µmol CO2 m−2 s−1) per measurement period.
Table 2.
The dynamics of CO2 efflux (±standard error) in different land uses.
Table 3.
The dynamics of CO2 efflux (±standard error) in different land uses. The dynamics of soil temperature (±standard error) in different land uses.
Table 4.
The dynamics of volumetric water content (±standard error) in different land uses.
The dynamics of soil temperature in different land uses are shown in Table 3. One of the main factors affecting the soil thermal process is anthropogenic and natural land uses per growing and non-growing season. The soil temperature varied from 15.0 °C to 33.6 °C during growing season, from 0.9 °C to 21.3 °C during non-growing season in the anthropogenic land uses, from 11.5 °C to 28.4 °C during growing season, and from 1.4 °C to 21.4 °C during non-growing season in the natural land uses, with averages during the measurement period of 20.1 °C, 19.3 °C, 19.8 °C, 15.8 °C, and 16.6 °C at the 5 cm soil layer in CT, RT, NT, forest, and grassland, respectively (Table 3). Soil temperature averaged; in the anthropogenic land uses, it was 18% higher than in the natural land uses. The temperature of the soil averaged; in the growing season, it was 55% higher than under the non-growing season (Table 3).
The dynamics of the content of water in the soil in various land use are shown in Table 4. The volumetric water content varied from 1.9% to 30.4% during growing season, from 4.7% to 24.2% during non-growing season in the anthropogenic (conventional tillage, reduced tillage, and no-tillage) land uses, from 7.5% to 43.2% during growing season, and from 7.6% to 32.9% during non-growing season in the natural (forest and grassland) land uses, with averages during the measurement period of 12.0%, 12.3%, 13.7%, 19.1%, and 22.8% at the top-soil layer in CT, RT, NT, forest, and grassland, respectively (Table 4). The volumetric water content averaged; in the anthropogenic (CT, RT, and NT) land uses, it was 40% lower than in the natural (forest and grassland) land uses. The volumetric water content averaged; in the growing season, it was 3% higher than under the non-growing season (Table 4).
3.2. The Effect of Temperature of the Soil and Soil Volumetric Water Content on CO2 Efflux
The relationships of CO2 efflux with soil temperature and with volumetric water content (a—at the measurement period; b—at the growing season; c—at the non-growing season) in different land uses are presented in Figure 2, Figure 3, Figure 4, Figure 5, Figure 6, Figure 7, Figure 8, Figure 9, Figure 10 and Figure 11.

Figure 2.
The effect of soil temperature on soil CO2 efflux ((a)—at the measurement period; (b)—at the growing season; (c)—at the non-growing season) in the conventional tillage.

Figure 3.
The effect of soil temperature on soil CO2 efflux ((a)—at the measurement period; (b)—at the growing season; (c)—at the non-growing season) in the reduced tillage.

Figure 4.
The effect of soil temperature on soil CO2 efflux ((a)—at the measurement period; (b)—at the growing season; (c)—at the non-growing season) in the no-tillage.
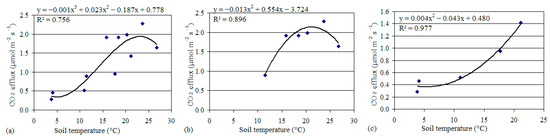
Figure 5.
The effect of soil temperature on soil CO2 efflux ((a)—at the measurement period; (b)—at the growing season; (c)—at the non-growing season) in the forest.
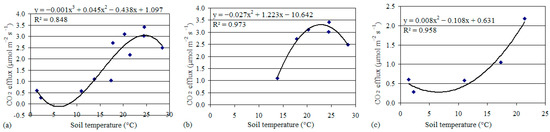
Figure 6.
The effect of soil temperature on soil CO2 efflux ((a)—at the measurement period; (b)—at the growing season; (c)—at the non-growing season) in the grassland.
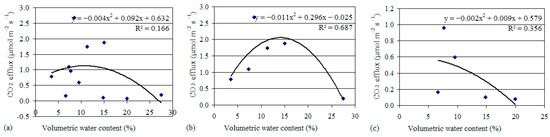
Figure 7.
The effect of content of water on soil CO2 efflux ((a)—at the measurement period; (b)—at the growing season; (c)—at the non-growing season) in the conventional tillage.
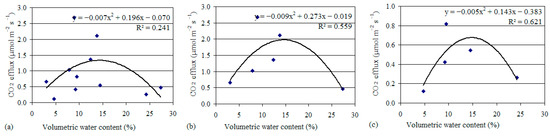
Figure 8.
The effect of content of water on soil CO2 efflux ((a)—at the measurement period; (b)—at the growing season; (c)—at the non-growing season) in the reduced tillage.
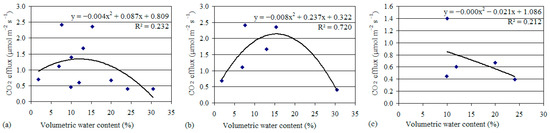
Figure 9.
The effect of content of water on soil CO2 efflux ((a)—at the measurement period; (b)—at the growing season; (c)—at the non-growing season) in the no-tillage.
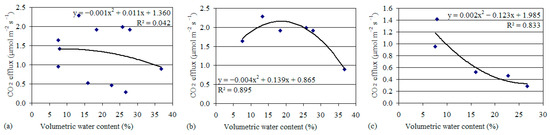
Figure 10.
The effect of content of water on soil CO2 efflux ((a)—at the measurement period; (b)—at the growing season; (c)—at the non-growing season) in the forest.
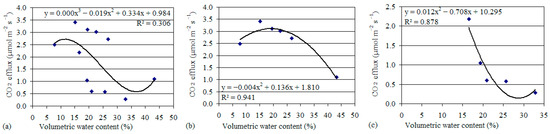
Figure 11.
The effect of content of water on soil CO2 efflux ((a)—at the measurement period; (b)—at the growing season; (c)—at the non-growing season) in the grassland.
In the conventional tillage, the relationship between CO2 efflux and soil temperature can be described by simple multiple regression models: y = 0.002x2 − 0.005x + 0.073; R2 = 0.692, p < 0.05 (at the measurement period, Figure 2a), y = −0.004x2 + 0.299x − 3.570; R2 = 0.514, p < 0.05 (at the growing season, Figure 2b), and y = 0.003x2 − 0.030x + 0.159; R2 = 0.793, p < 0.01 (at the non-growing season, Figure 2c).
In the reduced tillage, the relationship between CO2 efflux and soil temperature can be described by simple multiple regression models: y = 0.002x2 − 0.013x + 0.236; R2 = 0.544, p < 0.05 (at the measurement period, Figure 3a), y = −0.002x2 + 0.187x − 1.808; R2 = 0.293, p > 0.05 (at the growing season, Figure 3b), and y = −0.002x2 + 0.065x + 0.089; R2 = 0.714, p < 0.05 (at the non-growing season, Figure 3c).
In the no-tillage, the relationship between CO2 efflux and soil temperature can be described by simple multiple regression models: y = 0.001x2 + 0.001x + 0.401; R2 = 0.552, p < 0.05 (at the measurement period, Figure 4a), y = −0.003x2 + 0.236x − 2.494; R2 = 0.424, p > 0.05 (at the growing season, Figure 4b), and y = 0.001x2 + 0.001x + 0.430; R2 = 0.558, p < 0.05 (at the non-growing season, Figure 4c).
In the forest, the relationship between CO2 efflux and soil temperature can be described by multiple regression models: y = −0.001x3 + 0.023x2 − 0.187x + 0.778; R2 = 0.756, p < 0.05 (at the measurement period, Figure 5a), y = −0.013x2 + 0.554x − 3.724; R2 = 0.896, p < 0.01 (at the growing season, Figure 5b), and y = 0.004x2 − 0.043x + 0.480; R2 = 0.977, p < 0.01 (at the non-growing season, Figure 5c).
In the grassland, the relationship between CO2 efflux and soil temperature can be described by multiple regression models: y = −0.001x3 + 0.045x2 − 0.438x + 1.097; R2 = 0.848, p < 0.01 (at the measurement period, Figure 6a), y = −0.027x2 + 1.223x − 10.642; R2 = 0.973, p < 0.01 (at the growing season, Figure 6b), and y = 0.008x2 − 0.108x + 0.631; R2 = 0.958, p < 0.01 (at the non-growing season, Figure 6c).
In the conventional tillage, the relationship between CO2 efflux and volumetric water content can be described by simple multiple regression models: y = −0.004x2 + 0.092x + 0.632; R2 = 0.166, p > 0.05 (at the measurement period, Figure 7a), y = −0.011x2 + 0.296x − 0.025; R2 = 0.687, p < 0.05 (at the growing season, Figure 7b), and y = −0.002x2 + 0.009x + 0.579; R2 = 0.356, p > 0.05 (at the non-growing season, Figure 7c).
In the reduced tillage, the relationship between CO2 efflux and volumetric water content can be described by simple multiple regression models: y = −0.007x2 + 0.196x − 0.070; R2 = 0.241, p > 0.05 (at the measurement period, Figure 8a), y = −0.009x2 + 0.273x − 0.019; R2 = 0.559, p < 0.05 (at the growing season, Figure 8b), and y = −0.005x2 + 0.143x − 0.383; R2 = 0.621, p < 0.05 (at the non-growing season, Figure 8c).
In the no-tillage, the relationship between CO2 efflux and volumetric water content can be described by simple multiple regression models: y = −0.004x2 + 0.087x + 0.809; R2 = 0.232, p > 0.05 (at the measurement period, Figure 9a), y = −0.008x2 + 0.237x + 0.322; R2 = 0.720, p < 0.05 (at the growing season, Figure 9b), and y = −0.0002x2 − 0.021x + 1.086; R2 = 0.212, p > 0.05 (at the non-growing season, Figure 9c).
In the forest, the relationship between CO2 efflux and volumetric water content can be described by simple multiple regression models: y = −0.001x2 + 0.011x + 1.360; R2 = 0.042, p > 0.05 (at the measurement period, Figure 10a), y = −0.004x2 + 0.139x + 0.865; R2 = 0.895, p < 0.01 (at the growing season, Figure 10b), and y = 0.002x2 − 0.123x + 1.985; R2 = 0.833, p < 0.01 (at the non-growing season, Figure 10c).
In the grassland, the relationship between CO2 efflux and volumetric water content can be described by multiple regression models: y = 0.0003x3 − 0.019x2 + 0.334x + 0.984; R2 = 0.306, p > 0.05 (at the measurement period, Figure 11a), y = −0.004x2 + 0.136x + 1.810; R2 = 0.941, p < 0.01 (at the growing season, Figure 11b), and y = 0.012x2 − 0.708x + 10.295; R2 = 0.878, p < 0.01 (at the non-growing season, Figure 11c).
4. Discussion
Under different types of land use, the CO2 efflux from the soil closely correlates with the relationship between soil temperature and volumetric water content. Soil CO2 efflux is highly dynamic due to its sensitivity to changing environmental variables such as content moisture in the soil and soil temperature. Today, for the estimating of the carbon dynamics in various ecosystems, the most appropriate approach is the quantification of CO2 efflux from the soil [24]. It should also be taken into account that even between the main parameters of CO2 efflux regulation there are dynamic dependencies; temperature of the soil, being one of the main indicators of the dynamics of soil carbon dioxide efflux, is clearly dependent and regulated by the influence of soil moisture [19]. The lack of information and published studies of the CO2 efflux under growing and non-growing seasons in different land use methods on Cambisol makes the issue of such studies quite urgent. The effects of temperature and water content on CO2 efflux, declared in the results of our research, are also confirmed by the results of research published worldwide. Thus, a positive effect of the temperature of the soil on CO2 efflux during the dry season was found by Faimon and Lang [25]. The research of Chen et al. [26] and Dong et al. [27] also substantiated the dependencies between CO2 efflux and soil temperature. In contrast, research by Pergrina [22] did not rule out the dependencies between CO2 efflux and soil temperature. Many scholars worldwide [28,29] hold the view and state in their publication the correlation between these parameters. Schaufler et al. [30] draws a nonlinear increase in CO2 efflux as a result of soil temperature increases. Pan et al. [31] found that air temperature was the main factor determining the rate of soil CO2 efflux during the non-growing season, although the water content in the soil also played a role. Our results showed that soil temperature (up to 25 °C) resulted in an increase in soil carbon dioxide under the growing and non-growing seasons in different land uses on Cambisol. By increasing the temperature in the soil, soil efflux decreased in natural land uses (forest and grassland) per growing season, but in anthropogenic land uses (CT, RT, and NT), it increased under the measurement period. Kochiieru et al. [32] found that soil temperature (from 20 °C) per growing season decreased the CO2 efflux in forest and grassland on Retisol, which confirms our results. Such a tendency was substantiated also by the research results of Bogužas et al. [33]. Studies by Pla et al. [34] showed that with precipitation and a subsequent increase in soil moisture content to saturation, soil CO2 emissions decreased due to limited oxygen diffusion [35]. Feiza et al. [6] note that the excess topsoil volumetric water content under no-tillage is a limiting factor for CO2 exchange on Cambisol and Planosol. Pena-Quemba et al. [36] prove that the CO2 efflux from the soil decreased when the soil moisture content ranged from 20 to 70%. Due to our research’s results, the increase in the CO2 efflux was fixed under the volumetric water content up to 15–20% under growing season. These results are similar to those reported by Kochiieru et al. [32], showing that the increase in CO2 flux from the soil has increased with the increase in the volumetric water content (up to 25%) under growing season. Chang et al. [37] found that soil water content (from 2 to 16%) increased soil CO2 efflux under the non-growing season, which confirms our results. The results of our research showed that over the measurement period under various land uses, the main factors determining the rate of soil CO2 efflux were volumetric water content and soil temperature. Closely connected results of the dependencies “soil CO2 efflux-soil temperature-volumetric water content” were revealed by Kochiieru et al. [4,5,32]. Also, CO2 efflux from the soil, which depends on soil moisture and temperature [38], is the result of organic matter decomposition, activity of the microbes, and plant root respiration. And the content soil water determines the growth and the root respiration, as well as the biological activity of the soil, which increases when the water content in the soil increases. In the publication of Wei et al. [39], they highlighted that the diffusion of soil gases in soil pores is also influenced by the water content in the soil and soil temperature. Bortolotto et al. [40] noted that the soil water content is an important factor in soil CO2 efflux, while soil temperature is the variable that best explains the dynamics of soil CO2 efflux changes.
From an ecological perspective, this study will help to increase knowledge of the mechanism that explains the response of CO2 to soil temperature and moisture, and to understand how these mechanisms relate to each other in different types of land use. The results of this study show that soil CO2 efflux is limited by soil temperature and soil water content during growing and non-growing seasons in different land uses, which are key factors in the dynamics and formation of soil CO2 emissions. Since our results were mainly based on regressions, the mechanisms of the interaction of soil temperature and moisture on soil CO2 efflux during the growing and non-growing periods should be further studied in future studies.
5. Conclusions
The soil CO2 efflux per growing season was 61% higher than per non-growing season. The CO2 efflux, averaged across data, tended to increase in the following orders: conventional tillage < reduced tillage < no-tillage < forest < grassland (per non-growing season and measurement period) and reduced tillage < conventional tillage < no-tillage < forest < grassland (per growing season).
The soil temperature (up to 25 °C) increased soil CO2 efflux (at the measurement period). By increasing temperature in the soil, soil efflux decreased in natural (forest and grassland) land uses at the growing season, but in anthropogenic (conventional tillage, reduced tillage, and no-tillage) land use, it increased under the measurement period. The volumetric water content had a positive effect on CO2 efflux, but when the water content was higher than 15% (conventional tillage, reduced tillage, and no-tillage) and 20% (forest and grassland) under the growing season, the relationships were negative.
The CO2 efflux from the soil was limited by soil temperature and volumetric water content, which are the key factors of efflux dynamics and formation.
Author Contributions
Conceptualization, M.K.; investigation, M.K. and K.S.; writing—original draft preparation, M.K., A.V. and K.S.; writing—review and editing, M.K., A.V. and I.D.; project administration, V.F.; funding acquisition, V.F. and D.F. All authors have read and agreed to the published version of the manuscript.
Funding
This study was partly supported by the research program “Productivity and sustainability of agricultural and forest soils” implemented by the Lithuanian Research Centre for Agriculture and Forestry. This study was partly supported by the EJP SOIL project “Mechanisms underlying TRAde-offs between Carbon sequestration, greenhouse gas emissions and nutrient losses in Soils under conservation agriculture in Europe (TRACE-Soils) as part of Horizon 2020 Programme”.
Institutional Review Board Statement
Not applicable.
Informed Consent Statement
Not applicable.
Data Availability Statement
The data presented in this study are available on request from the corresponding author.
Conflicts of Interest
The authors declare no conflicts of interest.
References
- Galvonaite, A.; Valiukas, D.; Kilpys, J.; Kitriene, Z.; Misiuniene, M. Climate Atlas of Lithuania; Lithuanian Hydrometeorological Service under the Ministry of Environment: Vilnius, Lithuania, 2013; 175p. [Google Scholar]
- Staugaitis, G.; Vaišvila, Z.J. Dirvožemio Agrocheminiai Tyrimai. In Mokslinė-Methodinė Medžiaga; Lietuvos Agrarinių ir Miškų Mokslų Centro Agrocheminių Tyrimų Laboratorija: Kaunas, Lithuania, 2019; 112p. (In Lithuanian) [Google Scholar]
- Oertel, C.; Matschullat, J.; Zurba, K.; Zimmermann, F.; Erasmi, S. Greenhouse gas emissions from soils—A review. Chem. Erde 2016, 76, 327–352. [Google Scholar] [CrossRef]
- Kochiieru, M.; Lamorski, K.; Feiza, V.; Feiziene, D.; Volungevicius, J. The effect of soil macroporosity, temperature and water content on CO2 efflux in the soils of different genesis and land management. Zemdirb. Agric. 2018, 105, 291–298. [Google Scholar] [CrossRef]
- Kochiieru, M.; Feiza, V.; Feizienė, D.; Volungevičius, J.; Deveikytė, I.; Seibutis, V.; Pranaitienė, S. The effect of environmental factors and root system on CO2 efflux in different types of soil and land uses. Zemdirb. Agric. 2021, 108, 3–10. [Google Scholar] [CrossRef]
- Feiza, V.; Feizienė, D.; Sinkevičiene, A.; Bogužas, V.; Putramentaitė, A.; Lazauskas, S.; Deveikytė, I.; Seibutis, V.; Steponavičienė, V.; Pranaitienė, S. Soil water capacity, pore-size distribution and CO2 e-flux in different soils after long-term no-till management. Zemdirb. Agric. 2015, 102, 3–14. [Google Scholar] [CrossRef]
- Silva, B.O.; Moitinho, M.R.; Santos, G.A.A.; Teixeira, D.D.B.; Fernandes, C.; La Scala, N., Jr. Soil CO2 emission and short-term soil pore class distribution after tillage operations. Soil Tillage Res. 2019, 186, 224–232. [Google Scholar] [CrossRef]
- Zhao, X.; Liu, S.; Pu, C.; Zhang, X.Q.; Xue, J.F.; Zhang, R.; Wang, Y.Q.; Lal, R.; Zhang, H.L.; Chen, F. Methane and nitrous oxide emissions under no-till farming in China: A meta-analysis. Glob. Chang. Biol. 2016, 22, 1372–1384. [Google Scholar] [CrossRef] [PubMed]
- Buragienė, S.; Šarauskis, E.; Romaneckas, K.; Sasnauskienė, J.; Masilionytė, L.; Kriaučiūnienė, Z. Experimental analysis of CO2 emissions from agricultural soils subjected to five different tillage systems in Lithuania. Sci. Total Environ. 2015, 514, 1–9. [Google Scholar] [CrossRef]
- Buragienė, S.; Šarauskis, E.; Romaneckas, K.; Adamavičienė, A.; Kriaučiūnienė, Z.; Avižienytė, D.; Marozas, V.; Naujokienė, V. Relationship between CO2 emissions and soil properties of differently tilled soils. Sci. Total Environ. 2019, 662, 786–795. [Google Scholar] [CrossRef] [PubMed]
- Chen, Z.D.; Dikgwatlhe, S.B.; Xue, J.F.; Zhang, H.L.; Chen, F.; Xiao, X.P. Tillage impacts on net carbon flux in paddy soil of the Southern China. J. Clean. Prod. 2015, 103, 70–76. [Google Scholar] [CrossRef]
- Lu, X.; Lu, X.; Tanveer, S.; Wen, X.; Liao, Y. Effects of tillage management on soil CO2 emission and wheat yield under rain-fed conditions. Soil Res. 2016, 54, 38–48. [Google Scholar] [CrossRef]
- Zhang, Z.; Chen, J.; Liu, T.; Cao, C.; Li, C. Effects of nitrogen fertilizer sources and tillage practices on greenhouse gas emissions in paddy fields of central China. Atmos. Environ. 2016, 144, 274–281. [Google Scholar] [CrossRef]
- Huang, Y.; Ren, W.; Wang, L.; Hui, D.; Grove, J.H.; Yang, X.; Tao, B.; Goff, B. Greenhouse gas emissions and crop yield in no-tillage systems: A meta analysis. Agric. Ecosyst. Environ. 2018, 268, 144–153. [Google Scholar] [CrossRef]
- Plaza-Bonilla, D.; Cantero-Martínez, C.; Bareche, J.; Arrúe, J.; Álvaro-Fuentes, J. Soil carbon dioxide and methane fluxes as affected by tillage and N fertilization in dryland conditions. Plant Soil 2014, 381, 111–130. [Google Scholar] [CrossRef]
- Feiziene, D.; Feiza, V.; Kadziene, G.; Slepetiene, A. Endocalcari Epihypogleyic Cambisol arable layer agrochemical properties soil changes in a long-term soil management systems. Agric. Sci. 2008, 15, 13–23. [Google Scholar]
- Wiseman, P.E.; Seiler, J.R. Soil CO2 efflux across four age classes of plantation loblolly pine (Pinus taeda L.) on the Virginia Piedmont. For. Ecol. Manag. 2004, 192, 297–311. [Google Scholar] [CrossRef]
- Ghimire, R.; Norton, U.; Bista, P.; Obour, A.K.; Norton, J.B. Soil organic matter, greenhouse gases and net global warming potential of irrigated conventional, reduced tillage and organic cropping systems. Nutr. Cycl. Agroecosyst. 2017, 107, 49–62. [Google Scholar] [CrossRef]
- Putramentaitė, A.; Feizienė, D.; Feiza, V.; Antanaitis, Š.; Deveikytė, I.; Seibutis, V.; Janušauskaitė, D. The influence of tillage, fertilization and meteorological conditions on the CO2 exchange rate in a loamy Cambisol. Zemdirb. Agric. 2014, 101, 227–234. [Google Scholar] [CrossRef]
- Fang, C.; Moncrieff, J.B. The dependence of soil CO2 efflux on temperature. Soil Biol. Biochem. 2001, 33, 155–165. [Google Scholar] [CrossRef]
- Rey, A.; Pegoraro, E.; Oyonarte, C.; Were, A.; Escribano, P.; Raimundo, J. Impact of land degradation on soil respiration in a steppe (Stipa tenacissima L.) semi-arid ecosystem in the SE of Spain. Soil Biol. Biochem. 2011, 43, 393–403. [Google Scholar] [CrossRef]
- Pergrina, F. Surface soil properties influence carbon oxide pulses after precipitation events in a semiarid vineyard under conventional tillage and cover crops. Pedosphere 2016, 26, 499–509. [Google Scholar] [CrossRef]
- IUSS Working Group WRB. World Reference Base for Soil Resources 2014, Update International Soil Classification System for Naming Soils and Creating Legends for Soil Maps; World Soil Resources Reports No. 106; FAO: Rome, Italy, 2015. [Google Scholar] [CrossRef]
- Noh, N.J.; Son, Y.; Lee, S.K.; Yoon, T.K.; Seo, K.W.; Kim, C.; Lee, W.K.; Bae, S.W.; Hwang, J. Influence of stand density on soil CO2 efflux for a Pinus densiflora forest in Korea. J. Plant Res. 2010, 123, 411–419. [Google Scholar] [CrossRef] [PubMed]
- Faimon, J.; Lang, M. What actually controls the minute to hour changes in soil carbon dioxide concentrations? Geoderma 2018, 323, 52–64. [Google Scholar] [CrossRef]
- Chen, W.; Jia, X.; Li, C.; Yu, H.; Xie, J.; Wang, B.; Wu, Y.; Wang, S. Extreme rainfall impacts on soil CO2 efflux in an urban ecosystem in Beijing, China. Can. J. Soil Sci. 2016, 96, 504–514. [Google Scholar] [CrossRef]
- Dong, W.; Liu, E.; Wang, J.; Yan, C.; Li, J.; Zhang, Y. Impact of tillage management on the short- and long-term soil carbon dioxide emissions in the dryland of Loess Plateau in China. Geoderma 2017, 307, 38–45. [Google Scholar] [CrossRef]
- Finzi, A.C.; Raymer, P.C.L.; Giasson, M.A.; Orwig, D.A. Net primary production and soil respiration in New England hemlock forests affected by the hemlock woolly adelgid. Ecosphere 2014, 5, 1–16. [Google Scholar] [CrossRef]
- Zeng, X.; Gao, Y. Short-term effects of drying and rewetting on CO2 and CH4 emissions from High-Altitude Peatlands on the Tibetan Plateau. Atmosphere 2016, 7, 148–154. [Google Scholar] [CrossRef]
- Schaufler, G.; Kitzler, B.; Schindlbacher, A.; Skiba, U.; Sutton, M.A. Greenhouse gas emissions from European soils under different land use: Effects of soil moisture and temperature. Eur. J. Soil Sci. 2010, 61, 683–696. [Google Scholar] [CrossRef]
- Pan, Z.; Johnson, D.A.; Wei, Z.; Ma, L. Non-growing season soil CO2 efflux patterns in five land-use types in northern China. Atmos. Environ. 2016, 144, 160–167. [Google Scholar] [CrossRef]
- Kochiieru, M.; Veršulienė, A.; Feiza, V.; Feizienė, D. Trend for Soil CO2 Effect in Grassland and Forest Land in Relation with Meteorological Conditions and Root Parameters. Sustainability 2023, 15, 7193. [Google Scholar] [CrossRef]
- Bogužas, V.; Sinkevičienė, A.; Romaneckas, K.; Steponavičienė, V.; Skinulienė, L.; Butkevičienė, L.M. The impact of tillage intensity and meteorogical conditions on soil temperature, moisture content and CO2 efflux in maize and spring barley cultivation. Zemdirb. Agric. 2018, 105, 307–314. [Google Scholar] [CrossRef]
- Pla, C.; Cuezva, S.; Martinez-Martinez, J.; Fernandez-Cortes, A.; Garcia-Anton, E.; Fusi, N.; Crosta, G.B.; Cuevas-Gonzalez, J.; Canaveras, J.C.; Sanchez-Moral, S.; et al. Role of soil pore structure in water infiltration and CO2 exchange between the atmosphere and underground air in the vadose zone: A combined laboratory and field approach. Catena 2017, 149, 402–416. [Google Scholar] [CrossRef]
- Deng, Q.; Hui, D.; Chu, G.; Han, X.; Zhang, Q. Rain-induced changes in soil CO2 flux and microbial community composition in a tropical forest of China. Sci. Rep. 2017, 7, 5539. [Google Scholar] [CrossRef] [PubMed]
- Pena-Quemba, D.; Rubiano-Sanabria, Y.; Riveros-Iregui, D. Effects of land use on soil CO2 flux in Paramo de Guerrero, Colombia. Agron. Colomb. 2016, 34, 364–373. [Google Scholar] [CrossRef]
- Chang, Z.Q.; Liu, X.Q.; Feng, Q.; Che, Z.X.; Xi, H.Y.; Su, Y.H.; Si, J.H. Non-growing season soil CO2 efflux and its changes in an alpine meadow ecosystem of the Qilian Mountains, Northwest China. J. Arid Land 2013, 5, 488–499. [Google Scholar] [CrossRef][Green Version]
- Pumpanen, J.; Kulmala, L.; Linden, A.; Kolari, P.; Nikinmaa, E.; Hari, P. Seasonal dynamics of autotrophic respiration in boreal forest soil estimated by continuous chamber measurements. Boreal Environ. Res. 2015, 20, 637–650. [Google Scholar]
- Wei, S.; Zhang, X.; McLaughlin, N.B.; Liang, A.; Jia, S.; Chen, X.; Chen, X. Effect of soil temperature and soil moisture on CO2 flux from eroded landscape positions on black soil in Northeast China. Soil Tillage Res. 2014, 144, 119–125. [Google Scholar] [CrossRef]
- Bortolotto, R.P.; Amado, T.J.C.; Nora, D.D.; Keller, C.; Roberti, D.; Fiorin, J.E.; Reichardt, K.; Zamberlan, J.F.; Pasini, M.P.B.; Nicoloso, R.S. Soil carbon dioxide flux in a no-tillage winter system. Afr. J. Agric. Res. 2015, 10, 450–457. [Google Scholar] [CrossRef]
Disclaimer/Publisher’s Note: The statements, opinions and data contained in all publications are solely those of the individual author(s) and contributor(s) and not of MDPI and/or the editor(s). MDPI and/or the editor(s) disclaim responsibility for any injury to people or property resulting from any ideas, methods, instructions or products referred to in the content. |
© 2024 by the authors. Licensee MDPI, Basel, Switzerland. This article is an open access article distributed under the terms and conditions of the Creative Commons Attribution (CC BY) license (https://creativecommons.org/licenses/by/4.0/).