Article

Use of Continuous Stirred Tank Reactors for Anaerobic Co-Digestion of Dairy and Meat Industry By-Products for Biogas Production

1
Dipartimento di Agraria, Università Mediterranea di Reggio Calabria, Loc. Feo di Vito, 89122 Reggio Calabria, Italy
2
Institute of Environmental Biotechnology, BOKU University, Konrad-Lorenz. Straße 20, 3430 Tulln an der Donau, Austria
*
Author to whom correspondence should be addressed.
Sustainability 2024, 16(11), 4346; https://doi.org/10.3390/su16114346
Submission received: 13 March 2024 / Revised: 14 May 2024 / Accepted: 17 May 2024 / Published: 21 May 2024

Abstract

:
The dairy and meat industries generate thousands of tons of organic waste and by-products each year, making them two of the least environmentally sustainable sectors. Typical waste includes not only processing by-products such as curds but also commercial products that are defective or unsaleable due to expiration or damaged packaging. This study aimed to evaluate the methanogenic potential of a mixture of 80% inedible curds and 20% expired sausages, as a substrate, using two continuously stirred tank reactors (CSTR). The reactors were fed daily with increasing doses of the 80–20% mixture and an organic loading rate ranging from 0.31 gVS/litre/day at the beginning of the trials to 7.20 gVS/litre/day toward the end. The produced biogas was continuously analysed from both quantitative and qualitative point of view. Also, the process was continuously monitored by withdrawing samples from each reactor during the whole process, to analyse their physical–chemical parameters, including pH, total solids (TS), total volatile solids (TVS), chemical oxygen demand (COD), ammonium nitrogen (NH4+-N), total Kjeldahl nitrogen (TKN) and total volatile fatty acids (VFA). The results of this study show a promising increase in biogas production with the increase in feed. In terms of biogas production, organic waste from the dairy and meat industry shows the potential to be exploited as a substrate to produce biomethane. Indeed, in this study, biomethane cumulative production reached 410.86 NLCH4∙gTVS−1 using an 8 L capacity reactor filled up to 6 L. This makes the tested by-products usable as a renewable energy source in the future, particularly within a circular economy approach, helping to mitigate the effects of global warming and addressing sustainable development goals.

1. Introduction

The concept of sustainability in energy production is becoming increasingly important as the world seeks to transition to more environmentally friendly sources. According to Obaiden et al. (2022) [1], rapid population growth and industrial progress have led to the accumulation of greenhouse gases in the atmosphere and consequently to the accentuation of climate changes. To avoid negative impacts on ecosystems and societies, the temperature increase must be limited to 1.5 °C [2]. This goal is still achievable, but it requires net-zero global emissions by 2050 and urgent, concrete, and sustained international efforts to tackle climate change. Biomethane, included in biogas, is a renewable and cleaner alternative to traditional fossil fuels. It is produced through the anaerobic digestion of organic matter including waste and residues such as food waste and agricultural by-products. The anaerobic digestion process (AD) breaks down complex organic matter into useful biogas through biochemical reactions [3]. In comparison to other waste treatment technologies, it is an attractive solution for the treatment of organic waste and the production of bioenergy and biofertilisers at the same time [4]. Biogas and biomethane production offer a sustainable solution to mitigate climate change, promote circular economy principles, and increase energy security. Governments, industries, and communities around the world are investing in and promoting the use of biogas technology to accelerate the transition to a cleaner and more sustainable energy future [5]. For example, among the policies that have been implemented, we can cite the European Commission’s REPowerEU plan [6], which aims at ending the dependence on Russian fossil fuels by 2030. In terms of biomethane, an annual production target of 35 billion cubic meters by 2030 has been set. This is the equivalent of 20% of the gas imported from Russia before the war in Ukraine. Among food by-products that can be used to produce biogas, waste from the dairy and meat industries constitutes an important source of convertible organic matter. On one side, dairy plants must deal with by-products such as whey, buttermilk, and wastewater from the processing of cheese. Treating the effluent to meet discharge regulations can be difficult and costly. If the discharge is treated by a local wastewater company, it may charge an extra fee for the high chemical and biochemical oxygen demand. On the other side, meat industries produce large amounts of organic by-products, up to 53% of the animal’s live weight [7]. In addition to manure and slurry from livestock farms, blood from the bleeding process, giblets from the removal of rumen and intestines, intestinal residues from the evisceration process, and fat from the trimming of meat and bones are added to residues during meat processing, without forgetting sludge from the slaughterhouse effluent treatment plant [7]. Furthermore, defective, or unsaleable commercial products due to expiration or damaged packaging must be disposed of and managed sustainably. Anaerobic digestion of these kinds of waste can decrease environmental concerns and produce clean energy. Furthermore, the solid anaerobic digestion by-product contains valuable nutrients that can be used as fertiliser and/or soil conditioners [8]. The presence of carbohydrates in dairy effluents promotes the growth of acidifying bacteria destabilising the reactor by inhibiting the methanogenic bacterial consortium. To address this issue, researchers have suggested co-digesting dairy effluents with other waste materials, such as manure, goat straw litter, spent grain from brewing, cattle dung, poultry, or livestock waste [9,10,11]. These combinations can maintain the carbon/nitrogen (C/N) ratio and microbial synergism in a state that favors the growth of methanogenic bacteria, indirectly increasing biogas production [12]. Escalante et al. [13] determined the biomethane potential of dairy wastewater using cattle slurry as inoculum. The result of the biochemical methane potential (BMP) tests showed methane yields of 0.51–0.60 L CH4/g TVS added. Other researchers reported a BMP value of 338.9 mL CH4/g COD from cheese whey treatment by anaerobic digestion [14]. Cheese way fraction can reach up to 60% of the substrate if digested with cattle manure as performed by Bella and Venkateswara Rao [15] who obtained the highest biogas production (342.22 mL/gVS). Regarding the meat process, Matjuda et al. [16] report a high potential as feedstock for anaerobic digestion when it falls within the recommended values of pH, VS, C/N ratio, etc. Furthermore, the same authors showed the importance of pasteurisation and sterilisation of abattoir waste before anaerobic digestion. The mixtures containing by-products from the dairy and meat processing industries were barely discussed and tested. Hence, The present study aimed to evaluate the potential of meat and milk industry by-products to produce biomethane in an anaerobic co-digestion continuous process using a laboratory scale continuously stirred tank reactors. Furthermore, it analyses process parameters and the physical–chemical behaviour of the substrate during the whole duration of the process.

2. Materials and Methods

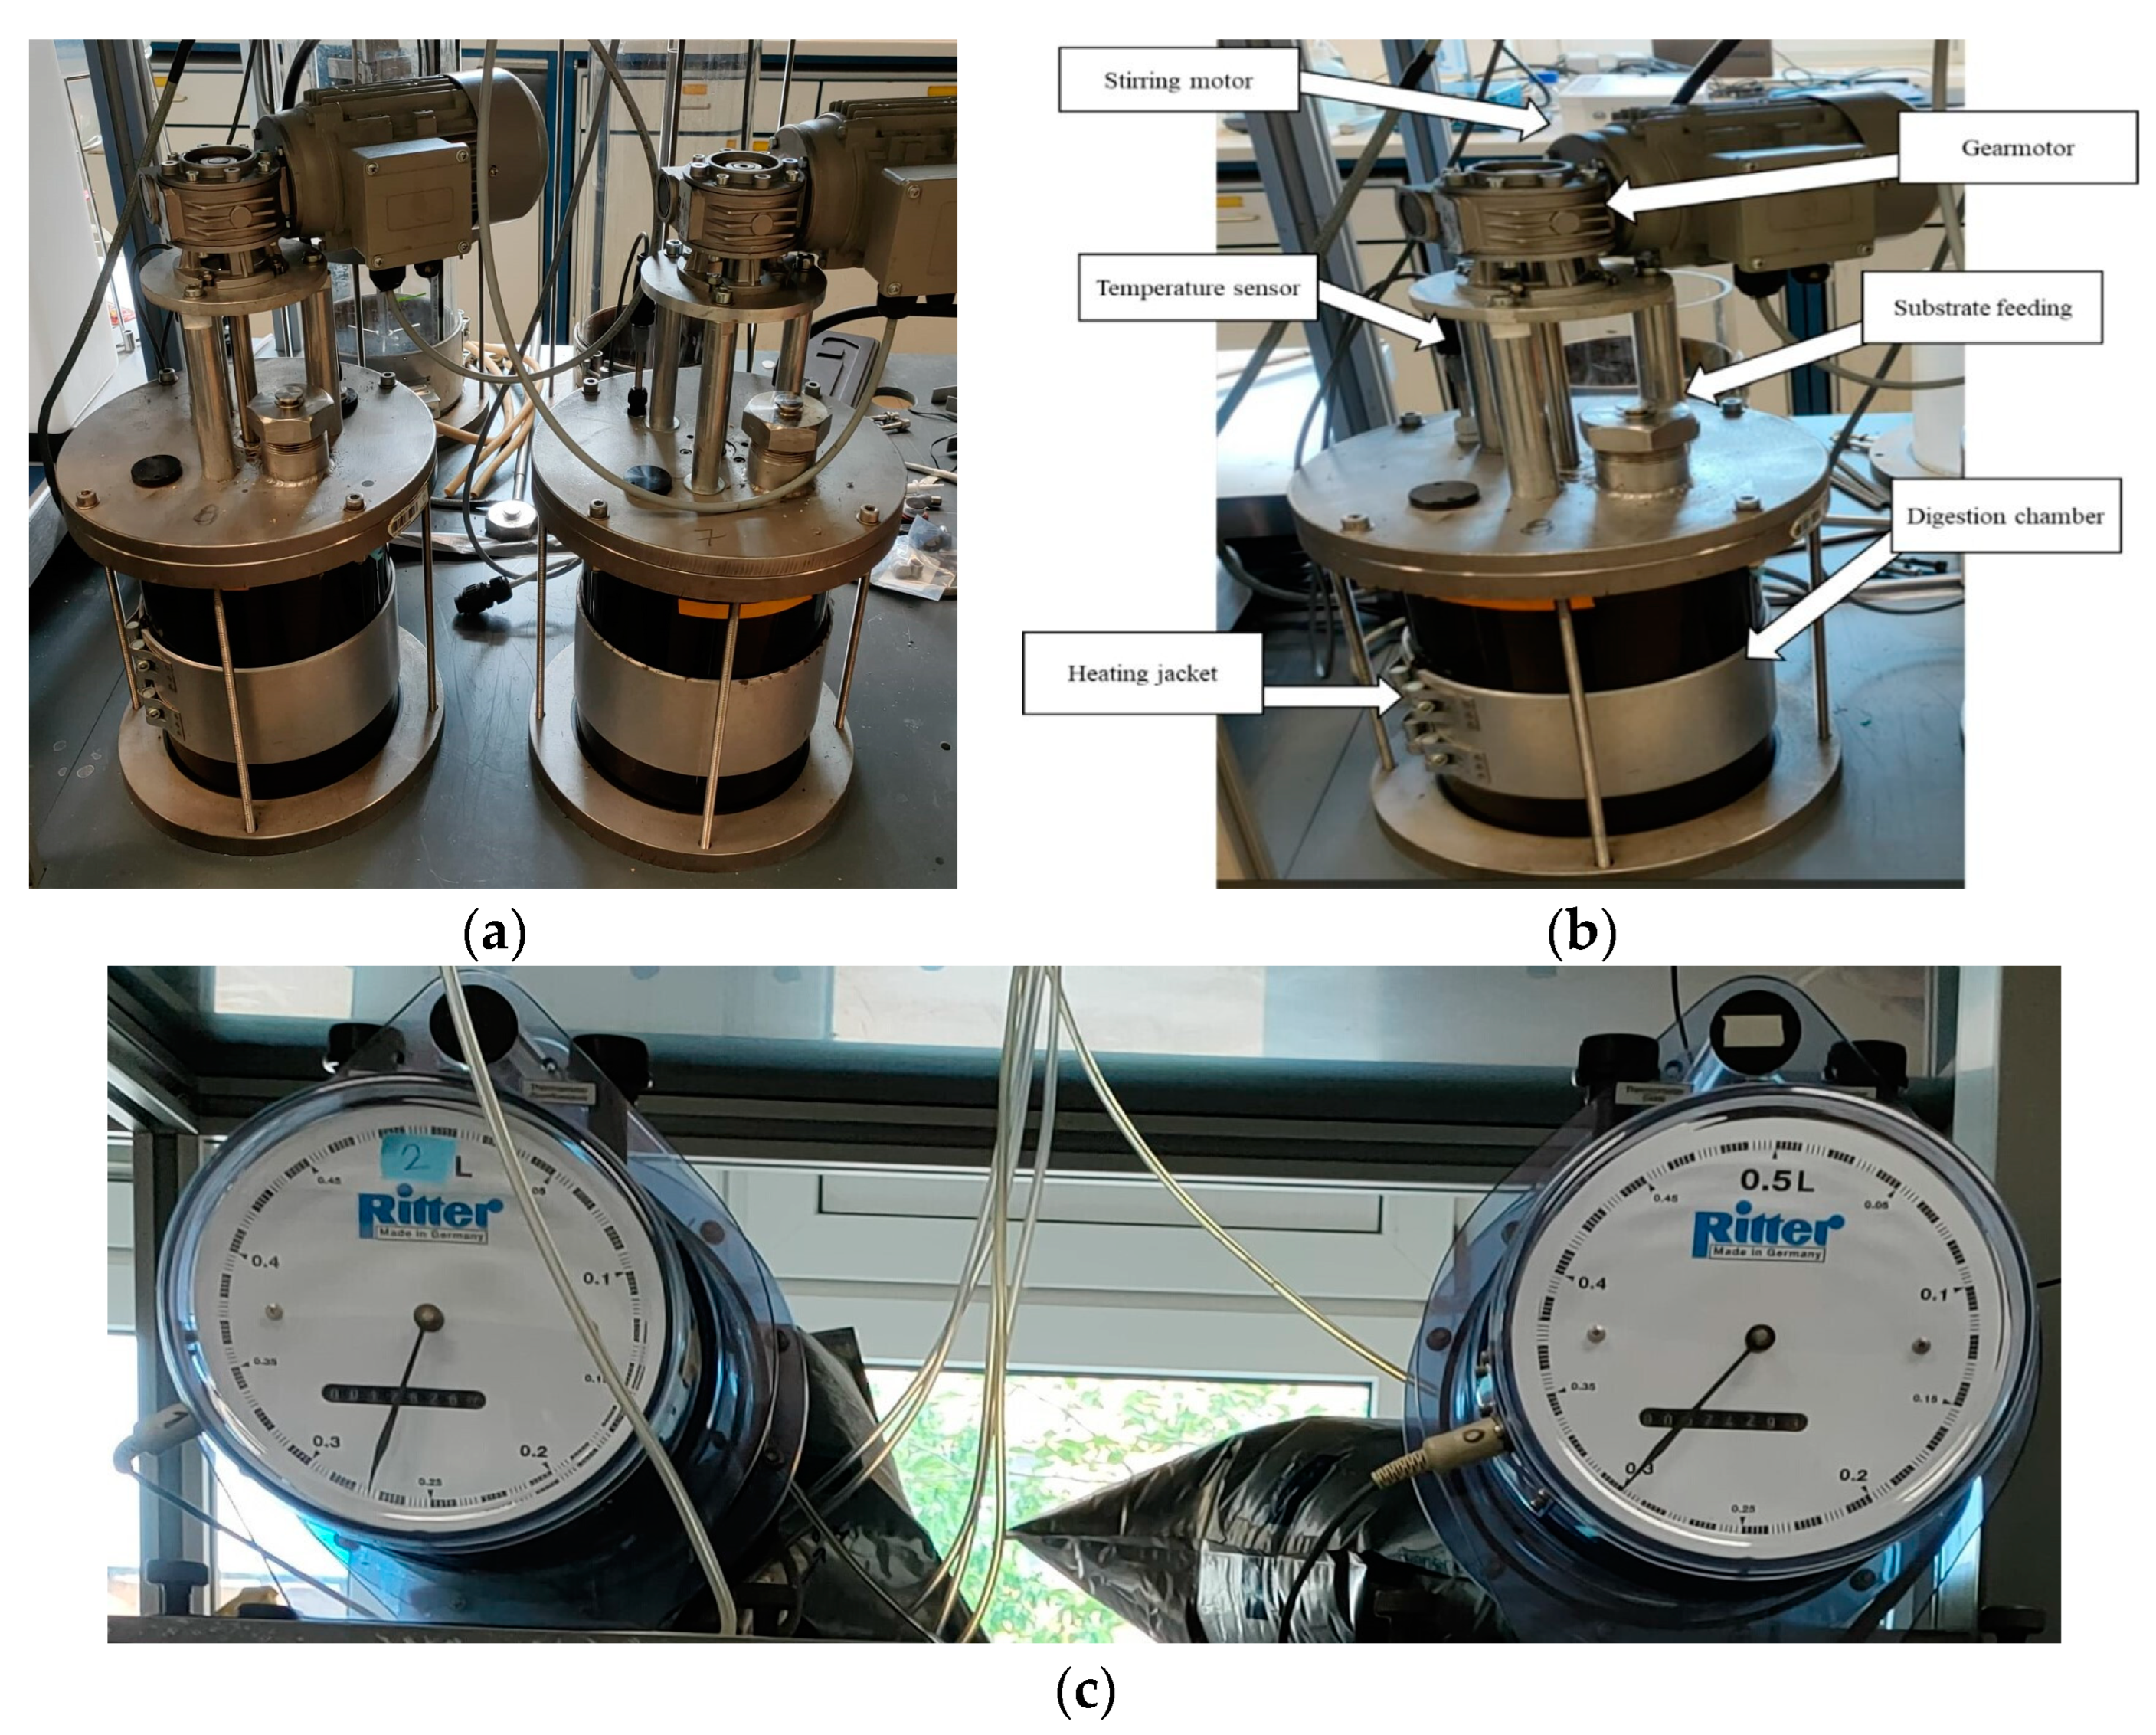
2.1. The CSTR Reactors

The reactors, of 8 L capacity each, were constructed with suitable materials to maintain an anoxic and pressure-tight environment. Figure 1 illustrates one reactor, which comprises a digestion chamber, an agitation system, and a system for qualitative and quantitative measurement of the produced biogas. The reaction chamber is made up of stainless-steel plates that enclose a tempered glass cylinder, which forms the reactor’s core. The stirring system is located at the top of the cylinder. The system comprises a three-phase electric motor block connected to a geared motor that can adjust the speed of the electric motor. Additionally, the system includes a temperature probe, a biogas outlet, and a reactor heating system. The amount of the produced biogas is measured using a drum-type gas meter (Ritter TG 0.5 drum gas meter) and collected and stored in a gas bag for subsequent characterisation using a gas analyser (Awite, AwiFLEX Cool+, Langenbach, Germany). Such an analyser is provided with a sensor system consisting of infrared 2-beam sensors for methane, carbon dioxide, and carbon monoxide to determine their volume up to 100%, and electrochemical and/or thermal conductivity sensors for the determination of carbon monoxide, oxygen, hydrogen sulfide, and hydrogen.

2.2. Experimental Set-Up

Before loading the reactors with the inoculum and the mixture containing 80% curd and 20% expired sausages, the physical–chemical characteristics of the matrices were analysed. The inoculum was composed of anaerobic sludge coming from three different industrial plants. The results of the analysis are presented in Table S1 (Supplementary Material). Both reactors were filled with 6 litres of inoculum and fed daily with an 80–20% mixture of curd and expired sausage paste, with increasing doses every three days. This mixture has been chosen according to the results of batch BMP tests (Unpublished data; manuscript in preparation) considering the matrices characteristics, particularly in terms of volatile solids. Indeed, to avoid inhibitory phenomenon the ratio between volatile solids of the substrate and those of the inoculum must not exceed 0.5. Reactors 1 and 2 operated with the same process parameters and under the same conditions. The experiment lasted 48 days (T0 is the start day while T48 is the end day) under mesophilic conditions at 37 °C. The bacterial consortium in the reactors was acclimatised by gradually increasing the amount of feed. If a large amount of substrate had been fed to the two reactors from the beginning, the consortium in the inoculum would not have been able to digest it. For chemical-physical characterisation, samples were taken from each reactor every three days after increasing the feed. Table S2 (Supplementary Material) shows that at the beginning (T0), the reactors were fed with only 6 g of substrate. The dose was then increased twice every three days until the last days of the experiment when 140 g of substrate was used. The pH, temperature, and gas composition were continuously measured. Furthermore, every time the feeding amount increased, a 50 mL sample of the reactor contents was extracted for physicochemical analysis. All relevant reactor parameters, for the initiation and maintenance of anaerobic digestion were assessed. Measurements were repeated in triplicate for each sample.

2.3. Physical–Chemical Characterisation of the Used Matrices

2.3.1. pH

The pH is an indicator of process stability. It is related to the buffering capacity of the system and the balance of microorganisms involved in the process. For pH values between 6.5 and 7.5, the digestion process is generally considered stable [17]. The measurement of this parameter can indicate whether there are unbalanced conditions in the system, but only with a certain delay in the evolution of the buffering effect of the medium [18]. A pH meter (CRISON pH-Meter GLP 21+) was used for pH determination of the used matrices.

2.3.2. Total Solids and Volatile Total Solids

TS and TVS were determined according to Method 1684 for total, fixed, and volatile solids in water, solids, and biosolids [19]. Hence, TS was determined after drying the samples in a ventilated oven (Heraeus Kendro UT6200 Oven) at 105 °C. For the determination of TVS, the samples were subjected to ignition in a muffle furnace (Heraeus, M110, Unanderra, NSW, Australia) at 550 °C for four hours.

2.3.3. Ammonium Nitrogen and Total Kjeldahl Nitrogen Determination

The determination of the critical threshold concentrations of total ammonia nitrogen in anaerobic digestion reactors is quite difficult as it depends on the nature and characteristics of the substrate to be digested [20]. Under high ammonia concentrations, the buffering capacity of the digester is not efficient [21]. Nitrogen content can be calculated using total Kjeldahl nitrogen (TKN), which is the conversion of organic nitrogen to ammonium nitrogen by boiling feed samples with sulphuric acid and a catalyst. The ammonium is then distilled into an acid solution and measured. Ammonium nitrogen (NH4+-N) can be determined according to the methodology described in APHA (1998) [22]. In our case, for the determination of ammonium and total Kjeldahl nitrogen, the method specified by the instrument manufacturer (B.U.C.H.I Auto Kjeldahl Distillation Unit K-370) was followed.

2.3.4. Chemical Oxygen Demand (COD) Determination

Chemical oxygen demand (COD) is the amount of oxygen in mg required to complete chemical oxidation of the organic and inorganic compounds present in a sample. It is expressed as mg L−1 COD or mg L−1 O2. The method involves oxidation employing a solution of potassium dichromate in the presence of concentrated sulphuric acid and silver sulphate as an oxidation catalyst. The excess dichromate is titrated with a solution of ammonium sulphate and iron. The concentration of oxidisable organic and inorganic substances, under the conditions of the method, is proportional to the amount of potassium dichromate consumed. The chloride ion is considered an interferent, as its oxidation can only take place under the conditions of the method used for COD and not under those found in natural waters. Knowledge of COD values, as mentioned above, is necessary both to quantify the organic matter present in the samples and to have a rough estimate of biomethane production [23].

2.3.5. Determination of Total Volatile Fatty Acids (VFA) by HPLC

VFA concentration is expressed as acetic acid in the volume of material (mg/L). VFA are short-chain fatty acids (C-3, C-4, C-5) such as acetic acid, propionic acid, etc. They are intermediate products in anaerobic digestion process and constitute the precursors for the production of hydrogen and methane [24]. They are produced in the two first stages of anaerobic digestion process and their concentration depends on several parameters including substrate characteristics, process parameters, and bacterial consortium [25]. The ratio of propionate to acetate is one of the AD process stability indicators [26]. For the determination of VFA, it was necessary to subject the samples to extraction and purification before analysing them using high-performance liquid chromatography (HPLC) with an Agilent Serie 1200.
The following standards, listed according to their retention time, were used as internal standards for the quantification of total VFA: (1) citric acid [C6H8O7], (2) gluconic acid [C6H12O7], (3) lactic acid [C3H6O3], (4) fumaric acid [C4H4O4], (5) acetic acid [CH3COOH], (6) propionic acid [C3H6O2], (7) iso-butyric acid [(CH3)2CHCOOH], (8) butyric acid [C4H8O2], (9) crotonic acid [C4H6O2], (10) iso-valeric acid [C5H10O2], (11) valeric acid [C5H10O2], (12) capronic acid [C6H12O2]. The VFA examined for the control of the anaerobic digestion process were six, i.e., acetic acid, propionic acid, iso-butyric acid, iso-valeric acid, and valeric acid.

2.4. Data Analysis

The obtained results were statistically analysed by performing a one-way analysis of variance ANOVA, and subsequent Tukey’s honest significant difference (HSD) post-hoc test for pairwise comparisons among the tested groups at p < 0.05. Statistical analyses were performed in R version 4.3.3.

3. Results and Discussions

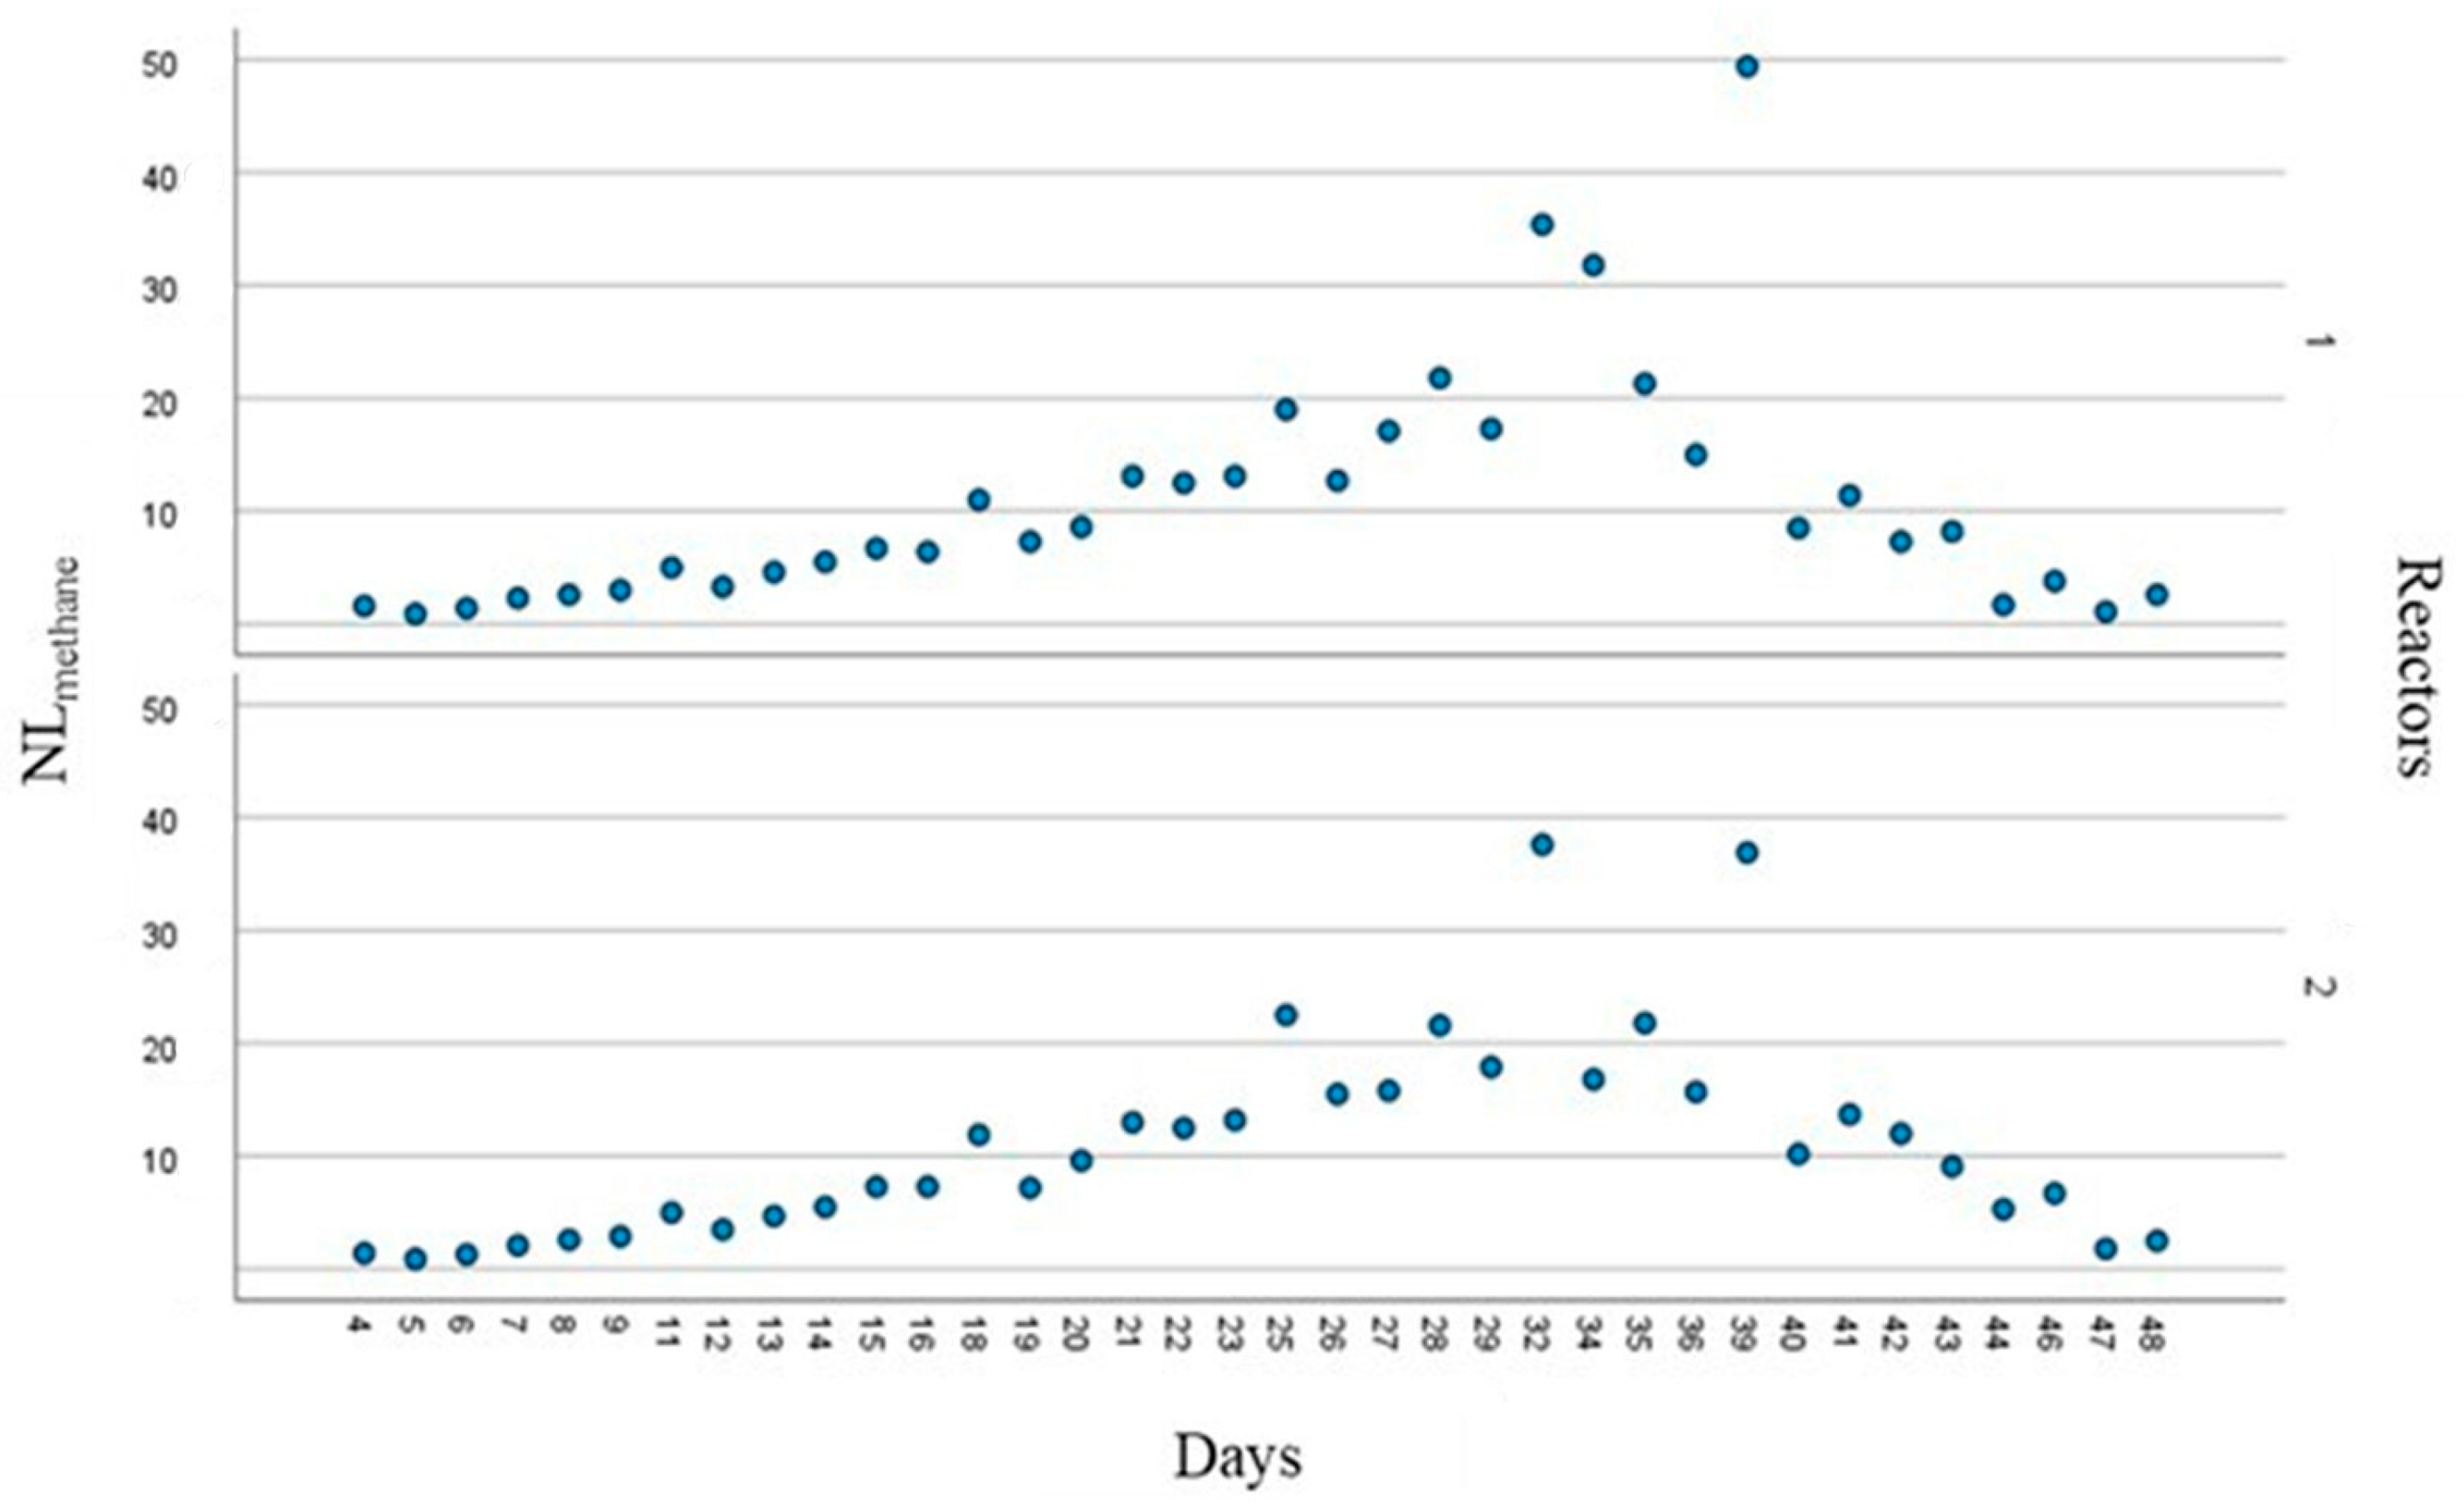
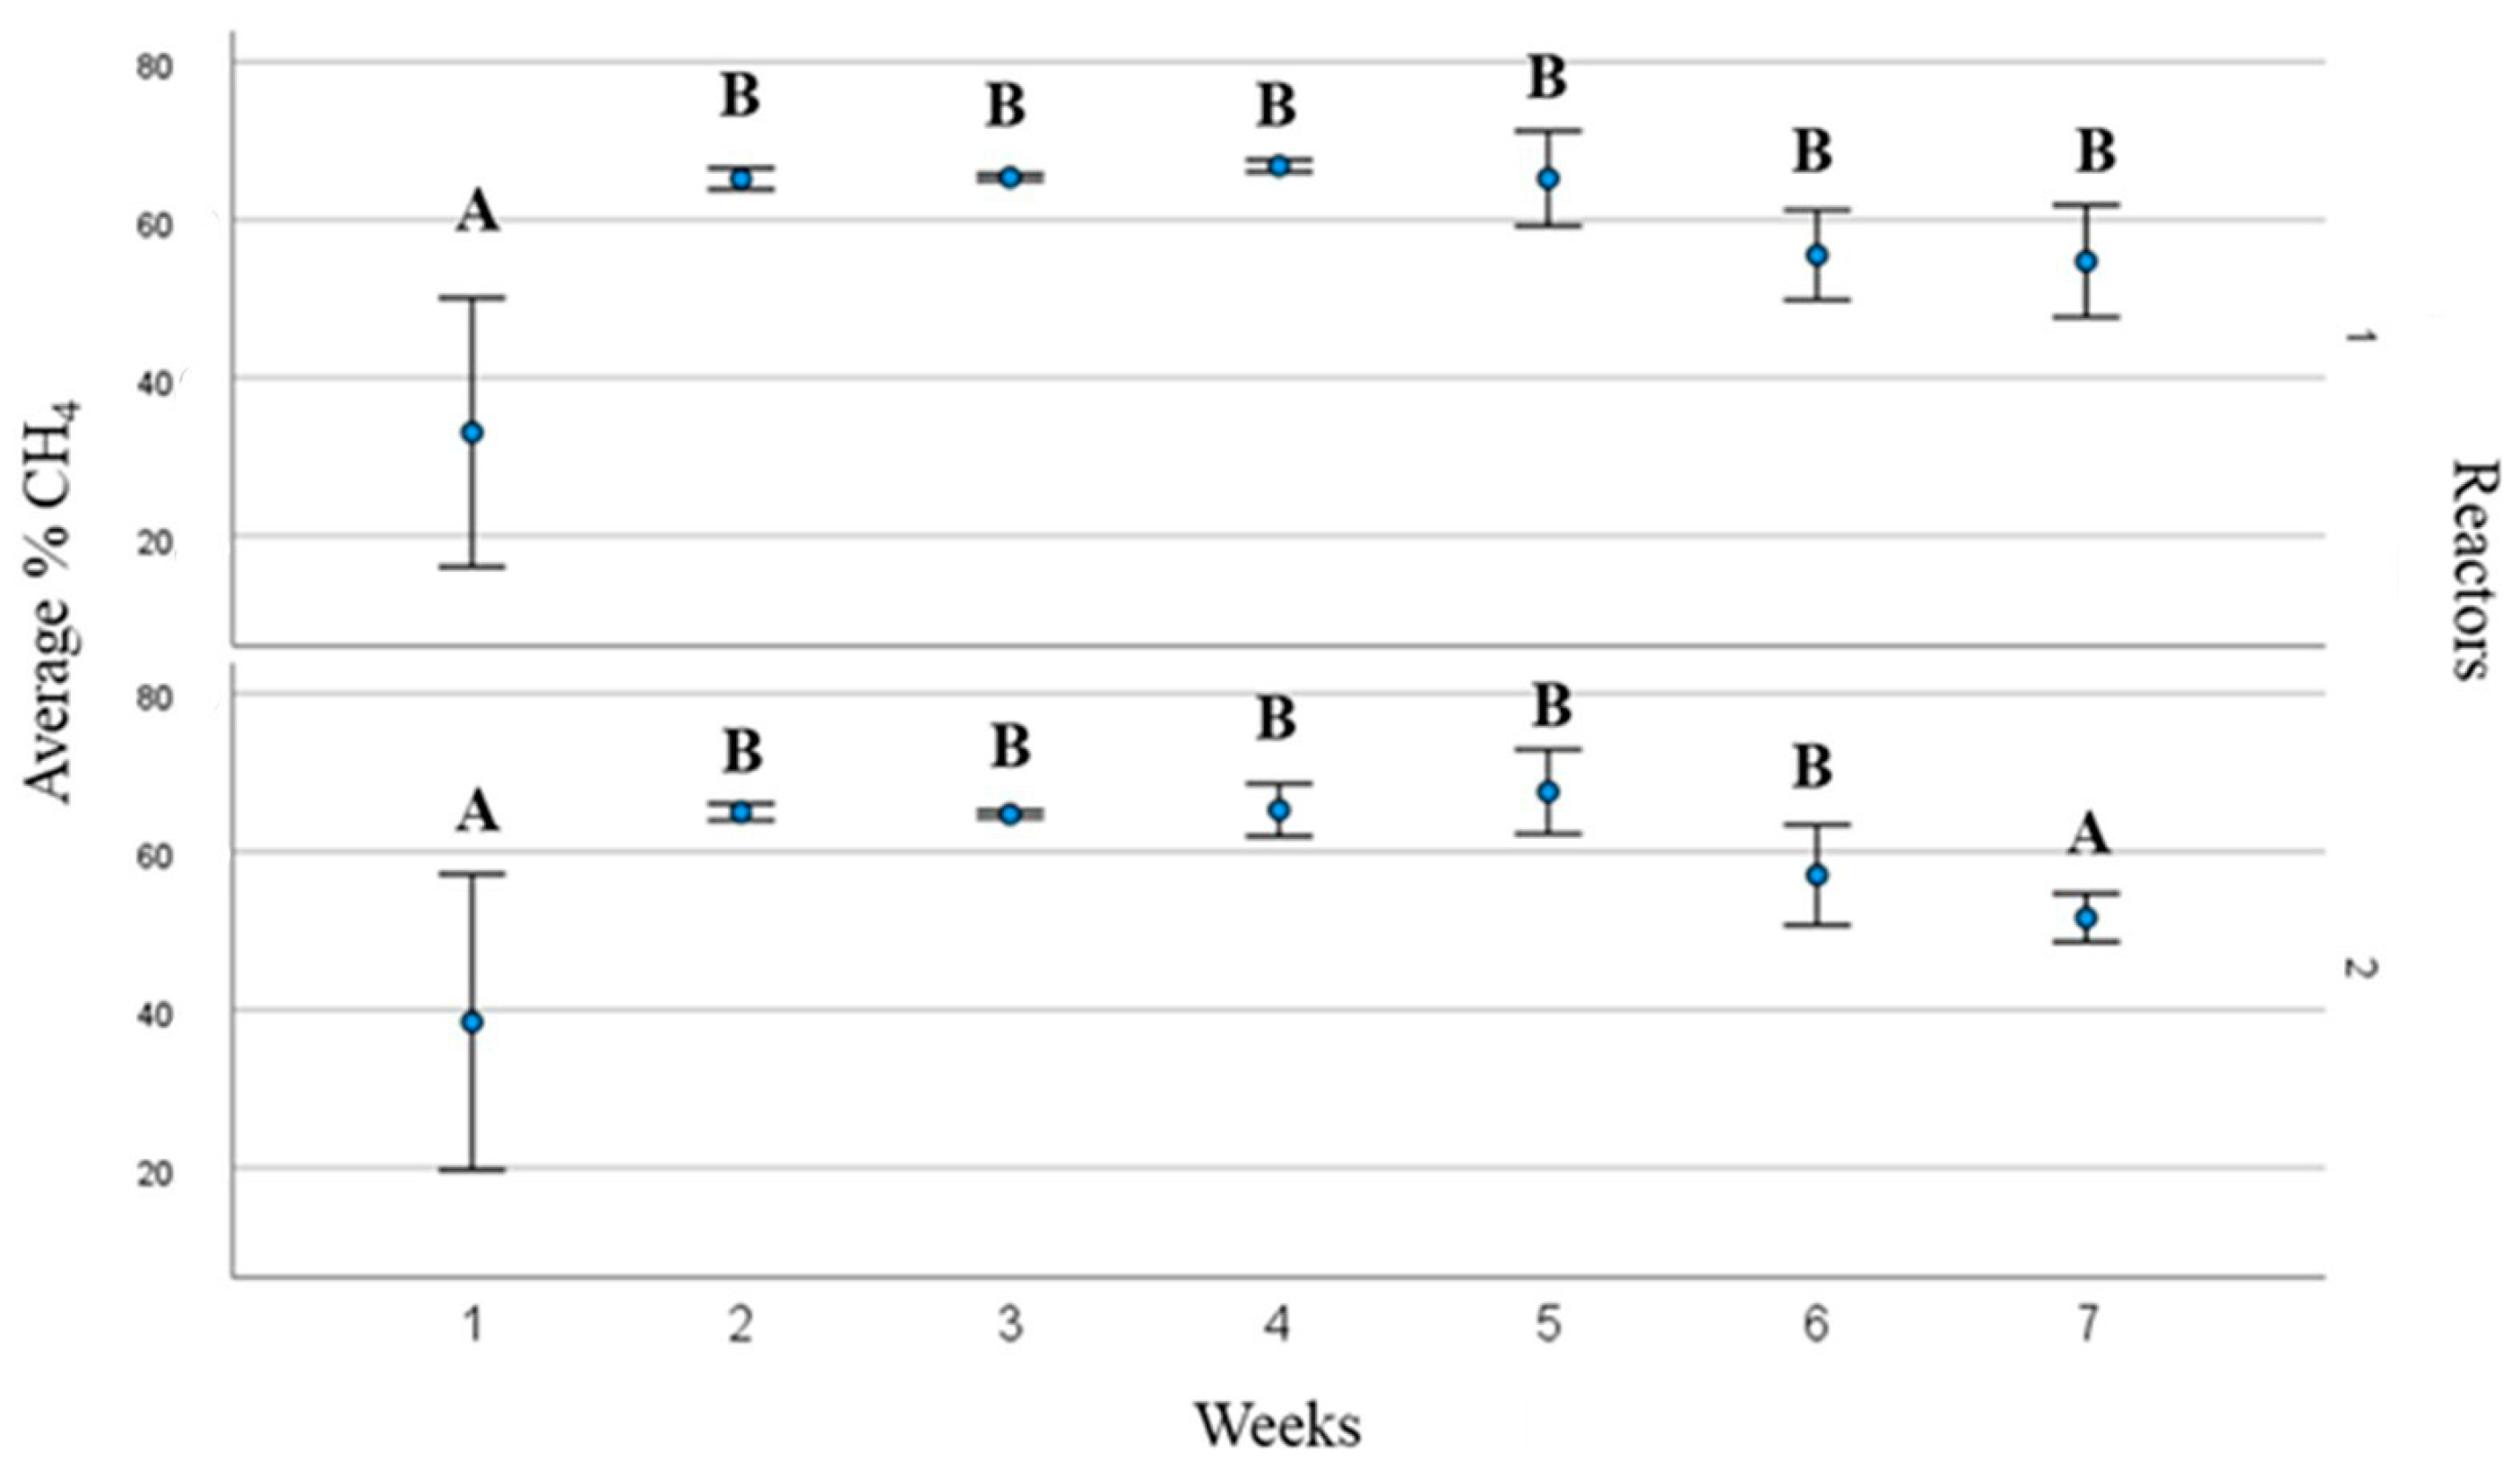
3.1. Biogas and Biomethane Production

Figure 2 shows the cumulative normalised methane produced in each reactor. Statistical analysis did not highlight any significant difference F(1,71) = 0.0000, p = 0.990, even if the second reactor registered a production slightly higher (410.86 NLmethane∙gTVS-1 against 394.57 NLmethane∙gTVS-1 in reactor 1).
The daily and weekly CH4 production are shown in Figure 3 and Figure 4. In both reactors, there are significant differences in CH4 production considering the production over the duration of the process. Both reactors produced low quantities of biogas (±10 NLmethane) in the first weeks. An increase in biogas production was recorded between the third and the fourth week, reaching a maximum during the fifth week, followed by a gradual decrease in weeks 6 and 7, particularly in reactor 2.
The percentages of methane and other gases were evaluated (the results are shown in Figure 5, Figure 6, Figure 7, Figure 8 and Figure 9). The methane amount remained stable during the first five weeks. From the fifth week on, a decrease in the methane amount in favour of CO2 could be observed. Furthermore, it could be observed that there was an increase in the concentration of H2S in the gas phase, which is one of the other warning signs indicating that the process may have been compromised.
According to the literature, to consider the process chemically stable, reference must be made to the pH value. Although we did not witness a drastic drop, however, pH decreasing at the end of the process (from 8.18 in both reactors to a pH of 7.16 in reactor 1 and a pH of 7.32 in reactor 2) indicates the occurrence of inhibitory phenomena against the methanogenic bacterial consortium, probably caused by a concatenation of events including an increase in the concentration of total VFA in the medium. This leads to a decrease in the concentration of methane in favor of CO2 and finally an increase in the concentration of H2S. Methionine and cysteine are sulphur-containing compounds that are always present in organic substrates or raw materials used in anaerobic digestion. They are commonly found in proteins [27]. As the substrate used (80% curd + 20% expired sausages) is very rich in protein and thus also in amino acids, it caused a significant production of H2S. As mentioned above, the increased concentration of H2S (hydrogen sulphide) in the gas phase is also a sign of possible ‘‘intoxication’’ of the methanogenic bacteria. In the range of 50 to 220 mg S/L at pH 7–8, H2S is toxic to methanogens [28]. Depending on the sulphur content of the feedstock (e.g., 115 mg S/kg sewage sludge and 600 mg S/kg cattle manure), the concentration of H2S in biogas varies between 100 and 10,000 ppm [29,30]. In this case, the concentration was quantified as 3520 ppm in reactor 1 at T49 and 1969 ppm in reactor 2 (T49). These results are also in line with the chemical analyses that were conducted on the samples taken from the reactors.

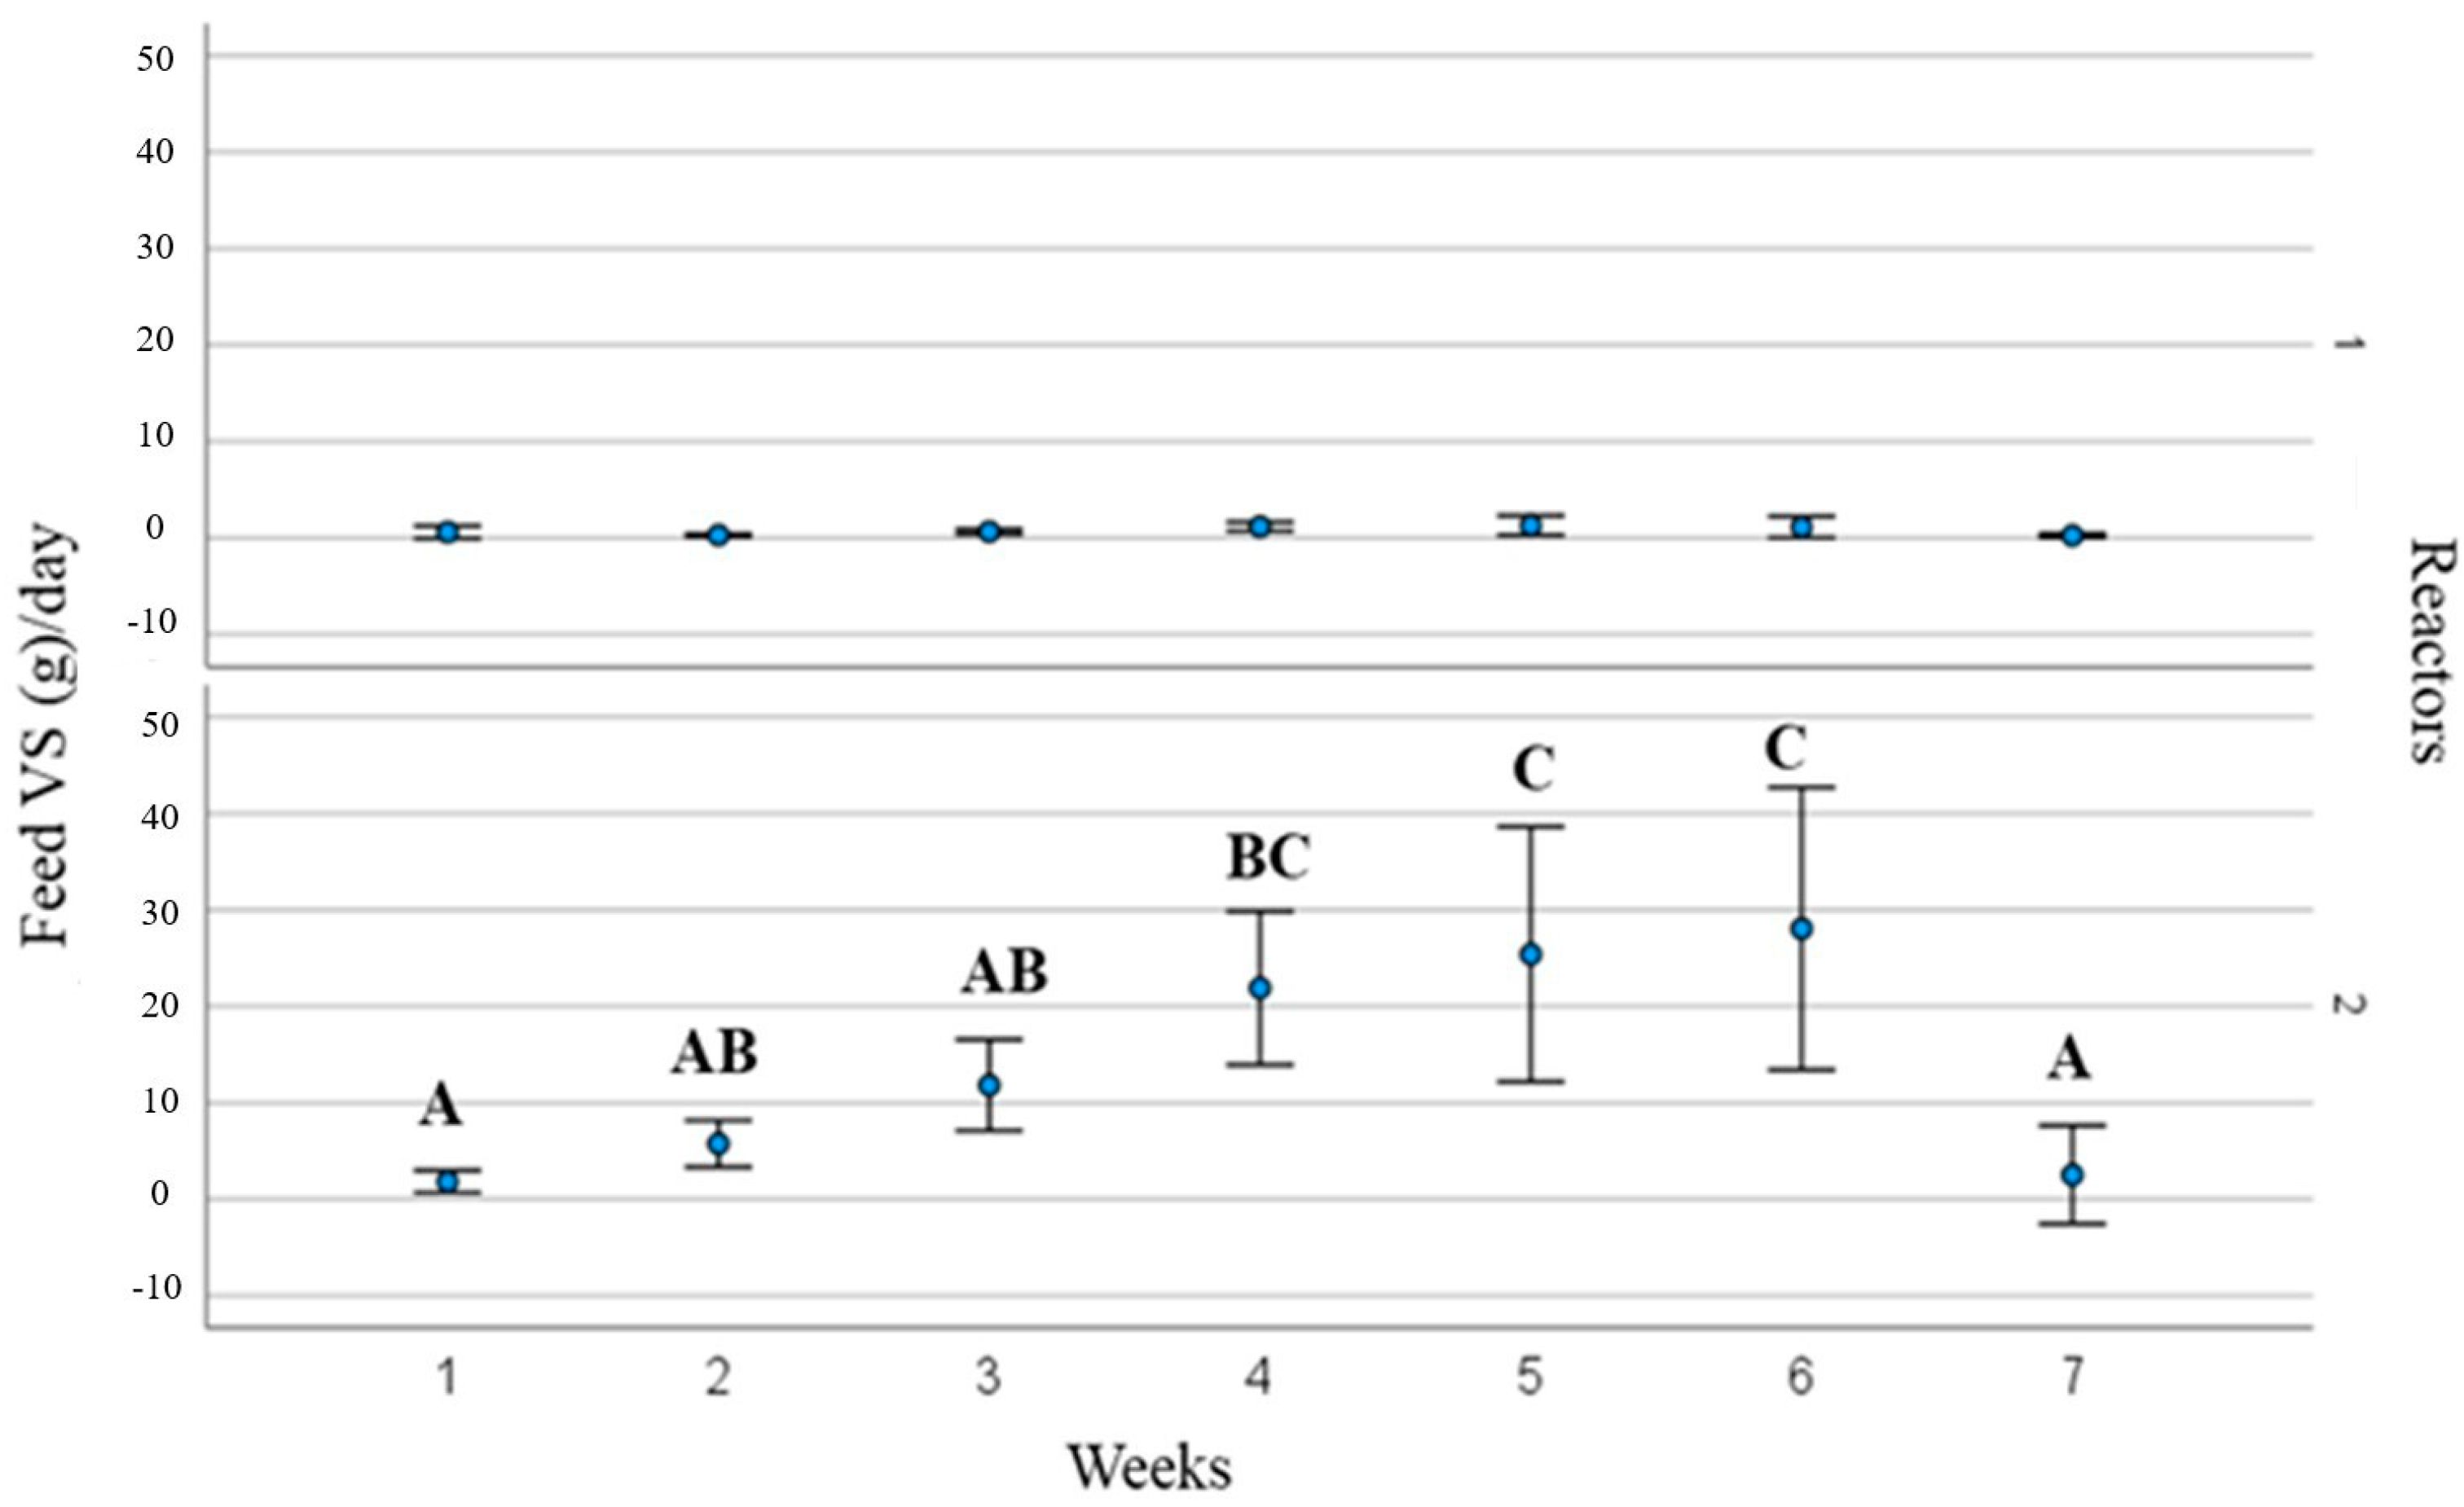
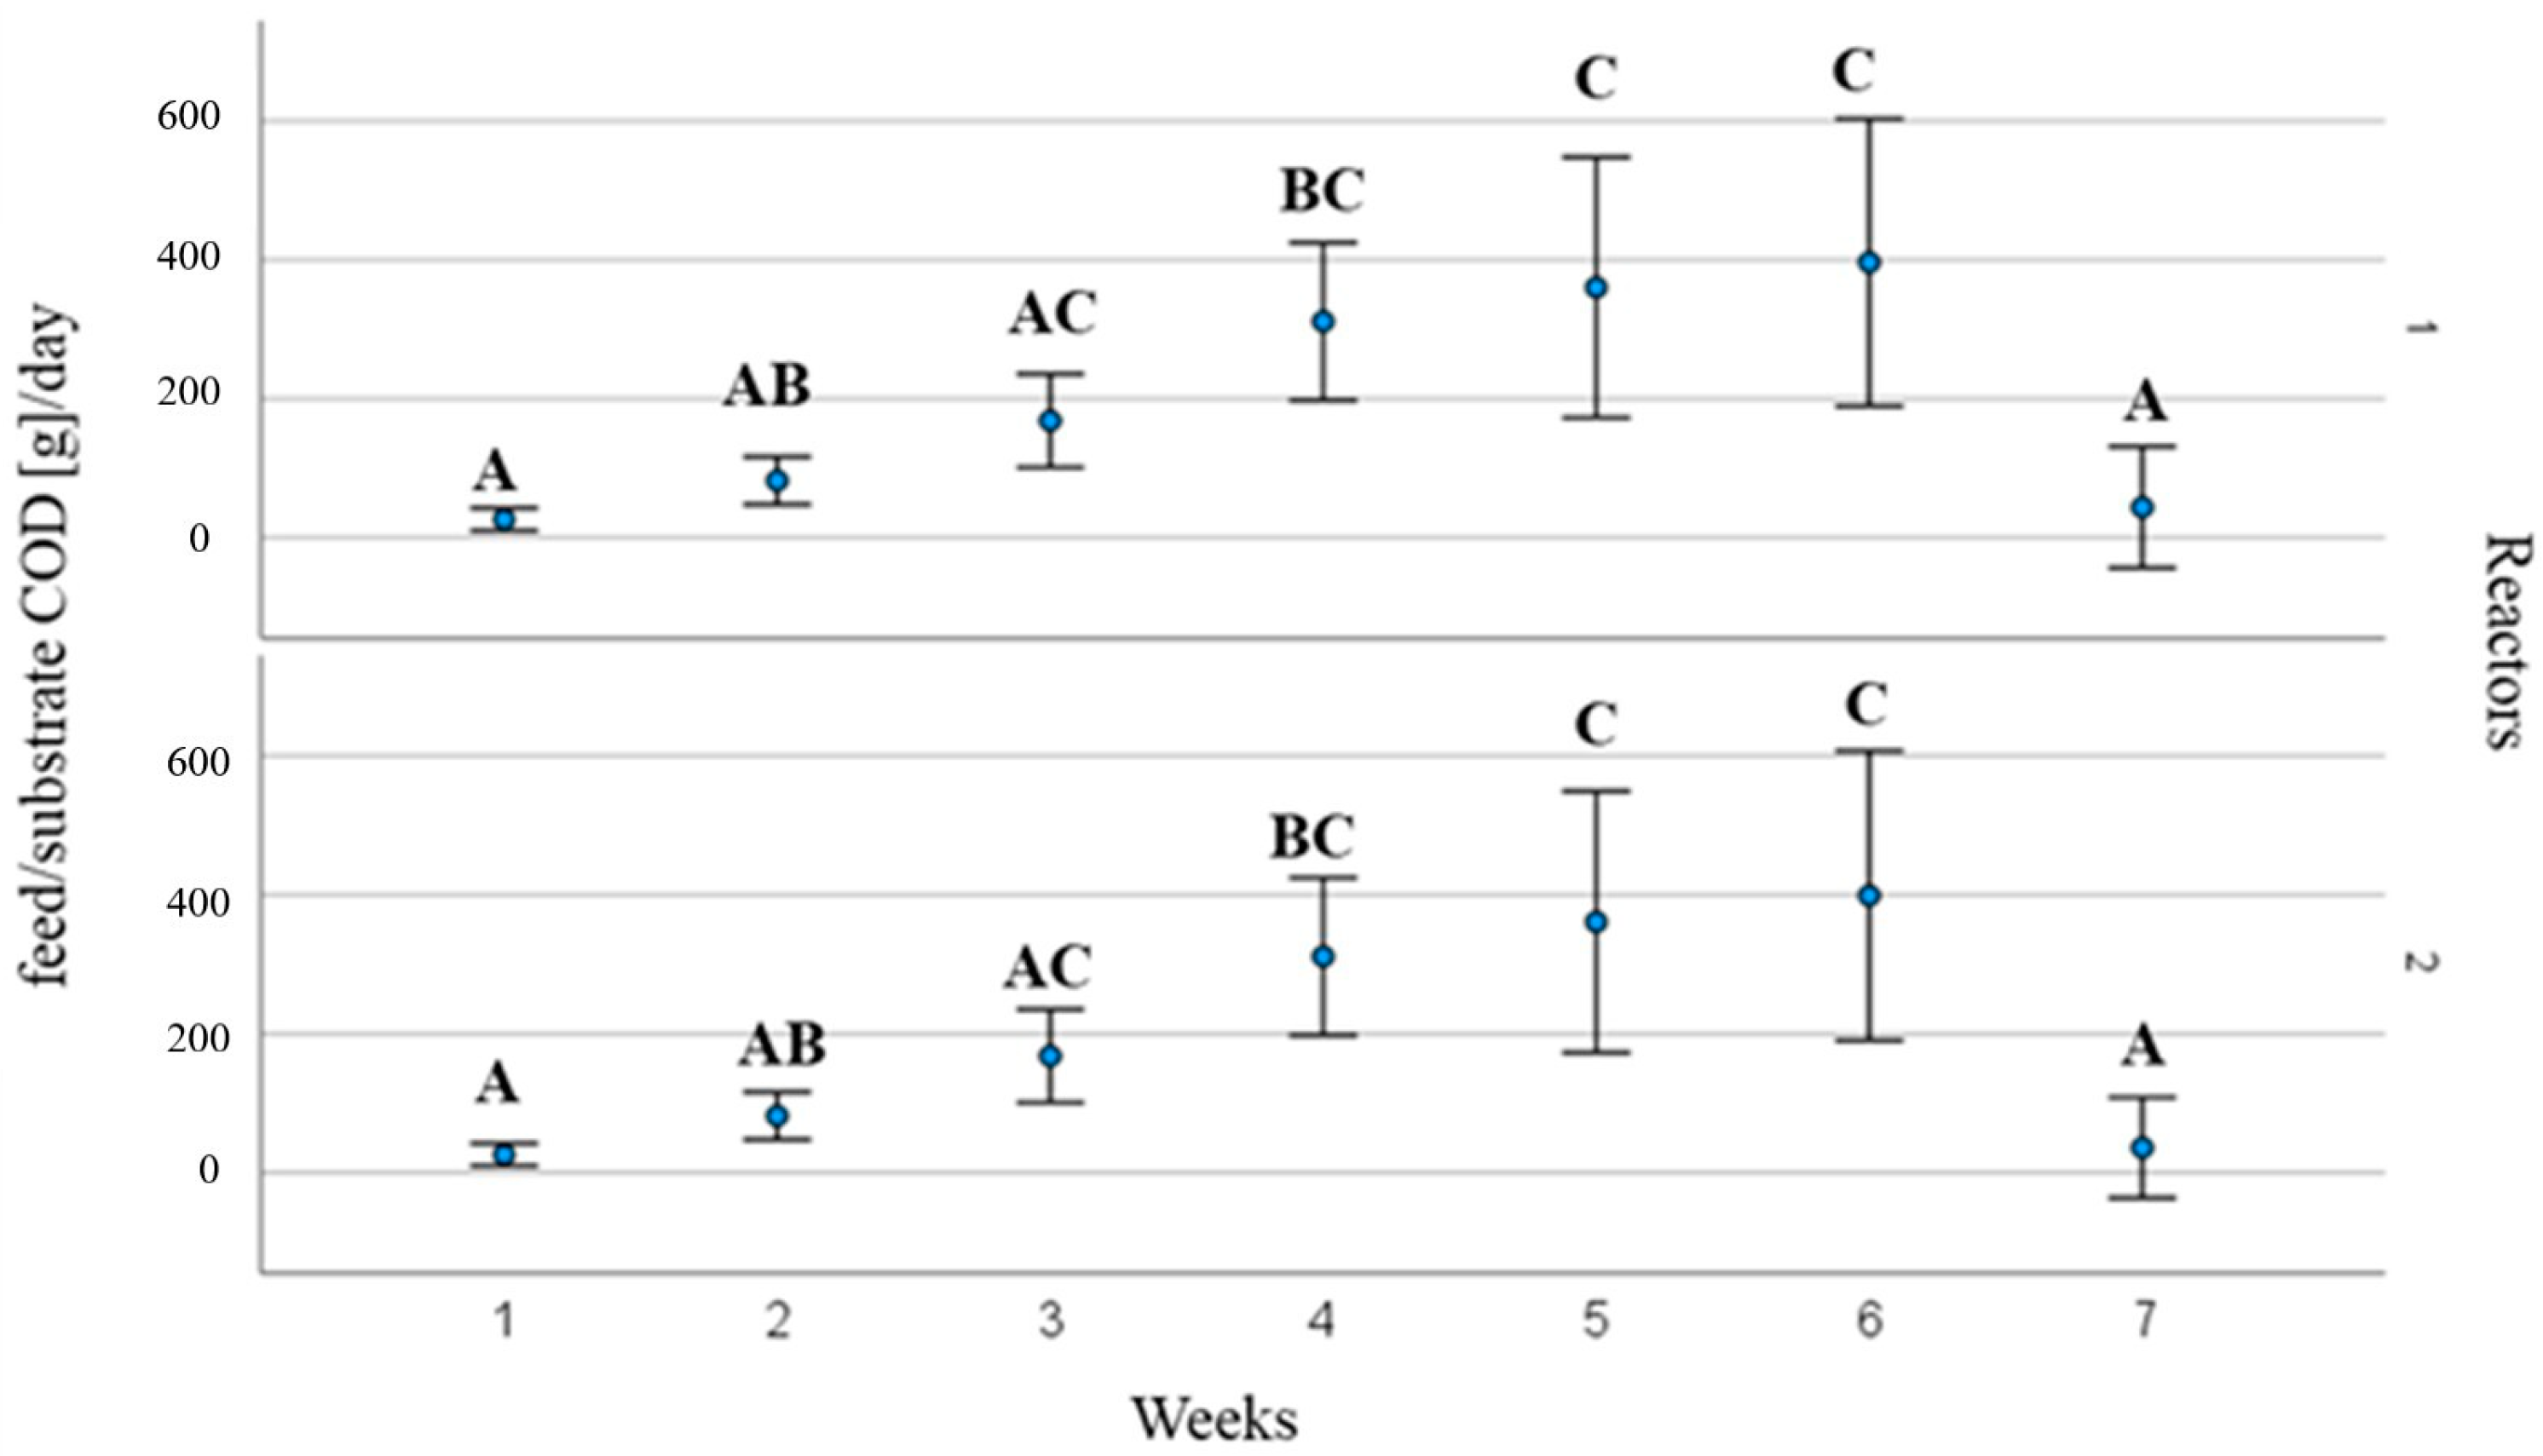
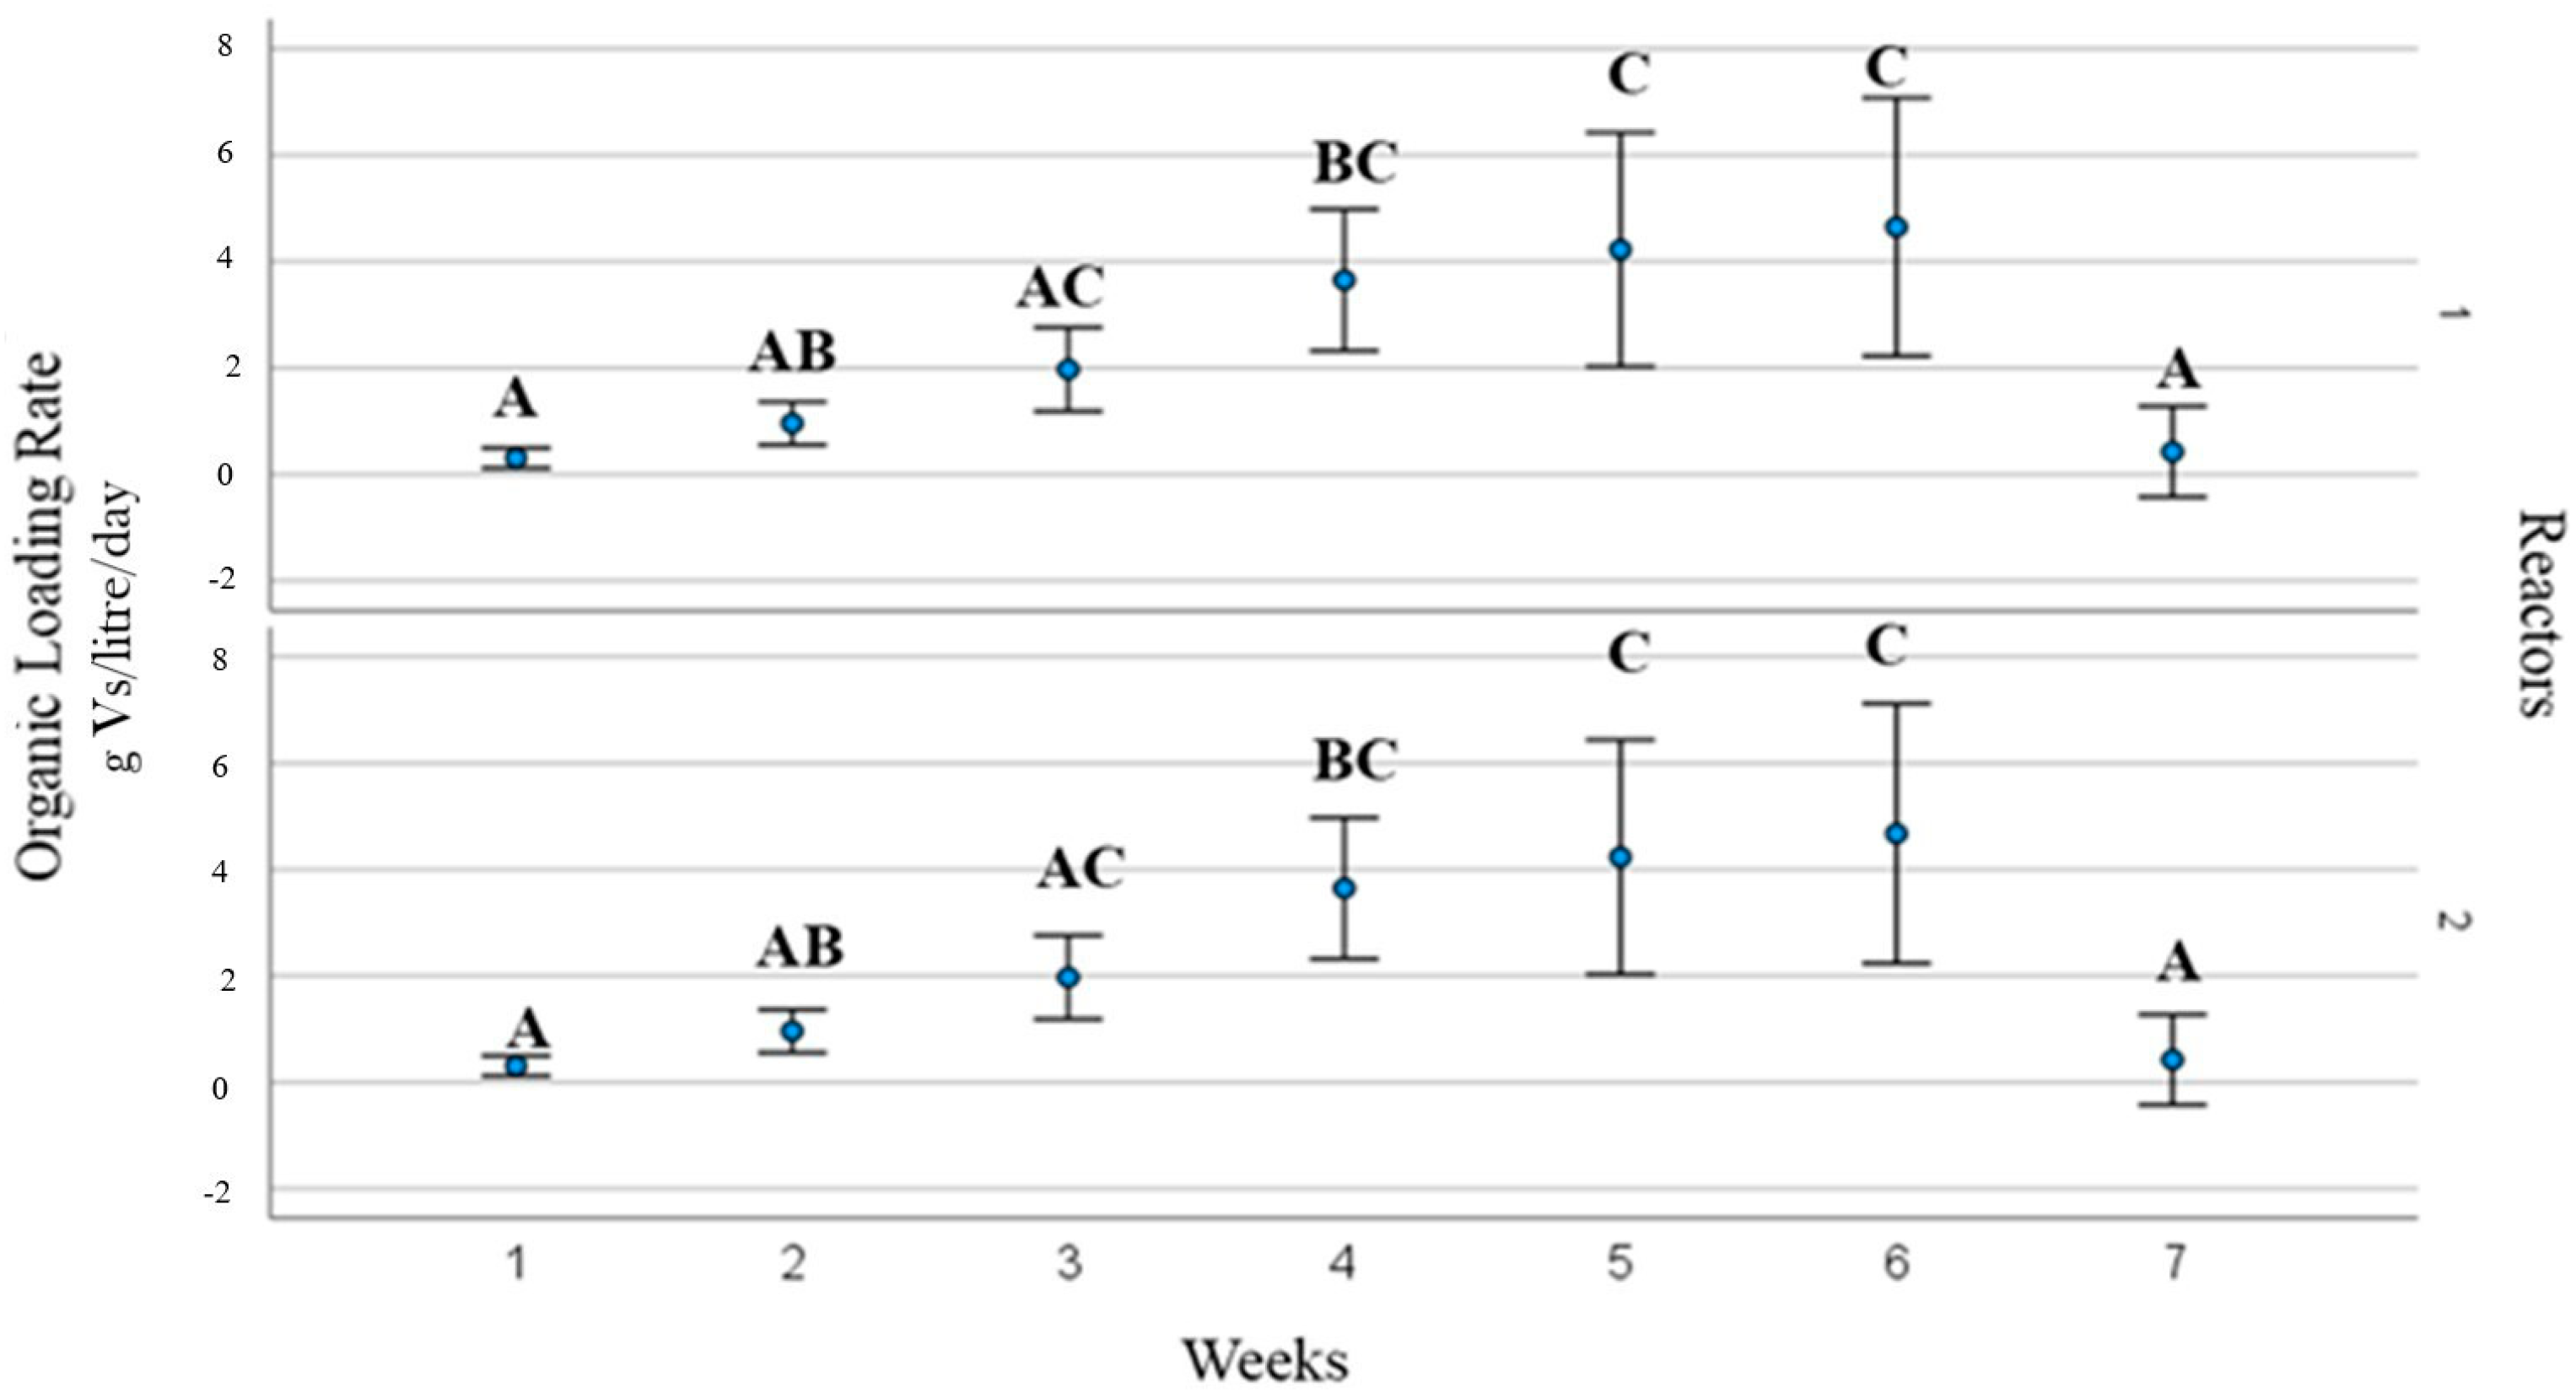
3.2. Process Operating Parameters and Substrate Behaviour

The feed was increased throughout the experiment and consequently also the amount of TVS and COD increased (Figure 10, Figure 11 and Figure 12). No significant difference was obtained only for feed in terms of TVS content by day in reactor 1 [F(1,6) = 37.864, p > 0.05]. The OLR ranged from 0.31 gTVS/litre/day (T0) to 7.11 gTVS/litre/day (T46), and its highest values were recorded in weeks 5 and 6 in both reactors (Figure 13). The hydraulic retention time (HRT) trend shown in Table S2 is inversely proportional to reactor feeding.
Tables S3 and S4 (Supplementary Material) present the results of biomass characterisation performed during the whole digestion process to observe the evolution of all management parameters. It can be seen that as feeding increases, there is an increase in all parameters. The pH in both reactors remained stable throughout the experiment, with a slight decrease observed in both tests, passing from 8.18 in both reactors at T0 to 7.16 in reactor 1 and 7.32 in reactor 2, at T48. The total solids (TS) content always remained below 10% in both reactors, indicating that the process took place under wet conditions even at the end of the test. TVS content approximates the organic fraction of the substrate that is susceptible to conversion, allowing for a preliminary estimate of the biogas that may be produced [31,32]. In reactor 1, the percentage of TVS at the start of the experiment (T0) was 2.47 ± 0.29% of TS. By day 39 (T39), it had increased to 4.02 ± 0.35%. While in reactor 2, TVS was equal to 2.47 ± 0.29% of TS at T0 and 3.65 ± 1.55% at day 39 (T39). The measurement of chemical oxygen demand (COD) is an indicator of biomethane production. It is worth noting that each gram of COD in the sample produces approximately 350 mL of CH4 [17]. In both reactors, COD values increased during the process passing from 4.88 ± 3.77 g/kg at T0 to respectively 51.83 ± 0.14 g/kg by day 39 in reactor 1 and 51.27 ± 0.14 in reactor 2. The fermentation of VFA produces acetic acid, hydrogen, and carbon dioxide. The concentration level of volatile acids, typically expressed in terms of acetic acid or COD, depends on the type of substrate treated and varies from around 200 to 2000 mgAcL−1. In reactor 1, VFA levels were absent at the start of the experiment. They reached 91,251 mg/L in reactor 1 and 75,265 mg/L in reactor 2 at the end of the process. Sudden increases in VFA concentration indicate a shift towards acidogenic processes rather than methanogenic processes. The increase in volatile acids is generally a consequence of the increased substrate load being treated, which accelerates hydrolytic and acidogenic phenomena. The trophic chain becomes imbalanced due to the shift towards low pH conditions caused by the depletion of buffering capacity [18]. High VFA concentrations were recorded at time T27 in conjunction with the increase in feed. The increase in the concentration of total VFA was able to considerably lower the buffering capacity of the system, leading to toxic conditions in the reactors [33]. VFAs present in AD have different effects on bacteria. However, Wu et al. [34] considered total VFA concentration as a warning parameter in their model instead of individual fatty acid concentrations for the easiness of determining total VFA in biogas plants. From Tables S3 and S4, it can be seen that the ammonium and TKN values increase as the amount of feed increases. Anaerobic digestion produces NH4+-N as one of its by-products. The ammonium level in reactor 1 was 1.26 ± 0.56 g/kg at the beginning and increased up to 8.07 ± 1.05 g/kg at T39. Even in reactor 2, similar values were obtained. Monitoring the concentrations of NH4+-N in the digester can help estimate the decline in methane production when nitrogen-rich raw materials are used [35]. In summary, many contributing factors led to a reduction in bio-methane production, and this caused the premature abortion of the experiment. The data suggests that a slower increase in feed would have led to a better adaptation of the microbial consortia and therefore a stable operation, also at higher loading rates.

4. Conclusions

While it is not common for anaerobic digestion plants to use only dairy and meat by-products, they contain significant amounts of energy and have the potential to become excellent substrates for bio-methane production in the future, particularly for those small and medium enterprises or family businesses, which may experience difficulties in disposing their residues and by-products from management and economic points of views. The outcomes obtained in this study are promising but need further investigations to confirm findings and enhance methane production while optimising management parameters, particularly regarding organic loading rate and hydraulic retention time which must be longer than that implemented in this study. Considering the high content of protein fraction in cheese industry by-products, and to avoid an unstable process or even the inhibition of the methanogenesis the feed must be increased at a much slower pace, compared to anaerobic digestion processes using substrates with a low protein fraction, like common agri-biogas plants. The slow increase in feed allows the adaptation of the microbial community without steering into inhibition. Moreover, the elevated hydrogen sulfide and ammonium levels, originating from the high protein fraction, must be considered. This study confirms the applicability of anaerobic digestion for the treatment of protein-rich waste streams from the food industry and especially from the dairy and meat-producing sectors. It could be of interest to replicate the experiment with a high degree of automation of the whole process. Current policies and subsidies encourage the use of co-products rather than energy crops for renewable energy production, which could provide a further stimulus for the uptake of small-scale plants along the agri-food supply chain [17,18,19,20,21,22,23,24,25,26,27,28,29,30,31,32,33,34,35,36].

Supplementary Materials

The following supporting information can be downloaded at: https://www.mdpi.com/article/10.3390/su16114346/s1. Table S1. Physical-chemical characterisation of inoculum and mixture; Table S2. Reactor feed scheme g(feed)/day and its OLR (gVS/litre/day) and feed scheme gVS/day and gCOD/day; Table S3. Reactor 1: Physical-chemical characterisation of samples taken from the reactors during the digestion phase. Values expressed as mean ± st. dev; Table S4. Reactor 2: Physical-chemical characterisation of samples taken from the reactors during the digestion phase. Values expressed as mean ± st. dev.

Author Contributions

Conceptualisation, A.N., S.B. and B.B.; methodology, A.N., S.B., W.G. and B.B.; validation, F.H., W.G., S.B., G.Z. and B.B.; investigation, A.N., F.H. and I.M.; writing—original draft preparation, A.N., F.H. and B.B.; writing—review and editing, A.N., S.B., B.B. and F.H.; visualisation, A.N., S.B., W.G. and B.B.; supervision, W.G., B.B. and G.Z.; project administration, G.Z. and B.B.; funding acquisition, G.Z. and B.B. All authors have read and agreed to the published version of the manuscript.

Funding

This research was funded by the Ministry of University and Research (MUR) within the framework of the PhD programme in Agricultural, Food and Forestry Sciences (XXXVI cycle) activated at the Università Mediterranea di Reggio Calabria and by “MEC—Marketplace Ecosostenibile Calabria” (CUP B31B20000520005), funded under the “Intelligent Factory, Agrifood and Life Sciences” call of the Ministry of Economic Development (MISE).

Institutional Review Board Statement

Not applicable.

Informed Consent Statement

Not applicable.

Data Availability Statement

Not acceptable.

Conflicts of Interest

The authors declare no conflicts of interest.

References

  1. Obaideen, K.; Abdelkareem, M.A.; Wilberforce, T.; Elsaid, K.; Sayed, E.T.; Maghrabie, H.M.; Olabi, A.G. Biogas role in achievement of the sustainable development goals: Evaluation, Challenges, and Guidelines. J. Taiwan Inst. Chem. Eng. 2022, 131, 104207. [Google Scholar] [CrossRef]
  2. IPCC. Summary for Policymakers In: Global Warming of 1.5 °C. In An IPCC Special Report on the Impacts of Global Warming of 1.5 °C above Pre-Industrial Levels and Related Global Greenhouse Gas Emission Pathways, in the Context of Strengthening the Global Response to the Threat of Climate Change, Sustainable Development, and Efforts to Eradicate Poverty; Masson-Delmotte, V., Zhai, P., Pörtner, H.-O., Roberts, D., Skea, J., Shukla, P.R., Pirani, A., Moufouma-Okia, W., Péan, C., Pidcock, R., et al., Eds.; Cambridge University Press: Cambridge, UK; New York, NY, USA, 2018; pp. 3–24. [Google Scholar] [CrossRef]
  3. van Lier, J.B.; Mahmoud, N.; Zeeman, G. Anaerobic wastewater treatment. In Biological Wastewater Treatment: Principles, Modeling and Design; IWA Publishing: London, UK, 2020; Volume 151, pp. 701–756. [Google Scholar] [CrossRef]
  4. Chiu, S.L.H.; Lo, I.M.C. Reviewing the anaerobic digestion and co-digestion process of food waste from the perspectives on biogas production performance and environmental impacts. Environ. Sci. Pollut. Res 2016, 23, 24435–24450. [Google Scholar] [CrossRef]
  5. Castellani, B.; Rinaldi, S.; Bonamente, E.; Nicolini, A.; Rossi, F.; Cotana, F. Carbon and energy footprint of the hydrate-based biogas upgrading process integrated with CO2 valorization. Stoten 2018, 615, 404–411. [Google Scholar] [CrossRef]
  6. European Union. Available online: https://energy.ec.europa.eu/system/files/2022-05/COM_2022_230_1_EN_ACT_part1_v5.pdf (accessed on 10 February 2024).
  7. Ware, A.; Power, N. Biogas from cattle slaughterhouse waste: Energy recovery towards an energy self-sufficient industry in Ireland. Renew. Energy 2016, 97, 541–549. [Google Scholar] [CrossRef]
  8. Barłóg, P.; Hlisnikovský, L.; Kunzová, E. Effect of Digestate on Soil Organic Carbon and Plant-Available Nutrient Content Compared to Cattle Slurry and Mineral Fertilization. Agronomy 2020, 10, 379. [Google Scholar] [CrossRef]
  9. Lovato, G.; Albanez, R.; Triveloni, M.; Ratusznei, S.M.; Rodrigues, J.A.D. Methane production by co-digesting vinasse and whey in an AnSBBR: Effect of mixture ratio and feed strategy. Appl. Biochem. Biotechnol. 2019, 187, 28–46. [Google Scholar] [CrossRef]
  10. Szaja, A.; Montusiewicz, A. Enhancing the co-digestion efficiency of sewage sludge and cheese whey using brewery spent grain as an additional substrate. Bioresour. Technol. 2019, 291, 121863. [Google Scholar] [CrossRef]
  11. Fernández-Rodríguez, M.J.; Puntano, N.F.; Mancilla-Leytón, J.M.; Borja, R. Batch mesophilic anaerobic co-digestion of spent goat batch mesophilic anaerobic co-digestion of spent goat straw bedding and goat cheese whey: Comparison with the mono-digestion of the two sole substrates. J. Environ. Manag. 2021, 280, 111733. [Google Scholar] [CrossRef]
  12. Sar, T.; Harirchi, S.; Ramezani, M.; Bulkan, G.; Akbas, M.Y.; Pandey, A.; Taherzadeh, M.J. Potential utilization of dairy industries by-products and wastes through microbial processes: A critical review. Sci. Total Environ. 2022, 810, 152253. [Google Scholar] [CrossRef]
  13. Escalante, H.; Castro, L.; Amaya, M.P.; Jaimes, L. Anaerobic digestion of cheese whey: Energetic and nutritional potential for the dairy sector in developing countries. Waste Manag. 2018, 71, 711–718. [Google Scholar] [CrossRef]
  14. Rincón-Catalán, N.I.; Pérez-Fabiel, S.; Mejía-González, G.; Herrera-López, D.; Castro-Chan, R.; Cruz-Salomón, A.; Sebastian, P.J. Power Generation from Cheese Whey Treatment by Anaerobic Digestion and Microbial Fuel Cell. Waste Biomass Valori. 2019, 13, 3221–3231. [Google Scholar] [CrossRef]
  15. Bella, P.; Rao, P.V. Anaerobic co-digestion of cheese whey and septage: Effect of substrate and inoculum on biogas production. J. Environ. Manag. 2022, 308, 114581. [Google Scholar] [CrossRef]
  16. Matjuda, D.S.; Tekere, M.; Thaela-Chimuka, M.J. Impact of Thermal Pretreatment on the Physicochemical Characteristics and Biomethane Yield Potential of Solid Slaughter Waste from High-Throughput Red Meat Abattoirs Valorized as a Potential Feedstock for Biogas Production. Sustainability 2024, 16, 2150. [Google Scholar] [CrossRef]
  17. Benalia, S.; Falcone, G.; Stillitano, T.; De Luca, A.I.; Strano, A.; Gulisano, G.; Zimbalatti, G.; Bernardi, B. Increasing the Content of Olive Mill Wastewater in Biogas Reactors for a Sustainable Recovery: Methane Productivity and Life Cycle Analyses of the Process. Foods 2021, 10, 1029. [Google Scholar] [CrossRef]
  18. Neri, A.; Bernardi, B.; Zimbalatti, G.; Benalia, S. An Overview of Anaerobic Digestion of Agricultural By-Products and Food Waste for Biomethane Production. Energies 2023, 16, 6851. [Google Scholar] [CrossRef]
  19. U.S. Environmental Protection Agency—Office of Water. METHOD 1684 Total, Fixed, and Volatile Solids in Water, Solids, and Biosolids; Draft January 2001 US Environmental Protection Agency Office of Water Office of Science and Technology Engineering and Analysis Division (4303) (January). Ertr, Maximale. n.d. “Bioextrusion®.”; U.S. Environmental Protection Agency: Washington, DC, USA, 2001; pp. 1–38.
  20. Jiang, Y.; McAdam, E.; Zhang, Y.; Heaven, S.; Banks, C.; Longhurst, P. Ammonia Inhibition and Toxicity in Anaerobic Digestion: A Critical Review. J. Water Process Eng. 2019, 32, 100899. [Google Scholar] [CrossRef]
  21. Morozova, I.; Nikulina, N.; Oechsner, H.; Krümpel, J.; Lemmer, A. Effects of Increasing Nitrogen Content on Process Stability and Reactor Performance in Anaerobic Digestion. Energies 2020, 13, 1139. [Google Scholar] [CrossRef]
  22. APHA. Standard Methods for the Examination of Water and Wastewater; American Public Health Association: Washington, DC, USA, 1998. [Google Scholar]
  23. De Zorzi, P.; Balzamo, S.; Barbizzi, S.; Calabretta, E.; Potalivo, M.; Rosamilia, S. Misurazione per La Determinazione Della Richiesta Chimica Di Ossigeno (COD) Mediante Test in Cuvetta: Metodo 5135; ISPRA: Clive, IA, USA, 2014. Available online: https://www.isprambiente.gov.it/files/pubblicazioni/manuali-lineeguida/MLG_117_14.pdf (accessed on 10 February 2024).
  24. Li, H.; Tian, Y.; Wang, H.; Simeonov, I.; Christov, N. A volatile fatty acids adaptive observer-based hierarchical optimal controller design to maximum gas production of two-stage anaerobic digestion process. Comp. Chem. Eng. 2024, 181, 108524. [Google Scholar] [CrossRef]
  25. Lukitawesa; Patinvoh, R.J.; Millati, R.; Sárvári-Horváth, I.; Taherzadeh, M.J. Factors influencing volatile fatty acids production from food wastes via anaerobic digestion. Bioengineered 2020, 11, 39–52. [Google Scholar] [CrossRef]
  26. Sun, H.; Ni, P.; Angelidaki, I.; Dong, R.; Wu, S. Exploring stability indicators for efficient monitoring of anaerobic digestion of pig manure under perturbations. Waste Manag. 2019, 91, 139–146. [Google Scholar] [CrossRef]
  27. Vu, H.P.; Nguyen, L.N.; Wang, Q.; Ngo, H.H.; Liu, Q.; Zhang, X.; Nghiem, L.D. Hydrogen sulphide management in anaerobic digestion: A critical review on input control, process regulation, and post-treatment. Bioresour. Technol. 2022, 346, 126634. [Google Scholar] [CrossRef] [PubMed]
  28. Dykstra, C.M.; Pavlostathis, S.G. Hydrogen sulfide affects the performance of a methanogenic bioelectrochemical system used for biogas upgrading. Water Res. 2021, 200, 117268. [Google Scholar] [CrossRef] [PubMed]
  29. Chen, H.; Chang, S. Dissecting methanogenesis for temperature-phased anaerobic digestion: Impact of temperature on community structure, correlation, and fate of methanogens. Bioresour. Technol. 2020, 306, 123104. [Google Scholar] [CrossRef] [PubMed]
  30. Choudhury, A.; Shelford, T.; Felton, G.; Gooch, C.; Lansing, S. Evaluation of Hydrogen Sulfide Scrubbing Systems for Anaerobic Digesters on Two U.S. Dairy Farms. Energies 2019, 12, 4605. [Google Scholar] [CrossRef]
  31. IEA Bioenergy. Available online: www.ieabioenergy.com/blog/publications/process-monitoring-in-biogas-plants/ (accessed on 20 January 2024).
  32. Hülsemann, B.; Zhou, L.; Merkle, W.; Hassa, J.; Müller, J.; Oechsner, H. Biomethane Potential Test: Influence of Inoculum and the Digestion System. Appl. Sci. 2020, 10, 2589. [Google Scholar] [CrossRef]
  33. Franke-Whittle, I.H.; Walter, A.; Ebner, C.; Insam, H. Investigation into the effect of high concentrations of volatile fatty acids in anaerobic digestion on methanogenic communities. Waste Manag. 2014, 34, 2080–2089. [Google Scholar] [CrossRef] [PubMed]
  34. Wu, Y.; Kovalovszki, A.; Pan, J.; Lin, C.; Liu, H.; Duan, N.; Angelidaki, I. Early warning indicators for mesophilic anaerobic digestion of corn stalk: A combined experimental and simulation approach. Biotechnol. Biofuels 2019, 12, 106. [Google Scholar] [CrossRef]
  35. Kalamaras, S.D.; Vitoulis, G.; Christou, M.L.; Sfetsas, T.; Tziakas, S.; Fragos, V.; Samaras, P.; Kotsopoulos, T.A. The Effect of Ammonia Toxicity on Methane Production of a Full-Scale Biogas Plant—An Estimation Method. Energies 2021, 14, 5031. [Google Scholar] [CrossRef]
  36. Zema, D.A.; Zappia, G.; Benalia, S.; Zimbalatti, G.; Perri, E.; Urso, E.; Tamburino, V.; Bernardi, B. Limiting factors for anaerobic digestion of olive mill wastewater blends under mesophilic and thermophilic conditions. J. Agric. Eng. 2018, 49, 130–137. [Google Scholar] [CrossRef]
Figure 1. (a) Reactors. (b) Reactors Components. (c) Drum-type Gas Meter.
Sustainability 16 04346 g001
Figure 2. Methane cumulative production. Circles and asterisks indicate weak and extreme outliers, respectively.
Sustainability 16 04346 g002
Figure 3. Daily production of NLmethane∙gTVS−1.
Sustainability 16 04346 g003
Figure 4. Weekly production of NLmethane∙gVS−1. Data marked with different capital letters are significantly different by Tukey’s test (p < 0.05).
Sustainability 16 04346 g004
Figure 5. Variation in percentage concentration of CH4 during the trial weeks. Data marked with different capital letters are significantly different by Tukey’s test (p < 0.05).
Sustainability 16 04346 g005
Figure 6. Variation in percentage concentration of CO2 during the trial weeks. Data marked with different capital letters are significantly different by Tukey’s test (p < 0.05).
Sustainability 16 04346 g006
Figure 7. Variation in percentage concentration of O2 during the trial weeks. Data marked with different capital letters are significantly different by Tukey’s test (p < 0.05).
Sustainability 16 04346 g007
Figure 8. Variation in percentage concentration of H2S during the trial weeks. Data marked with different capital letters are significantly different by Tukey’s test (p < 0.05).
Sustainability 16 04346 g008
Figure 9. Variation in percentage concentration of H+ during the trial weeks. Data marked with different capital letters are significantly different by Tukey’s test (p < 0.05).
Sustainability 16 04346 g009
Figure 10. Comparison between weekly reactor feeding amounts in terms of substrate/day. Data marked with different capital letters are significantly different by Tukey’s test (p < 0.05).
Sustainability 16 04346 g010
Figure 11. Comparison between weekly reactor feeding amounts in terms of TVS content/day. Data marked with different capital letters are significantly different by Tukey’s test (p < 0.05).
Sustainability 16 04346 g011
Figure 12. Comparison between weekly reactor feeding amounts in terms of COD content/day. Data marked with different capital letters are significantly different by Tukey’s test (p < 0.05).
Sustainability 16 04346 g012
Figure 13. Weekly variation of OLR. Data marked with different capital letters are significantly different by Tukey’s test (p < 0.05).
Sustainability 16 04346 g013
Disclaimer/Publisher’s Note: The statements, opinions and data contained in all publications are solely those of the individual author(s) and contributor(s) and not of MDPI and/or the editor(s). MDPI and/or the editor(s) disclaim responsibility for any injury to people or property resulting from any ideas, methods, instructions or products referred to in the content.

