Abstract
Food security remains a critical global challenge, increasingly threatened by the adverse effects of climate change on agricultural productivity and food supply chains. Ensuring the stability, availability, and accessibility of food resources necessitates innovative strategies to assess and mitigate climate-related risks. This study presents a comprehensive analysis of the impact of climate change on global food systems, focusing on the risk assessment and optimization of food supply chains from the perspective of importers. Deploying the Analytical Hierarchy Process (AHP), this study evaluates climate change risks associated with seven different suppliers for three key crops, considering a range of factors, including surface temperature, arable land, water stress, and adaptation policies. Utilizing these assessments, a multi-objective optimization model is developed and solved using MATLAB (R2018a)’s Genetic Algorithm, aiming to identify optimal suppliers to meet Qatar’s food demand, with consideration of the economic, environmental, and risk factors. The findings underscore the importance of a comprehensive approach in managing food supply chains and offer insights to enhance the resilience and sustainability of global food systems amid climate uncertainties. This study contributes to the literature by applying AHP and multi-objective optimization in climate risk management within food systems, providing valuable perspectives for policymakers and stakeholders in the agricultural sector. Furthermore, the multi-objective optimization model analyzed three crop networks, yielding total costs of USD 16 million, USD 6 million, and USD 10 million for tomatoes, onions, and cucumbers, respectively, with associated CO2eq emissions and risk percentages. The findings reveal concentrated global vegetable markets, with major importers accounting for over 60% of imports, though the leading importers differ across crops, highlighting regional demand and production disparities, potentially impacting food security and supply chain resilience.
1. Introduction
Climate change stands as one of the foremost global challenges, markedly affecting Earth’s ecosystems. While fluctuations in climate have been constant over the past century, the pace of change has accelerated notably in recent decades. Human activities since the 19th century have led to a 0.9 °C increase in the average global temperature, due to the emission of greenhouse gases (GHGs). Projected trends suggest that with ongoing deforestation and pollution of air, soil, and water, this warming could reach 1.5 °C by 2050 [1]. Shifts in temperature and precipitation over time are reshaping the global distribution of food production advantages, potentially hindering agricultural productivity growth in regions already struggling with hunger. These changes threaten to disrupt global agriculture and food systems, leading to yearly fluctuations in food availability. If current climate trends continue, there could be unparalleled increases in crop failures, leading to decreased production, higher food prices, and challenges in meeting the growing demand.
Given that food systems are vulnerable to the impacts of climate change and natural disasters, the consequences of these factors can manifest either abruptly or gradually, leading to either favorable or adverse outcomes [1]. Notably, these impacts primarily affect the production stages, accounting for approximately 20% of the entire value chain [2]. Furthermore, global agricultural markets have become increasingly complex due to a heightened focus on food standards related to safety, quality, and technological advancements. These factors drive changes throughout the industry, affecting the entire value chain. These complexities intensify the challenge of establishing a resilient and robust food supply system. Therefore, it becomes important to adopt a holistic approach, considering the entire value chain rather than solely focusing on the production stage [3]. Therefore, there is a growing need to enhance efforts linked to identifying and classifying risks associated with food systems, exploring data from various segments of the value chain. Consequently, the main objective of this study is to evaluate the climate change risk of seven different suppliers for three different crops from the importer’s viewpoint.
In this study, the risks related to the food system are assessed considering how they may affect Qatar’s ability to meet consumer demand. In this regard, the AHP tool is used to assess the relative importance of various risk factors using both quantitative and qualitative measurements. Since its development, AHP has been utilized in assisting decision making in almost every industry [4]. Instead of relying on complex mathematical techniques, AHP uses pairwise matrices to produce acceptable alternative priority lists [5]. The AHP is utilized to identify and prioritize factors and subfactors critical for assessing the risks posed by climate change to the food system. The evaluation criteria encompass aspects, such as supply chain resilience, vulnerability to extreme weather events, greenhouse gas emissions, and strategies for adaptation.
Sub-criteria are further subdivided into individual risk alternatives [5]. Each factor is estimated by comparing the identified climate change risk indicators with respect to the criteria and sub-criteria and is assigned scores based on professional judgment, climate data, or previous studies. This procedure quantifies risks and their possible effects on the food chain. Then, the range of scores is normalized across criteria and sub-criteria to ensure their consistency. Subsequently, the normalized risk scores are transformed to an overall risk factor used for assessment and policy recommendations. As such, stakeholders can undertake proactive actions to meet the difficulties posed by climate change, assuring food security and sustainability by applying the AHP to climate change risks in the food system [6]. In this study, the AHP is used to evaluate each of the seven suppliers’ and assign risk factors describing their performance in the face of climate change. In addition, a multi-objective optimization model was developed and solved using MATLAB (R2018a)’s Genetic Algorithm tool. This optimization framework is designed to identify the set of optimal suppliers and determine their contribution rates to Qatar’s food basket. It ensures that local demands are met within the suppliers’ capacities, costs are minimized, and associated risks are kept to a minimum. The model offers insights into potential improvements for global food systems, taking into account economic, social, and environmental dimensions.
The novelty of this study lies in its integrated approach, combining the AHP with a multi-objective optimization model to assess and mitigate climate change risks in food supply chains. This unique methodology allows for a comprehensive evaluation of risk factors from the perspective of importers and optimizes supplier selection to enhance food security in the face of climate uncertainties. It bridges the gap between climate risk assessment and practical supply chain management, offering actionable insights for policymakers and stakeholders in the agricultural sector. Six risk factors were chosen for the AHP, and they include: surface temperature, arable land, water stress, rising sea levels, agriculture policies, adaptation, and disaster response risk management. These factors are selected for their significant influence on agricultural productivity and supply chain resilience amidst climate change. They offer a comprehensive view of environmental and operational challenges, informing the development of robust mitigation and adaptation strategies within the food sector. The composite indicators identified through the AHP are subsequently deployed in the optimization process to enhance suppliers selection for these three crops.
This study is structured such that the following section, Section 2, provides the main literature about food supply chain activities. Section 3 focuses on the multi-objective optimization, describing the development of the mathematical model along with its associated constraints. Following this, Section 4 offers a comprehensive analysis of the multiple-objective model’s results, accompanied by a discussion on both input and output aspects. Finally, the last section encompasses the conclusion and recommendations drawn from the study’s findings.
2. Literature Review
In recent years, the food supply chain has increasingly faced emergency situations. These have ranged from incidents involving substandard milk powder and Sudan red chili sauce to more alarming cases, such as soy sauce derived from hair, paraffin-laden hotpot soup bases, toxic rice, adulterated cooking oil, and the presence of clenbuterol. Such incidents not only provoke widespread public concern, they also pose significant threats to the survival and growth of businesses across the entire food supply chain. These occurrences highlight the critical need for businesses to enhance risk prevention measures within the food supply chain. Effective risk management begins with the identification and thorough assessment of potential risks. Notably, within the food supply chain, a predominant portion of the emergent risks is attributed to uncertainties, distinguishing these risks from those prevalent in broader supply chain contexts [5]. The development of innovative techniques for risk assessment is crucial. In this regard, the AHP is adopted as an efficient tool to quantify and assess risks in the food system. It is a Multicriteria Decision-making Method (MCDM) combining qualitative and quantitative analysis proposed by the American operations research scientist Saaty [6]. MCDM serves as an analytical tool designed to tackle complex problems involving multiple alternatives with tradeoffs, where decisions are influenced by various criteria [7]. It enables the simplification of intricate scenarios into smaller controllable sections that can be addressed separately and then aggregated to reach a holistic and effective solution [6]. They are various types of MCDM tools that can be classified into two major categories: outranking methods, which assess the performance of each alternative individually with no compensation of other criteria; and compensatory methods, which are applicable in instances involving alternatives with positive aspects that can outweigh the deficiencies in other alternatives [8]. In the context of risk management, the purpose of decision makers is to improve response mechanisms and mitigation plans faced with sudden and continuous uncertainties. This entails a holistic understanding of the situation of resources, the current available strategies, and the performance of the sectors. Since these problems are complex and multifaceted, the initial step towards mitigating risks is to rank their influence on the studied system. In this regard, the AHP, which is a compensatory MCDM, is considered one of the most effective techniques to address such problems. It allows decision makers to systematically analyze and compare various criteria and alternatives, considering the intricate interconnections between them. By structuring the problem hierarchically and utilizing pairwise comparisons, the AHP captures the relationships between different climate change risks. There is an inherent flexibility in the tool, accommodating qualitative and quantitative data, along with its capacity to integrate expert judgments. Therefore, it can be considered suitable for assessing and prioritizing climate change risks, and as such, decision makers can utilize the AHP to make informed choices pertaining to evolving climate challenges, ensuring a comprehensive and robust evaluation of climate-related risks and their potential impacts.
The AHP has been extensively deployed in the food system, notably in the agriculture sector. The latter has strategic importance as the source of nourishment, and agriculture is also an essential part of the state’s economy, environment, and quality of life. The AHP is extensively used in risk factor assessments. Risk factors can substantially influence decision-making in the field of agriculture. [9]. For instance, the AHP is beneficial in supporting decision making for land use suitability, since it aids in problem evaluation when several competing criteria are present [10]. In order to undertake land use suitability analysis using the AHP technique, it is important to deconstruct unstructured issues into their constituent elements. The factors were organized into three hierarchies: goal, criteria, and sub-criteria. The factors were compared to one another and given a relative dominant value between 1 and 9 [6]. In addition, the AHP is extensively utilized across a variety of sectors, including environmental science, manufacturing, and management, as highlighted by Tscheikner-Gratl et al. [11]. Applications are diverse, for instance, Haji et al.‘s [12] development of a risk assessment framework for greenhouse planning in arid environments, and Thanki et al.’ s [13] exploration of lean-green practice adoption within small- and medium-sized enterprises. The AHP’s importance lies in its capacity to synthesize both quantitative and qualitative criteria, thereby facilitating decisions that are both informed and transparent. Although AHP may be subject to potential inaccuracies due to subjective judgments, the methodology includes mechanisms for consistency checks to confirm the reliability of established priorities. Deploying authoritative data and expert opinion in setting these priorities can further enhance the method’s precision [11]. Advancements such as Leal’s [14] AHP-express method have streamlined the AHP application in complex comparative analyses by minimizing procedural steps and promoting more nuanced evaluations across the hierarchy’s various levels. At its core, the AHP simplifies intricate issues into a hierarchical structure of criteria and alternatives, all aimed at a singular goal [15].
The complexity and diversity of risks within the food system necessitate the use of both qualitative and quantitative methods for a comprehensive assessment, involving techniques, such as ranking, screening, and the distribution of weights. Navigating these intricacies, however, demands more than just assessment; it requires the strategic alignment of food system components to ensure sustainability and resilience. This is where optimization plays a pivotal role, serving as a bridge between the assessment of risks and the implementation of effective strategies to mitigate these risks. Optimization models, particularly those with multi-objective frameworks, are instrumental in planning the complex interplay of factors that define the food system. They provide a structured methodology to balance competing objectives, such as environmental sustainability, economic viability, and nutritional adequacy, amidst the dynamic and global nature of food supply chains. Multi-objective network design can accommodate the diverse requirements of products and nutrients within the food system. By considering factors, like sourcing, processing, and transportation, optimization models strive to minimize environmental impacts and financial costs while catering to societal nutritional needs. This approach enables a comprehensive evaluation of dietary transitions, such as shifting from meat-based to plant-based diets, and their implications on supply chain configurations. Utilizing real-world data and case studies, these models illuminate the trade-offs between various goals and delineate the environmental responsibilities across the supply chain’s spectrum [16].
The integration of multi-objective optimization models within the food system has increasingly become a focal point of multiple studies, aiming to reconcile the often-conflicting goals of environmental sustainability, economic efficiency, and social equity. For instance, Agrawal et al. [17] deployed multi-objective optimization to enhance the sustainability of agricultural practices while maximizing crop yields and minimizing water usage. The study uniquely balanced the need for high agricultural productivity with the imperative of water conservation, demonstrating the potential for optimization models to contribute to more sustainable farming practices. Another study, conducted by Jian et al. [18], introduced a multi-objective optimization model within a green supply chain, balancing economic gains with environmental benefits, demonstrating that a revenue-sharing contract effectively aligns these dual objectives, facilitating mutual benefits for all parties involved. Furthermore, the work of Lin et al. [19] explored the optimization of food distribution networks to improve food access in urban areas. The model considered various objectives, including minimizing transportation costs, reducing greenhouse gas emissions, and ensuring equitable food distribution across different urban sectors. The findings highlighted the critical role of optimization in creating more inclusive and environmentally friendly food distribution systems. Focusing on food production, Abejón et al. [20] utilized optimization for plant-based food production systems. The study aimed to balance nutritional value, environmental impact, and consumer affordability through a multi-objective optimization framework. The results underscored the potential for such models to guide the development of sustainable, nutritious, and accessible plant-based food products.
The integration of AHP with optimization models offers a promising pathway to address the complex challenges posed by climate change on food supply chains. While AHP facilitates a detailed analysis of risk factors and their relative importance, optimization models enable the strategic allocation of resources to mitigate these risks effectively. This integrated approach is crucial for developing resilient and sustainable food supply chains capable of withstanding the multifaceted impacts of climate change. Considering sustainable supply chain management, Belamkar et al. [21] utilizes AHP to assess environmental and social sustainability factors in conjunction with economic considerations. By deploying a multi-objective optimization model, the study proposes optimal configurations that balance the triple bottom line of sustainability, thus highlighting the versatility of AHP in capturing diverse criteria and the power of optimization models in navigating the trade-offs between these criteria. Furthermore, a study by Hassna et al. [22] provides valuable insights into the application of AHP for evaluating the resilience of supply chains to climate-induced disruptions. By identifying key resilience factors, which are integrated into a multi-objective optimization model, the study proposed strategic adaptations that enhanced the supply chain’s robustness against climate-related shocks. This research underscores the critical role of resilience in maintaining the continuity and reliability of food supply chains in the face of climate uncertainties.
Despite these advancements, the literature still exhibits a gap in specifically addressing climate change risks in food supply chains through an integrated AHP and multi-objective optimization framework. The intricate dynamics of climate risks, coupled with the critical nature of food security, necessitates a tailored approach that considers the specific vulnerabilities and adaptive capacities of food supply chains.
3. Methodology
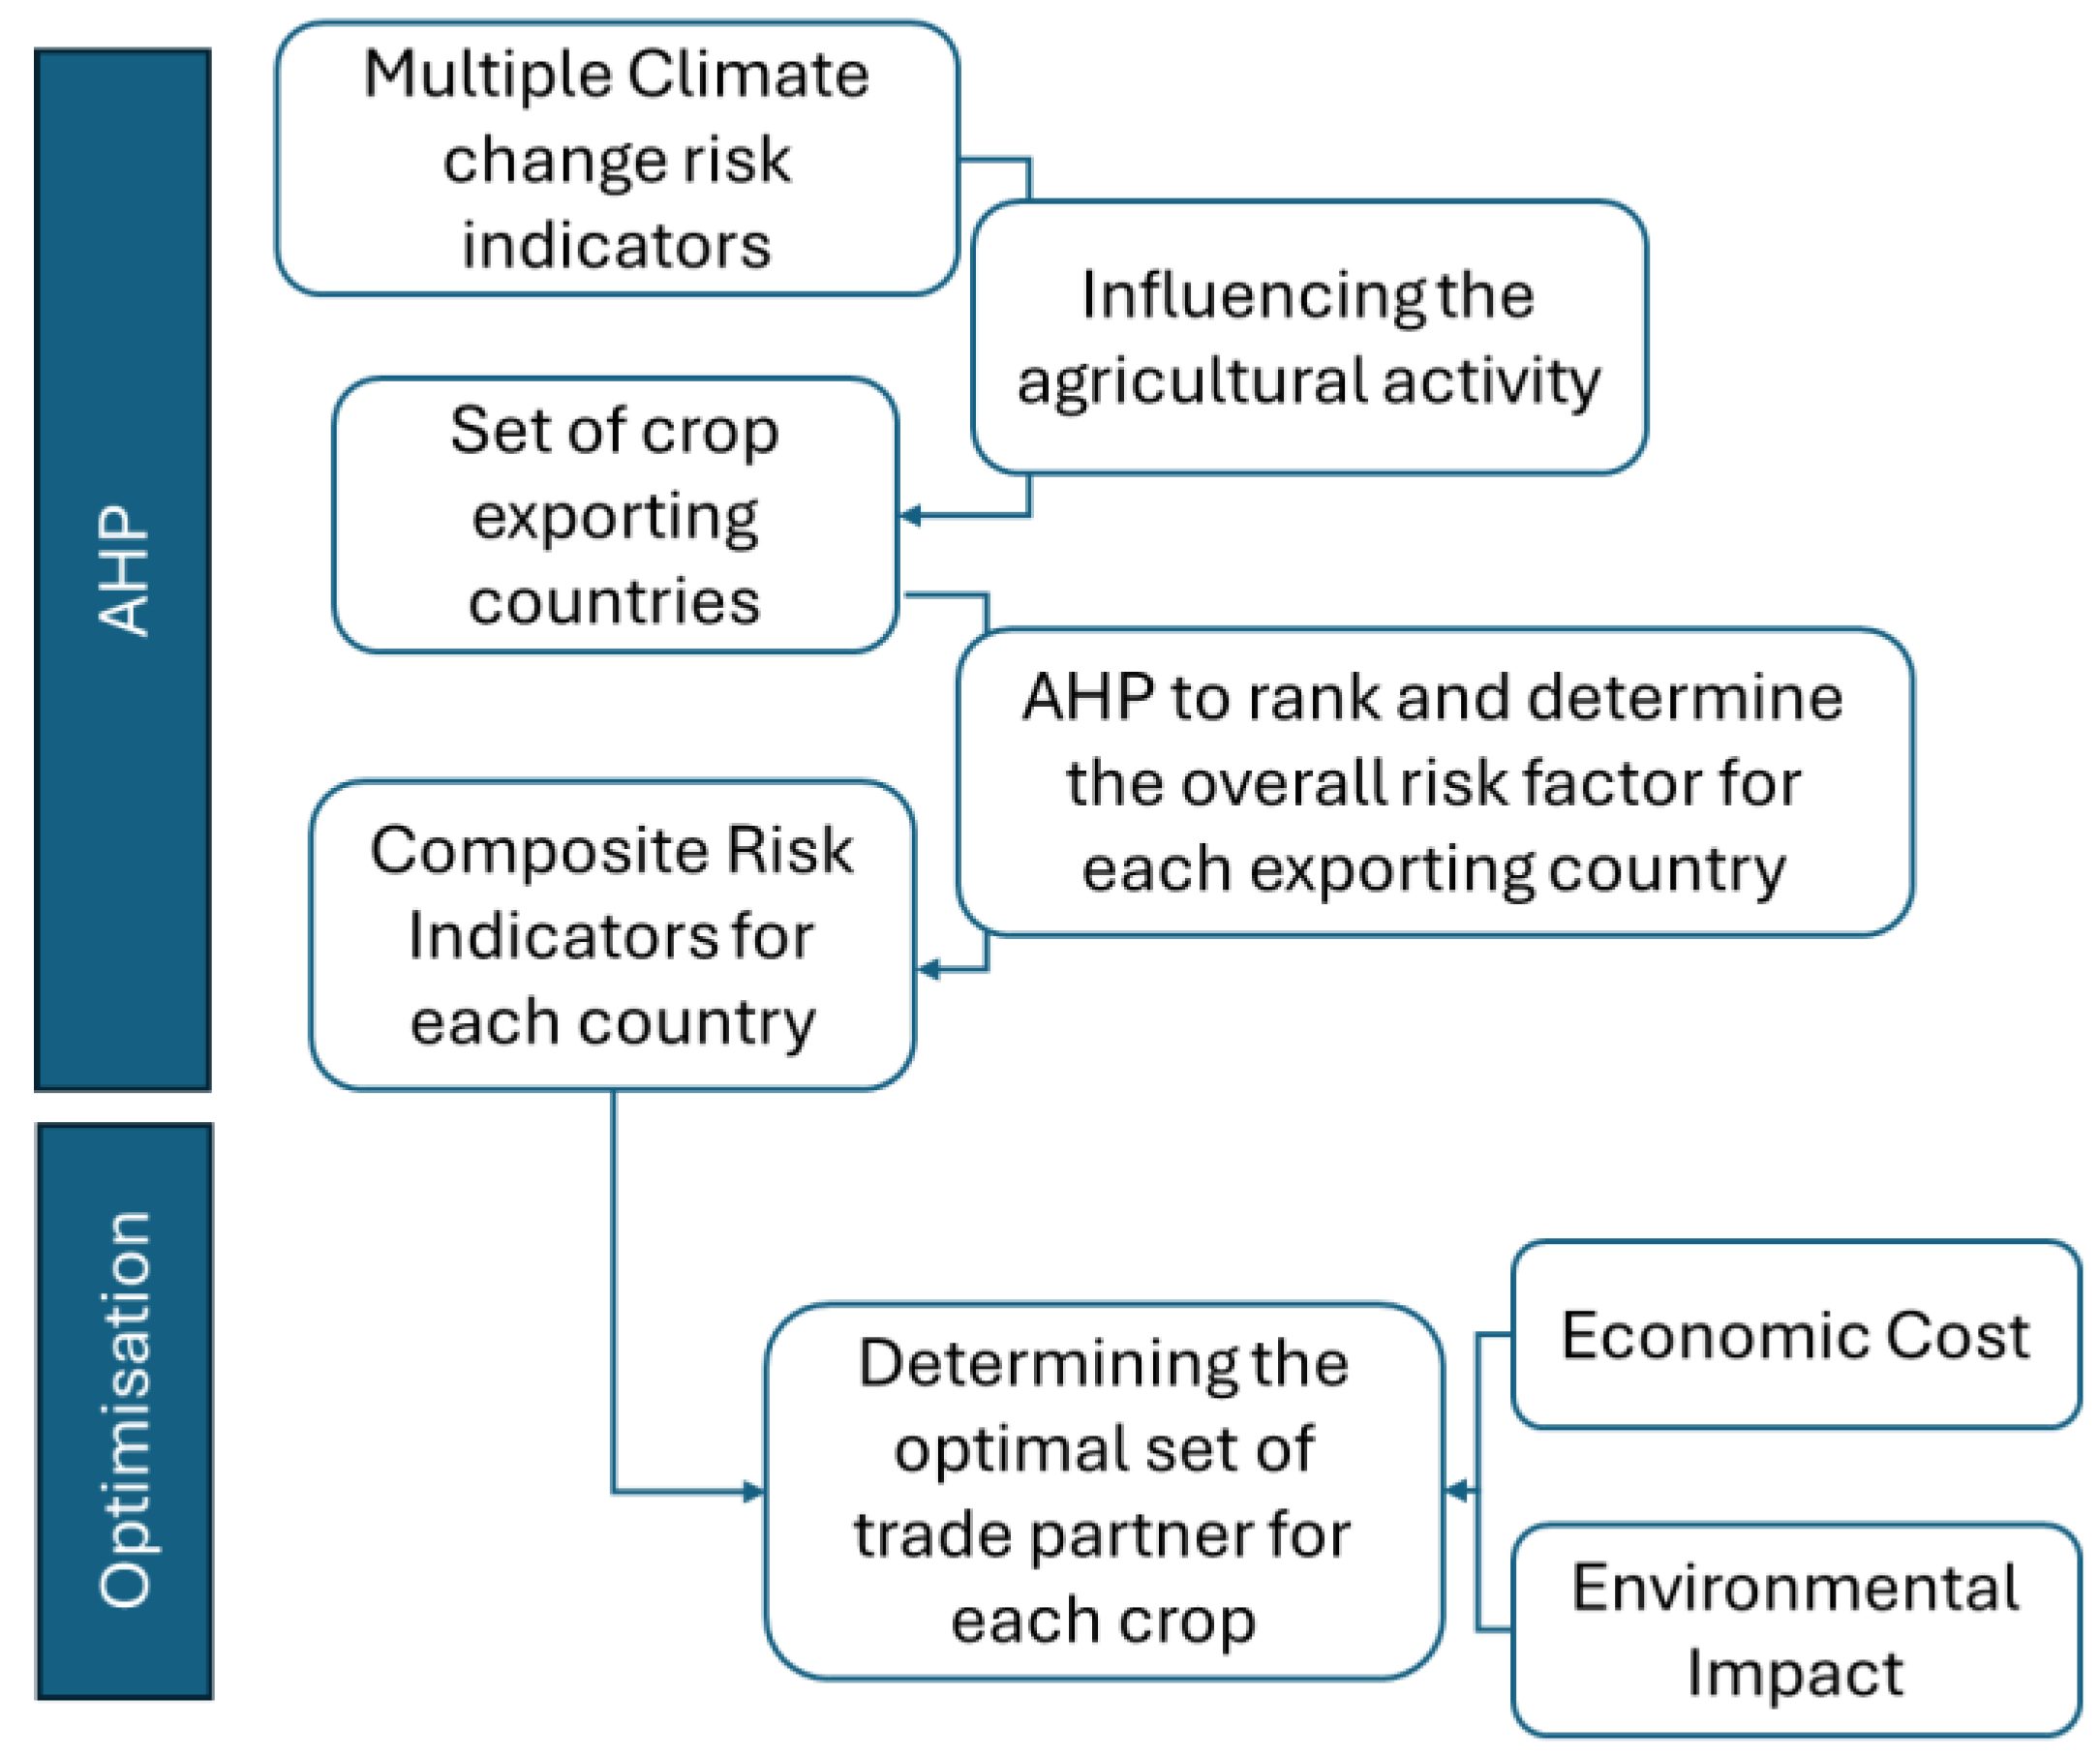
The methodology proposed in this study aims to enhance the resilience of the food import system in the face of climate risks affecting exporting countries. The suggested framework determines the optimal set of trade partners capable of meeting Qatar’s annual demand, as an importing nation, for three essential commodities: tomatoes, cucumbers, and onions, which are the most consumed crops in the nation. The framework is designed over two stages, wherein the initial step is to construct a composite risk factor that depicts the impact of climate change risks on the production of different crop-producing countries. The indicators selected consider multiple factors representing uncontrolled natural risks, such as surface temperature, arable land, water stress, and sea level, in addition to some monitored indicators representing the countries’ response to climate change, such as disaster risk management programs. The selection of these indicators is grounded in the recognition that the impact of climate change on irrigation is multifaceted and influenced by a variety of natural factors. These factors, including surface temperature, arable land availability, water stress, and sea level, collectively contribute to uncontrolled natural risks that can significantly affect irrigation systems. Additionally, the inclusion of monitored indicators, such as disaster risk management programs implemented by countries, reflects the proactive measures taken in response to climate change. By considering both the natural risks and the countries’ response strategies, a comprehensive assessment of the impact of climate change on irrigation can be obtained, providing valuable insights for effective planning and adaptation measures. The composite indicators for each trade partner are designed using the AHP method. The second stage of the methodology consists of optimizing the international supply system in charge of delivering tomatoes. The problem is formulated as a multi-objective optimization that minimizes the economic and environmental costs in addition to the exposure to climate risks of the selected trade network (Figure 1). A detailed description of the methodology is presented in the following sections, wherein Section 3.1 explains the AHP steps, and Section 3.2 illustrates the mathematical formulation of the optimization framework.

Figure 1.
A general illustration of the suggested methodology.
3.1. The AHP Methodology
The AHP is used in this study to determine the overall risk factor characterizing every trade partner, such that the higher the composite index is, the higher the risk of importing from the exporting country. The generic structure of the AHP begins with identifying the goal and objective of the assessment. Following a hierarchical approach, criteria, sub-criteria, and alternatives are then established, with the goal at level zero, alternatives at the lowest level, and criteria at intermediary levels. Subsequently, a pairwise comparison is performed, comparing each pair of elements at lower levels to ensure consistency. During this comparison, a nine-point scale method developed by Saaty [15] is employed to assign importance weights (refer to Table A1) [15]. Data for this study were gathered from various outlets, primarily consisting of gray literature. This encompasses annual reports from ministries, reports from consultancy firms, and databases from international organizations. Then, the final step involves estimating priority scores at each level. Table A2 lists the sources that were used to estimate the priority scores.
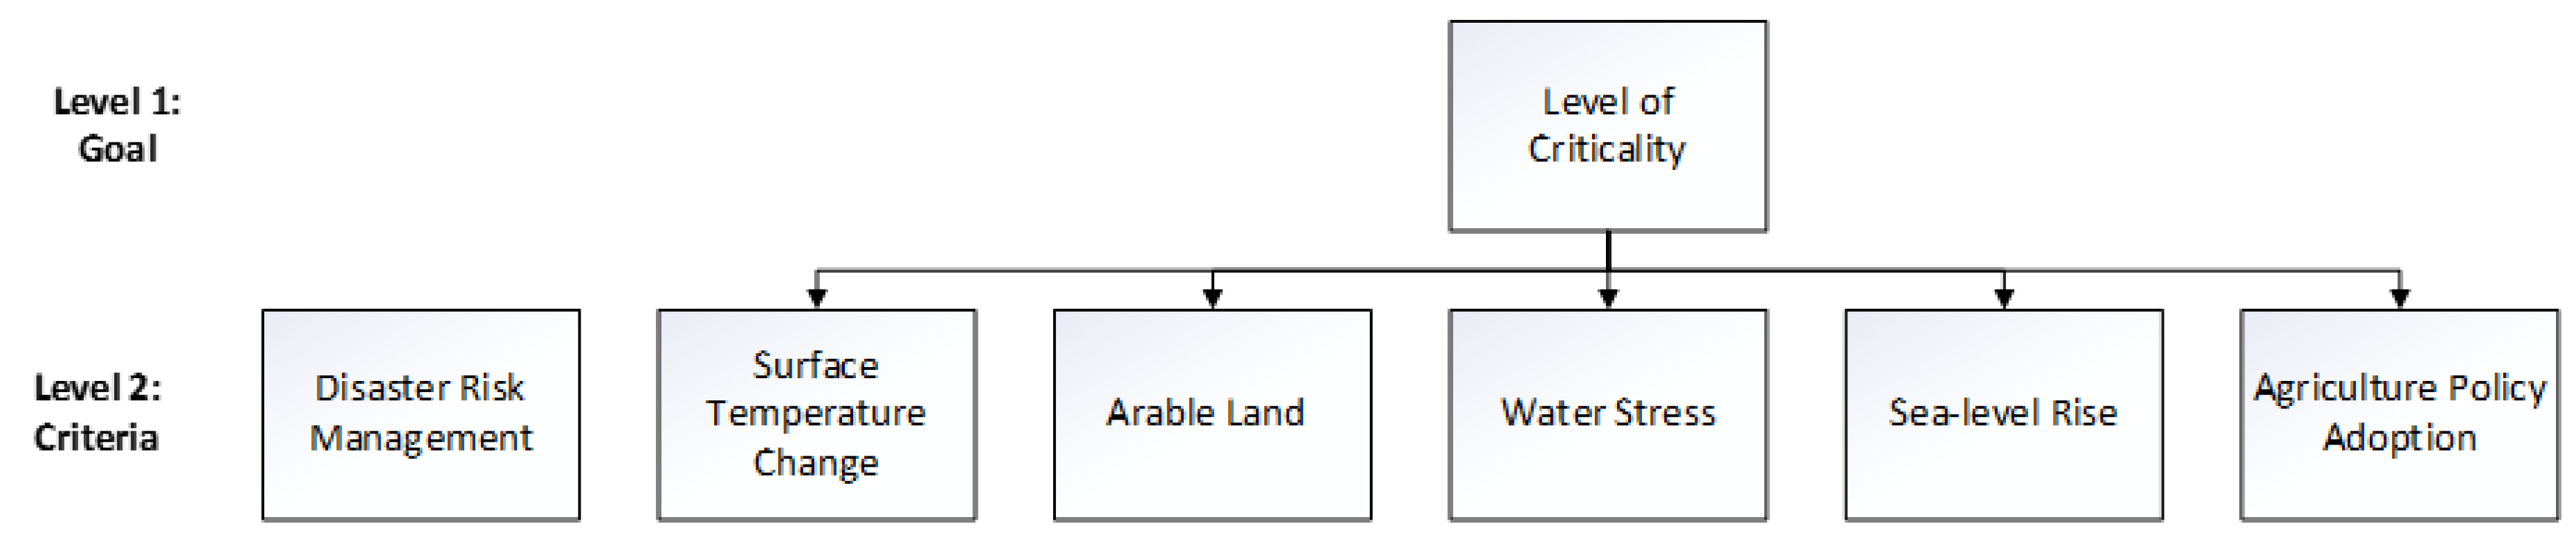
In this study, the AHP is meticulously applied to evaluate the climate change risk factors affecting agricultural sectors within seven countries: the United States of America, Iran, Lebanon, India, Turkey, Morocco, and the Netherlands. The focus is on three primary crops: tomatoes, cucumbers, and onions. This led to the creation of twenty-one composite indicators that encapsulate the risk profiles for the crop-producing sectors across these countries. For each country and crop combination, this study identifies six critical risk factors: disaster risk management, surface temperature change, arable land availability, water stress, sea level rise, and agricultural adaptation policies. This results in a comprehensive analysis involving 15 pairwise comparisons per set of risk factors, employing the equation 5, where n is the number of risk factors. To illustrate the process, an example of the pairwise comparison matrix used to assess the risk factors for tomato production in India is provided (Table 1). This methodology is consistently applied to all scenarios under investigation. Subsequent to the completion of pairwise comparisons, the study employs normalized eigenvalue approximation to derive priority vectors. This involves normalizing each value within the comparison matrix by the sum of its respective column, followed by averaging the normalized values across rows to yield a set of priority scores for each risk factor. The culmination of this phase is the synthesis of these priority scores into a singular, representative composite risk indicator for each crop–country pair. This aggregation is achieved through a weighted average calculation, where the lowest score is assigned a weight of 1 and the highest score receives a weight of 6, reflecting the relative significance of each risk factor [23]. The generated composite risk indicators serve as critical inputs into the optimization model detailed in the subsequent section, Section 3.2, providing a robust foundation for the strategic assessment and mitigation of climate change risks within the specified agricultural contexts. To aid in the understanding of the AHP methodology and its application in this context, a hierarchical diagram is provided, visually representing the decision-making framework, from the overarching goal down to the specific criteria considered (Figure 2).

Table 1.
(a) Pairwise comparison matrix for India’s tomato production sector. (b) Pairwise comparison matrix for India’s cucumber production sector. (c) Pairwise comparison matrix for India’s cucumber production sector.
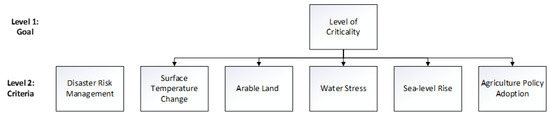
Figure 2.
The hierarchical tree of the AHP framework.
3.2. The Optimisation Model
The optimization model is designed to optimally deliver the selected food items (i) to the State of Qatar from different supplying countries (j) through different shipping means (k), as elaborated in Table 2. For the determination of optimal allocation (), the model is set to fulfill a set of 3 objectives: minimizing net cost, environmental impact, and aggregated risk. The mathematical formulation of the optimization problem is defined through Equations (1)–(11).
where:
Table 2.
Optimization’s model sets.
Table 2.
Optimization’s model sets.
| i: item | j: country of supply | k: means of shipping |
| i1: Tomatoes i2: Onions i3: Cucumbers | j1: USA j2: Iran j3: Lebanon j4: India j5: Turkey j6: Morocco j7: Netherlands | k1: Ground freight k2: Sea freight k3: Air freight |
| Objective (1): Minimizing Cost: | |
| (1) |
: Allocation of purchased item (i) from country (j) through shipping mean (k).
: Total quantity required of item (i).
: Cost of plantation of item (i) at country (j).
Cost of shipping from country (j) through shipping means (k).
| (2) | |
| (3) |
: Shipping distance (km).
: Shipping cost factor (USD /tonne.km).
The annual demand for tomatoes, onions, and cucumbers is set at 158,008, 5396, and 87,392 tons, respectively, as reported by the Planning and Statistics Authority of Qatar. The shipment options and their associated details are presented in Table 3 for the different supplying countries [24]. In addition, the item’s unit cost is reported in Table 4.
Table 3.
Estimated distance and time (days) of shipment from the different supplying countries.
Table 4.
Items’ unit cost for different supplying countries.
The annual demand for tomatoes, onions, and cucumbers is set at 158,008, 5396, and 87,392 tons, respectively, as reported by the Planning and Statistics Authority of Qatar. The shipment options and their associated details are presented in Table 3 for the different supplying countries. In addition, the item’s unit cost is reported in Table 4 [25].
| Objective (2): Minimizing Environmental Impact: | |||
| (4) | |||
| where | : Environmental impact of plantation of item (i) at country (j). | ||
| : Environmental impact of shipping from country (j) through shipping means (k). | |||
| (5) | |||
| (6) | |||
| where | : Shipping distance (km). | ||
| Shipping emissions factor (kg CO2-e/tonne.km). | |||
The associated emissions per mass unit of shipped items were calculated earlier considering the distance and freight means, as reported in Table 5.
| Objective (3): Minimizing Risk: | ||
| (7) | ||
| where | : Aggregated risk factor of the growing item (i) at country (j). | |
| Constraints: | ||
| (1) Fulfilling Demand: The sum of allocation shall fulfill the local demand. | ||
| (8) | ||
| where | : Degradation (%) of the item (i) from country (j) through shipping means (k). | |
| : Shipping distance (km). | ||
| : Degradation factor of the item (i). | ||
| (2) Diversification: To ensure diversification, lower and upper bounds are defined. | ||
| (9) | ||
| (3) Ensuring Quality: The allocation is restricted if item degradation exceeds 20%. | ||
| If , | (10) | |
| (4) Supplier Capacity Constraints: The allocation is restricted by the supplier capacity. | ||
| (11) | ||
Table 5.
Associated shipping emissions (kg CO2-e/kg).
The weight loss rate of different items is highly dependent on the shipment distance and time (days). The average weight loss of the three items for different scenarios is presented in Table 6 [26].
Table 6.
Weight loss rate of the three items (% per day).
The optimization model is solved as a multi-objective problem, in which the three objectives are optimized simultaneously using the genetic algorithm’s approach of MATLAB (R2018a).
In the second scenario, two sub-scenarios are evaluated, whereas in the first sub-scenario (2a), the problem is solved for each item independently (i.e., tomatoes, cucumbers, onions). In the second sub-scenario (2b), the problem is solved for all items collectively.
4. Results and Discussion
4.1. The AHP Results
After conducting the AHP for all three crops, a single composite risk factor was generated for each trade partner, reflecting the impact of climate-change-induced risks. The composite risk was generated such that the priority scores resulting from the AHP were ranked from the most critical to the least critical, such that the lowest score was given a ranking of 1 and the highest score was given a ranking of 6. The result of the weighted average of the ranking and priority score is a one representative score that shows the impact of climate change on each country. Risks’ influence differs from one country to another; however, it is consistent for all crops grown in the same country. This is due to the selection of the individual factors that are used to generate the composite risk indicator. Those factors generally describe the impact of climate change risks on food production and are not crop-specific. In fact, indicators representing characteristics that are exclusive to each crop, such as water requirement, soil quality, and adequate weather conditions, are not factored in this analysis.
Table 7 summarizes the results of the AHP and illustrates the composite risk factors that were used as parameters for the optimization framework as part of objective 3, aiming to minimize the overall risk factor of the set of trade partners.
Table 7.
The aggregated risk factor of the AHP framework.
4.2. The Optimization Results
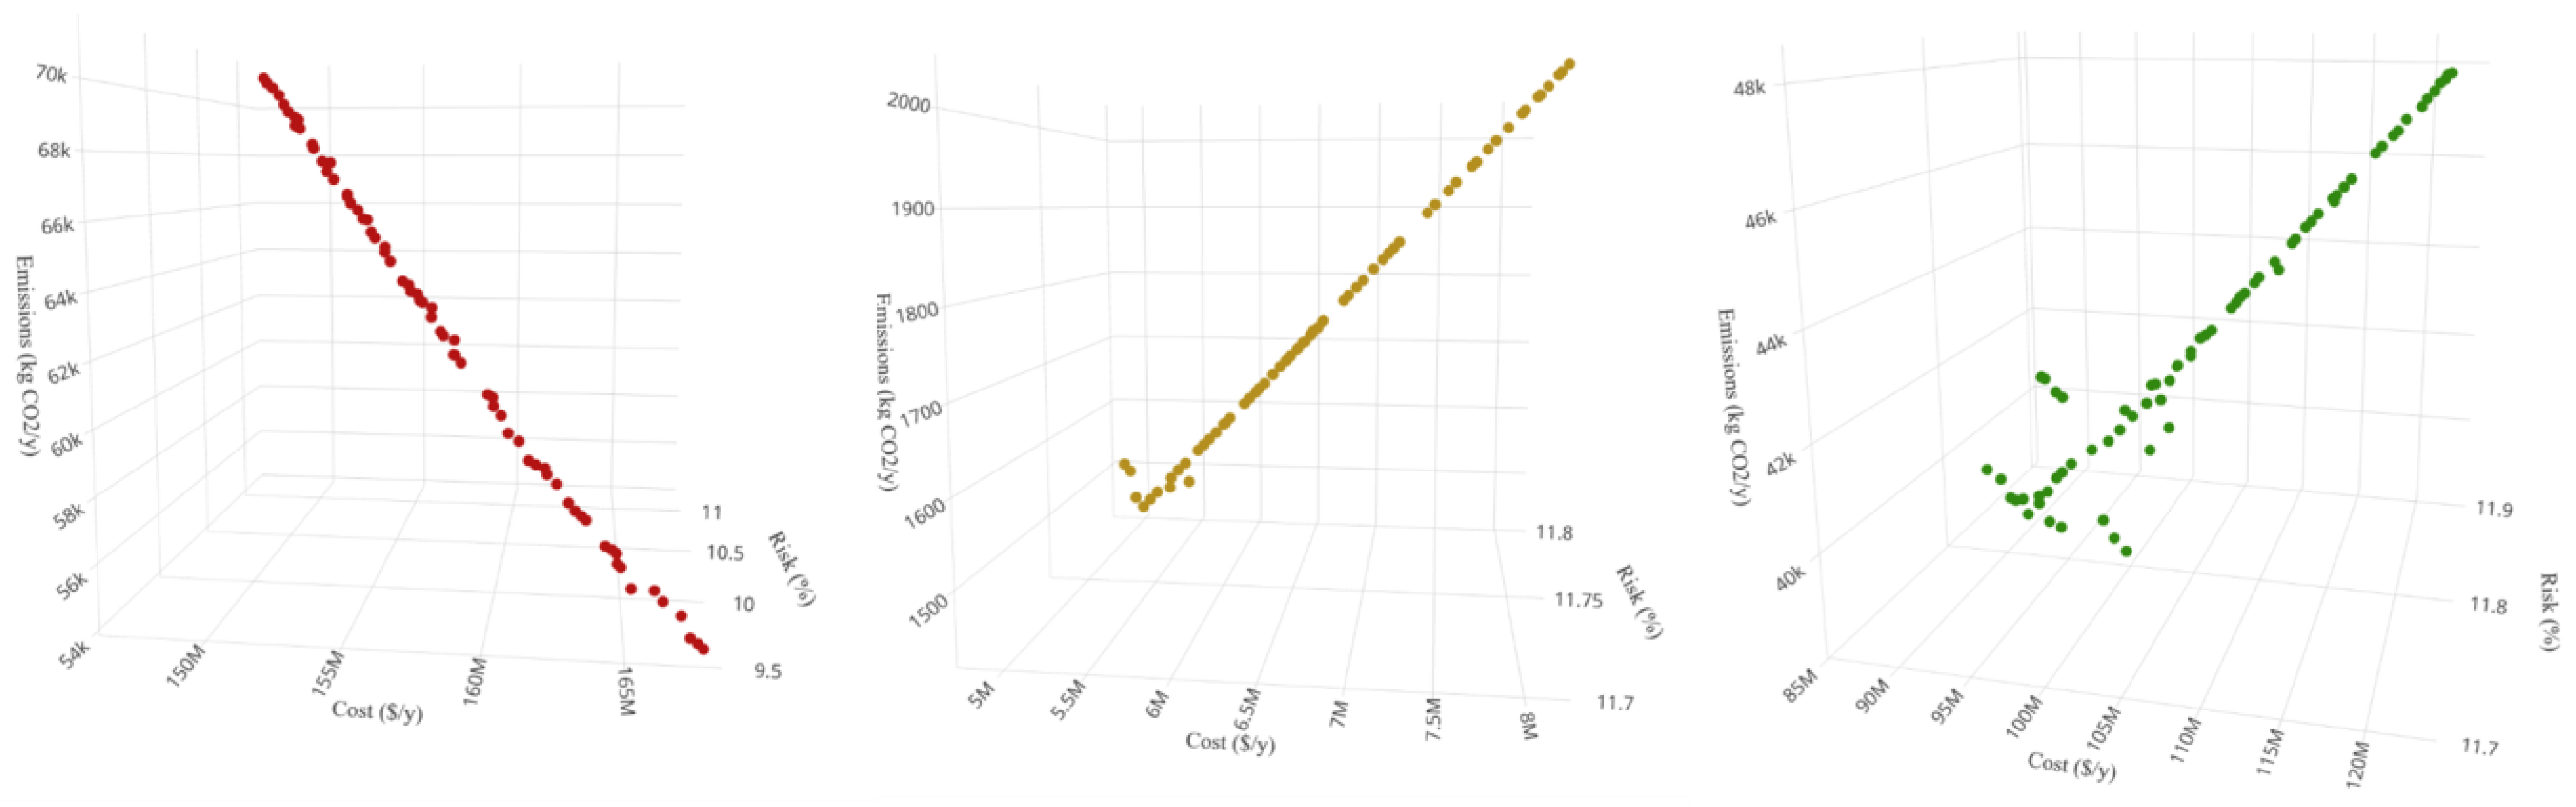
The multi-objective optimization model was used for three different crops in order to determine the optimal network of exporters. The results of the three optimizations are summarized in Figure 3, while Figure 4, Figure 5 and Figure 6 illustrate the average percentage contributions of each trading partner to the demands of tomatoes, onions, and cucumbers, respectively. Considering tomatoes, the optimal solution costs a total of USD 16 million and generates 60 tons of CO2eq, with an average risk of 10%. As for onions, the economic costs, environmental emissions, and risk factors are USD 6 million, 1 ton of CO2eq, and an average risk exposure of 11.8%, respectively. With regard to cucumbers, USD 10 million for the total supply cost, 42 tons of CO2eq for the environmental emissions, and similar risk factors.
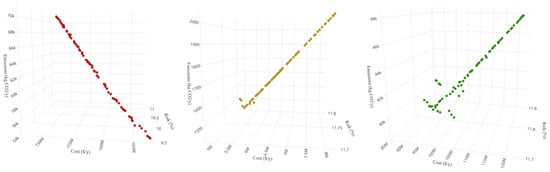
Figure 3.
(From left to right) the Pareto fronts for tomatoes, onions, and cucumber optimal import networks.
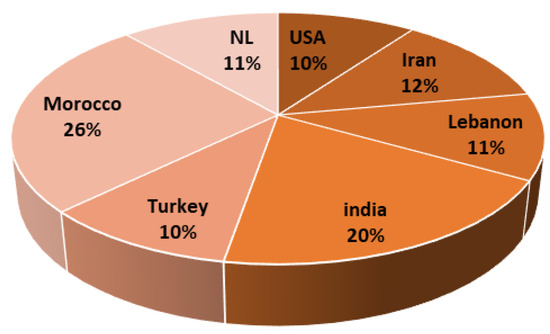
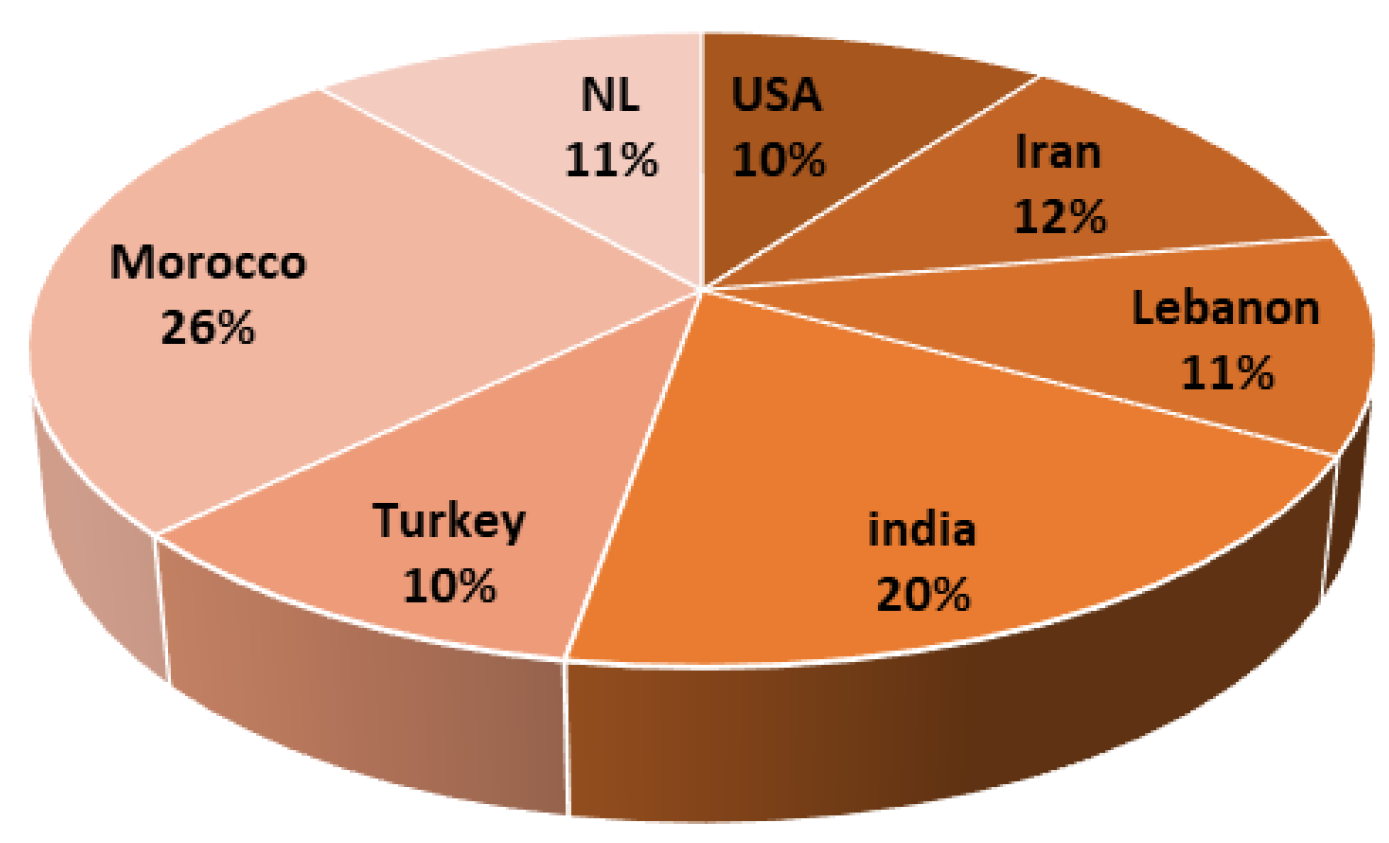
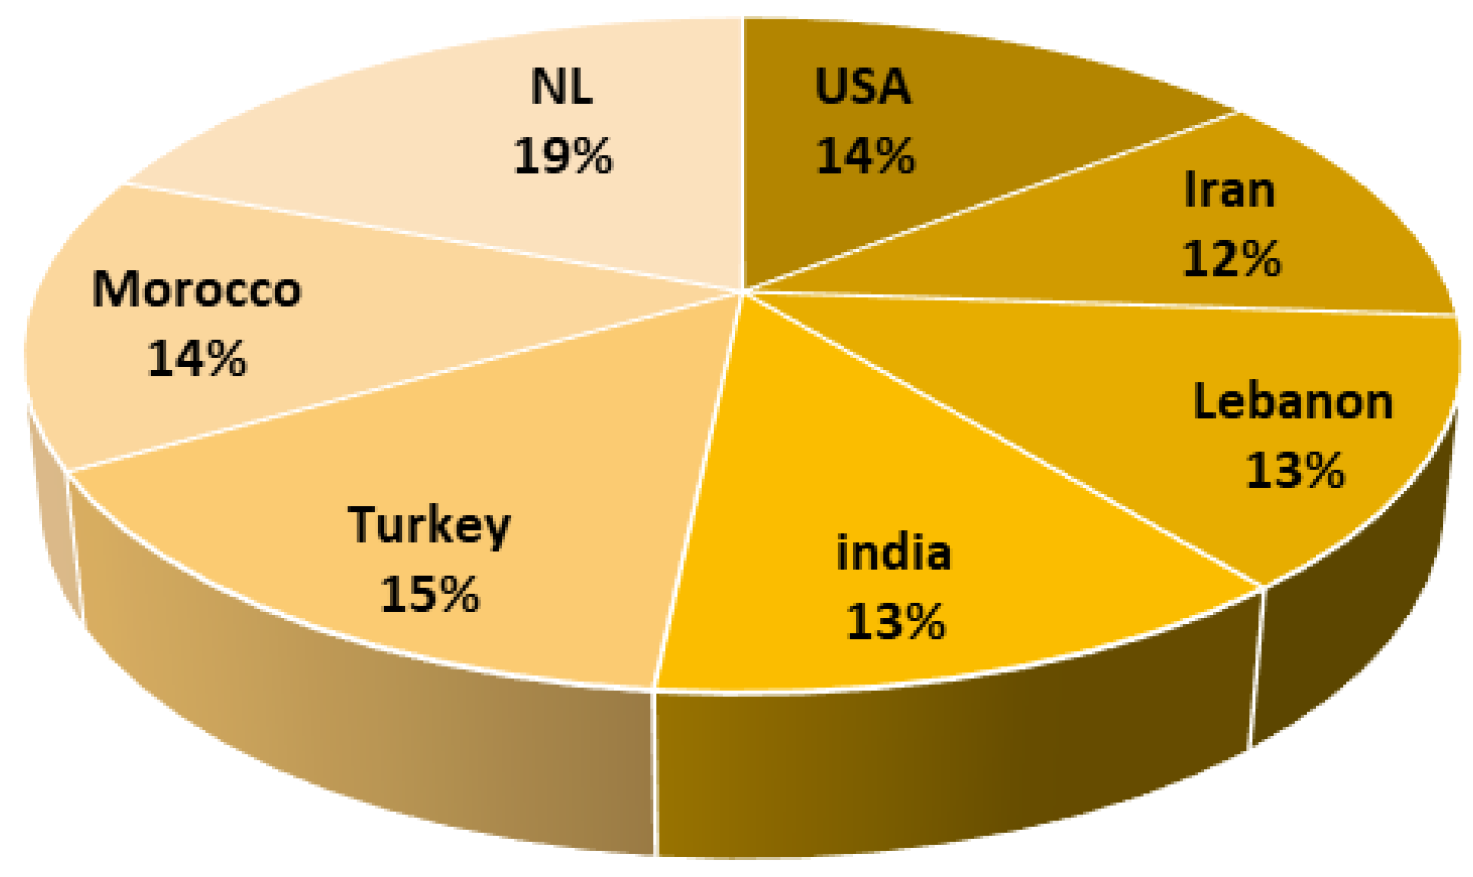
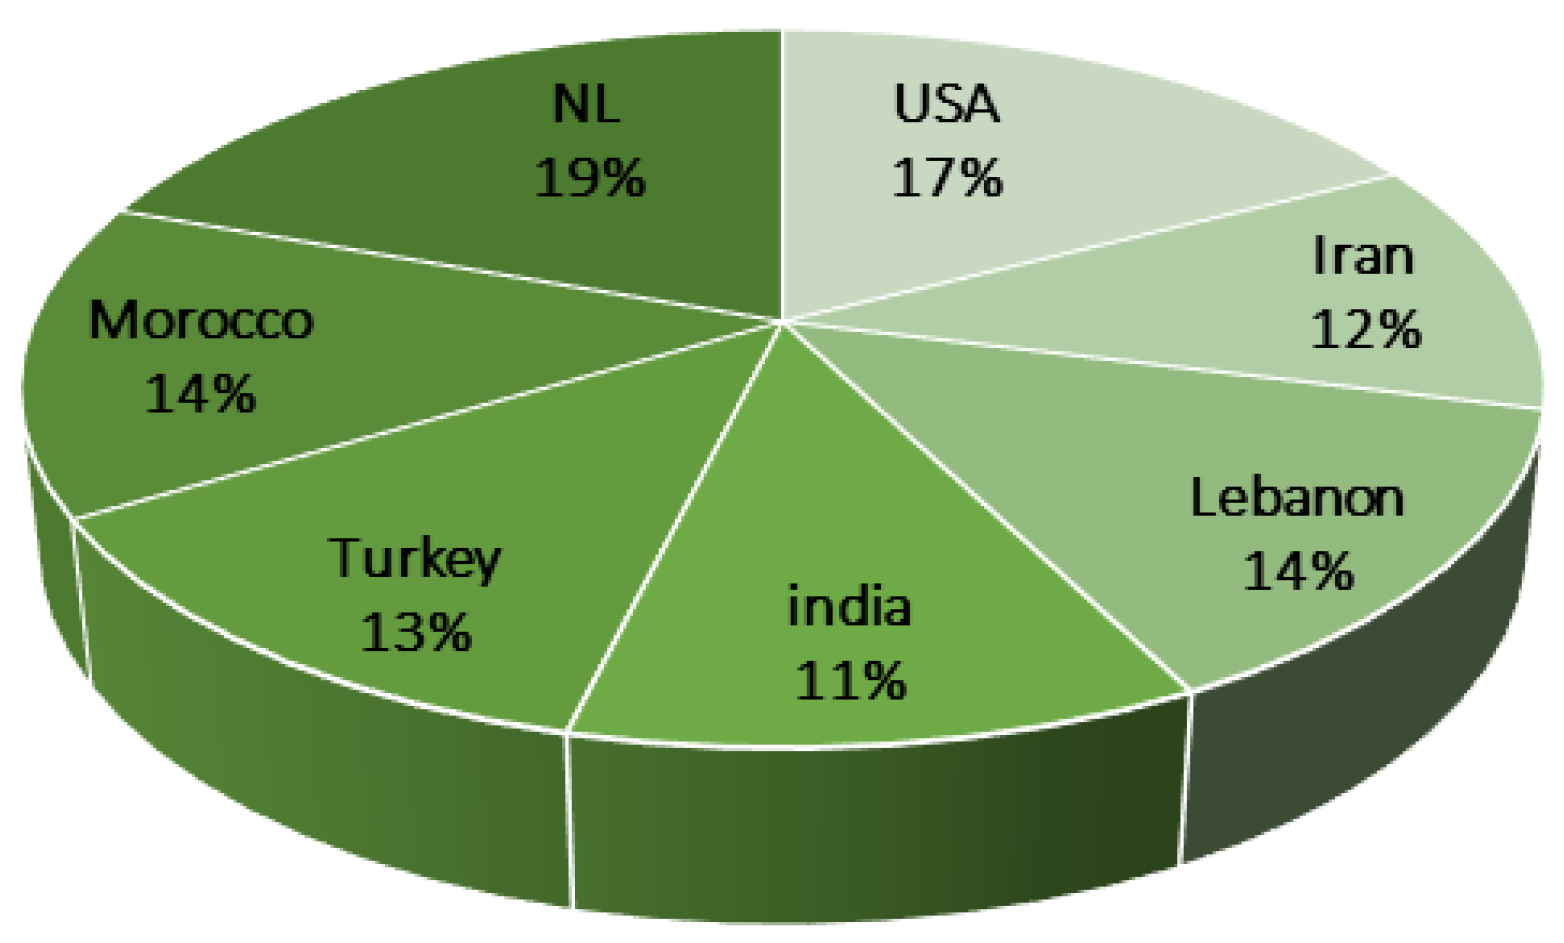
Figure 4.
The optimal tomato import network.

Figure 5.
The optimal onion import network.
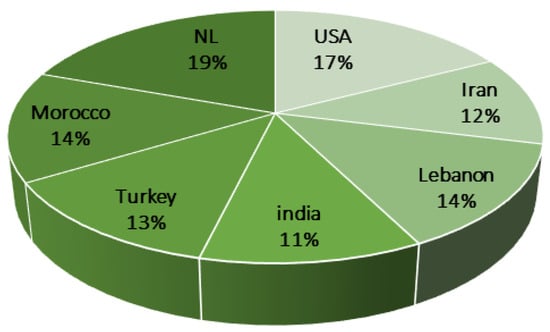
Figure 6.
The optimal cucumber import network.
Considering the network of tomato distribution (Figure 4), these data suggest that a sizable portion of the global tomato supply comes from a relatively small number of countries. This could have implications for food security and supply chain resilience. For example, if there is a disruption to tomato production in one of these key countries, it could lead to higher prices and shortages for consumers around the world. It is also interesting to note that the countries with the highest tomato imports are not necessarily the same countries with the highest tomato consumption. For example, Morocco and India are both major tomato exporters, but they also import a significant amount of tomatoes. This suggests that there is a complex global tomato market with multiple trade flows. Considering onions (Figure 5), the optimal onion import network pie chart shows that India is the largest importer of onions, followed by Turkey, Morocco, the Netherlands, Iran, Lebanon, and the United States. As for cucumbers (Figure 6), the optimal cucumber import network pie chart shows that the Netherlands and the United States are the two largest importers of cucumbers, accounting for 19% and 17% of all cucumber imports, respectively.
Morocco, India, Turkey, and Lebanon are major cucumber importers, with 11% to 14% shares. The dominance of the Netherlands and the United States in the global cucumber import market is likely due to a number of factors, including their favorable climates, advanced agricultural technologies, and well-developed transportation and logistics networks. These countries are able to produce cucumbers year round and export them to all corners of the world. An examination of the optimal import networks for tomatoes, onions, and cucumbers reveals key similarities and differences. All three networks highlight a concentrated market with a handful of major players dominating the import landscape. The top-four importers of tomatoes, onions, and cucumbers account for over 60% of all imports, suggesting significant consolidation within the global vegetable trade. Despite this shared characteristic, the specific countries leading each network differ. Morocco tops the tomato import chart, followed by India and Iran. India emerges as the leading importer of onions, while the Netherlands and the United States jointly dominate the cucumber import market. These variations reflect unique regional demands and production capacities.
4.3. Sensitivity Analysis
In order to offset the discrepancies that might be generated by the optimization model due to the inaccuracy of parameter data and the subjectivity of AHP judgments and priority scores, a sensitivity analysis was conducted to quantify the impact of any changes in experts’ point of view and input data on the selection of trade partners. Six scenarios were carried out to measure the impact of varying every objective function on the trade-offs that exist amongst the three of them. A percentage reduction and increase of 20% is applied alternatively to the parameters of each objective function as a means to capture the economic, environmental, and risk trade-off and the new supply distributions (Table 8).
Table 8.
The different sensitivity analysis scenarios.
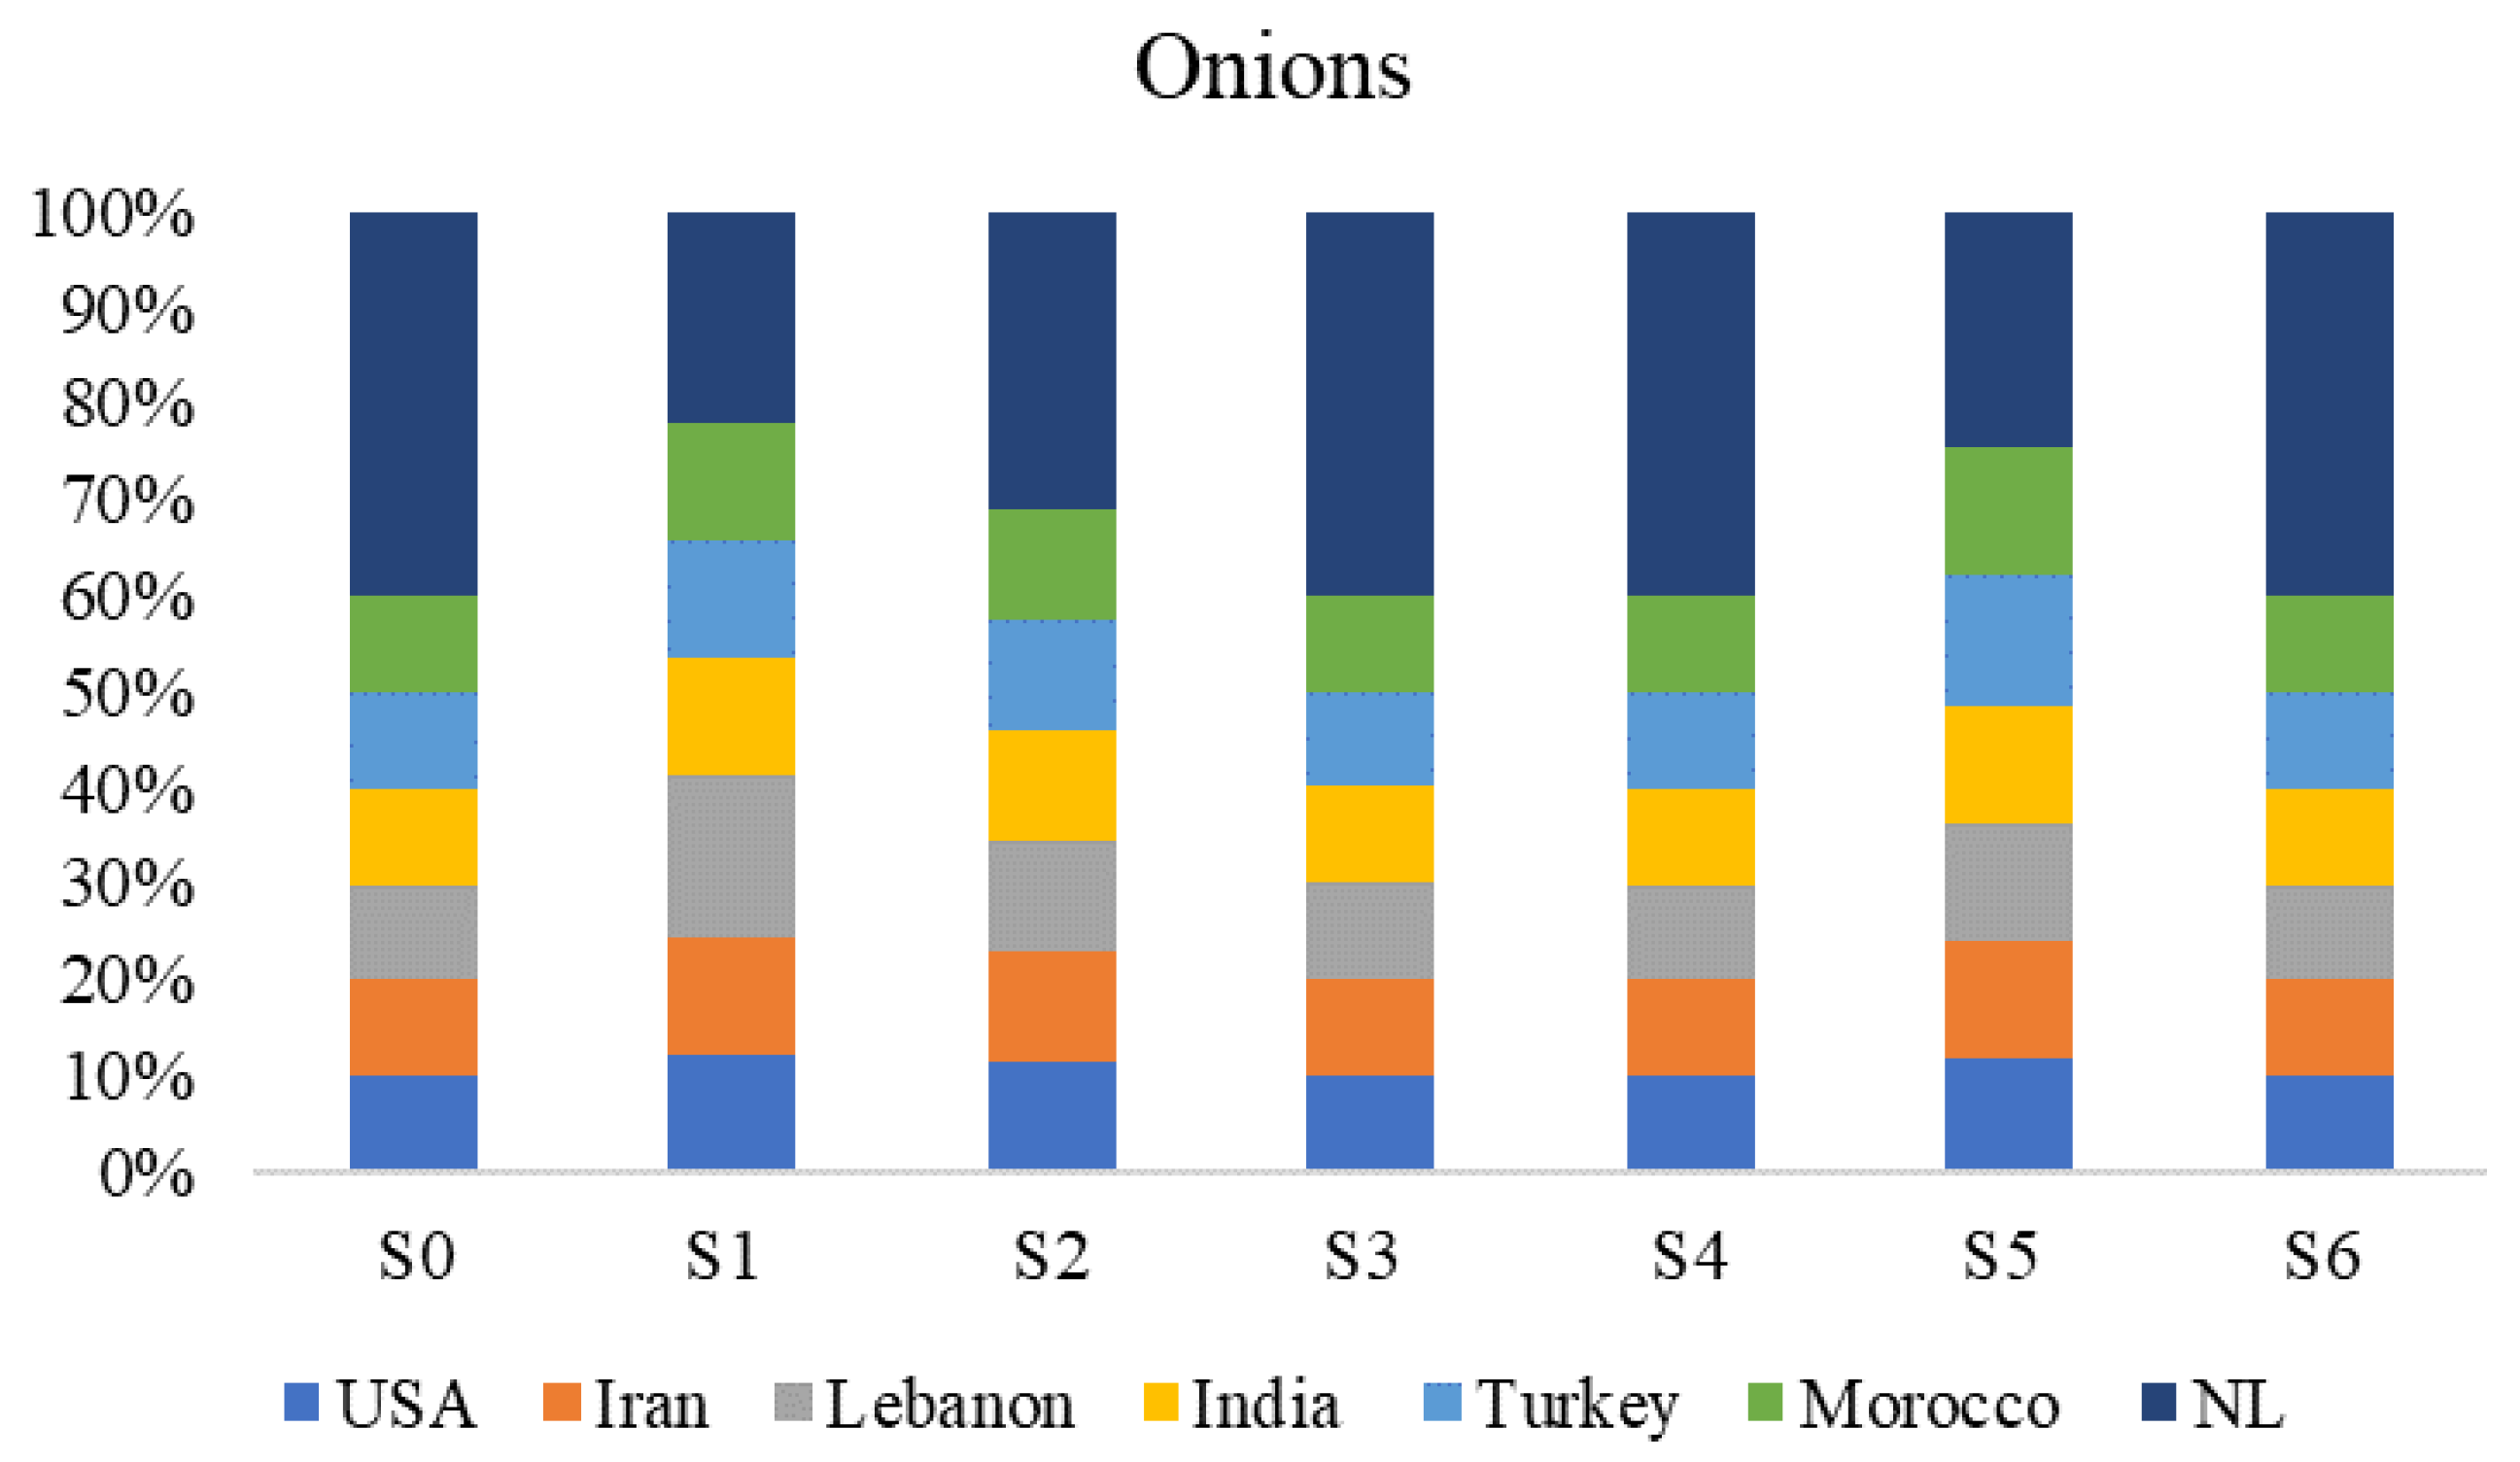
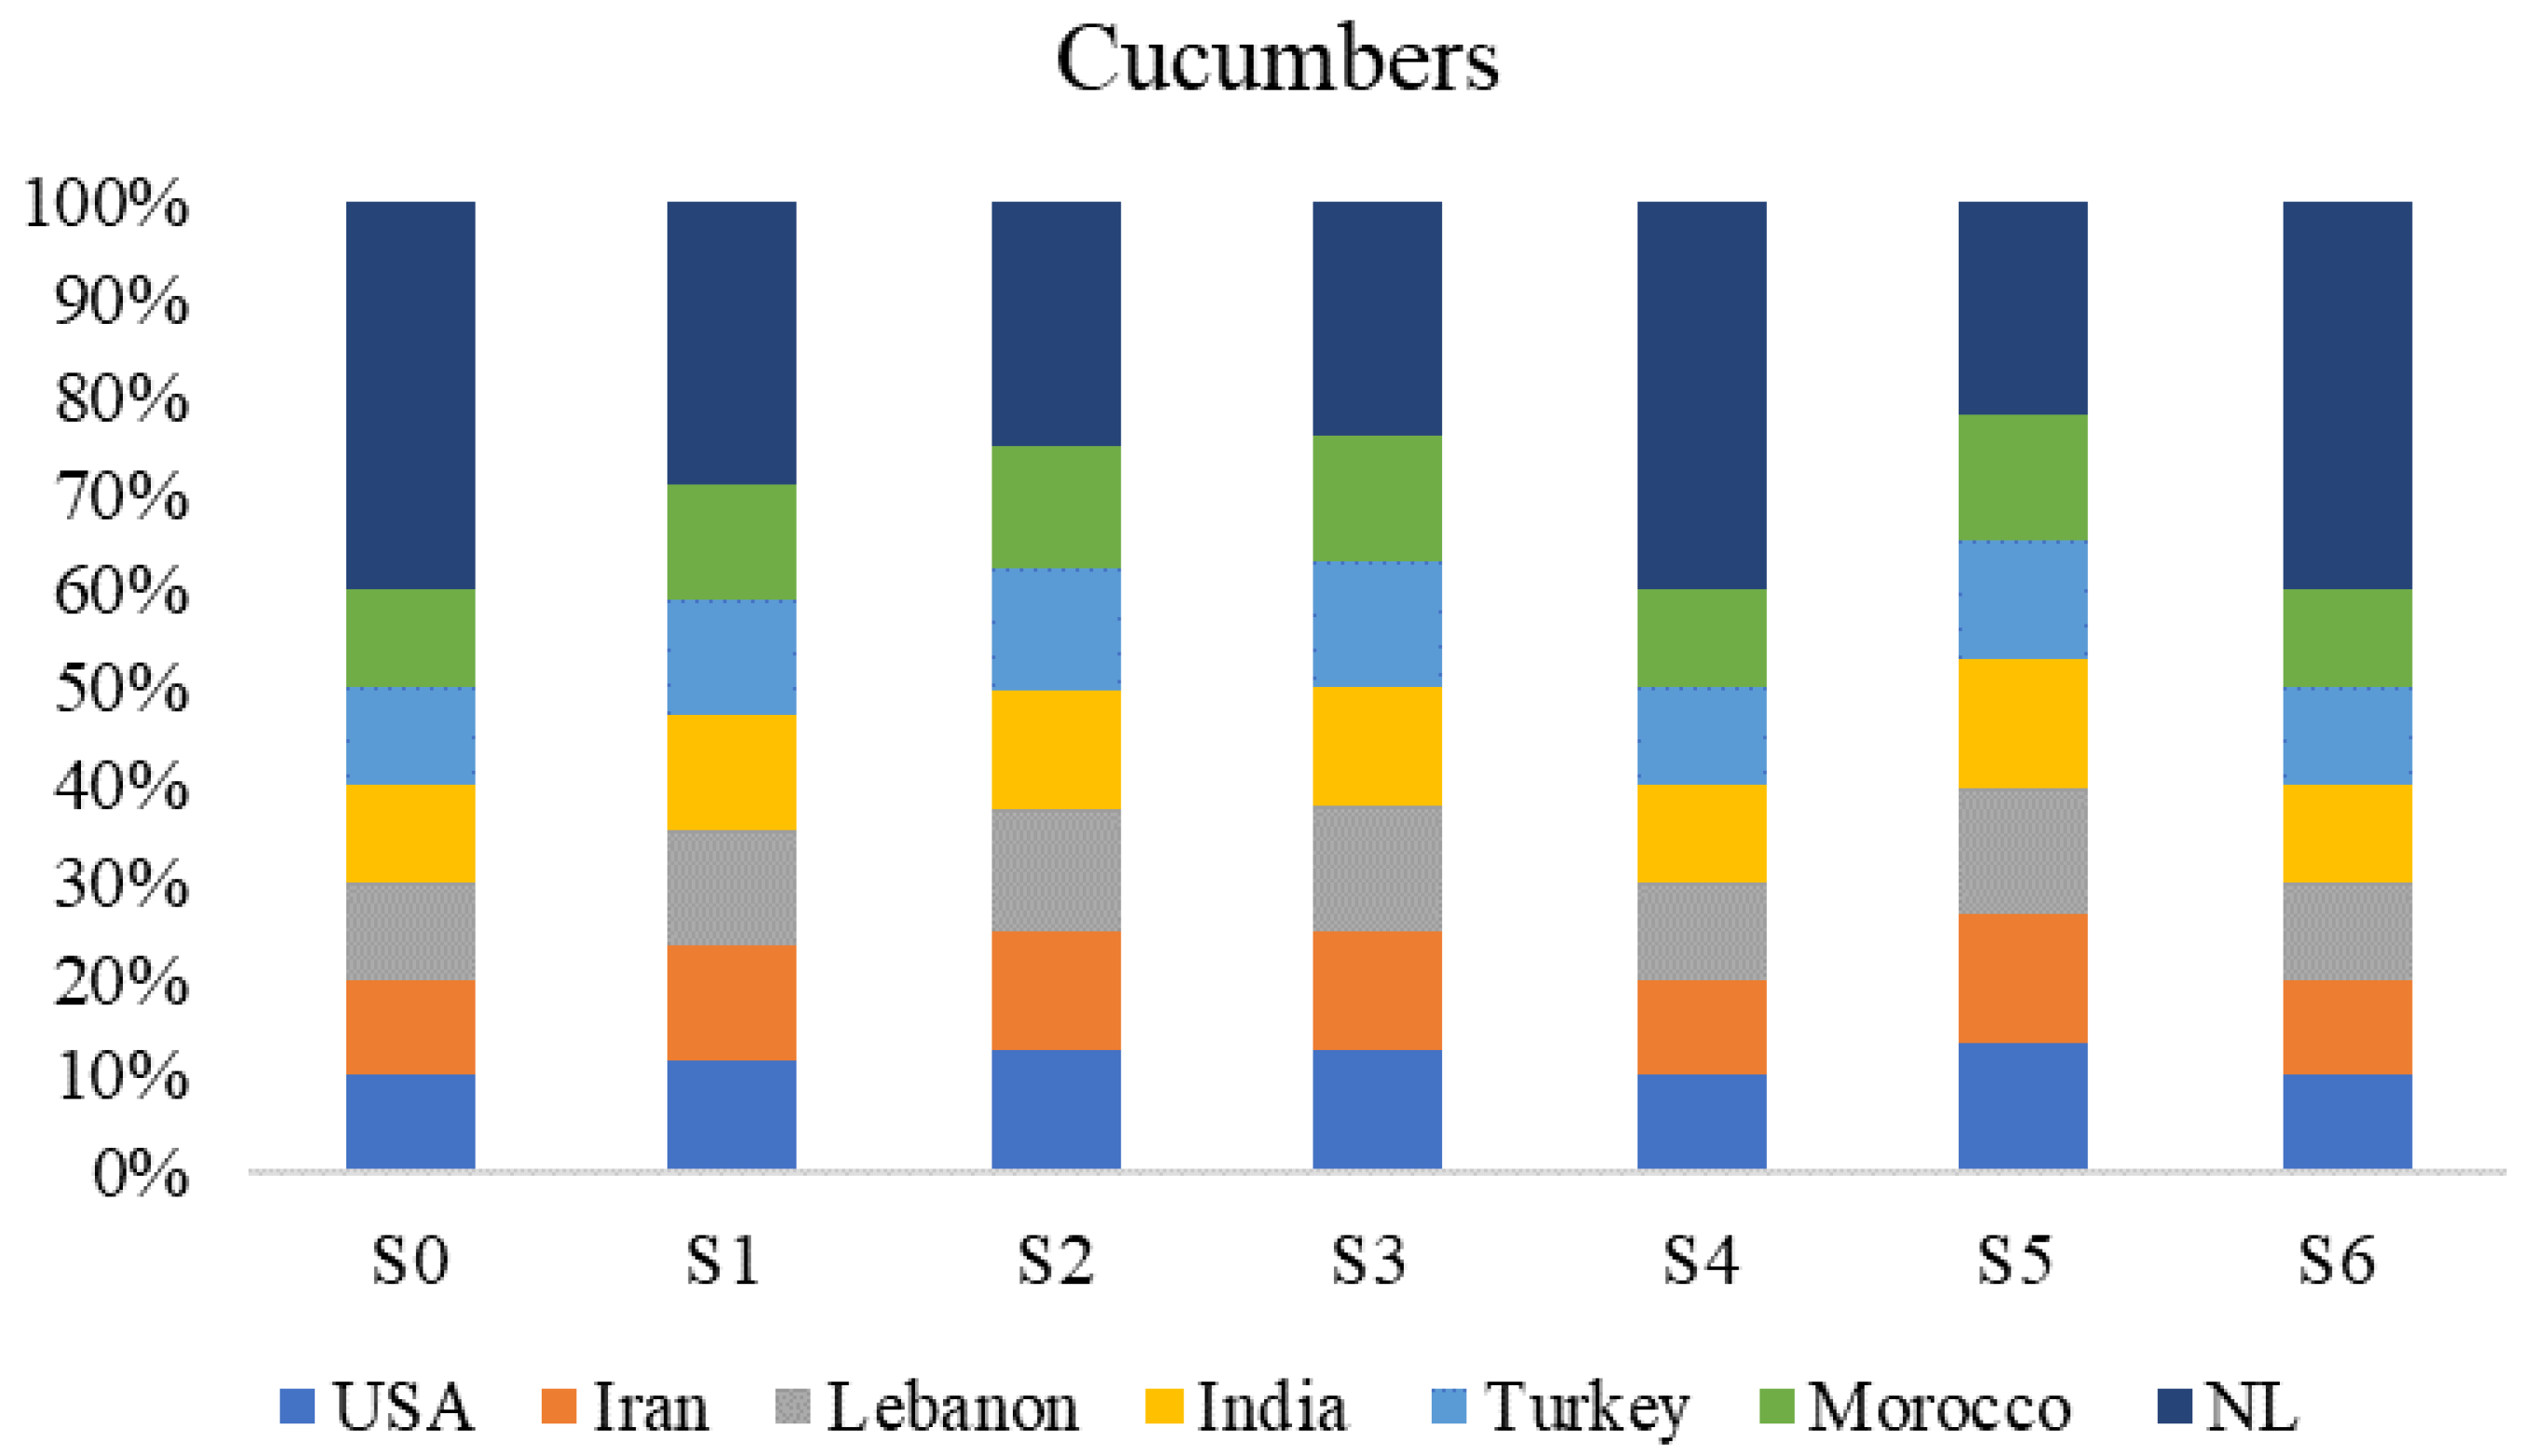
Results of the sensitivity analysis are summarized in Figure 7, Figure 8 and Figure 9 that display the sensitivity of crops’ import distributions to changes in the optimization model’s objective functions. Altering economic, environmental, and risk parameters by 20% shifts the import shares among the USA, Iran, Lebanon, India, Turkey, Morocco, and the Netherlands across six scenarios. These shifts indicate: the import model’s responsiveness to changes in input parameters; help identify which countries’ shares are most sensitive to different objective function adjustments; illustrate the trade-offs and interplay between economic costs, environmental impacts; and risk factors in determining the optimal supplier distribution for tomatoes.
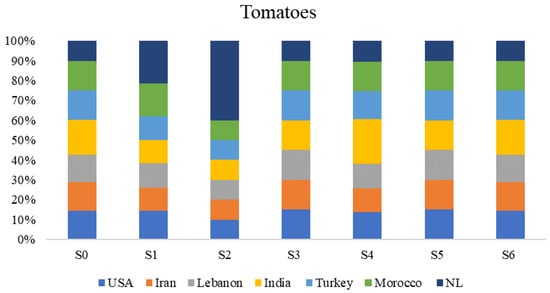
Figure 7.
Sensitivity analysis results for tomato trade network.
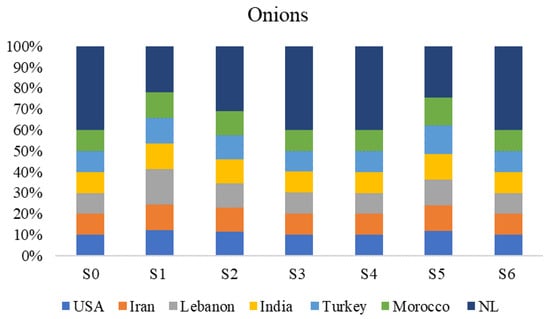
Figure 8.
Sensitivity analysis results for onion trade network.

Figure 9.
Sensitivity analysis results for cucumber trade network.
The sensitivity analysis results indicate that the risk level is the most influential factor, where an increment of up to 20% in a risk indicator may lead to new import solutions that are leaning towards New Zealand, especially when combined with a decrement in the level of other factors, including cost and environmental performance. However, the reduction in overall costs may enhance the chance of new suppliers to be selected with larger shares (i.e., New Zealand, USA). Moreover, the onion supply is more sensitive to changes in costs due to the larger gap in price between different suppliers.
The empirical findings from this study underscore the critical role of assessing climate change risks and diversifying trade partners in formulating robust mitigation plans for the food system. By leveraging the AHP in conjunction with multi-objective optimization models, an effective framework was established for identifying and prioritizing risks associated with climate change. This approach not only reveals the vulnerabilities within the food supply chain, it also guides the strategic selection of trade partners to enhance system resilience. The theoretical foundations of this research extend existing decision-making frameworks by incorporating climate risk assessments within the optimization process. Such integration is pivotal in navigating the complexities of food system sustainability, particularly in light of the increasing randomness of climate-related disruptions. The methodology adopted in this study provides an understanding of how diversified trade partnerships can serve as a buffer against potential supply chain vulnerabilities, thereby ensuring continuous food availability. From a practical perspective, the insights concluded from this analysis hold substantial implications for stakeholders across the food supply chain. Policymakers, for instance, are equipped with evidence-based strategies to promote agricultural diversity and international collaboration as a means to mitigate climate change. Supply chain managers can utilize the findings to enhance operational resilience, adopting diversified sourcing strategies that safeguard against climate-induced supply disruptions. In relation to the existing literature, this study’s emphasis on climate risk assessment and trade partner diversification as part of the food supply chain’s mitigation strategy contributes a novel perspective. While previous research has highlighted the importance of risk management in supply chains, the comprehensive approach of integrating AHP and optimization models to specifically address climate change risks and supply chain diversification marks a significant advancement in the field. Methodologically, the combination of risk assessment through AHP with strategic planning via optimization models facilitated a meticulous examination of climate change impacts on food supply chains. Considering the empirical results with theoretical and practical considerations, this study paves the way towards a more resilient and sustainable food system. It highlights the importance of a multifaceted approach, which combines risk assessment, strategic diversification of trade partners and optimization techniques in safeguarding food availability against the backdrop of global climate change. It also underscores the urgent need for adaptive strategies in agricultural practices and supply chain management. These findings prompt a deeper exploration into the scalability of such models across various regions and crops, factoring in local environmental and socio-economic conditions. Future endeavors could focus on integrating innovative technologies like AI and IoT for dynamic data analysis and predictive modeling, enhancing the precision of risk assessments. Moreover, interdisciplinary research combining insights from climate science, agricultural economics, and supply chain management could offer comprehensive solutions to the challenges posed by climate change on global food systems, paving the way for more resilient and sustainable food security strategies. In addition, future expansion of the work can consist of further exploring the dynamics of trade partner diversification in different agricultural contexts and under various climate scenarios. The development of dynamic models that can adapt to evolving climate data and market conditions would significantly bolster the food system’s resilience and sustainability.
5. Limitations
This study, while providing insightful contributions to the understanding of food security strategies, is subject to several limitations that require future consideration. The AHP used to derive weighting for risk indicators involves are subjective. The judgments made within the AHP are based on the researchers’ interpretations and may not fully capture the perspectives that direct engagement with experts and policymaker could offer. Additionally, the research relies predominantly on gray literature, as accessibility to primary data through expert interviews and surveys is challenging. This reliance may impact the robustness and specificity of the findings, as gray literature can vary in its scrutiny and detail compared to peer-reviewed sources. Furthermore, this study’s approach to risk assessment considered general climate change factors, rather than crop-specific risk factors. This decision was driven by the broader scope of the study’s aim to address food security at a macro level and to develop the underlying methodology. However, this approach may overlook specific vulnerabilities and risks associated with particular crops, which could affect the precision of the risk assessments. Future research could address these limitations by incorporating a more detailed, crop-specific risk analysis and by enhancing the objectivity of the AHP through broader expert engagement.
6. Conclusions
This study presents a contribution to food supply chain management amidst climate change uncertainty. The unique integration of the AHP and multi-objective optimization model resulted in a framework that assesses and mitigates climate change risks from the perspective of food supply chain importers. Such an approach deviates from conventional risk assessment methods, providing a deeper understanding of the intricate relationship between various risk factors and the strategic decisions needed for effective management. It has been demonstrated that the integrated methodology presented in this study improves the resilience and sustainability of food supply chains amidst growing climate uncertainties. Through the systematic evaluation of risk factors via AHP and the application of a multi-objective optimization model for selecting optimal supplier strategies and resource allocation, actionable insights are offered to assist policymakers and stakeholders in the agricultural sector towards more informed decision making. Furthermore, the implementation of this innovative framework uncovered crucial insights into the trade-offs and synergies between economic, environmental, and risk objectives in supply chain management, emphasizing the need for a comprehensive approach to climate risk management that considers both immediate economic implications and long-term sustainability and resilience objectives. The scope for future research can include extending the integrated approach to other sectors impacted by climate change or adapting the model to include new risk factors and adaptation strategies. The incorporation of advancements in data analytics and machine learning is also suggested to improve the model’s predictive capabilities, facilitating dynamic and adaptive supply chain management. In conclusion, this study offers a notable contribution to the discourse on climate risk management within food supply chains, merging theoretical risk assessment with practical, actionable strategies for enhancing resilience. The efficacy of combining AHP with multi-objective optimization provides innovative approaches for sustainable supply chain management in the era of climate.
Author Contributions
Conceptualization, B.H., S.N., M.A., A.E. and T.A.-A.; Methodology, B.H., S.N., M.A. and T.A.-A.; Investigation, B.H., S.N. and M.A.; Data curation, B.H., S.N. and M.A.; Writing—original draft, B.H.; Writing—review & editing, S.N., M.A., A.E. and T.A.-A.; Supervision, T.A.-A. and A.E. All authors have read and agreed to the published version of the manuscript.
Funding
This research was made possible by an award (GSRA7-1-0521-20080) and supported by proposal number MME01-0922-190049 from the Qatar National Research Fund (a member of the Qatar Foundation). The contents herein are solely the responsibility of the authors[s].
Informed Consent Statement
Not applicable.
Data Availability Statement
Data are contained within the article.
Conflicts of Interest
The authors declare no conflict of interest.
Appendix A
Table A1.
Saaty table (modified from [6]).
Table A1.
Saaty table (modified from [6]).
| Pairwise Importance Score | Definition |
|---|---|
| 1 | Equal Importance |
| 3 | Slightly higher importance |
| 3 | Moderate importance |
| 4 | Moderate plus importance |
| 5 | Strong importance |
Table A2.
The list of alternatives/risk factors used for the composite risk quantification along with their sources.
Table A2.
The list of alternatives/risk factors used for the composite risk quantification along with their sources.
| Risk Factor | Description | Gray Literature Sources |
|---|---|---|
| Surface Temperature Change | Yearly variations in surface temperatures across the globe. | [27] |
| Disaster Management Risk | The capability to manage and mitigate disasters effectively. | [28,29] |
| Arable Land | The availability of land suitable for agriculture. | [30] |
| Water Stress | The scarcity of freshwater resources relative to demand. | [31,32] |
| Sea Level Rise | The increase in global average sea level caused by the melting of ice and the expansion of seawater. | [33,34] |
| Agriculture Adaptation Policy | Policies and strategies implemented to adjust agricultural practices to climate change. | [7,35] |
Table A3.
Global Food Security Index scores (modified from [36]).
Table A3.
Global Food Security Index scores (modified from [36]).
| Indicators | USA | Lebanon | India | Iran | Morocco | Turkey | The Netherlands |
|---|---|---|---|---|---|---|---|
| Surface temperature | 89 | NA | 87 | NA | 83 | 82 | 70 |
| Disaster Management Risk | 100 | NA | 96 | NA | 0 | 100 | 100 |
| Arable land (Land deterioration) | 71 | NA | 51 | NA | 70 | 87 | 83 |
| Water Stress | 50 | NA | 25 | NA | 25 | 25 | 50 |
| Sea level | 98 | NA | 98 | NA | 99 | 99 | 44 |
| Agricultural adaptation Policy | 100 | NA | 100 | NA | 100 | 100 | 100 |
References
- Roe, S.; Streck, C.; Obersteiner, M.; Frank, S.; Griscom, B.; Drouet, L.; Fricko, O.; Gusti, M.; Harris, N.; Hasegawa, T. Contribution of the Land Sector to a 1.5 C World. Nat. Clim. Chang. 2019, 9, 817–828. [Google Scholar] [CrossRef]
- Cucagna, M.E.; Goldsmith, P.D. Value Adding in the Agri-Food Value Chain. Int. Food Agribus. Manag. Rev. 2018, 21, 293–316. [Google Scholar]
- Ringsberg, H. Perspectives on Food Traceability: A Systematic Literature Review. Supply Chain Manag. Int. J. 2014, 19, 558–576. [Google Scholar] [CrossRef]
- Vaidya, O.S.; Kumar, S. Analytic Hierarchy Process: An Overview of Applications. Eur. J. Oper. Res. 2006, 169, 1–29. [Google Scholar] [CrossRef]
- Wang, X. Food Supply Chain Safety Risk Evaluation Based on AHP Fuzzy Integrated Evaluation Method. Int. J. Secur. Its Appl. 2016, 10, 233–244. [Google Scholar]
- Saaty, T.L. What Is the Analytic Hierarchy Process? Springer: Berlin/Heidelberg, Germany, 1988; ISBN 3-642-83557-0. [Google Scholar]
- European Environment Agency. Adaptation of Agriculture to Climate Change. Available online: https://www.eea.europa.eu/publications/cc-adaptation-agriculture (accessed on 25 December 2023).
- Lautenbach, S.; Seppelt, R.; Liebscher, J.; Dormann, C.F. Spatial and Temporal Trends of Global Pollination Benefit. PLoS ONE 2012, 7, e35954. [Google Scholar] [CrossRef] [PubMed]
- Demirel, N.Ç.; Yücenur, G.N.; Demirel, T.; Muşdal, H. Risk-Based Evaluation of Turkish Agricultural Strategies Using Fuzzy AHP and Fuzzy ANP. Hum. Ecol. Risk Assess. Int. J. 2012, 18, 685–702. [Google Scholar] [CrossRef]
- Beinat, E.; Nijkamp, P. Multicriteria Analysis for Land-Use Management; Springer Science & Business Media: Berlin/Heidelberg, Germany, 1998; Volume 9, ISBN 0-7923-5198-3. [Google Scholar]
- Tscheikner-Gratl, F.; Egger, P.; Rauch, W.; Kleidorfer, M. Comparison of Multi-Criteria Decision Support Methods for Integrated Rehabilitation Prioritization. Water 2017, 9, 68. [Google Scholar] [CrossRef]
- Haji, M.; Govindan, R.; Al-Ansari, T. Novel Approaches for Geospatial Risk Analytics in the Energy–Water–Food Nexus Using an EWF Nexus Node. Comput. Chem. Eng. 2020, 140, 106936. [Google Scholar] [CrossRef]
- Thanki, S.; Govindan, K.; Thakkar, J. An Investigation on Lean-Green Implementation Practices in Indian SMEs Using Analytical Hierarchy Process (AHP) Approach. J. Clean. Prod. 2016, 135, 284–298. [Google Scholar] [CrossRef]
- Leal, J.E. AHP-Express: A Simplified Version of the Analytical Hierarchy Process Method. MethodsX 2020, 7, 100748. [Google Scholar] [CrossRef] [PubMed]
- Saaty, T. The Analytic Hierarchy Process (AHP) for Decision Making; 1980; Volume 1, p. 69.
- Trienekens, J.H.; Wognum, P.; Beulens, A.J.; van der Vorst, J.G. Transparency in Complex Dynamic Food Supply Chains. Adv. Eng. Inform. 2012, 26, 55–65. [Google Scholar] [CrossRef]
- Agrawal, A.; Bakshi, B.R.; Kodamana, H.; Ramteke, M. Multi-Objective Optimization of Food-Energy-Water Nexus via Crops Land Allocation. Comput. Chem. Eng. 2024, 183, 108610. [Google Scholar] [CrossRef]
- Jian, J.; Guo, Y.; Jiang, L.; An, Y.; Su, J. A Multi-Objective Optimization Model for Green Supply Chain Considering Environmental Benefits. Sustainability 2019, 11, 5911. [Google Scholar] [CrossRef]
- Lin, D.; Zhang, Z.; Wang, J.; Yang, L.; Shi, Y.; Soar, J. Optimizing Urban Distribution Routes for Perishable Foods Considering Carbon Emission Reduction. Sustainability 2019, 11, 4387. [Google Scholar] [CrossRef]
- Abejón, R.; Batlle-Bayer, L.; Laso, J.; Bala, A.; Vazquez-Rowe, I.; Larrea-Gallegos, G.; Margallo, M.; Cristobal, J.; Puig, R.; Fullana-i-Palmer, P. Multi-Objective Optimization of Nutritional, Environmental and Economic Aspects of Diets Applied to the Spanish Context. Foods 2020, 9, 1677. [Google Scholar] [CrossRef] [PubMed]
- Belamkar, P.; Biswas, S.; Baidya, A.; Majumder, P.; Bera, U.K. Multi-Objective Optimization of Agro-Food Supply Chain Networking Problem Integrating Economic Viability and Environmental Sustainability through Type-2 Fuzzy-Based Decision Making. J. Clean. Prod. 2023, 421, 138294. [Google Scholar] [CrossRef]
- Hassna, B.; Namany, S.; Alherbawi, M.; Elomri, A.; Al-Ansari, T. Decision Making Approaches to Improve Resilience in Food Supply Chains and Enhance Food Security Against Climate Change Risks. In Computer Aided Chemical Engineering; Elsevier: Amsterdam, The Netherlands, 2023; Volume 52, pp. 89–94. ISBN 1570-7946. [Google Scholar]
- Mabhaudhi, T.; Nhamo, L.; Mpandeli, S.; Nhemachena, C.; Senzanje, A.; Sobratee, N.; Chivenge, P.P.; Slotow, R.; Naidoo, D.; Liphadzi, S.; et al. The water–energy–food nexus as a tool to transform rural livelihoods and well-being in Southern Africa. Int. J. Environ. Res. Public Health 2019, 16, 2970. [Google Scholar] [CrossRef] [PubMed]
- Namany, S.; Govindan, R.; Di Martino, M.; Pistikopoulos, E.N.; Linke, P.; Avraamidou, S.; Al-Ansari, T. Developing intelligence in food security: An agent-based modelling approach of Qatar’s food system interactions under socio-economic and environmental considerations. Sustain. Prod. Consum. 2022, 32, 669–689. [Google Scholar] [CrossRef]
- Planning and Statistics Authority (PSA). Qatar Agricultural Statistics. 2020. [Google Scholar]
- Pathare, P.B.; Dairi, M.A.; Al-Mahdouri, A. Effect of storage conditions on postharvest quality of tomatoes: A case study at market-level. J. Agric. Mar. Sci. 2021, 26, 13–20. [Google Scholar]
- International Monetary Fund. Climate Change Indicators: Surface Temperature. Available online: https://climatedata.imf.org/datasets/4063314923d74187be9596f10d034914_0/explore (accessed on 20 December 2023).
- The World Bank. DataBank. Available online: https://data.worldbank.org (accessed on 20 December 2023).
- Bündnis Entwicklung Hilft and Institute for International Law of Peace and Armed Conflict (IFHV). World Risk Report 2023. 2023. Available online: https://weltrisikobericht.de/wp-content/uploads/2023/10/WRR_2023_english_online161023.pdf (accessed on 20 December 2023).
- The World Bank. Urban Land Area (sq. km). Available online: https://data.worldbank.org/indicator/AG.LND.TOTL.UR.K2 (accessed on 20 December 2023).
- United Nations Economic Commission for Europe (UNECE). SDG Indicator Framework. Available online: https://w3.unece.org/SDG/en/Indicator?id=140 (accessed on 20 December 2023).
- Resource Watch. Water Stress Country Ranking. Available online: https://resourcewatch.org/data/explore/wat036rw1-Water-Stress-Country-Ranking (accessed on 20 December 2023).
- European Environment Agency. Sea Level Rise. Available online: https://www.eea.europa.eu/data-and-maps/indicators/sea-level-rise-6/assessment (accessed on 20 December 2023).
- The World Bank. World Sea Level Rise Dataset. Available online: https://datacatalog.worldbank.org/search/dataset/0041449/World-Sea-Level-Rise-Dataset (accessed on 20 December 2023).
- University of Notre Dame Global Adaptation Initiative (ND-GAIN). ND-GAIN Country Index. Available online: https://gain.nd.edu/our-work/country-index/ (accessed on 20 December 2023).
- The Economist. Global Food Security Index 2022. The Economist. 2022. Available online: https://impact.economist.com/sustainability/project/food-security-index/ (accessed on 25 December 2023).

Disclaimer/Publisher’s Note: The statements, opinions and data contained in all publications are solely those of the individual author(s) and contributor(s) and not of MDPI and/or the editor(s). MDPI and/or the editor(s) disclaim responsibility for any injury to people or property resulting from any ideas, methods, instructions or products referred to in the content. |
© 2024 by the authors. Licensee MDPI, Basel, Switzerland. This article is an open access article distributed under the terms and conditions of the Creative Commons Attribution (CC BY) license (https://creativecommons.org/licenses/by/4.0/).