Article

Understanding the Impact of Seismic Hazard and Climate Conditions on Multi Criteria–Based Retrofitting of Existing Buildings

1
University School for Advanced Studies IUSS, Palazzo del Broletto, Piazza della Vittoria n.15, 27100 Pavia, Italy
2
RESISK s.r.l., Piazza della Vittoria n.15, 27100 Pavia, Italy
3
CERIS, Instituto Superior Técnico, Universidade de Lisboa, 1049-001 Lisbon, Portugal
4
CONSTRUCT, Faculty of Engineering, University of Porto, 4200-465 Porto, Portugal
*
Author to whom correspondence should be addressed.
Sustainability 2024, 16(10), 4318; https://doi.org/10.3390/su16104318
Submission received: 9 April 2024 / Revised: 9 May 2024 / Accepted: 14 May 2024 / Published: 20 May 2024

Abstract

:
A large share of the reinforced concrete (RC) building stock in Mediterranean countries faces a dual challenge of seismic vulnerability and energy inefficiency, calling for urgent renovation efforts. While energy upgrades have been the focus of previous renovation policies, recent research highlights the critical need for integrated retrofitting solutions that address both structural integrity and energy performance. Multi-criteria decision-making (MCDM) approaches are a promising tool for optimizing the combined choice of these integrated interventions, considering various decision variables (DVs) of economic, social, environmental, and technical nature. To understand the impact of climate and seismic hazard conditions on multi-criteria-based retrofitting assessment, a case-study RC school building is selected and assumed to be located in three distinct climate conditions, cold, mild, and warm, and three seismic hazard levels, low, medium and high. Moreover, given the complexity and challenges of quantifying seismic performance metrics for practitioners, an available simplified (practice-oriented) approach is compared herein with a more thorough research-based one for quantifying the seismic performance of RC buildings within the MCDM framework. Both approaches are applied to the case-study building, considering twelve possible combinations of energy and seismic interventions. The accuracy of the practice-oriented approach and its impact on the retrofitting rankings is evaluated, emphasizing the importance of accessible and efficient evaluation methods in facilitating informed decision-making for building renovation.

1. Introduction

Most of the reinforced concrete (RC) buildings of the Mediterranean countries’ stock presents a dual challenge in terms of seismic vulnerability and energy inefficiency, underlying an urgent need for renovation. These buildings have been constructed following outdated guidelines without modern seismic design considerations, rendering them susceptible to earthquake damage. Simultaneously, their energy performance is typically highly unsatisfactory. In fact, 75% of the European building stock is energy inefficient, being responsible for 40% and 36% of EU energy consumption and total CO2 emissions, respectively [1]. Even though Italy is on track to reach the emissions reductions and energy efficiency targets set by its National Energy and Climate Plan (NECP) for 2030 [2], substantial additional efforts need to be made to reach the much more ambitious new targets for 2030 stemming from the European Union’s (EU) Fit-for-55 (FF55) package, which aims to reduce its net greenhouse gas emissions by at least 55% by 2030. Consequently, the renovation of the building sector, in terms of reducing its seismic vulnerability and increasing its energy efficiency, is highly necessary to promote well-being and economic growth and to ensure that the EU energy and climate targets are met [3,4]. Specific concerns in the Italian context include more than 55% of the RC residential buildings were constructed without seismic provisions and 88% of the Italian masonry and RC buildings do not comply with modern energy performance requirements [5]. According to Gkatzogias and Tsionis (2022) [4], when combining different indicators (seismic, energy, and socio-economic vulnerability), Italy is considered a high-priority country for building renovation.
Until recently, renovation efforts and policies were mainly directed to energy upgrades to buildings alone, without considering their structural performance, because of the immediately evident benefits from the reduced energy costs for heating/cooling. However, if the structural integrity of the retrofitted building is not guaranteed, that same investment could be completely lost in the case of seismic events. Similarly, seismic retrofitting interventions alone could compromise thermal comfort if a building’s energy efficiency is not considered. The growing need for renovation of a significant portion of EU buildings has prompted recent advancements in scientific and technical fields, which suggest that adopting an integrated approach to building renovation could lead to improved cost-effectiveness [6]. From a more global perspective, the performance upgrade process is highly influenced by the seismic hazard and vulnerability, energy performance, and socio-economic characteristics of the region where the buildings are located, as recently highlighted by Mucedero and Monteiro [7]. Such a study established a regional prioritization framework for seismic and energy efficiency performance upgrades to residential buildings in Italy, revealing that critical regions for seismic retrofitting are primarily in central-southern Italy, while those for energy upgrading are mainly in northern Italy. Although contemporary understanding recognizes that seismic retrofitting cannot be decoupled from energy renovation, the previous two scenarios highlight the need to address this combined retrofitting in a holistic way to achieve optimal results.
To address both seismic and energy performance concerns, recent research studies have aimed to minimize economic losses and environmental impacts while promoting building renovation. Most of these studies make use of optimization methodologies to identify the ideal solution when a range of several options is available. Multi-criteria decision-making (MCDM) approaches have demonstrated advantages in optimizing combined interventions [8,9,10,11,12]. The MCDM approach for selecting the optimal coupled retrofit intervention can become extremely helpful to decision-makers and practitioners because it encompasses multiple criteria when making decisions about retrofitting options. By considering different decision variables (DVs) chosen to capture the essential aspects of the decision problem (e.g., economic costs, social benefits, and technical feasibility), decision-makers can make more informed and balanced decisions.
This study evaluates the influence of climate and hazard levels on the preferential ranking of the retrofit alternatives. To do so, an RC school building is selected as a case study, given the high seismic vulnerability of school buildings in Italy demonstrated by past earthquakes [13], and twelve possible combinations of energy and seismic interventions are identified. Subsequently, the building is assumed to be located in nine different sites characterised by varying levels of seismic hazard and climate conditions. Following an energy and seismic performance assessment, the optimal combined retrofitting intervention is evaluated following a previously validated MCDM framework [11] for each location considered, resulting in nine distinct rankings.
The detailed analysis methods used to evaluate the seismic performance of different retrofitting alternatives are very computationally expensive and time-consuming; thus, they are unfeasible to implement by practitioners or general decision-makers. With such limitations in mind, this study also evaluates the implementation of a simplified approach to quantify some of the DVs required to select optimal retrofitting strategies for existing buildings. Specifically, the DVs annual probability of failure (APF) and expected annual losses (EAL) are estimated using the cloud-based capacity spectrum method (CB-CSM) and the Italian seismic risk classification procedure (Sismabonus), respectively. The goodness of the simplified approach is further gauged by comparing the MCDM rankings of combined retrofitting alternatives obtained from using both simplified and refined approaches.

2. Methodology

The MCDM framework, as employed by Clemett et al. (2023) [11] and in subsequent studies [14,15,16], is adopted herein to identify the optimal combination of seismic and energy retrofitting solutions for a building when several combination options are feasible. The overall methodology, which is concluded with the MCDM step, corresponds to a structured process for assessing, designing, and selecting retrofit solutions for buildings exhibiting both seismic and energy deficiencies. This methodology comprises five main steps: assessment, design, performance, decision, and selection, which are illustrated in Figure 1.
Initially, an assessment is conducted to identify the building deficiencies using research-based tools for seismic performance assessment and commercial energy simulation tools for energy assessment. Thereafter, the design phase involves proposing seismic and energy retrofit solutions based on the identified issues. A performance evaluation is then carried out using the same tools used in the assessment phase to quantify the effectiveness of each retrofitting option. The decision-making stage considers various DVs, including seismic and energy performance, environmental and social aspects (e.g., architectural impact and duration of works), and technical aspects (such as specialized labour or foundation interventions). The DVs chosen to assess the performance of the retrofitted building are provided in Table 1. Finally, the MCDM process [11] is employed in the selection phase to choose the optimal retrofit alternative and to rank all the selected alternatives. Weight factors are associated with each DV, and their values are highly influenced by the preference of the decision-maker. They are used to quantify the importance of each criterion in the decision-making process, playing a crucial role in determining the relative importance or priority of different criteria or decision variables within the MCDM framework. As a result, weight factors exert a substantial influence on the ranking of the alternatives [17]. The weight factors selected in this study are based on the work of Clemett et al. [11] and shown in Table 1; more emphasis is placed on the installation cost and duration of works of the retrofit intervention, as well as the seismic performance (in terms of APF and EAL) and the energy performance of the building.
In this approach, the highest computational burden is mostly associated with the quantification of some of the DVs (obtained from the results of steps 1 and 3 in Figure 1). Such DVs are the annual probability of failure (APF), considered—C4—the expected annual losses (EAL) and expected annual environmental impact (EAEI)—C2 and C3, respectively. Detailed seismic assessment is usually conducted using incremental dynamic analysis (IDA) or multiple-stripe analysis (MSA) to obtain the fragility parameters and, subsequently, the APF. In turn, within a lower-refinement level of analysis, more likely to be used in the engineering practice field, nonlinear static analysis-based procedures, such as the SPO2IDA tool [18], the SPO2FRAG tool [19] or the incremental N2 method [20] can be considered to perform collapse fragility estimation. On the other hand, comprehensive performance-based loss estimation (component-based approach—PEER-PBEE methodology [21]) or simplified tools (e.g., Storey Loss Functions [22,23], the DEAL approach [24]) are usually implemented to obtain the expected annual loss (EAL) and the expected annual environmental impact (EAEI).
This study adopts a simplified approach to estimate the aforementioned computationally onerous DVs. In particular, the APF is quantified through the results of the cloud-based capacity spectrum method (CB-CSM) [25], while, for the loss assessment, the simplified procedure outlined in the Italian guidelines for seismic risk classification of constructions (Sismabonus) [26] is chosen, replacing the cumbersome component-based approach implemented in the PACT 3.1.2 software [27]. In the following sections, a brief description of the detailed and simplified approaches employed in this study is provided.

2.1. Detailed Approach

The detailed approach for the estimation of the DVs C2, C3, and C4 follows a comprehensive performance-based seismic assessment and loss analysis through the PEER-PBEE methodology. The procedure initiates with the characterisation of the seismic hazard at the selected site, followed by a selection of suitable hazard-consistent ground motion sets. Then, nonlinear time history analysis is conducted on the structure under analysis, using the previous set of selected ground motions, through multiple-stripe analysis (MSA), which allows the quantification of the structural response. Through the MSA results, collapse fragility parameters are derived. Expected damage and losses are quantified considering structural and non-structural components; thus, it is necessary to develop an inventory of damageable components in the building, together with the definition of their potential damage states, expected repair cost, and environmental impact consequences. Finally, the detailed seismic loss assessment is performed through PACT [21]. The ultimate outcomes needed for the MCDM framework are the EAL, the EAEI, and the APF.

2.2. Simplified Approach

The simplified counterpart makes use of two readily available tools to estimate the AFP and EAL, namely the cloud-based capacity spectrum method (CB-CSM) and Sismabonus, respectively. The CB-CSM is a combination of two well-established methods, the capacity spectrum method (CSM) [28] and the cloud-based (CB) procedure [29], to estimate the collapse fragility parameters of a given structure. The method starts with the identification of the performance point (PP) of the structure with the CSM. Since multiple PPs can be obtained, several recommendations on how to overcome this problem and select the most suitable PP are available in [25]. In this study, in case of multiple PPs, the adopted PP was the one for which the absolute difference between the geometric average of spectral displacements over an appropriate range of periods (AvgSdk) and each obtained PP (|AvgSdk − ΔPP|) is minimum. This procedure leads to a cloud of Engineering Demand Parameter (EDP) vs. Intensity Measure (IM) points for each analysed Single Degree of Freedom (SDoF) system. The EDP is the target displacement corresponding to the PP calculated via CSM, and the adopted IM is the geometric mean of the spectral accelerations (AvgSa) computed in the interval [0.2Tel–1.5Tel], with Tel being the elastic period of the structural system, as recommended in [25]. Based on the criteria selected to define the collapse limit state, the cloud data are divided into non-collapse (NoC) and collapse (C) points and the collapse fragility parameters are calculated through the total probability theorem.
Sismabonus is a relatively recent procedure implemented in Italy to evaluate the seismic risk of buildings and use it to classify them [26]. This guideline provides a simple method for practitioners to assess the building’s initial seismic condition and estimate its expected yearly seismic losses. This estimation can also help in evaluating the effectiveness of different retrofitting strategies in improving the building’s seismic performance, hence guiding the choice of the retrofitting strategy. Notably, the Sismabonus approach requires only nonlinear static analysis, making it a more practical and quicker method to evaluate seismic annual losses when compared to approaches like the PEER-PBEE [21]. Furthermore, when compared to other available simplified procedures for estimating the EAL of a building, Sismabonus holds additional advantages as it is already in use within the Italian engineering practice, even if recent findings show its loss estimates to be more conservative when compared to the ones obtained with more refined methodologies [30,31]. This method requires the computation of two performance indices: the Building Safety Index (SI-LS) and Expected Economic Annual Losses (EAL). The SI-LS is calculated by determining the capacity peak ground acceleration (PGAC) and demand peak ground acceleration (PGAD) associated with the Life Safety limit statelife (LSLS). Concurrently, the EAL is estimated by considering the building’s performance for various return periods (Tr) and repair costs expressed as a fraction of the Reconstruction Cost (%RC). The resulting loss curve, which defines the seismic risk, is represented by a point (1/Tr, %RC) for each limit state, whereas the area underneath is the EAL. The overall risk class of the building is defined as the worst between SI-LS and EAL classes. This method integrates structural and economic considerations, providing a comprehensive framework for seismic risk assessment. More details on the procedure can be found in the work by Cosenza et al. [26].

3. Application to a Case-Study Building

The selected case-study school building is a reinforced concrete (RC) moment resisting frame (MRF) with unreinforced masonry (URM) infills, located in Isola del Gran Sasso d’Italia (Abruzzo, Italy) and built between the 1960s and 1970s [32]. The building has two aboveground storeys with roughly 630 m2 each and inter-story heights of 3.75 and 4.25 m on the first and second floors. Additionally, there is a small partial basement at the east end. The structural system consists of two-way RC MRFs in the longitudinal and transverse directions, along with URM infills and partitions. More details on the school building, including architectural plans and elevations, together with the material properties of structural members, can be found in Prota et al. [32]. The masonry infills were assumed to have the same geometry and material properties as the medium-strong masonry infill typology in the macro-level classification as proposed in [33]. The numerical model of the building, comprising flexural elements (for beams and columns), beam–column joints (BCJs), a staircase, and masonry infills, was developed in OpenSees [34], and a three-dimensional representation of the model is presented in Figure 2. The beam and column elements were modelled using the force-based beam–column element with a Modified Radau plastic hinge integration scheme [35]. Although the shear behaviour of RC elements was considered elastic, a post-processing analysis was carried out to determine any possible shear failure, similar to the approach adopted by Mucedero et al. [36]. To capture the nonlinear behaviour of beam–column joints, a scissor model was implemented, characterised by a zero-length spring coupled with a rotational hinge defined according to the backbone curve proposed by O’Reilly [37]. Further details on the numerical modelling of the structure can be found in [11,38].
For the purposes of this study, i.e., understanding the influence of seismic hazard level and climate conditions on the combined retrofitting, the building is assumed to be located in nine different sites in Italy. There are three sets of different hazard levels, namely high (H), medium (M), and low (L), paired with three sites characterised by different climatic conditions, namely cold (C), moderate (M), and warm (W). Choosing real locations in Italy was intended to ensure the results of this study closely reflect actual conditions. However, this decision may introduce uncertainty when assessing and comparing the results due to variations in seismic hazard curves and the corresponding selection of records.
The specific features of each site are summarized in Table 2 with the indication of the peak ground acceleration (PGA) for the life safety limit state (SLV), defined according to the Italian code (NTC-2018) [39] and the heating degree days (HDD) for each location. The latter is a measure used to estimate the heating energy demand, calculated by summing the number of degrees that the outdoor temperature falls below a certain base temperature on each day over a specified period. It is used to estimate heating energy requirements such as consumption patterns, performance, and costs. The climate and seismic maps of Italy with the indication of the selected locations is illustrated in Figure 3. Figure 4 provides the acceleration response spectrum and the hazard curve for each selected site. Even though the PGA of each location within the same seismic hazard level group is very similar, as anticipated, the corresponding hazard curves show some differences.

3.1. Preliminary Seismic Assessment

A preliminary seismic assessment of the structure was conducted through a nonlinear static procedure, using an inverted triangular load pattern and a control node located at the centre of mass on the top floor, as established in the Italian seismic code [39]. The target displacements of the structure for the collapse limit state (SLC) using the N2 method [40] were estimated and compared with the performance point displacements at which the structure attains its capacity for the SLC limit state, considered to be reached as soon as one of the following performance criteria is met:
  • The shear force demand exceeds the shear capacity of one or more of the beam or column elements;
  • The chord rotation of one or more of the plastic hinges in the beam, column, or wall elements exceeds the collapse limit state deformation limits;
  • The shear deformation in one or more of the beam–column joints (BCJs) exceeds 0.02 rad.
The first two performance criteria are the ones prescribed by the Italian seismic code [39] for the seismic assessment of columns and beams. The last criterion, regarding the assessment of the BCJs, was adopted following experimental evidence [41], given that the one foreseen by the Italian code is very conservative. The pushover curves of the as-built structures, together with the performance points (SLCC) and target displacements (SLCD) of the structure for each site, are presented in Figure 5. These curves are expressed in the base shear coefficient, given by the ratio between the total base shear and the total mass of the structure.
Both directions present pushover curves with similar initial stiffness but different degradation due to the larger number of openings on the masonry infills in the longitudinal direction of the building. For both directions, the main structural weaknesses at the collapse limit state were identified as the shear failure of columns that were not designed to withstand seismic actions. Given the different demands of each set of sites, different target displacements are obtained; for the LH sites, the safety performance of the structure in its as-built condition is achieved in the X direction and almost achieved in the Y direction.
According to the Italian guidelines for the seismic risk classification of constructions [42], the safety index of the structure (SI-LS), defined as the ratio between the capacity peak ground acceleration (PGAC) and the demand peak ground acceleration (PGAD), was calculated and is summarised in Table 3. PGAC was assumed to be the one that caused the collapse of the building, and it is calculated by scaling the code-based response spectrum to intersect the pushover curve on its capacity point for the life safety limit state (SLV). The capacity point is considered to be the one corresponding to the first element collapse within the building in terms of (i) the shear force demand exceeding the shear capacity of one or more of the beam or column elements, (ii) the chord rotation of one or more of the plastic hinges in the beam, column, or wall elements exceeds the life safety limit state deformation limits. PGAD is defined as the PGA of the code-based response spectrum for the location of interest.
The obtained SI-LS values reveal, as anticipated, variations in demand across the different sites, with direction Y emerging as the most critical. Considering the satisfactory performance of the as-built structure for the low-hazard sites, retrofitting was deemed unnecessary; hence, different retrofitting schemes were solely considered for sites with moderate and high hazard levels, as addressed in the next sections.

3.2. Seismic Retrofit Interventions

Given the structural deficiencies identified in the preliminary seismic assessment of the building, four different seismic retrofit measures (SRMs) were considered:
-
S1: local strengthening with carbon FRP (CFRP);
-
S2: global strengthening with concentric steel braces;
-
S3: CFRP strengthening combined with concentric steel braces;
-
S4: CFRP strengthening combined with viscous dampers.
Additionally, for all SRMs, a seismic gap between the URM infills and the RC frame was introduced, reducing the column-infill interaction and, thus, the shear forces acting on the columns. The design of the SRMs, conducted following the Italian building code (NTC) [39], was carried out to address the weaknesses and improve the performance of the as-built structure as much as possible, with the acknowledgment that the achieved performance was not always that required for new code-conforming buildings due to practical and cost considerations [43].
The seismic response of retrofitted structures is significantly influenced by the location and number of retrofit elements. In the case of S1, an iterative procedure was implemented wherein CFRP was initially applied to non-compliant elements, followed by successive assessments until all structural elements met safety standards. In S2, the strategic placement of braces was prioritized to minimise storey drifts. S3 modelling incorporated the methodologies of both S1 and S2. Additionally, for S4, the procedure from S1 was adopted while integrating viscous dampers at various locations within the school building. Further details on the design specifications for each retrofit alternative are available in [38].
Considering the varying seismic hazard levels across each site, the extent of retrofitting interventions implemented for the case-study building was adjusted accordingly. Due to the poor performance of the building under high seismic hazard conditions, each intervention was designed to provide the optimal contribution to the structure, meaning that it was not strictly designed for the same seismic demand. Consequently, it did not strictly achieve the same threshold in terms of capacity between the several alternatives. Table 4 provides a summary of the details and quantities of the retrofit components for each retrofit alternative.

3.3. Energy Retrofit Interventions

Subsequently, with a view to improving energy performance, three different energy retrofit measures (ERMs) were considered:
-
E1: roof insulation and installation of efficient LEDs and thermostatic valves on radiators;
-
E2: intervention E1 coupled with external wall insulation with expanded polystyrene (EPS) panels;
-
E3: intervention E2 coupled with installation of efficient windows, floor insulation, condensing boiler, lighting control system, and photovoltaic panels.
Each energy retrofitting intervention aims to simultaneously reduce heat losses to the external environment and enhance the energy efficiency of systems within the building. The level of intervention increases from E1 to E3, according to the Italian Ministerial Decree [44], which also corresponds to a higher degree of invasiveness.
Finally, the four seismic interventions were coupled with each energy intervention, leading to twelve possible combined retrofit alternatives. Each coupled intervention is designated by SiEi, where Si and Ei correspond, respectively, to the considered seismic and energy retrofit schemes. More information on the design procedures and assumptions can be found in previous studies [11,45,46]. Table 5 summarizes the intervention cost in EUR/m2 and the duration of work in days corresponding to DVs C1 and C5, respectively. The intervention cost corresponds to the combined cost of the seismic and energy retrofit schemes for each alternative, considering efficiencies that can be gained simultaneously by implementing both retrofitting schemes. The total cost of installation of each retrofit alternative includes, in addition to the cost of the retrofit material, the removal of internal linings, partial demolition of the existing structure/infills, removal of debris, installation of the retrofit scheme, and restoration of infills and lining. More details on the energy retrofit costs can be found in [11].

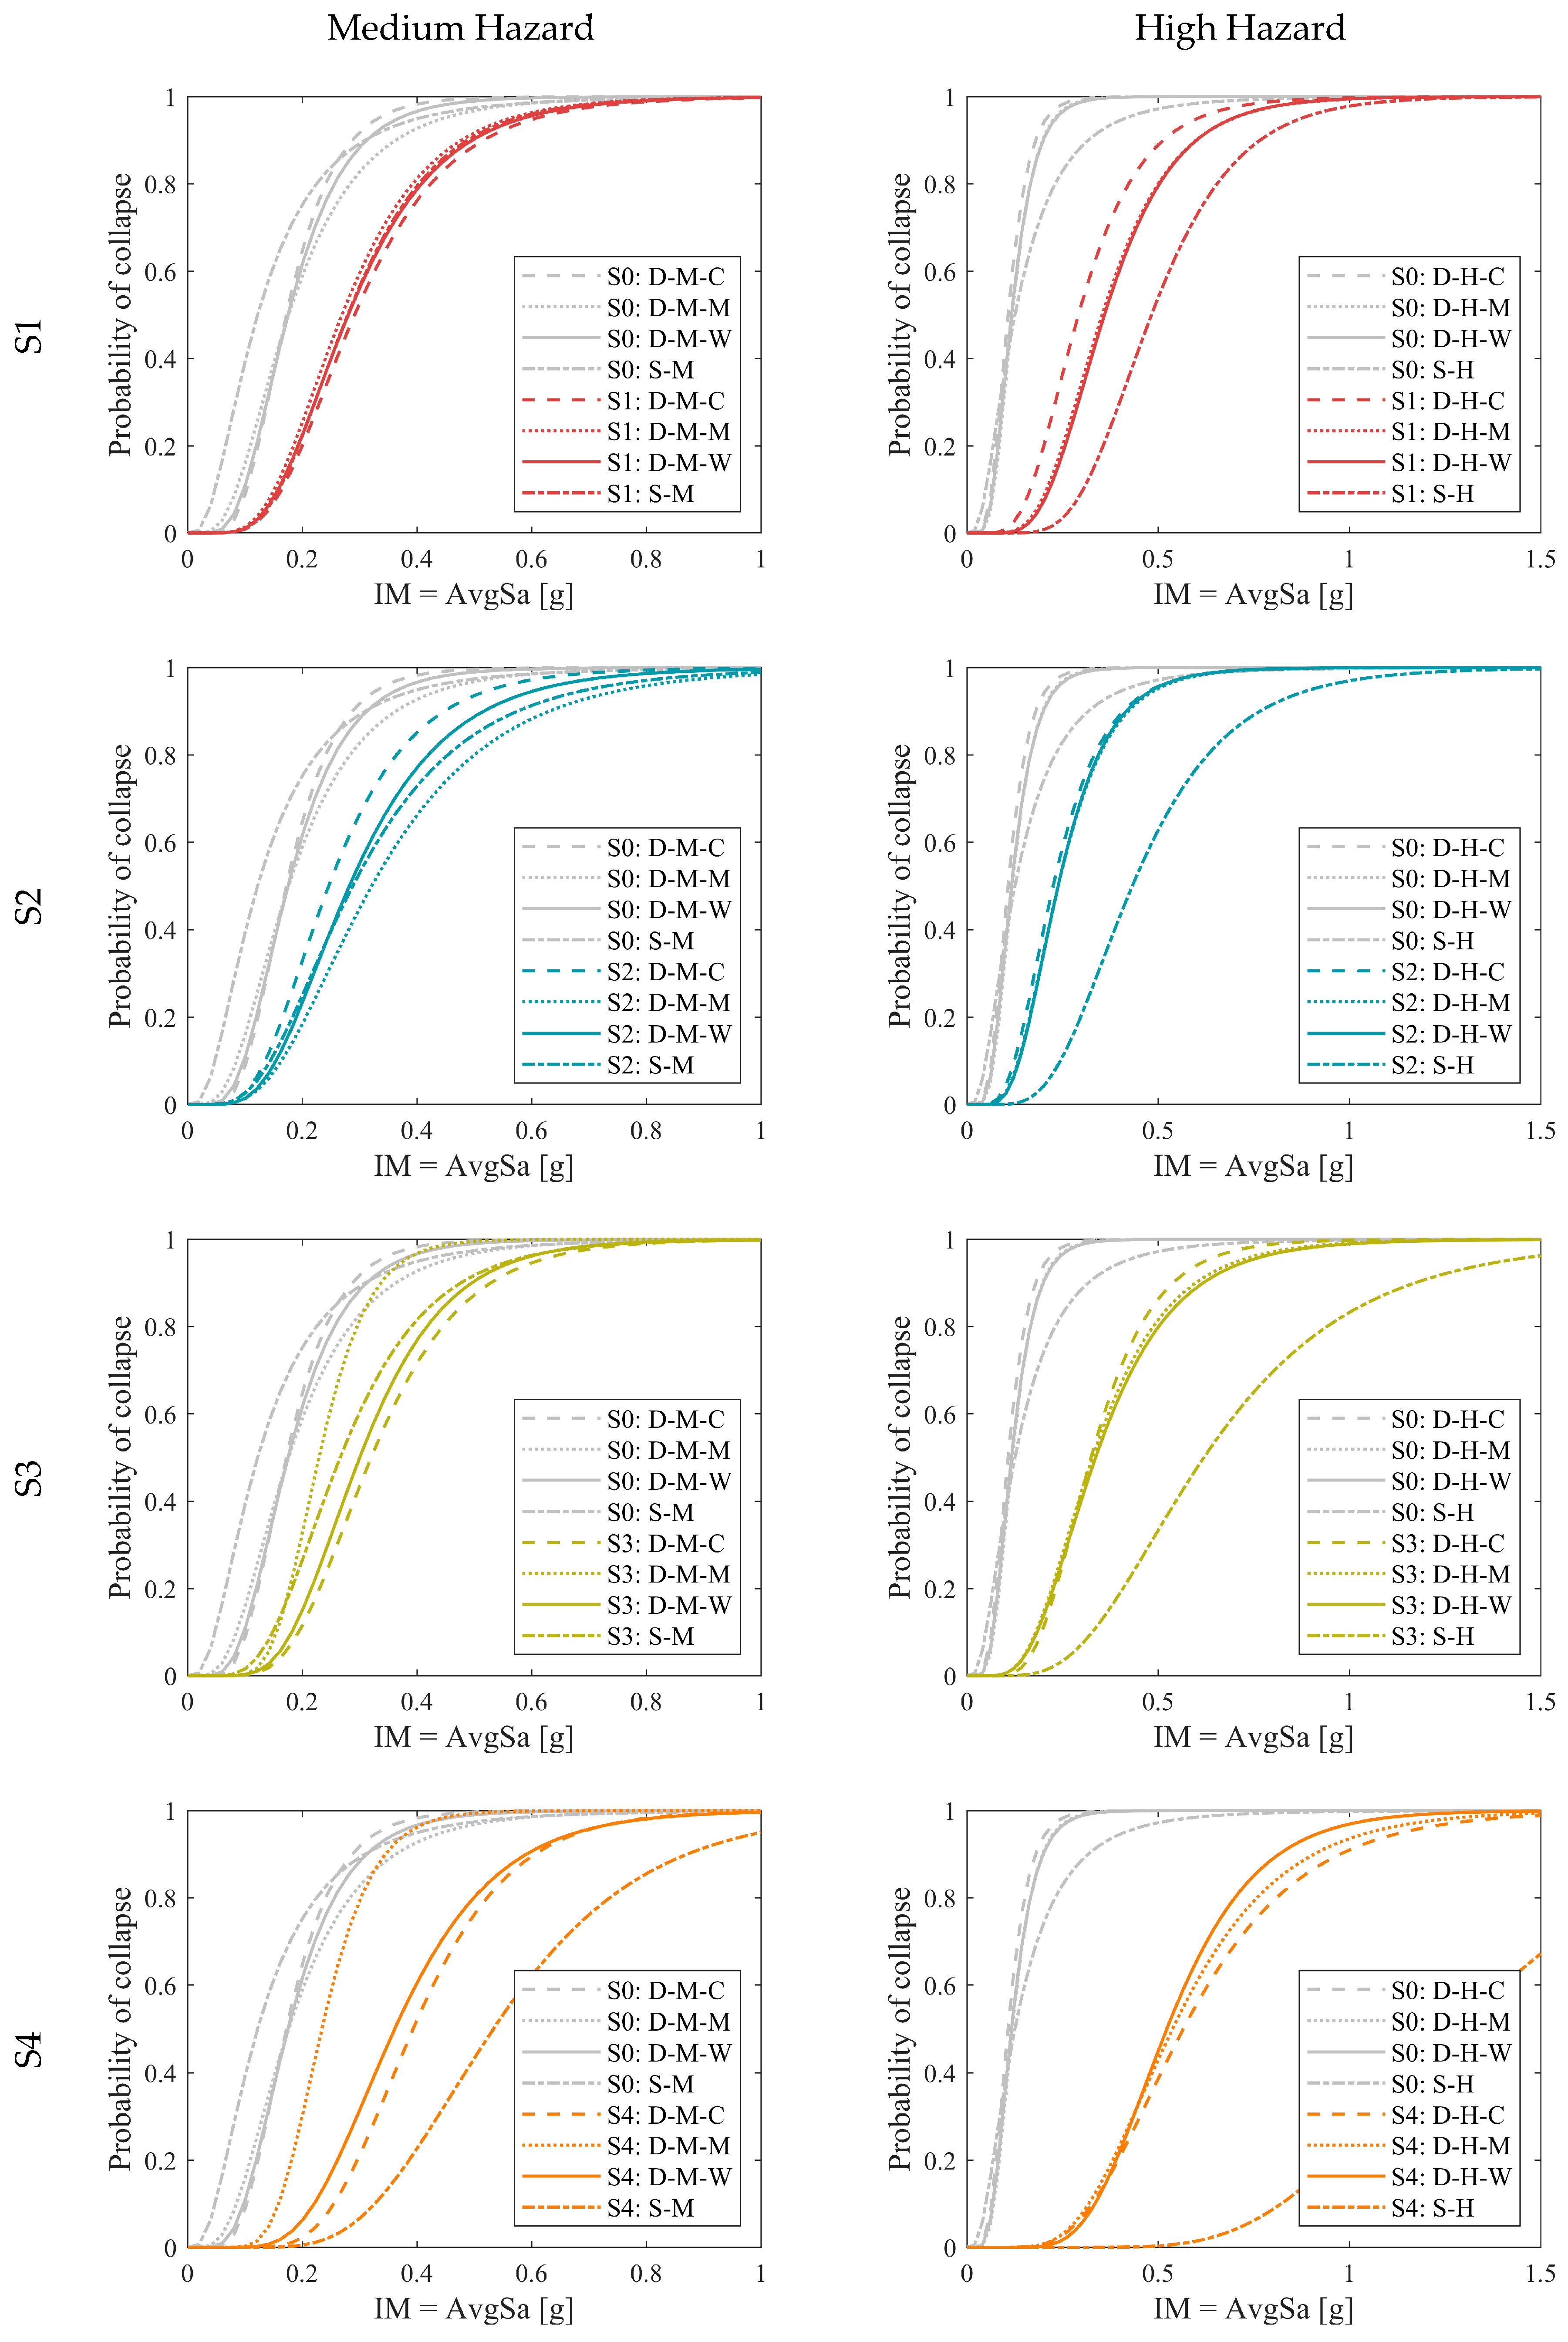
3.4. Post-Intervention Seismic Assessment

The post-intervention assessment followed the same strategy outlined for the as-built structure (S0). Nonlinear static analyses were performed for each retrofitted model, and the displacement demand and capacity (according to NTC [39]) were computed using the N2 method [40]. The results for the retrofitting scenarios are illustrated in Figure 6.
At first glance, it can be observed that the pushover curves for the same type of retrofit intervention between the different levels of hazard are very similar. This can be justified by the similarity of each retrofit intervention between the different sites, both in terms of their layout within the building structure and specific structural elements being retrofitted. When compared with the as-built scenario, all retrofitted models exhibit a decrease in the initial stiffness and lateral strength due to the seismic gap introduced between the infills and the surrounding frame. Moreover, all the retrofit interventions lead to an improvement in the structural performance of the building at the collapse limit state. Given the different design levels of the retrofitting interventions (dictated by the different seismic hazard levels), the displacement for which the structure, with the same type of intervention, reaches its capacity is distinct. Nevertheless, for most of the cases, the type of structural failure—usually a brittle failure on a column or beam as mentioned previously—that dictates the capacity performance is similar.
Table 6 summarizes the SI-LS values obtained for the retrofitted models in each hazard site. Considering the most critical direction, the effectiveness ranking of the retrofit measures is S4 > S1 > S3 > S2 and S1 > S4 > S3 > S2 for the medium- and high-hazard sites at the LSLS. Comparing the results of Table 3 with Table 6, an overall improvement is observed in the performance of the retrofitted structures with respect to the as-built structure.
After conducting the initial seismic assessment of the structure in its retrofit conditions, the estimation of all the DVs outlined in Section 2 can be carried out following the suggestions provided in [11]. The ones for which the use of simplified procedures is proposed (C2, C3, and C4) are fully described in the subsequent subsections.

3.4.1. Annual Probability of Failure

The estimation of APF was assessed through different approaches, as mentioned in Section 2. To apply the detailed methodology, firstly, the characterisation of the seismic hazard at the selected site for the case-study building was carried out through probabilistic seismic hazard analysis (PSHA) using OpenQuake [47]. Then, a selection of 20 pairs of suitable hazard-consistent ground motion records was carried out for each site. The selected IM (AvgSA) is defined as the geometric mean of the pseudo-spectral acceleration in a structure-specific range of periods depending on the first-mode periods of the case studies. Table 7 summarizes some dynamic elastic properties of the analysed models, such as the fundamental period in both directions (first mode in bold), the participation mass of the first mode of vibration (M1*), the geometric mean (TGM), and the period range used in this study (0.2TGM–1.5TGM). MSAs were conducted, and a set of selected EDPs—absolute Peak Floor Acceleration (PFA), Peak Story Drift (PSD), and Peak Floor Velocity (PFV)—were recorded and later used as input to perform the comprehensive performance-based loss assessment (PEER-PBEE methodology). Additionally, the MSA outcomes were also used to determine the collapse fragility parameters.
Following the simplified methodology, a set of 200 ground motions covering a wide range of magnitudes were selected from the NGA-West2 ground motion database [48] and converted into the ADRS format to apply the CSM [28] outlined in Section 2.2. The intersection of the capacity curve of the SDoF system of each model with the response spectrum of the selected ground motions results in a cloud of PPs for each retrofitted model. The cloud PPs were filtered into non-collapse (NoC) and collapse (C) data by comparing the obtained PPs with the displacements at which the collapse of the structure is assumed to occur (consistently assumed as those considered for the preliminary assessment and MSA). Lastly, the regression parameters to establish the conditional probability of exceedance were estimated based on the modified cloud analysis procedure outlined in Jalayer et al. (2017) [29]. A slight modification of the CB-CSM procedure was needed to assess the structural performance of S4 to account for the supplemental damping introduced by the viscous dampers. A supplemental damping ratio of 25%, in addition to the initial 5% damping, was considered in the time history analyses and within the CSM procedure as suggested in [38].
The collapse fragility curves computed through both approaches and accounting for the epistemic uncertainties [36,49,50] for the medium- and high-hazard sites are displayed in Figure 7.
Considering the medium hazard sites, the differences in the median collapse intensities obtained through the detailed approach are likely justified by the different hazard curves observed in Figure 4b. In contrast, the median collapse intensities for the high-hazard sites are very similar. Comparing the simplified with the detailed approach, a closer approximation of the median intensity values is achieved for the medium hazard, with a difference of about ±15% (excluding S0 and S4). This difference increases up to ±80% when considering the high-hazard results. For the S4 alternative, the simplified approach results in extremely conservative results (an average difference of around 43% and 136% for the medium- and high-hazard sites).
Subsequently, the APF values were obtained, integrating the collapse fragility curve with the hazard curve of each site. Figure 8 plots the APF values as a function of the employed methodology (simplified (S) and detailed (D)) for both seismic hazard levels—medium (Figure 8a) and high (Figure 8b).
In terms of retrofitting approaches, for medium hazard, solution S4 has the better seismic performance, followed by S1, S2, and S3, with identical performance. For the high hazard, solutions S2 and S4 have the worst and better seismic performance, whereas the performance of S1 and S3 oscillates between the second and third positions.
For the medium-hazard sites, overall, both approaches lead to very similar APF results, except for solution S4, for which the simplified APF estimates result lower than the detailed ones. On the other hand, for high hazard, regardless of the retrofitting option, the APF results can be considered in two groups, depending on the adopted approach. A general underestimation of the simplified APF values is observed with respect to the detailed ones. Among other possible reasons, it can be related to the fact that the adopted CSM procedure is the one from ATC-40 [28], which has been shown to underestimate the displacement demand [51,52], resulting in a lower number of collapses. Still, the differences are never high enough to change the corresponding ranking (when solely based on the APF values) of the different retrofit alternatives.

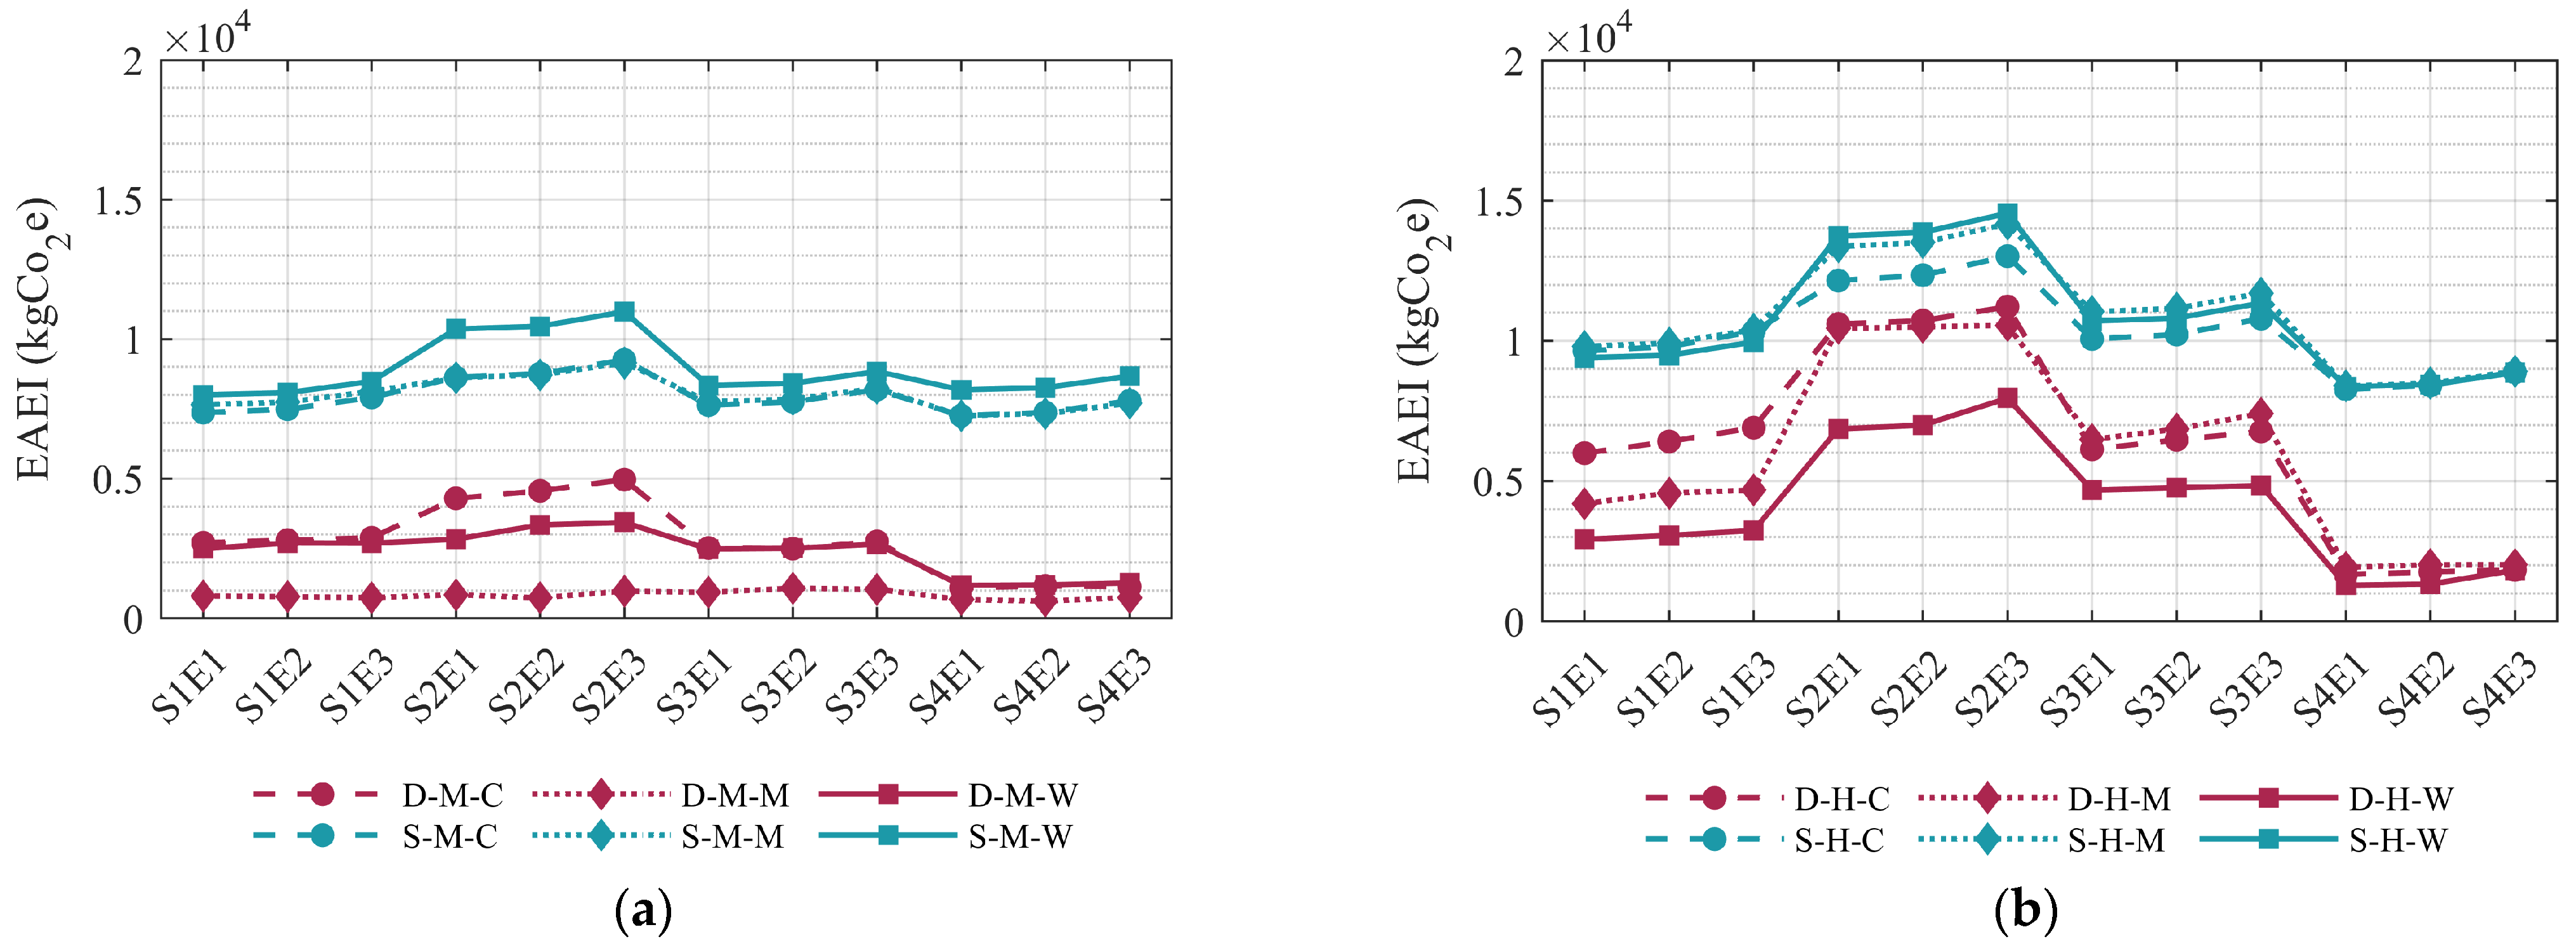
3.4.2. Expected Annual Losses (EAL) and Expected Annual Environmental Impacts (EAEI)

On the detailed approach side, the PEER-PBEE methodology [53] was employed to estimate the EAL and EAEI of each retrofitted model. By handling the EDP results obtained in the MSA and by adopting an inventory of damageable components in the building, their potential damage states, and expected repair cost and EI consequences, a detailed loss assessment was carried out in PACT (FEMA P-58). The presence of the ERMs was accounted for at this stage in terms of additional repair consequences to specific non-structural components due to their significant influence on the loss assessment. Regarding the simplified approach, the procedure outlined in Section 2.2 was carried out to obtain the seismic risk classification of each retrofitted structure using Sismabonus [26]. The SI-LS index, defined as the ratio between the capacity peak ground acceleration (PGAC) and the demand peak ground acceleration (PGAD) and used previously to compare the seismic performance of the retrofitted structures, is summarised in Table 3 and Table 6 for the X and Y directions of the as-built and retrofitted configurations, respectively. The SI-LS index and corresponding risk classification for the critical direction of the as-built and each retrofitted model are summarised in Table 8. The expected annual environmental impacts (EAEI) are obtained employing the detailed methodology within the loss assessment procedure through PACT. As such, when using the simplified procedure (Sismabonus), which does not enable the direct quantification of the EAEI, the results from the detailed methodology were used to fit a linear regression model between EAL and EAEI. The regression is then used to estimate, in a simplified manner, the EAEI straight from EAL [54].
The EALs of each retrofitted model, obtained through the detailed and simplified methodologies for both seismic hazard levels, are summarised in Figure 9. For all sites considered, the simplified methodology leads to greater values of EAL, when compared with those of the detailed methodology. This overestimation can be attributed to the simplifications foreseen by the procedure to make it more accessible to engineers, such as the fixed percentage of repair costs for each damage state, regardless of the building typology and their structural response [23,55]. For the high-hazard sites (H), S2 presents the highest EAL, followed by S3, S1, and, finally, S4, regardless of the approach employed and site considered. For the medium-hazard sites, the EAL values from the detailed approach exhibit the same order of magnitude (S2 > S3 > S1 > S4), while the results obtained with the simplified approach exhibit different orders of magnitude as a function of the site. The EAEI values, presented in Figure 10, are proportional to the EAL values.

3.5. Post-Intervention Energy Assessment

The energy performance of the as-built and energy-retrofitted buildings was assessed with EDILCLIMA [56]. The information regarding the energy modelling and all the assumptions made are detailed in [11]. The energy performance was assessed through different parameters, including the primary energy performance (PEC), equivalent CO2 emissions (Eq. CO2), annual energy costs (AEC), and Italian energy class rating. The results obtained for the as-built and energy-retrofitted buildings are summarized in Table 9. As anticipated, all retrofit schemes resulted in improvements to the energy performance of the structure. Among them, E3 demonstrated the highest performance, followed by E2 and E1 in a progressively incremental manner. This observation underlines the challenge of identifying the optimal energy intervention level solely through direct comparison of these variables, highlighting the necessity for additional criteria in the evaluation process. Indeed, the first level of retrofit (E1) results in a 28% reduction in the annual PEC, while E2 and E3 retrofit schemes exhibit reductions of about 50% and 80%, respectively. Similar trends are observed for Eq. CO2 and AEC.

4. Discussion

4.1. Decision Variable Assemblance

In this section, all the DVs for each combined retrofitted scheme and each site are quantified. The methods that were used to quantify the DVs, together with the assumptions made and the weight vectors assumed, are detailed in [11].
The installation cost (C1) and duration of works (C5) of the combined retrofit alternatives are summarized in Table 5. The expected annual cost (C2) encompasses the EAL, the AEC, and the maintenance cost of the retrofit components. The EAL and the AEC were determined from the seismic and energy performance analyses carried out in the previous sections. The cost of the structural maintenance over the lifetime of the structure (75 years) was obtained considering the interventions outlined by Caterino et al. [9] and scaling them based on the quantity of materials used. The expected LCEI (C3) includes the installation EI of the retrofit alternative, the EAEI of the retrofitted structure, and the total maintenance EI of the alternative over the expected service life. The EIs associated with the installation and maintenance of the retrofit alternatives were estimated using the EEIOLCA procedure (described in [46]), while the EAEI values were obtained from the loss assessment (Section 3.4.2). The values of the annual probability of failure (C4) were determined in Section 3.4.1. The remaining DVs—architectural impact (C6), need for specialized labour/design knowledge (C7), and required interventions at the foundations (C8)—were set according to [11].
The DVs directly linked to the seismic performance of the structure, namely C2, C3, and C4, are the only DVs whose quantifications depend on the employed methodology. The final values for such DVs are detailed in Table 10 and Table 11 for the medium- and high-hazard sites, respectively. The remaining DVs (C1, C6, C7, and C8), which are independent of the employed approach, are outlined in Table 12.

4.2. Ranking of the Retrofit Alternatives

The DVs quantified in the previous sections were then used as input for the MCDM framework. The position of each alternative in the ranking is given by the relative closeness, which is a measure used to assess the proximity of each alternative to an ideal solution or reference point and is often expressed as a value between 0 and 1. A relative closeness value of 1 indicates that the alternative is the most desirable or closest to the ideal solution, while a value closer to 0 suggests lower desirability or greater distance from the ideal solution. This measure allows decision-makers to quantitatively evaluate and rank different alternatives, facilitating the selection of the most favourable option based on the specified criteria and their respective importance weights. According to the number of retrofit alternatives investigated herein, those occupying positions 1 and 12 are regarded as the most and least preferred options, respectively. The preferential rankings obtained for each approach and hazard level are presented in Table 13.
It is firstly seen that the classification ranking of the retrofit alternatives changes with the seismic hazard level. For the high-hazard sites, a clear trend is observed; the rankings of the alternatives tend to be grouped by the structural retrofit scheme option, with S4 being the most preferred option, followed by S3, S2, and, lastly, S1. This trend indicates that the seismic retrofit scheme has a more significant effect on the overall ranking of an alternative than the energy retrofit scheme, as was also highlighted in [11]. Nevertheless, inside each structural retrofit group, the energy retrofitting tends to be ranked according to the energy needs of the site, i.e., the preferential position shifts as a function of the climate conditions, favouring E3 under cold climate and E1 under warm climate. In contrast, for medium seismic hazard sites, the ranking is equally affected by both types of retrofit interventions. S3 and S4 are generally preferred as the structural retrofit, except for the moderate climate site. In fact, due to similar performance values of APF, EAL, and EAEI, the MCDM framework struggles to discern distinct benefits among alternatives.
Comparing the results obtained through both detailed and simplified approaches, for the medium-hazard sites, the simplified one aligns rankings based on the structural retrofit scheme, with S4 being the favoured option, followed by S2, S3, and S1. Overall, the main difference between the detailed and simplified approaches is the ranking positions of alternatives S2 and S3, which is in line with the trends highlighted by the collapse assessment results. Considering the high-hazard sites, even though the exact DV values estimated by the different approaches can be relatively different, at times, the final ranking of the different retrofit alternatives is practically the same, with only a few exceptions observed. For both detailed and simplified approaches, regardless of the hazard level, alternative S1 is consistently ranked as the least preferred alternative, mainly due to its high installation costs, which are two to six times higher than the other alternatives. This happens because S1 requires many CFRP bars to control the structural drifts, which are costly and labour-intensive to install.
Since the ranking is controlled by the relative closeness value obtained for each retrofit alternative, the way it changes with the level of detail of the adopted approach and the hazard level is also investigated. This can also enable more comprehensive conclusions on the reliability of the simplified methodology, regardless of some slight changes noted in the classification rankings of the retrofit alternatives. Accordingly, Figure 11 shows the relative closeness values of each alternative. In these subplots, the retrofitting alternatives along the X-axis are sorted according to the detailed approach ranking.
Regarding the medium-hazard sites, a general mismatch between the different approaches is observed, regardless of climate conditions. A closer scrutinization of these results shows a suitable alignment between the alternatives with S1 and S4 as structural retrofits for the cold and warm climate sites, as previously pointed out. Considering the high-hazard sites, all the alternatives demonstrate a strong alignment across all sites, with a slight variation in the relative closeness values between the detailed and simplified approaches being observed for S4 in moderate and warm climates. However, this discrepancy does not impact the overall classification.
According to the MCDM framework, the solution ranked first is considered the optimal solution. However, given the closely similar relative closeness values among certain alternatives, a group of most preferable alternatives may be identified instead of solely focusing on the top-ranked solution. To do so, the 25th and 75th percentiles of the relative closeness values were quantified for both detailed and simplified approaches, as shown in Figure 11. In this way, three groups of alternatives are obtained, allowing one to identify the less (below the 25th percentile), relatively (between the 25th and 75th percentile), and most (above the 75th percentile) preferable alternatives.
Table 14 provides the less (red), relatively (yellow), and most (green) preferable alternatives as a function of the hazard level and the employed approach.
The results from Table 14 are aligned with the previous remarks. The optimal group of alternatives varies depending on the climate levels. While cold climate sites lead to a preference for the most demanding energy retrofitting and the structural retrofit with the best structural performance (in accordance with Section 3.4), warm climate sites show only a preference for the structural retrofit with the best performance. Regardless of the employed methodology, the solutions with S1 as the structural retrofit are always the least preferred options. The shaded area between the 25th and 75th ranking percentiles from each approach (Figure 11) supports the interpretation of the differences between the application of both approaches. While minimal variations are noted in high-hazard locations among the alternatives in each preference group, greater disparities are evident in medium-hazard locations, mostly for the moderate climate, where the results obtained with the simplified approach are different from the ones obtained with the detailed counterpart. This is likely due to the difference in the hazard curves, as observed in Figure 4, which shows how the M-M hazard curve is slightly different from the other medium-hazard locations.

5. Conclusions

This study assessed the influence of different seismic hazard levels and climate conditions on the preferential ranking of combined energy and seismic retrofitting interventions through the employment of a multi-criteria decision-making (MCDM) framework, aiming at higher sustainability of existing buildings. Additionally, the accuracy of employing a simplified approach in the estimation of decision variables related to the seismic performance of a building within the MCDM framework, namely the expected annual losses (EAL), the annual probability of failure (APF), and expected annual environmental impact (EAEI), was also assessed.
To this end, a case-study school building was selected, and four seismic retrofitting solutions, combined with three energy-based interventions, were identified. The case-study building was assumed to be in six different sites in Italy, characterised by two levels of seismic hazard (moderate (M) and high (H)) and with different climatic conditions, namely cold (C), moderate (M), and warm (W). The performance of the building, in its as-built and retrofitted conditions, was then analysed considering the simplified approach and compared with a more detailed one. Finally, an MCDM framework was employed to obtain the overall ranking of the different alternatives and identify the optimal combination of retrofitting schemes, again using both detailed and simplified approaches.
The preliminary assessment of the structural retrofit models resulted in an effectiveness ranking of the retrofit alternatives as S4 > S1 > S3 > S2 and S1 > S4 > S3 > S2 for the medium and high hazard sites, respectively, for the Life Safety limit state. Regarding the APF values, notable differences were obtained. While the approaches yielded similar results for medium-hazard levels, for the high-hazard level, the simplified approach produces lower APF values than the detailed one in high-hazard sites, which needs to be considered as a trade-off for computational efficiency. Regarding the EAL and EAEI, the simplified approach tends to overestimate EAL with respect to the detailed one. Such overestimation can be attributed to the simplified nature of the Sismabonus procedure, which needed to be incorporated into the current Italian seismic risk guidelines in order to enhance its usability by practitioners. Nevertheless, the order of magnitude is kept the same between the different methodologies.
When employing the MCDM framework to obtain the overall ranking of the different alternatives and identify the optimal combination of retrofitting schemes combined with the different detailed and simplified approaches, similar relative closeness values among several alternatives pointed towards the identification of a group of preferable alternatives, instead of the most preferable one. By quantifying the 25th and 75th percentiles of the relative closeness (RC) values for both detailed and simplified approaches, three distinct groups of alternatives were identified: less preferable (RC value below the 25th percentile), relatively preferable (RC value between the 25th and the 75th percentile), and most preferable (RC value above the 75th percentile). When the relative closeness values of different alternatives are very similar, instead of selecting the optimal solution, this approach allows decision-makers to pick the solution to adopt from a group of alternatives with similar relative performance, depending on specific needs and objectives.
Globally, the results showed distinct classifications for medium- and high-seismic hazard sites. For high-hazard ones, the influence of the seismic hazard is highly present since rankings tend to be grouped by the structural retrofit scheme, and, in most cases, the most severe energy retrofit alternative was generally preferred over the other alternatives. In medium-seismic hazard sites, rankings are equally affected by both types of retrofit intervention. For both levels of hazard, S1 is consistently the least preferable structural retrofit alternative. Even though its seismic performance is relatively better than alternatives S2 and S3, its high cost tends to penalize it on the MCDM framework. Comparing both approaches, results show that in high-hazard areas, rankings stay consistent, while in medium-hazard sites, detailed and simplified approaches yield different results. In the detailed one, both energy and seismic retrofit play crucial roles, leading to varied rankings, where the simplified method aligns rankings based on the structural retrofit scheme. Despite similar performance values (APF, EAL, and EAEI), the MCDM struggles to point clear preferable alternatives. Nevertheless, the results obtained through the simplified approach are promising, given that the differences observed in the optimal combination ranking, compared to the detailed counterpart, are mainly justified by the relative distance between different alternatives that affect the mathematical process of the MCDM procedure. In fact, although further investigations will support more general conclusions on the reliability of the simplified, practice-oriented approach, from an overall perspective, the employment of the detailed and simplified approaches led to similar results in the obtained ranking, showing the benefits of employing tools that require less time and computational demand.

Author Contributions

R.C.: methodology, software, validation, writing—original draft preparation; G.M.: supervision, conceptualization, writing—review and editing; R.M.: supervision, conceptualization, writing—review and editing; R.B.: supervision, conceptualization, writing—review and editing. All authors have read and agreed to the published version of the manuscript.

Funding

This research has been funded by the Italian Civil Protection Department within the framework of the projects “ReLUIS 2022-2024” and financially supported by national Portuguese funds through the FCT/MCTES (PIDDAC) under the project 2022.08138.PTDC.

Institutional Review Board Statement

Not applicable.

Informed Consent Statement

Not applicable.

Data Availability Statement

The data presented in this study are available on request from the corresponding author.

Conflicts of Interest

The authors declare no conflicts of interest.

References

  1. European Comission Communication from the Commission to the European Parliament; the Council; the European Economic and Social Committee; the Committee of the Regions. The European Green Deal; ESDN Office: Vienna, Austria, 2020. [Google Scholar]
  2. Ministero dell’Ambiente e della Sicurezza Energetica. Piano Nazionale Integrato per l’Energia e per il Clima. 2023. Available online: https://www.mase.gov.it/pagina/ministero (accessed on 8 April 2024).
  3. Pohoryles, D.; Bournas, D.; Da Porto, F.; Santarsiero, G.; Triantafillou, G.; Oliveira, D.; Jelle, B. Technologies for the Combined Seismic and Energy Upgrading of Existing Buildings; Publications Office of the European Union: Luxembourg, 2022. [Google Scholar] [CrossRef]
  4. Gkatzogias, K.; Crowley, H.; Veljkovic, A.; Pohoryles, D.; Norlén, H.; Tsionis, G.; Bournas, D. Prioritising EU Regions for Building Renovation: Seismic Risk, Energy Efficiency, Socioeconomic Vulnerability—REEBUILD: Integrated Techniques for the Seismic Strengthening and Energy Efficiency of Existing Buildings; Publications Office of the European Union: Luxembourg, 2022. [Google Scholar] [CrossRef]
  5. Gkatzogias, K.; Pohoryles, D.A.; Romano, E.; Bournas, D.A. Integrated Seismic and Energy Renovation of Buildings; Publications Office of the European Union: Luxembourg, 2023. [Google Scholar] [CrossRef]
  6. Pohoryles, D.A.; Bournas, D.A.; Da Porto, F.; Santarsiero, G.; Triantafillou, T. Overview of Combined Seismic and Energy Upgrading Technologies for Existing Buildings; Publications Office of the European Union: Luxembourg, 2022. [Google Scholar] [CrossRef]
  7. Mucedero, G.; Monteiro, R. An integrated regional prioritisation framework for seismic and energy-efficiency performance upgrading of residential buildings. Int. J. Disaster Risk Reduct. 2024, 103, 104341. [Google Scholar] [CrossRef]
  8. Asadi, E.; Salman, A.M.; Li, Y. Multi-criteria decision-making for seismic resilience and sustainability assessment of diagrid buildings. Eng. Struct. 2019, 191, 229–246. [Google Scholar] [CrossRef]
  9. Caterino, N.; Iervolino, I.; Manfredi, G.; Cosenza, E. Multi-Criteria Decision Making for Seismic Retrofitting of RC Structures. J. Earthq. Eng. 2008, 12, 555–583. [Google Scholar] [CrossRef]
  10. Requena-García-Cruz, M.V.; Morales-Esteban, A.; Durand-Neyra, P.; Estêvão, J.M.C. An index-based method for evaluating seismic retrofitting techniques. Application to a reinforced concrete primary school in Huelva. Earth Its Atmos. 2019, 14, e0215120. [Google Scholar] [CrossRef] [PubMed]
  11. Clemett, N.; Carofilis, W.; Gabbianelli, G.; O’Reilly, G.J.; Monteiro, R. Optimal Combined Seismic and Energy Efficiency Retrofitting for Existing Buildings in Italy. J. Struct. Eng. 2023, 149, 04022207. [Google Scholar] [CrossRef]
  12. Caruso, M.; Pinho, R.; Bianchi, F.; Cavalieri, F.; Lemmo, M.T. Integrated economic and environmental building classification and optimal seismic vulnerability/energy efficiency retrofitting. Bull. Earthq. Eng. 2021, 19, 3627–3670. [Google Scholar] [CrossRef]
  13. Saler, E.; Gattesco, N.; da Porto, F. A new combined approach to prioritise seismic retrofit interventions on stocks of r.c. school buildings. Int. J. Disaster Risk Reduct. 2023, 93, 103767. [Google Scholar] [CrossRef]
  14. Couto, R.; Mucedero, G.; Bento, R.; Monteiro, R. On the Influence of Climate and Seismic Hazard Conditions in the Identification of Optimal Retrofitting Strategies for RC Buildings. COMPDYN Proc. 2023, 2070–2084. [Google Scholar] [CrossRef]
  15. Caruso, M.; Couto, R.; Pinho, R.; Monteiro, R. Decision-making approaches for optimal seismic/energy integrated retrofitting of existing buildings. Front. Built Environ. 2023, 9, 1176515. [Google Scholar] [CrossRef]
  16. Mucedero, G.; Couto, R.; Clemett, N.; Monteiro, R. Implications of masonry infill—Related uncertainty on the optimal seismic retrofitting of existing buildings. In Proceedings of the 14th International Conference on Applications of Statistics and Probability in Civil Engineering, ICASP14, Dublin, Ireland, 9–13 July 2023; pp. 1–8. [Google Scholar]
  17. Carofilis, W.; Clemett, N.; Gabbianelli, G.; O’Reilly, G.; Monteiro, R. Influence of Parameter Uncertainty in Multi-Criteria Decision-Making When Identifying Optimal Retrofitting Strategies for RC Buildings. J. Earthq. Eng. 2023, 27, 1769–1794. [Google Scholar] [CrossRef]
  18. Vamvatsikos, D.; Cornell, C.A. Direct Estimation of Seismic Demand and Capacity of Multidegree-of-Freedom Systems through Incremental Dynamic Analysis of Single Degree of Freedom Approximation. J. Struct. Eng. 2005, 131, 589–599. [Google Scholar] [CrossRef]
  19. Baltzopoulos, G.; Baraschino, R.; Iervolino, I.; Vamvatsikos, D. SPO2FRAG: Software for seismic fragility assessment based on static pushover. Bull. Earthq. Eng. 2017, 15, 4399–4425. [Google Scholar] [CrossRef]
  20. Dolšek, M.; Fajfar, P. IN2—A Simple Alternative for IDA. In Proceedings of the 13th World Conference on Earthquake Engineering, Vancouver, BC, Canada, 1–6 August 2004. [Google Scholar]
  21. FEMA P-58-1. Seismic Performance Assessment of Buildings: Volume 1—Methodology; FEMA: Washington, DC, USA, 2018; Volume 1, p. 344. [Google Scholar] [CrossRef]
  22. Ramirez, C.M.; Miranda, E. Building-Specific Loss Estimation Methods & Tools for Simplified Performance-Based Earthquake Engineering; Rep. No. 171; Stanford University: Stanford, CA, USA, 2009. [Google Scholar]
  23. Mucedero, G.; Perrone, D.; Monteiro, R. Generalised Storey Loss Functions for Seismic Loss Assessment of Italian Residential Buildings. J. Earthq. Eng. 2024, 28, 451–474. [Google Scholar] [CrossRef]
  24. Perrone, G.; Cardone, D.; O’Reilly, G.J.; Sullivan, T.J. Developing a Direct Approach for Estimating Expected Annual Losses of Italian Buildings. J. Earthq. Eng. 2022, 26, 1–32. [Google Scholar] [CrossRef]
  25. Nettis, A.; Gentile, R.; Raffaele, D.; Uva, G.; Galasso, C. Cloud Capacity Spectrum Method: Accounting for record-to-record variability in fragility analysis using nonlinear static procedures. Soil Dyn. Earthq. Eng. 2021, 150, 106829. [Google Scholar] [CrossRef]
  26. Cosenza, E.; Del Vecchio, C.; Di Ludovico, M.; Dolce, M.; Moroni, C.; Prota, A.; Renzi, E. The Italian guidelines for seismic risk classification of constructions: Technical principles and validation. Bull. Earthq. Eng. 2018, 16, 5905–5935. [Google Scholar] [CrossRef]
  27. FEMA P-58-3. Seismic Performance Assessment of Buildings: Volume 3—Performance Assessment Calculation Tool (PACT); FEMA: Washington, DC, USA, 2012. [Google Scholar]
  28. Applied Technology Council (ATC). Seismic Evaluation and Retrofit of Concrete Buildings; Rep. No. ATC-40 1–2; ATC: Redwood City, CA, USA, 1996. [Google Scholar]
  29. Jalayer, F.; Ebrahimian, H.; Miano, A.; Manfredi, G.; Sezen, H. Analytical fragility assessment using unscaled ground motion records. Earthq. Eng. Struct. Dyn. 2017, 46, 2639–2663. [Google Scholar] [CrossRef]
  30. Peres, R.; Couto, R.; Sousa, I.; Castro, J.; Bento, R. Modelling and evaluation of brittle shear effects on the seismic performance and loss assessment of RC buildings. Eng. Struct. 2023, 275, 115–230. [Google Scholar] [CrossRef]
  31. O’Reilly, G.J.; Perrone, D.; Fox, M.; Monteiro, R.; Filiatrault, A. Seismic assessment and loss estimation of existing school buildings in Italy. Eng. Struct. 2018, 168, 142–162. [Google Scholar] [CrossRef]
  32. Prota, A.; Di Ludovico, M.; Vecchio, C.; Menna, C. Progetto DPC-ReLUIS 2019–2021 WP5: Interventi di Rapida Esecuzione a Basso Impatto ed Integrati. 2020. Available online: https://www.reluis.it/doc/DPC-RELUIS-2019-2021-WP5/Interventi-Caso%20studio%202%20cemento%20armato.pdf (accessed on 8 April 2024).
  33. Mucedero, G.; Perrone, D.; Brunesi, E.; Monteiro, R. Numerical modelling and validation of the response of masonry infilled rc frames using experimental testing results. Buildings 2020, 10, 182. [Google Scholar] [CrossRef]
  34. McKenna, F.; Scott, M.H.; Fenves, G.L. Nonlinear Finite-Element Analysis Software Architecture Using Object Composition. J. Comput. Civ. Eng. 2010, 24, 95–107. [Google Scholar] [CrossRef]
  35. Scott, M.H.; Fenves, G.L. Plastic hinge integration methods for force-based beam-column elements. J. Struct. Eng. 2006, 132, 244–252. [Google Scholar] [CrossRef]
  36. Mucedero, G.; Perrone, D.; Monteiro, R. Infill Variability and Modelling Uncertainty Implications on the Seismic Loss Assessment of an Existing RC Italian School Building. Appl. Sci. 2022, 12, 12002. [Google Scholar] [CrossRef]
  37. O’Reilly, G.J. Performance-Based Seismic Assessment and Retrofit of Existing RC Frame Buildings in Italy. 2016. Available online: https://www.researchgate.net/publication/317746246_Performance-Based_Seismic_Assessment_and_Retrofit_of_Existing_RC_Frame_Buildings_in_Italy (accessed on 8 April 2024).
  38. Carofilis, W.; Gabbianelli, G.; Monteiro, R. Assessment of Multi-Criteria Evaluation Procedures for Identification of Optimal Seismic Retrofitting Strategies for Existing RC Buildings. J. Earthq. Eng. 2022, 26, 5539–5572. [Google Scholar] [CrossRef]
  39. MIT NTC 2018: D.M. del Ministero delle Infrastrutture e dei Trasporti del 17/01/2018. Aggiorna-Mento delle Norme Tecniche per le Costruzioni. 2018. (In Italian). Available online: https://www.gazzettaufficiale.it/eli/id/2018/2/20/18A00716/sg (accessed on 8 April 2024).
  40. Fajfar, P. A Nonlinear Analysis Method for Performance-Based Seismic Design. Earthq. Spectra 2000, 16, 573–592. [Google Scholar] [CrossRef]
  41. O’Reilly, G.J.; Sullivan, T.J. Modeling Techniques for the Seismic Assessment of the Existing Italian RC Frame Structures. J. Earthq. Eng. 2019, 23, 1262–1296. [Google Scholar] [CrossRef]
  42. Decreto Ministeriale DM n. 58/2020. In Linee Guida per la Classificazione del Rischio Sismico delle Costruzioni; Ministero dell’Istruzione e del Merito: Rome, Italy, 2020.
  43. Calvi, G.M. Choices and criteria for seismic strengthening. J. Earthq. Eng. 2013, 17, 769–802. [Google Scholar] [CrossRef]
  44. Economico, I.M.D.S. Decreto interministeriale 26 Giugno 2015, Applicazione delle metodologie di calcolo delle prestazioni energetiche e definizione delle prescrizioni e dei requisiti minimi degli edifici; Italian Government: Rome, Italy, 2015. [Google Scholar]
  45. Carofilis, W.; Perrone, D.; O’Reilly, G.J.; Monteiro, R.; Filiatrault, A. Seismic retrofit of existing school buildings in Italy: Performance evaluation and loss estimation. Eng. Struct. 2020, 225, 111243. [Google Scholar] [CrossRef]
  46. Clemett, N.; Carofilis, W.; O’Reilly, G.J.; Gabbianelli, G.; Monteiro, R. Optimal seismic retrofitting of existing buildings considering environmental impact. Eng. Struct. 2022, 250, 113391. [Google Scholar] [CrossRef]
  47. GEM The OpenQuake-engine User Manual. Global Earthquake Model (GEM) Open—Quake Manual for Engine Version 3.7.0. 2019. Available online: https://www.globalquakemodel.org/product/openquake-engine (accessed on 8 April 2023).
  48. Ancheta, T.D.; Darragh, R.B.; Stewart, J.P.; Seyhan, E.; Silva, W.J.; Chiou, B.S.-J.; Wooddell, K.E.; Graves, R.W.; Kottke, A.R.; Boore, D.M.; et al. NGA-West2 Database. Earthq. Spectra 2014, 30, 989–1005. [Google Scholar] [CrossRef]
  49. O’Reilly, G.J.; Sullivan, T.J. Quantification of modelling uncertainty in existing Italian RC frames. Earthq. Eng. Struct. Dyn. 2018, 47, 1054–1074. [Google Scholar] [CrossRef]
  50. Mucedero, G.; Perrone, D.; Monteiro, R. Epistemic uncertainty in poorly detailed existing frames accounting for masonry infill variability and RC shear failure. Earthq. Eng. Struct. Dyn. 2022, 51, 3755–3778. [Google Scholar] [CrossRef]
  51. Gencturk, B.; Elnashai, A.S. Development and application of an advanced capacity spectrum method. Eng. Struct. 2008, 30, 3345–3354. [Google Scholar] [CrossRef]
  52. Chopra, A.K.; Goel, R.K. Evaluation of NSP to Estimate Seismic Deformation: SDF Systems. J. Struct. Eng. 2000, 126, 482–490. [Google Scholar] [CrossRef]
  53. FEMA-P-58-4. Seismic Performance Assessment of Buildings Volume 4—Methodology for Assessing Environmental Impacts; FEMA: Washington, DC, USA, 2018; Volume 4, p. 122. [Google Scholar]
  54. Couto, R.; Mucedero, G.; Bento, R.; Monteiro, R. A practice-oriented approach for the seismic and energy performance upgrading of existing buildings. J. Earthq. Eng. 2024; in press. [Google Scholar]
  55. O’Reilly, G.J.; Nafeh, A.M.B.; Shahnazaryan, D. Simplified tools for the risk assessment and classification of existing buildings. Procedia Struct. Integr. 2023, 44, 1744–1751. [Google Scholar] [CrossRef]
  56. Edilclima EC700 Calcolo Prestazioni Energetiche Degli Edifici—Versione 11. 2022. Available online: https://www.infobuild.it/prodotti/progettazione-termotecnica/ (accessed on 8 May 2023).
Figure 1. Steps included in the proposed methodology.
Sustainability 16 04318 g001
Figure 2. Numerical model of the case-study building, developed in OpenSees [11].
Sustainability 16 04318 g002
Figure 3. Climate and seismic hazard levels maps of Italy, with the indication of the selected locations under study.
Sustainability 16 04318 g003
Figure 4. (a) Acceleration response spectra and (b) hazard curves for the six analysed sites.
Sustainability 16 04318 g004
Figure 5. Preliminary seismic assessment of the as-built structure pushover curves in the X (left) and Y (right) direction, with the indication of the N2 performance points for the SLC limit state and the target displacement as a function of the hazard level.
Sustainability 16 04318 g005
Figure 6. Post-seismic intervention assessment of the structural retrofit schemes. Pushover curves in the X and Y direction, with capacity (circles) and N2 performance points (diamonds) for the SLC limit state, as a function of the hazard level: (a) medium and (b) high hazard.
Sustainability 16 04318 g006
Figure 7. Collapse fragility curves for different hazard levels and retrofitted buildings.
Sustainability 16 04318 g007
Figure 8. APF obtained employing the detailed and simplified methodologies for (a) medium- and (b) high-hazard sites.
Sustainability 16 04318 g008
Figure 9. EAL values obtained employing the detailed and simplified methodologies for (a) medium- and (b) high-hazard sites.
Sustainability 16 04318 g009
Figure 10. EAEI values obtained employing the detailed and simplified methodologies for (a) medium- and (b) high-hazard sites.
Sustainability 16 04318 g010
Figure 11. Relative closeness obtained through detailed and simplified approaches for different seismic hazard and climate levels.
Sustainability 16 04318 g011
Table 1. Decision variables considered for the MCDM framework.
GroupDecision VariablesWeight
EconomicC1Installation cost0.15
C2Expected annual costs (EAC)0.19
EnvironmentalC3Expected life-cycle environmental impacts (LCEI)0.18
SocialC4Annual probability of failure (APF)0.14
C5Duration of works0.13
C6Architectural impact0.06
TechnicalC7Need for specialized labour/design knowledge0.05
C8Required intervention at the foundations0.10
Table 2. Main features of selected case-study sites.
CityIDCoordinatesLevel of
Seismicity
PGA
(SLV) [g]
Climatic
Zone
Heating Degree Days (HDD)
Città di CastelloH-C43.4700° N, 12.2314° EHigh (H)0.30Cold (C)2347
Isola del Gran Sasso d’ItaliaH-M42.5056° N, 13.6592° E0.29Moderate (M)2038
CataniaH-W37.5013° N, 15.0742° E0.29Warm (W)833
VicenzaM-C45.5455° N, 11.5354° EMedium (M)0.21Cold (C)2371
Serravalle
Pistoiese
M-M43.9059° N, 10.8330° E,0.20Moderate (M)2010
Cirò MarinaM-W39.368° N, 17.128° E0.21Warm (W)845
AlessandriaL-C44.9073° N, 8.6117° ELow (L)0.08Cold (C)2559
GenovaL-M44.4056° N, 8.9463° E0.10Moderate (M)1435
AgrigentoL-W37.3089° N, 13.5858° E0.08Warm (W)729
Table 3. Seismic safety index (SI-LS), in percentages, of the as-built structure as a function of the level of hazard and climate conditions (critical direction in bold).
DirectionLow HazardMedium HazardHigh Hazard
L-CL-ML-WM-CM-MM-WH-CH-MH-W
X135115140555854394039
Y958198384138272827
Table 4. Retrofit components and corresponding amount per alternative for the considered hazard levels.
Retrofit AlternativeUnitsMedium HazardHigh Hazard
S1Column wrapm2245.1352.6
Column barm29722972
Beam wrapm2177.8256.2
Joint wrapm2138.2186
S2Braced baysNr910
S3Column wrapm25.110.2
Column barm272.0272.0
Beam wrapm211.731.22
Joint wrapm245.545.5
Braced baysNr1010
S4Column wrapm2-10.2
Column barm-456
Beam wrapm2-33.7
Joint wrapm253.453.4
Viscous dampersNr3636
Table 5. Intervention cost (C1) and duration of works (C5) for each retrofit alternative per level of hazard.
AltMedium HazardHigh Hazard
ColdModerateWarmColdModerateWarm
C1 (EUR/m2)C5 (Days)C1 
(EUR/m2)
C5 (Days)C1 
(EUR/m2)
C5 (Days)C1 
(EUR/m2)
C5 (Days)C1 
(EUR/m2)
C5 (Days)C1 
(EUR/m2)
C5 (Days)
S1E1529385253850738867608816187163
S1E2589385683854338927609256190863
S1E3753426924267142109164104865103667
S2E1135211312111321136221322211422
S2E2196231752315023196241752415024
S2E3359282982827728360292992927829
S3E1172231682315023180372134219542
S3E2232232112318623240372574223242
S3E3396273352731427404413804636046
S4E1289142841426614437444194438143
S4E2349273282730327499444634441843
S4E3513314513143131661485864854647
Table 6. Seismic safety index (SI-LS) of each structural intervention, Si, for the different levels of hazard and climate conditions (critical direction in bold).
Alt.Dir.Medium HazardHigh Hazard
M-CM-MM-WH-CH-MH-W
S1X120%123%95%120%108%99%
Y134%134%105%120%107%109%
S2X92%95%73%63%55%50%
Y113%115%88%85%76%70%
S3X122%125%96%82%73%68%
Y111%113%99%87%77%76%
S4X125%128%97%117%105%96%
Y127%130%99%155%137%129%
Table 7. Model parameters of each retrofitted building.
Hazard LevelModelFundamental Period [s]M1* [%]TGM0.2TGM–1.5TGM
LongitudinalTransverse
Medium hazardS00.2350.26738.00.250.05–0.38
S10.5610.45439.30.500.10–0.76
S20.4080.37947.10.390.08–0.59
S30.4050.37946.10.390.08–0.59
S40.7790.56541.50.660.13–1.00
High hazardS00.2350.26738.00.250.05–0.38
S10.5710.45440.40.440.09–0.67
S20.4070.37344.00.390.08–0.60
S30.4050.36543.90.380.08–0.60
S40.7850.56341.40.590.12–0.90
Table 8. Sismabonus results.
Alt.Param.Medium HazardHigh Hazard
M-CM-MM-WH-CH-MH-W
%Class%Class%Class%Class%Class%Class
S1SI-LS120A+A+123A+A+95AA120A+A108A+A99AA
EAL0.46A+0.48A+0.52A0.61A0.61A0.64A
S2SI-LS92AA95AA73BB63BB55CC50CC
EAL0.49A+0.51A0.59A0.80A0.82A0.60A
S3SI-LS111A+A+113A+A+96AA82AA73BB68BB
EAL0.46A+0.46A+0.50A0.63A0.67A0.65A
S4SI-LS125A+A+128A+A+97AA117A+A105A+A96AA
EAL0.42A+0.43A+0.47A+0.52A0.54A0.52A
Table 9. Energy performance assessment results.
Alt.PEC (kWh/m2)Eq. CO2 (kgCO2e)AEC (EUR)Energy Class
E030976,65112,718E
E1221.76 (−28%)52,476 (−32%)8765 (−31%)D
E2166.63 (−46%)40,716 (−47%)7121 (−44%)C
E364.92 (−79%)14,982 (−80%)3109 (−76%)A2
Note: In brackets, the reduction (%) of PEC, Eq. CO2, and AEC for each energy-retrofitting intervention, with respect to the as-built condition.
Table 10. DVs C2, C3, and C4 for the medium-hazard sites.
DetailedSimplified
CMWCMW
AltC2C3 C4 C2C3C4 C2C3 C4 C2C3C4 C2C3 C4 C2C3 C4
S1E19.525.41.2210.443.20.3613.552.71.3015.329.21.1918.048.20.2518.956.31.38
S1E29.521.61.289.635.30.3312.542.51.3115.225.31.1917.440.40.2518.046.11.38
S1E38.814.81.207.418.00.319.921.41.2814.818.71.1915.623.40.2515.725.21.38
S2E19.023.51.149.541.10.2614.251.81.9516.828.91.3317.146.20.3518.854.81.49
S2E29.319.91.408.733.20.1913.541.72.0816.825.01.3316.438.40.3517.944.61.49
S2E38.613.11.396.716.10.3011.120.82.1816.518.51.3314.621.40.3515.623.81.49
S3E18.722.40.939.740.30.2812.549.60.9615.326.91.3717.245.40.3218.253.41.56
S3E28.618.40.959.232.60.3711.439.30.9215.223.01.3716.637.60.3217.243.31.56
S3E38.011.70.966.915.30.328.918.30.9814.916.51.3714.820.60.3214.922.41.56
S4E18.621.80.5310.740.50.3012.349.00.4616.226.80.1117.945.20.00618.853.30.17
S4E28.517.90.549.932.60.2711.338.70.4916.122.90.1117.337.40.00617.943.10.17
S4E37.811.10.547.915.40.318.517.50.4415.816.40.1115.420.40.00615.622.20.17
Note: The units of C2 and C3 are, respectively, EUR and kgCO2e. C4 is unitless (×10−3).
Table 11. DVs C2, C3, and C4 for the high-hazard sites.
DetailedSimplified
CMWCMW
AltC2C3 C4 C2C3C4 C2C3 C4 C2C3C4 C2C3 C4 C2C3 C4
S1E112.928.41.0116.240.41.6618.847.52.6719.733.00.9122.752.31.4223.760.31.20
S1E212.924.51.0814.323.41.8716.526.62.9019.629.10.9122.144.51.4222.850.21.20
S1E312.317.91.1213.442.71.8116.952.52.9419.322.60.9120.427.51.4220.629.41.20
S2E113.125.02.8618.838.74.5519.744.64.5820.330.11.3622.548.92.0522.456.21.81
S2E213.121.22.9316.621.54.7017.123.54.7320.326.31.3622.041.12.0521.546.11.81
S2E313.315.13.3022.347.24.3724.255.94.6920.219.91.3620.524.32.0519.525.31.81
S3E113.623.91.6617.436.32.4617.841.72.0519.928.50.6522.847.71.0023.055.20.85
S3E213.520.01.6715.519.32.6615.420.82.3019.824.60.6522.240.01.0022.145.10.85
S3E312.813.31.6222.845.62.7423.353.32.2419.618.20.6520.623.11.0019.924.30.85
S4E113.722.60.4316.334.20.7916.939.80.5221.227.60.02723.846.60.0624.854.70.03
S4E213.618.70.4014.219.20.7414.220.80.5721.123.70.02723.238.90.0623.944.60.03
S4E313.414.40.592.61.50.682.41.40.5420.719.40.02721.424.00.0621.625.90.03
Note: The units of C2 and C3 are, respectively, EUR and kgCO2e. C4 is unitless (×10−3).
Table 12. DVs C6 and C8 for the medium- and high-hazard sites.
Alt.C6
(-)
C7
(-)
C8 (-)
Medium HazardHigh Hazard
M-CM-MM-WH-CH-MH-W
S1E10.0230.0845.96.27.06.15.75.7
S1E20.0230.0845.96.27.06.15.75.7
S1E30.0230.0845.96.27.06.15.75.7
S2E10.0560.01310.911.312.516.516.516.5
S2E20.0560.01310.911.312.516.516.516.5
S2E30.0560.01310.911.312.516.516.516.5
S3E10.0930.08412.813.413.016.616.616.6
S3E20.0930.08412.813.413.016.616.616.6
S3E30.0930.08412.813.413.016.616.616.6
S4E10.1620.1513.33.53.95.14.84.8
S4E20.1620.1513.33.53.95.14.84.8
S4E30.1620.1513.33.53.95.14.84.8
Table 13. Classification ranking of the retrofit alternatives as a function of hazard level, employed approach, and climate site.
RankMedium HazardHigh Hazard
DetailedSimplified DetailedSimplified
CMWCMWCMWCMW
1S3E3S2E3S3E2S4E1S4E1S4E1S3E3S4E3S4E2S4E2S4E2S4E2
2S4E3S2E2S4E1S4E2S4E2S4E2S4E3S4E2S4E1S3E3S4E3S4E1
3S4E2S3E3S2E1S4E3S4E3S2E1S4E2S3E3S4E3S4E3S4E1S4E3
4S3E2S2E1S3E1S2E2S2E2S2E2S3E2S4E1S3E2S3E2S3E3S3E2
5S4E1S3E2S4E2S2E3S2E1S4E3S3E1S3E2S3E3S4E1S3E2S3E1
6S3E1S4E3S3E3S2E1S2E3S3E1S4E1S2E3S3E1S3E1S3E1S3E3
7S2E3S3E1S2E2S3E2S3E2S3E2S2E3S3E1S2E2S2E3S2E3S2E2
8S2E2S4E1S2E3S3E1S3E3S2E3S2E2S2E2S2E1S2E2S2E2S2E1
9S2E1S4E2S4E3S3E3S3E1S3E3S2E1S2E1S2E3S2E1S2E1S2E3
10S1E3S1E3S1E3S1E3S1E3S1E1S1E3S1E3S1E2S1E3S1E3S1E2
11S1E2S1E2S1E1S1E2S1E2S1E2S1E1S1E1S1E1S1E2S1E2S1E1
12S1E1S1E1S1E2S1E1S1E1S1E3S1E2S1E2S1E3S1E1S1E1S1E3
Table 14. Less, medium, and most preferable alternatives as a function of the location and employed methodology.
Medium HazardHigh Hazard
DetailedSimplified DetailedSimplified
CMWCMWCMWCMW
S1E1S1E1S1E1S1E1S1E1S1E1S1E1S1E1S1E1S1E1S1E1S1E1
S1E2S1E2S1E2S1E2S1E2S1E2S1E2S1E2S1E2S1E2S1E2S1E2
S1E3S1E3S1E3S1E3S1E3S1E3S1E3S1E3S1E3S1E3S1E3S1E3
S2E1S2E1S2E1S2E1S2E1S2E1S2E1S2E1S2E1S2E1S2E1S2E1
S2E2S2E2S2E2S2E2S2E2S2E2S2E2S2E2S2E2S2E2S2E2S2E2
S2E3S2E3S2E3S2E3S2E3S2E3S2E3S2E3S2E3S2E3S2E3S2E3
S3E1S3E1S3E1S3E1S3E1S3E1S3E1S3E1S3E1S3E1S3E1S3E1
S3E2S3E2S3E2S3E2S3E2S3E2S3E2S3E2S3E2S3E2S3E2S3E2
S3E3S3E3S3E3S3E3S3E3S3E3S3E3S3E3S3E3S3E3S3E3S3E3
S4E1S4E1S4E1S4E1S4E1S4E1S4E1S4E1S4E1S4E1S4E1S4E1
S4E2S4E2S4E2S4E2S4E2S4E2S4E2S4E2S4E2S4E2S4E2S4E2
S4E3S4E3S4E3S4E3S4E3S4E3S4E3S4E3S4E3S4E3S4E3S4E3
Disclaimer/Publisher’s Note: The statements, opinions and data contained in all publications are solely those of the individual author(s) and contributor(s) and not of MDPI and/or the editor(s). MDPI and/or the editor(s) disclaim responsibility for any injury to people or property resulting from any ideas, methods, instructions or products referred to in the content.

