Article

The Nexus between Green Finance and Carbon Emissions: Evidence from Maturity Mismatch in China

1
Research Institute of Resource-Based Economics, Shanxi University of Finance & Economics, Taiyuan 030006, China
2
Business School, University of Western Australia, Crawley, WA 6009, Australia
3
Lubar School of Business, University of Wisconsin Milwaukee, Milwaukee, WI 53201, USA
4
Department of Management, Shanxi Institute of Economics Management, Taiyuan 030006, China
*
Author to whom correspondence should be addressed.
Sustainability 2024, 16(10), 4319; https://doi.org/10.3390/su16104319
Submission received: 1 April 2024 / Revised: 12 May 2024 / Accepted: 13 May 2024 / Published: 20 May 2024
(This article belongs to the Special Issue Sustainable Supply Chain and Operation Management)

Abstract

:
Green finance has been widely acknowledged as a pivotal instrument for mitigating carbon emissions. However, few studies have focused on the role of maturity mismatches in promoting carbon emission reduction through green finance. This study aims to develop a composite criterion for green finance and examine the mechanism of how green finance affects carbon emissions via the new perspective of maturity mismatch. It is accomplished by applying a two-way fixed effects model which incorporates provincial data spanning from 2010 to 2020. The empirical evidence suggests green finance plays a significant role in carbon emission reduction, a result that remains robust even after undergoing other tests such as using instrumental variables and alternating econometric models. Furthermore, this effect is particularly pronounced in regions with high degrees of green finance and low energy consumption. Mechanism analysis documents that green finance reduces carbon emissions by addressing maturity mismatch issues faced by green enterprises. Further research finds that green finance can promote the synergy of pollution and carbon reduction; in particular, the effect of maturity mismatch on SO2 reduction is more obvious. Consequently, this study offers practical recommendations for governments, financial institutions, and other relevant policymakers to further propel the advancement of green finance.

1. Introduction

The global environmental crisis, marked by escalating carbon dioxide emissions, imperils both humanity and our planet [1,2]. Consequently, countries worldwide are striving to build sustainable green economies, with carbon emission reduction and green productivity growth taking center stage in policymaking and academic discussions [3].
China, renowned as the foremost global contributor to carbon emissions [4], has committed to ambitious objectives, aiming to attain a carbon peak by 2030, followed by carbon neutrality by 2060 [5,6]. This transition underscores the critical importance of green finance (GF), recognized as a pivotal tool for realizing environmental sustainability [7]. This transition hinges on the crucial role of GF, acknowledged as a pivotal instrument for achieving environmental sustainability [4]. Consequently, the strategic implementation of GF to mitigate carbon emissions has emerged as a central theme in the nascent phase of economic development, eliciting significant attention from policymakers and researchers alike.
In contrast to conventional finance and bank financing, GF places emphasis on environmental benefits [8], considering both environmental advantages and economic profitability [9]. This orientation encourages economies to prioritize environmental protection. Currently, a substantial body of literature has explored the impact of GF on carbon emissions [10]. According to extant research, GF can facilitate carbon reduction in two primary ways. Firstly, it can exert financial constraints on highly polluting and resource-intensive enterprises while simultaneously enhancing the financing capabilities of environmentally friendly and sustainable enterprises [11]. Secondly, GF has the potential to stimulate the adoption of eco-friendly innovation and conservation initiatives within businesses, thereby fostering their social responsibility and environmental performance, ultimately leading to a reduction in carbon emissions [5,11].
However, China still faces the challenge of scaling up green financial products to meet the demands of the “Dual Carbon” targets effectively. In its “14th Five-Year Plan”, China acknowledges the critical phase for achieving carbon reduction [12]. The finance industry needs to be a major player in promoting green and low-carbon initiatives. In 2018, 19 leading Chinese financial institutions issued green loans worth CNY 8.31 trillion, with an annual growth of 33% by the end of 2021, reaching CNY 15.9 trillion. While GF has significantly contributed to China’s sustainability [13], there is a notable gap in meeting the “Dual Carbon” targets’ investment demands. The slow growth rate underscores the need to further develop and expand green financial products [14].
Green, energy-efficient, and environmentally conscious enterprises serve as the primary agents for promoting social low-carbon development. It is noteworthy that these enterprises primarily prioritize the development of green projects that focus on their impact on the environment and society [15] rather than intangible assets centered around their competitive advantages. So these enterprises are distinguished by their lengthy investment horizons and limited short-term profitability [16]. However, financial institutions, particularly commercial banks, often provide short-term loans to these enterprises due to their capital operations. As a consequence, green enterprises encounter challenges in securing long-term funding and are compelled to depend on short-term debt to fund their long-term investments, leading to a mismatch in investment horizons [17]. A maturity mismatch refers to a situation where the maturity of assets does not align with that of liabilities, resulting in a phenomenon known as “short-term debt and long-term investment”. This mismatch implies that after utilizing the acquired financing for green initiatives, when the loan tenure matures and the green projects remain incomplete, the enterprise lacks the sufficient cash flow to fulfill its loan repayment obligations [18]. In more severe cases, it may even pose a systemic risk to the financial system. Government-provided deposit insurance [19] and similar policies primarily aim to enhance the stability of the financial system but may not confer robust protection for enterprises facing financial distress. Therefore, these policies cannot provide effective solutions to the problem of mismatched deadlines, addressing how the issue of maturity mismatch is of importance in advancing the field of GF.
The existing body of literature suggests that GF holds promise as a mitigator of carbon emissions, as noted by several scholars [20,21]. Moreover, certain scholars [22,23] propose that GF has the potential to address the prevalent issue of maturity mismatch among green enterprises by offering tailored financial services. However, the precise efficacy of GF in attenuating carbon emissions through alleviating maturity mismatch remains a compelling yet unresolved research question. Our study aims to contribute to this discourse by elucidating the intricate relationship between carbon emissions and GF, with a specific focus on the role of maturity mismatch. It is noteworthy that reducing carbon dioxide emissions is not only a primary task for China but is also a consensus among countries worldwide [15]. Concurrently, there is a considerable body of research on the debt maturity structure of various countries [24]. Given this context, examining the effects of GF initiatives on carbon emission reduction within Chinese provinces, along with a thorough analysis of the mechanisms underlying maturity mismatch, holds significant relevance for global audiences interested in adopting China’s GF strategies and innovations. Such exploration not only deepens our understanding of maturity mismatch dynamics but also strengthens global efforts to mitigate carbon emissions. Furthermore, by drawing parallels between China’s experiences and those of other countries, this research can provide valuable lessons for international stakeholders seeking to enhance their own GF frameworks and practices, ultimately fostering a more collaborative and effective approach to addressing climate change on a global scale.
Therefore, we make several notable contributions to the literature. Firstly, we expand the evaluation of GF by introducing a comprehensive index system that transcends conventional, single-dimensional assessments. In particular, we introduce the concept of “carbon emission loan intensity” as a scientifically grounded measure of carbon finance. Carbon finance, with its focus on the carbon footprint of financial activities, aids financial institutions and investors in anticipating risks associated with carbon emissions. Understanding the carbon footprints of portfolios facilitates a more effective assessment of climate risks for enterprises and assets, thereby reducing potential losses for both financial institutions and investors. Secondly, our study delves into the mechanism through which GF facilitates carbon mitigation, addressing a previously overlooked aspect—the mediation effect of maturity mismatch. By exploring this mediation, we endeavor to bridge a significant gap in the existing literature.
The remaining part begins with Section 2, which briefly explains the literature review and focuses on theoretical arguments about how GF affects carbon emissions. A summary of the method is given in Section 3. The regression results and a more thorough examination of them are then presented in Section 4. This study is concluded in Section 5. The research framework is presented in Figure 1.

2. Literature Review and Research Hypotheses

2.1. Literature Review

2.1.1. The Concept and the Measurement of Green Finance

Regarding the definition of GF, some researchers argue that it entails considering the environmental aspects in investment and financing within the context of sustainable development [25]. Alternative perspectives suggest that its objective lies in tackling environmental and sustainability challenges through the provision of financial resources for technologies that improve the environment with greater efficiency [26].
GF encompasses multiple measurements, with scholars presenting various perspectives on the subject (Table 1). There are currently three main measurement methods in the academic community, including Principal Component Analysis (PCA), Single Indicator Measurement (SIM), and the Entropy Method (EM). It can be observed that there is no unified consensus among academics regarding the assessment of GF. In contrast to the other approaches, the EM uses an objective weighting method that eliminates the variance caused by human factors by determining the index weight based on the degree of fluctuation of each index’s value [27]. To achieve a more scientific measurement of GF, we adopt the EM by using five secondary indicators: green credit (GC), green security (GS), green investment (GIV), green insurance (GIS), and carbon finance (CF).

2.1.2. The Impact Mechanisms of Green Finance on Carbon Emissions

The majority of authors agree that GF helps reduce carbon emissions [39,40,41]. Some scholars explore the combination of GF with other measures. For example, Ren et al. (2020) find a link between GF index improvement and reduced carbon intensity [42], and Al Mamun et al. (2022) show that carbon emissions decrease through green bond issuance [43]. Zhang et al. (2022) emphasize that GF is a key factor in carbon emission reduction [28].
Despite these findings, the underlying mechanisms of GF’s impact require further exploration. Current research primarily focuses on corporate financing capacity and green technological innovation. Some studies suggest that GF reduces financing costs for polluting firms, while others find increased expenses due to green credit policies. Chai et al. (2022) highlight constraints on heavily polluting firms’ non-liquid debt financing [44]. He and Liu (2023) show that higher GF levels boost environmental firms’ debt financing capabilities but hinder their heavily polluting counterparts [11]. GF also promotes green technological innovation, as seen in studies by Irfan et al. (2022) and Huang et al. (2022) [45,46].

2.1.3. The Causes and Effects of Maturity Mismatch

Scholars in the current academic milieu predominantly scrutinize the origins and ramifications of maturity mismatch. Gong and Wei (2019) discern that the degradation of asset quality leads to an excessive reliance on the short-term debt of financial institutions [18]. Wu et al. (2022) identify that the influences of both enterprise-level and macroeconomic factors serve as the primary determinants of maturity mismatch [24]. Shui (2023), Ee et al. (2023), and Li and Su (2022) observe that financial rescue policies, the geographical location of a corporation’s headquarters, and a surge in corporate debt lead to a shortening of corporate debt maturities [47,48,49]. Additionally, Si et al. (2023) and Li et al. (2024) posit that positive performance feedback and the liberalization of capital accounts substantially decrease corporate term mismatch [50,51]. In addition, Wang (2023) conducted a study revealing that the tightening of the net stable funding ratio contributes to mitigating internal term mismatches within banks [52].
Moreover, Hu et al. (2023) and Xu et al. (2024) elucidate that a greater extent of maturity mismatches within enterprises corresponds to a poorer level of digital transformation [53,54]. Furthermore, as the degree of maturity mismatch within enterprises increases, research by Wang and Ma (2023) reveals a heightened default risk [55]. Luo et al. (2019) posit that a higher level of term mismatch in banks is connected to lower non-performing loan rates at the end of each fiscal quarter [56]. In addition, Li et al. (2023) find that the issuance of green bonds enhances overall firm productivity by mitigating maturity mismatch [57].
The existing literature has provided valuable references and insights for this study; however, it does have certain limitations that this study aims to address. Firstly, there is currently disagreement about the exact choice of GF metrics. Secondly, although some authors have reported that GF can facilitate carbon mitigation by promoting the advancement of green technological innovation and enterprise financing ability, there is a gap in examining whether GF can facilitate the reduction in carbon emissions through other mechanisms. Therefore, based on the important impact of maturity mismatch on green enterprises, this study attempts to explore how GF affects carbon emissions through maturity mismatch.

2.2. Research Hypotheses

2.2.1. Green Finance and Carbon Emissions

The theory of financial intermediation posits that financial institutions, acting as intermediaries between surplus and deficit units within an economy, play a pivotal role in the efficient allocation and equitable distribution of funds across various sectors and entities. GF harnesses financial institutions as intermediaries to realize its intrinsic value. Presently, GF predominantly operationalizes its conceptual framework by employing diverse financial instruments, encompassing the provision of loans to environmentally conscious and sustainable enterprises (referred to as green credit), the allocation of green funds towards ventures within green industries and projects (known as green security), the provision of insurance products targeting environmental pollution risks and other forms of green credit risk (termed green insurance), and active participation in carbon finance activities (known as carbon finance). Green credit has witnessed extensive implementation since the inception of the “Equator Principles” in 2002. It concurrently intensifies investment in energy conservation initiatives, circular economic models, and environmental preservation, while imposing higher entry barriers on polluting enterprises [58]. Green security aims to raise funds to help green enterprises alleviate financial constraints and assist in advancing green and low-carbon projects, thereby facilitating carbon mitigation [59]. Green insurance plays a role in internalizing environmental risks through insurance mechanisms and facilitates green industry investments through credit enhancement and financing functions. Carbon finance markets generate carbon emission rights through options and futures, providing a mechanism to limit carbon emissions [60]. Furthermore, companies can achieve environmental benefits and reduce pollution by allocating funds to environmental-pollution-control expenditures through green investments [61]. Environmental economics underscores the intrinsic connection between internal and external environmental costs. By introducing the aforementioned green financial instruments, financial markets can internalize environmental costs into economic activities, thereby reducing the costs of implementing environmental measures for enterprises. This facilitates the advancement of energy-saving and environmental protection sectors, thereby resulting in a reduction in carbon emissions.
Through the systematic implementation of the “14th Five-Year Plan”, the Chinese government and society demonstrate proactive support for the emergence of green enterprises. This concerted effort engenders the widespread adoption of principles associated with environmentally sustainable development within both the corporate sector and the broader populace. Consequently, GF is positioned to effectively discharge its mandate of providing financial support and fostering the realization of the “Dual Carbon” target. Based on the foregoing analysis, we posit the following initial hypothesis:
Hypothesis 1: 
By utilizing a variety of financial tools, GF encourages the reduction in carbon emissions.
Primarily, regions that allocate more resources and exert greater efforts towards GF establish robust regulatory frameworks, mandating financial institutions to strengthen environmental, social, and governance (ESG) standards. This encourages financial institutions to prudently select investments and prioritize carbon emission levels, thereby steering the entire provincial financial system towards a low-carbon direction. Simultaneously, regions endowed with a more diverse array of green financial instruments and markets may find it easier to channel funds toward green industries [62]. Furthermore, theses provinces can offer a wider array of low-carbon financing options to enterprises and enhance the financing capacity of green corporate debt [63], supporting larger-scale carbon reduction initiatives. However, regions with lower levels of GF development may experience diminished actual effects in carbon emission reduction, attributed to factors such as insufficient resource allocation and the absence of robust green financial markets.
Moreover, it is noteworthy that certain regions may exhibit a heavier reliance on fossil fuels, which inherently results in elevated levels of carbon emissions. Consequently, these regions face increased costs in implementing carbon reduction projects, thereby constraining the application of GF and encountering challenges in attracting green investments from financial institutions or enterprises. Conversely, regions characterized by cleaner-energy-consumption structures may find it easier to secure green financing for carbon reduction projects [15]. This is because GF is more appealing to investors and financial institutions, as it encourages the allocation of funds into low-energy, low-pollution projects [64]. In these areas, GF is expected to yield more pronounced carbon emission reduction effects. In light of these analyses, our study proposes the following hypothesis:
Hypothesis 2: 
The carbon emission reduction effects of GF vary due to differences in GF development and energy consumption structures.

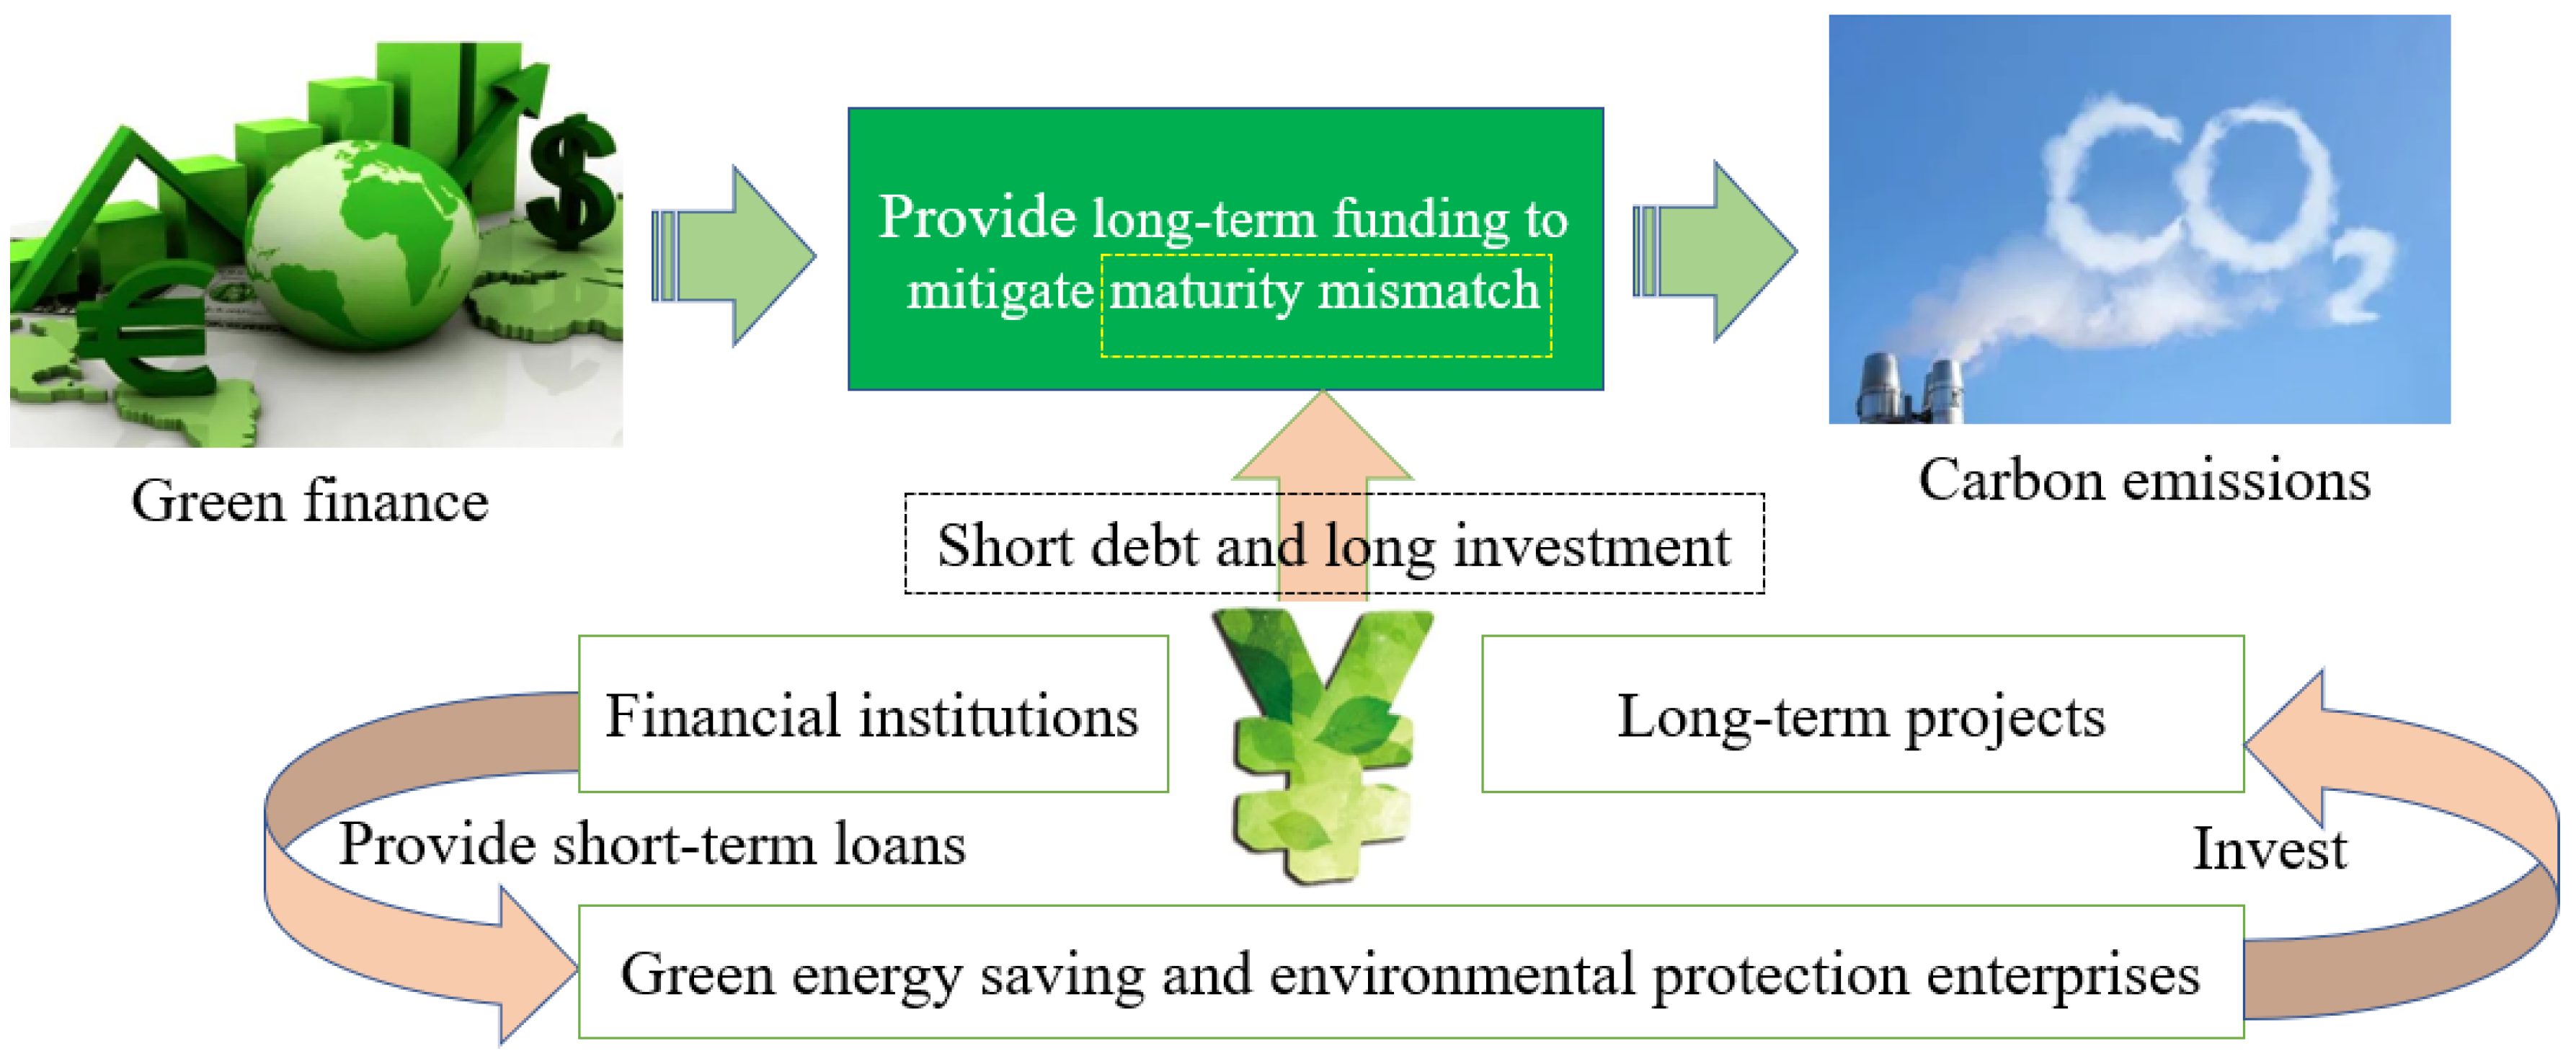
2.2.2. Green Finance and Maturity Mismatch

The principle of matching investments and financing durations is a fundamental principle that businesses must adhere to in their operational processes. It means matching the investment maturity structure to the loan maturity structure. However, the volatility of China’s economic policies has forced financial institutions to give preference to lending to businesses with lower default risks as a risk mitigation strategy due to economic pressures and the COVID-19 pandemic outbreak in recent years. The current state of affairs has led to a widening gap in long-term finance for firms, intensifying the problem of depending on short-term loans for long-term investments [65]. This phenomenon is known as maturity mismatch.
Energy-saving and environmental protection enterprises often possess unique characteristics such as long investment horizons, significant investment amounts, and high volatility. Therefore, financial institutions seldom offer long-term loans to such enterprises in order to minimize their credit exposure durations [66]. Under this investment model adopted by financial institutions, green enterprises constantly face the risk of a disrupted capital chain. As a result, these enterprises can only allocate short-term loans to their energy-saving projects [67]. However, when the short-term borrowings mature, the green projects in which the enterprises have invested may not have generated sufficient returns, thereby leading to financial crises.
Moreover, GF focuses on catering to financial resources to support project funding and operations in areas related to environmental preservation, the efficient use of energy, eco-friendly transit, and sustainable building. It utilizes green financial instruments to influence the fund allocation decisions made by financial institutions [68], thereby providing long-term financing for green and environmental protection companies, and addressing the financing challenges they encounter in green investment projects. Consequently, green projects can be developed more effectively to curtail carbon emissions. This process is illustrated in Figure 2. According to the aforementioned, this study raises the mechanism hypothesis:
Hypothesis 3: 
By reducing the maturity mismatch in green firms, GF supports carbon emission reduction.
Figure 2. GF reduces carbon emissions by mitigating maturity mismatch.
Sustainability 16 04319 g002

3. Research Design

3.1. Model Specification

The two-way fixed effects approach reduces endogeneity problems brought on by omitted variables and somewhat reduces the impact of macro-level fluctuations on research findings. Therefore, to confirm how GF promotes carbon reduction, following the method of Xu et al. (2023), econometric Model (1) is set out in this study [63]:
l n C i , t = α 0 + α 1 l n G F i , t + α 2 l n X i , t + y e a r t + r e g i o n i + ε i , t  
where l n C i , t represents carbon emission, l n G F i , t denotes GF, and l n X i , t represents control variables. Additionally, unobservable elements are controlled for using y e a r t and r e g i o n i , respectively, mean time-fixed effects, and individual fixed effects. Moreover, α 0 is the constant term, while α 1 and α 2 are the coefficients for GF and control variables. Lastly, ε i , t indicates the random disturbance term. Furthermore, it ought to be mentioned that all data in this study are in their natural logarithmic form.
To explore the ways in which GF influences carbon emissions, combining existing research methods [64], we include an interaction factor in the model:
l n C i , t = β 0 + β 1 l n G F i , t + β 2 l n G F i , t l n M i s i , t + β 3 l n M i s i , t + β 4 l n X i , t + y e a r t + r e g i o n i + ε i . t
where l n M i s i , t denotes maturity mismatch and β 2 is the coefficient for the interaction term. We test the mechanism of impact by the sign and significance of β 1 , β 2 , and β 3 . The meanings of the other symbols are identical to those in Model (1). It should be noted that the data for 29 provinces in China from 2010 to 2020 were chosen for examination.

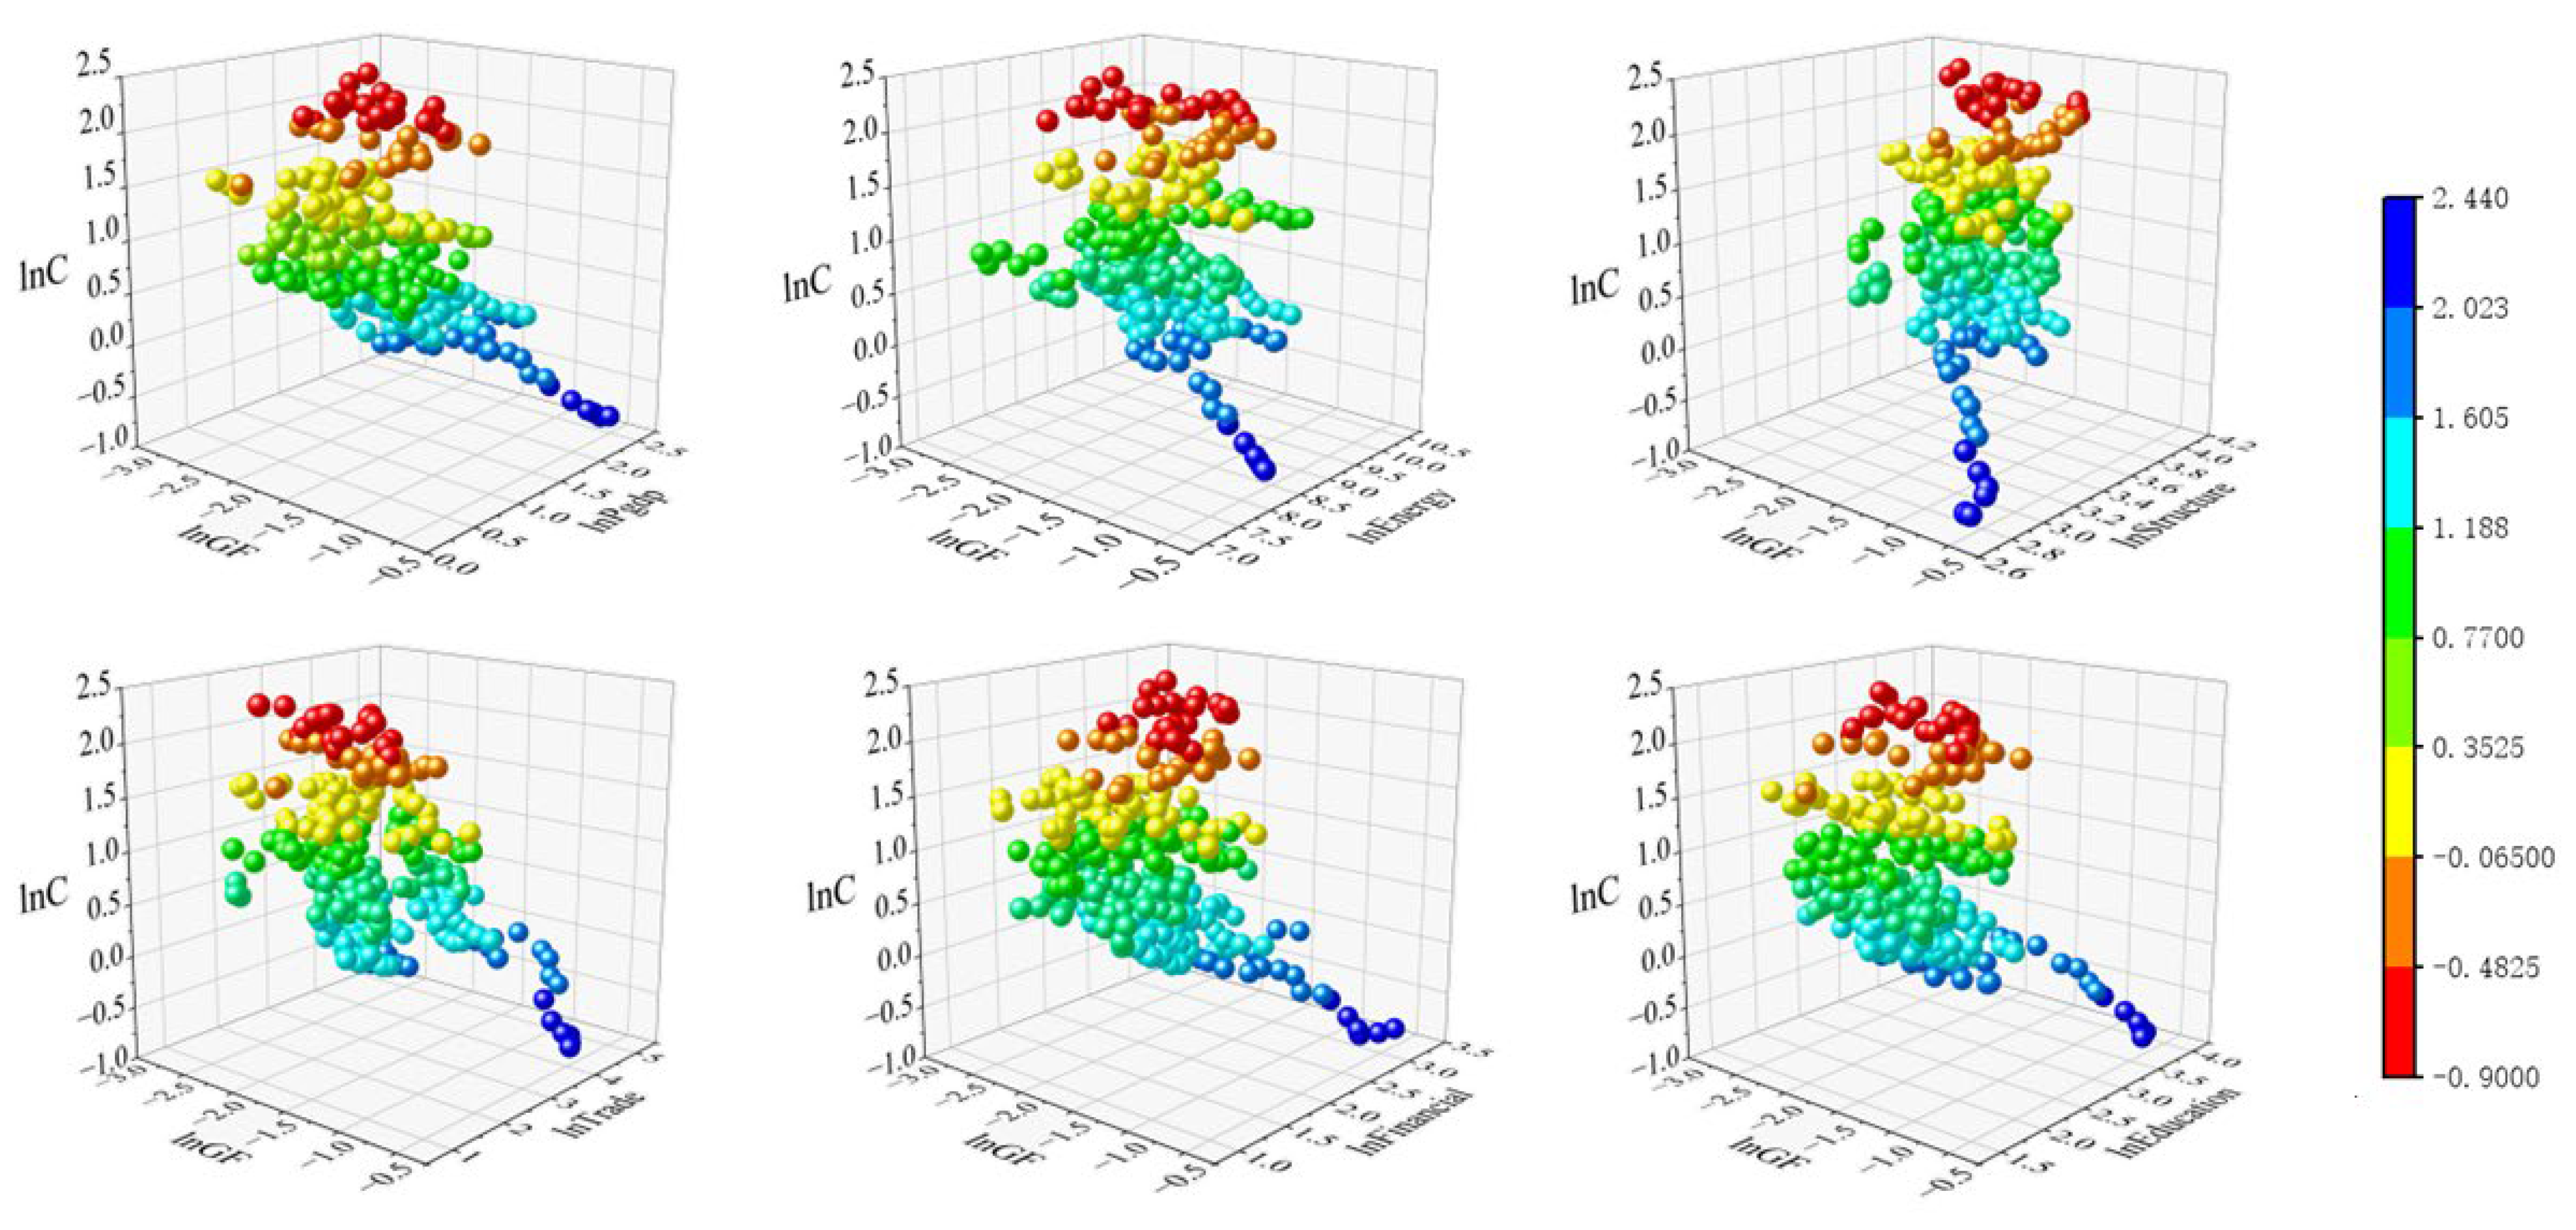
3.2. Variable Settings

3.2.1. Carbon Intensity (C)

In this study, the explanatory variable is carbon intensity, which is determined by dividing GDP by carbon emissions. Equation (3) illustrates how the carbon emissions in this study are calculated using historical end-use energy consumption data for each province and the methodology adopted in the 2006 “Guidelines for National Greenhouse Gas Inventories” publication by the Intergovernmental Panel on Climate Change (IPCC):
C O 2 i t = E i j t × η j i = 1,2 , 29 ; j = 1,2 , 9  
where C O 2 i t indicates the province i ’s annual resource consumption; E i j t is the total amount of carbon emissions produced in the province i ; and η j denotes the energy source j ’s carbon emission coefficient. It is important to convert the original statistics into standard statistical numbers in order to estimate carbon emissions because they originally recorded the consumption of different energy sources in physical quantities. According to the “China Energy Statistical Yearbook” guidelines, the final energy consumption is divided into nine categories: fuel oil, liquefied petroleum gas, natural gas, gasoline, kerosene, diesel, coke, raw coal, and crude oil. The calculation result shows that considerable variations in carbon intensity exist among provinces in China. Primarily, provinces with high carbon intensities are predominantly classified as traditional resource-driven provinces, where coal and oil play crucial roles as key industries [69].

3.2.2. Green Finance (GF)

GF is the explanatory variable in our study. According to the literature, the academic community cannot agree on how to evaluate it. This study chooses five aspects of GF—GC, GS, GIV, GIS, and CF—to ensure accurate measurement. The indicator system for evaluating green financing is constructed utilizing these dimensions, and the particular indicators and selection are displayed in Table 2. Following the method of Yin and Xu (2022), we quantify GF using the EM [37]. To measure GC, a negative indicator is employed for interest payments associated with high-energy-consuming industries, while a positive indicator is utilized for loans extended to environmental protection enterprises. For GS, in contrast to the approach of some scholars [29,30] who use green bond indices, our study employs a positive indicator to quantify the market value ascribed to enterprises focused on energy conservation and environmental preservation initiatives. Additionally, a negative indicator is utilized to quantify the market value linked to high-energy-consuming industries. Regarding GIV, we employ a positive indicator to measure the proportion of environmentally friendly investment. Concerning GIS, considering that Chinese business liability insurance went into effect in 2013 and that farm insurance is directly related to environmental preservation, relevant indicators related to agricultural insurance are utilized for measurement. To calculate CF, previous scholars [27,38] have used a negative indicator of the carbon-emissions-to-GDP ratio. However, carbon finance revolves around financial activities related to carbon emission trading. We thus assess it using the ratio of loans in local and foreign currencies to carbon emissions, drawing inspiration from Wang et al.’s (2021) methodology [36].
Ever since the State Council of China unveiled its all-encompassing strategy for the transformation of the ecological civilization system in September 2015, it has offered a strategic framework for GF systems as well as a top-level design for ecological civilization reforms. Therefore, in order to compare the development discrepancies in GF, this study focuses on three specific years: 2010, 2015, and 2020.
The results show that there is progressive advancement in GF in China, but significant variations exist among different provinces. This is consistent with some previous research findings [4,9,46]. As the capital city in China, Beijing possesses unique policy and funding advantages [70], making it a leader in GF. Furthermore, industrial provinces like Inner Mongolia, Xinjiang, and Heilongjiang have made remarkable strides in GF. This progress can be attributed primarily to their imperative to shift away from an extensive economic development model. Nonetheless, provinces such as Guizhou, Guangxi, Jiangxi, and Qinghai have lower rankings in GF. This is mainly due to their reliance on tertiary industries that have a lesser impact on environmental pollution, as well as their comparatively weaker economic foundations. However, it is important to remember that the conclusions of this study diverge from those of Lv et al. (2021), highlighting the use of distinct GF indicator systems by different researchers [8].

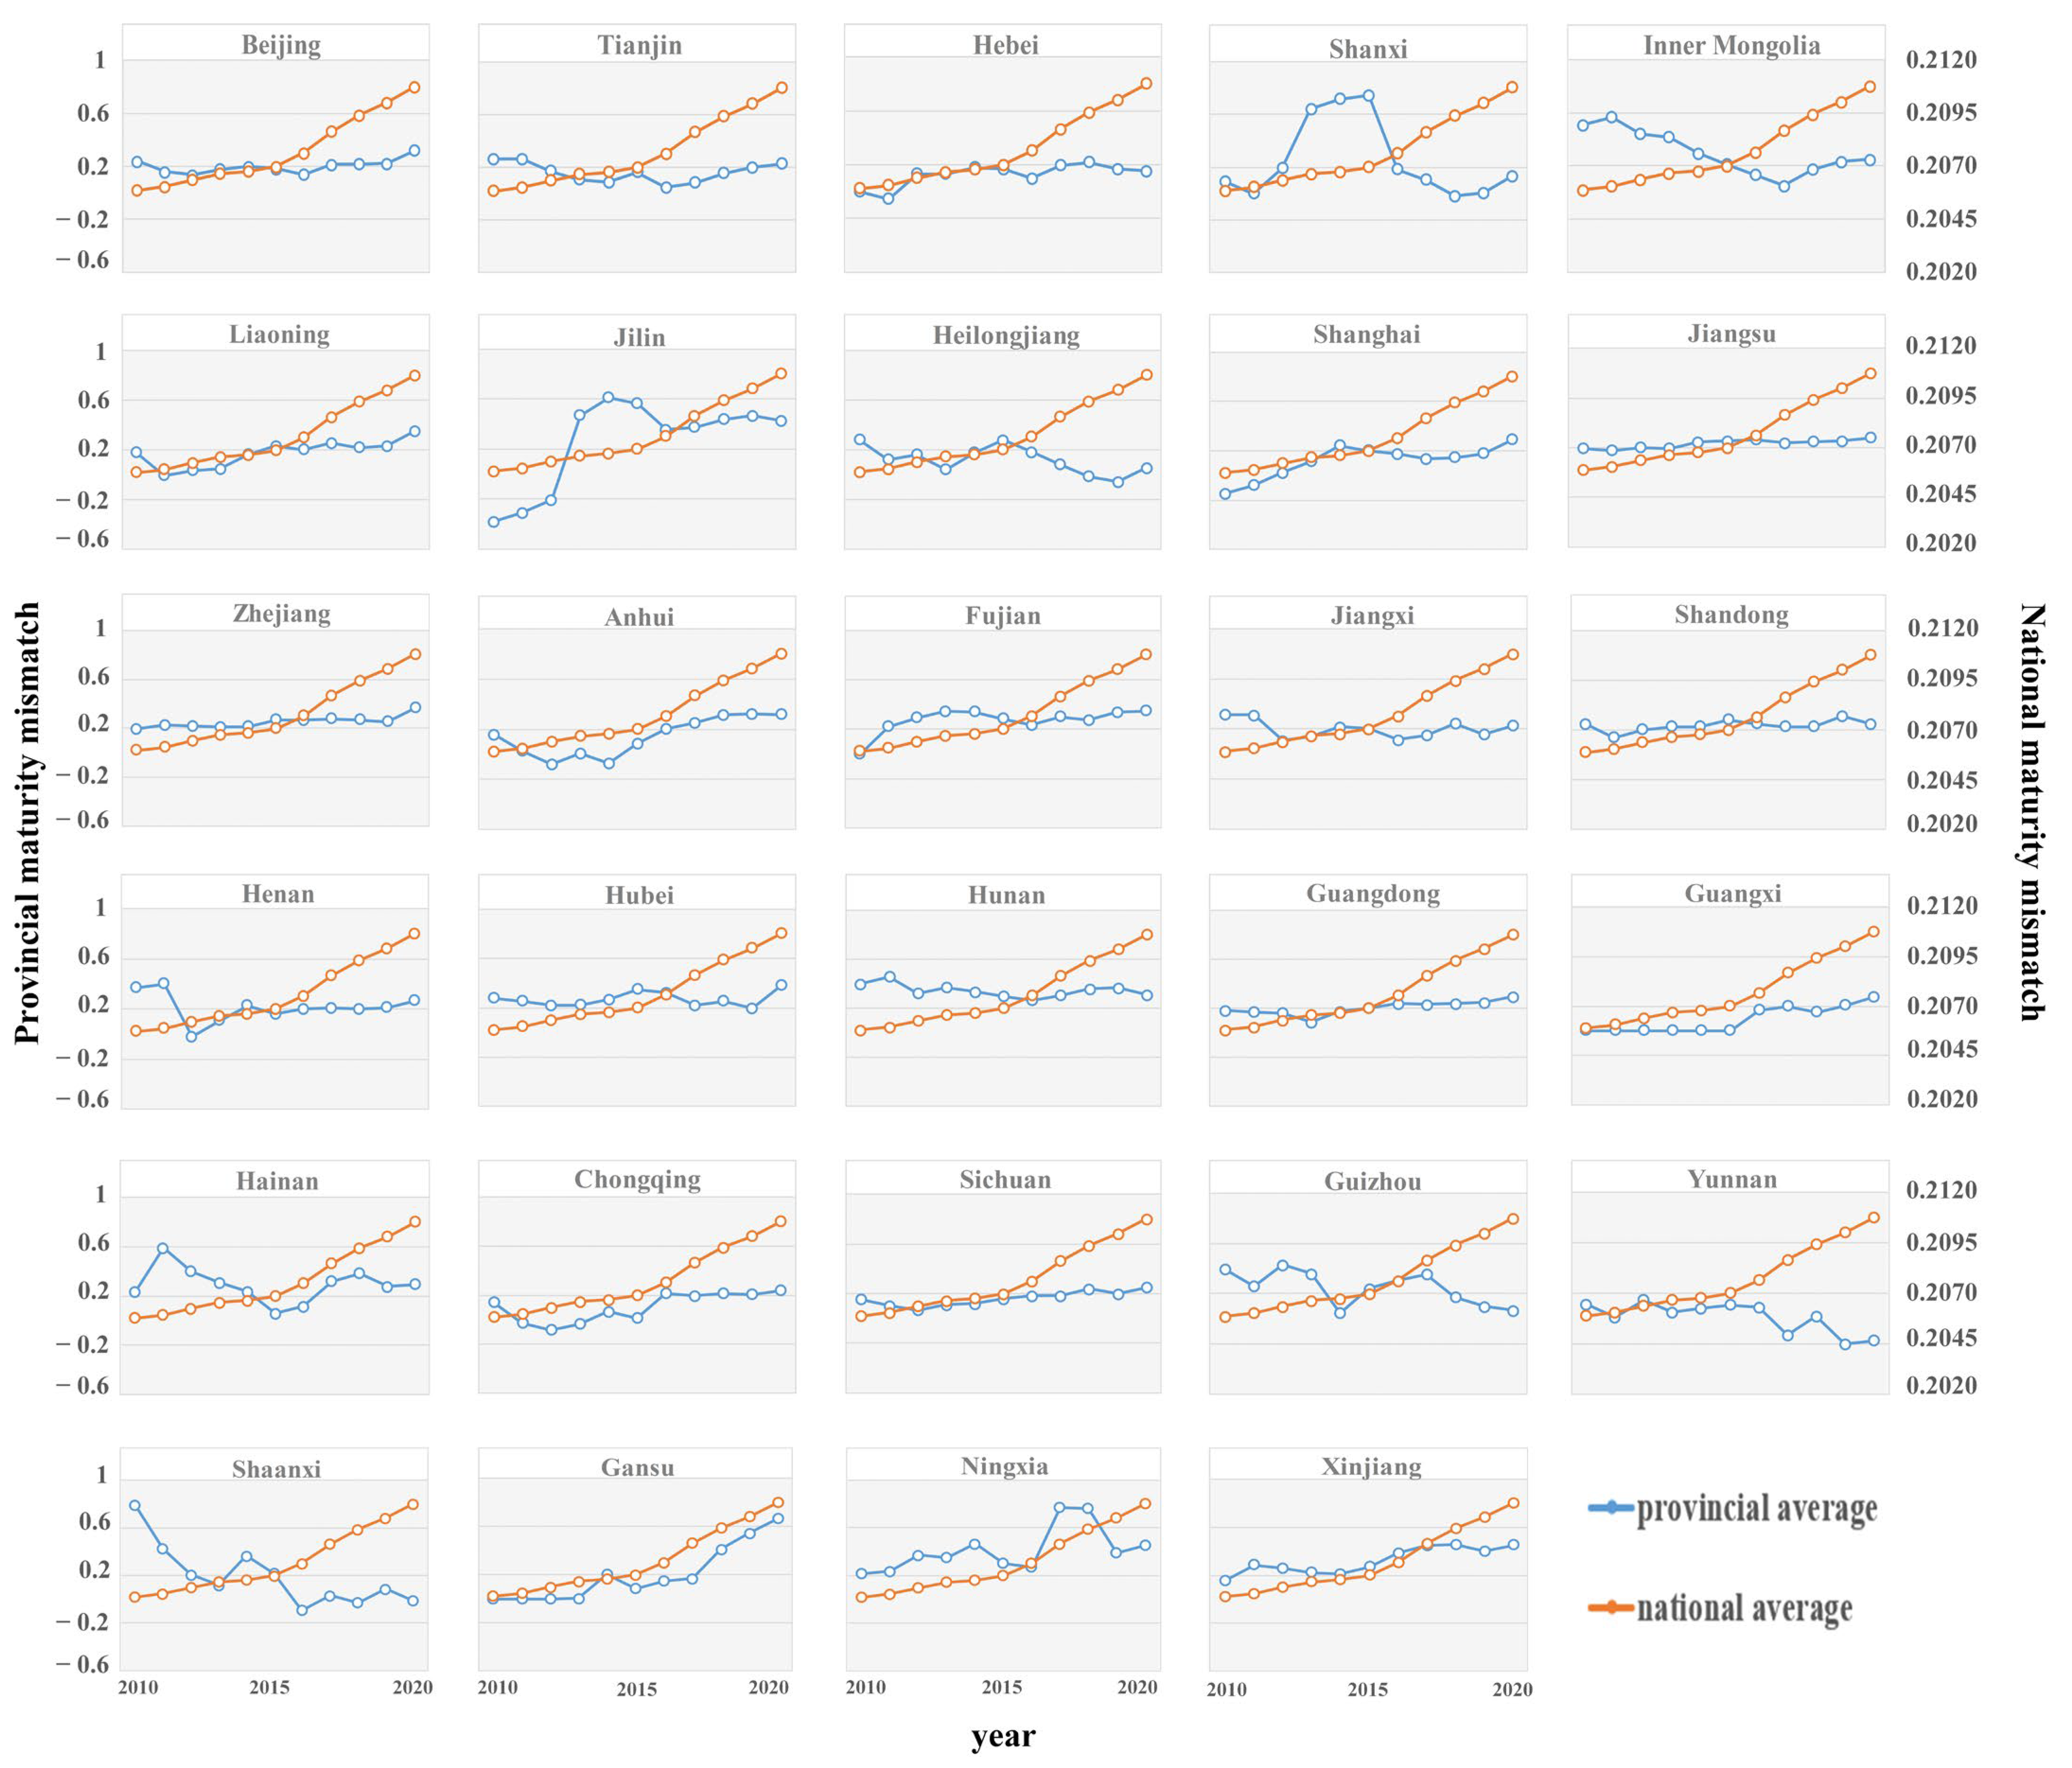
3.2.3. Maturity Mismatch (Mis)

We refer to Liu and Liu’s (2019) method to calculate the maturity mismatch [71]. The difference between the percentage of short-term obligations (short-term liabilities/total liabilities) and the percentage of short-term assets (short-term assets/total assets) is the standard measure of maturity mismatch. This measure reflects the alignment between a company’s debt maturity structure and asset maturity structure. Subsequently, after conducting a screening process using Big Wisdom software (V9.76), listed firms in the cost-effective and environmental conservation sectors are chosen, excluding those classified as Special Treatment (ST) or *ST. These selected companies are further categorized based on their listing regions into their respective provinces. Finally, the maturity mismatch values for each province are calculated by taking the logarithm of the average annual maturity mismatch values. Figure 3 shows the changes in maturity mismatch both across provinces and throughout China as a whole. It is evident that the overall trend is increasing, highlighting the imperative to employ GF as a means to mitigate the occurrence of maturity mismatch. Additionally, the trend of maturity mismatch across the country is even steeper, which may be due to the upward trend of it in different provinces within different intervals, and the larger trend of individual provinces.

3.2.4. Control Variables

Consistent with previous research [72,73], this investigation employs the financial industry output to GDP ratio (lnFinancial) as a control variable. Given the predominant presence of manufacturing industries in the secondary sector, a significant emitter of carbon dioxide, our analysis incorporates the ratio of secondary sector output to total output (lnStructure) as an additional control variable. Additionally, to ensure a holistic evaluation of regional development conditions, several control variables are integrated into the model, including per capita GDP (lnPgdp), total energy consumption (lnEnergy), the ratio of total imports and exports to GDP (lnTrade), and the proportion of the population in higher education (lnEducation). These variables are incorporated to facilitate a comprehensive assessment of the factors influencing the research findings.

3.3. Data Sources and Processing

Within the data sources spanning 29 provinces, various energy consumption levels, regional GDP, the proportion of people in higher education, the ratio of financial industry output, and total imports and exports are obtained from the “China Statistical Yearbook” (2011–2021), the statistical yearbook of each province (2011–2020), and the “China Energy Statistical Yearbook” (2011–2021). The data about GF and maturity mismatch are sourced from provincial statistical yearbooks, the CSMAR Securities database, and the “China Financial Yearbook” (2011–2021). Table 3 displays the descriptive statistics for every variable.

4. Results and Discussion

4.1. Impact of Green Finance on Carbon Emissions

4.1.1. Baseline Regression

The results of the statistical regression analysis are presented in Columns (1)–(4) of Table 4. Additionally, this paper explores the impact of international monetary injections by incorporating the logarithm of the total assets of the US Federal Reserve as a control variable. The regression results for this analysis are displayed in Column (5) of Table 4. Given the implementation of fiscal [74] and monetary policies [75] put forth in response to the COVID-19 crisis, the regression results are further analyzed by excluding data from the year 2020, as indicated in Column (6) of Table 4. Consistently across all columns, the coefficients of GF in the regression models are negative and statistically significant. This indicates that GF plays a significant role in promoting a reduction in carbon emissions, aligning with the findings of Chen and Chen (2021), Lee et al. (2023), Li et al. (2021), Shen et al. (2021), and Zhou and Li (2019), thus consolidating a growing body of research supporting the efficacy of green finance in mitigating environmental impacts [20,21,76,77,78]. GF channels financial resources into green enterprises and facilitates the allocation of capital and production factors toward environmentally sustainable and low-carbon industries [79], thereby contributing to sustainable economic development and a transition in production methods. Consequently, Hypothesis 1 is confirmed.
In addition, this study reports the range of variation in the explained variable when the explanatory and control variables change. As shown in Figure 4, these six plots are similar in that the carbon intensity shrinks significantly as GF increases. This result confirms the findings’ robustness, and it is consistent with the outcomes of the regression presented earlier.

4.1.2. Robustness Tests

1.
Endogeneity test
To address the endogeneity issue, referring to the methods of Xu et al. (2023) and Ran and Zhang (2023), two instrumental variables are adopted in this study [80,81].
Firstly, the instrumental variable used for this study is the distance between each province and the closest port (d). The reasons for our selection of “d” as an instrumental variable are as follows: On the one side, it is relevant to the explanatory variable; if a province is closer to a port, and green finance is increased, then the level of GF will be higher [82]. On the other side, it rigorously demonstrates exogeneity, which is unrelated to the error term. Nonetheless, given the constant distance variable without temporal variation, we multiply it by macro-level fluctuations, specifically the national level of GF within the corresponding timeframe (nation_ (GF)), which is referring to Lee et al. (2023) [83]. Moreover, the macro-regional indicators are not significantly affected by individual provinces [84]. As a result, [(d) * nation_ (GF)], often known as “GF1”, is the first instrumental variable that we have used in our research.
The results are shown in Column (1) of Table 5, where the F-value is greater than 10 and the LM Chi-sq p-value is 0.000, offering quantitative support for the instrumental variable’s validity. In line with the previously indicated research, there is also a negative association between lnGF and GF1, indicating that GF is negatively connected to GF1. In the second stage, the coefficient of lnGF is notably negative, indicating that the primary finding remains solid even after endogeneity has been taken into account.
Secondly, the lagged one-period GF variable (GF2) is used as the second instrumental variable in this study, since there may be a lag in the impact of GF on social and economic activities. The results are shown in Table 5’s Column (2). The first-stage weak instrument test, as indicated by an F-statistic of 46.55, is significantly greater than 10, and the LM Chi-sq p-value is 0.000, meaning that the instrumental variable meets the relevance requirement. The estimation results demonstrate that carbon emissions are considerably reduced through the progression of GF, thus supporting Hypothesis 1.
Lastly, to guarantee that the regression findings are resilient, we concurrently incorporate the aforementioned two instrumental variables. The outcomes are presented in Table 5’s Column (3), thereby further substantiating the robustness of Hypothesis 1.
2.
Replace explained variables
Additionally, the regression analysis is applied to the natural logarithm of per capita carbon emissions ( ln p c ), which is designated as the dependent variable. The outcomes of the regression are displayed in Column (1) of Table 6. It is observed that the regression coefficient associated with GF exhibits a notably negative value, providing strong evidence supporting the reliability and consistency of the findings presented earlier. This negative coefficient underscores the significant impact of GF on the examined variables, reinforcing the validity of the study’s results.
3.
Replace explanatory variables
China set up innovation and green-finance-reform pilot zones in five provinces in 2017. Consequently, we substitute the explanatory variables with the interaction term of policy dummy variables and time dummy variables (gfzone). Table 6 shows the results in Column (2). The GF variable has a negative coefficient that we find to be significant at the 1% level. This result offers compelling evidence for the stability of our conclusions. It underscores the consistent and credible impact of green finance in our research framework.
4.
Replace regression model
Because of the potential presence of autocorrelation in carbon emissions, where the previous period’s carbon emissions may influence the current period’s emissions, the Generalized Method of Moments (GMM) model is employed to calculate how much GF affects carbon emissions. p-values for AR (1) and AR (2) are less than 0.1 and more than 0.1, respectively, as shown in Column (3) of Table 6. This suggests that the null hypothesis, “no autocorrelation in the disturbance term”, is accepted. The p-value of the Hansen test is 1.000, showing that the instrumental variables are genuine. Furthermore, the validity of Hypothesis 1 in this study is further supported by the findings of all three robustness checks, which consistently demonstrate that the coefficient of GF stays strongly negative.
5.
Constructing parameter bounds
Through econometric analysis, we address the potential influence of confounding factors on our findings by employing a parameter bounds methodology, as advocated by Oster (2019), to evaluate the resilience against omitted variable bias [85]. Under the assumption of proportionality between selections based on unobservable factors and those based on observable variables incorporated in our models, we compute the bounding values ( β * ) for our baseline regression estimate. As detailed in Table 7, our bounding value remains negative even under the most conservative scenario, underscoring the robustness of our results.
The bounding value of the Ordinary Least Squares (OLS) estimate ( β * ) is formulated as follows: β * = β ~ ( β ˙ β ~ ) ( R m a x 2 R ~ 2 ) R ~ 2 R ˙ 2 , where β ˙ and R ˙ 2 represent, respectively, the point estimate and R-squared value for the simplified OLS regression, and β ~ and R ~ 2 denote the corresponding values derived from the regression incorporating all controls. This methodology presupposes a proportional relationship between the selection of unobservables and the selection of observables, denoted by (δ = 1), thus necessitating an assumption regarding the maximum attainable R 2 of the regression. We adhere to the calibration method proposed by Dantas et al. (2023), wherein R m a x 2 = min (1,   Π R ~ 2 ) , with Π = 1.3 as our benchmark [86]. Additionally, we explore the robustness of our findings by considering a conservative value of Π = 2.0.

4.2. Heterogeneity Analysis of Green Finance’s Impact on Carbon Emissions

To deepen our comprehension of the connection between GF and carbon emissions, we further examine the disparities in carbon reduction through GF across 29 provinces in China. The 29 provinces are split into two groups: those with high green finance (HGF) and low levels of green finance (LGF). Similarly, using the same criteria, they are divided into two groups: high-energy-consumption structures (HEC) and low-energy-consumption structures (LEC). The trends in carbon intensity from 2010 to 2020 for both groups are illustrated in Figure 5. Both the HGF group and the LEC group exhibit a declining trend. Currently, there remains a notable dearth in research examining the impact of GF on carbon emissions through distinct subgroup analyses pertinent to our study. Hence, our research contributes novel insights into elucidating the relationship between the two variables, thus paving the way for further exploration in this domain. Thus, this study considers grouping regression to explore the heterogeneity of carbon reduction through green finance. Table 8 presents the regression outcomes.

4.2.1. Heterogeneity of the Growth of Green Finance

In Table 8, Column (1) of the regression coefficient for GF is considerably negative, However, Column (2) does not show any significant differences. The above regression results suggest that in comparison with the LGF group, the regression coefficient is notably negative in the HGF group. Therefore, these results support Hypothesis 2 by illustrating the variation in the influence of GF on carbon reduction across different levels of GF. The analysis suggests that provinces with a more advanced development of GF can effectively promote the transition of the financial system towards sustainability and achieve superior outcomes in carbon emission reduction through mechanisms such as directing capital, incentive policies, regulatory reinforcement, and active participation in carbon markets.

4.2.2. Heterogeneity of Energy Consumption Structure

The coefficient of GF shows a statistically significant and negative link within the LEC group, whereas it indicates a negative but non-significant relationship within the HEC group, according to the regression findings in Columns (3) and (4) of Table 8. Thus, our regression results confirm Hypothesis 2. This could be explained by the fact that an LEC group implies the successful progress of new and green energy sources, whereas an HEC group signifies high resource consumption, resulting in green money having a considerable negative influence on carbon emissions in the LEC group. This result highlights the imperative for China to proactively foster the advancement of GF and enhance its energy consumption structure as a means to accomplish its “Dual Carbon” goals [32].

4.3. Mechanisms in Green Finance Carbon Emission Reduction

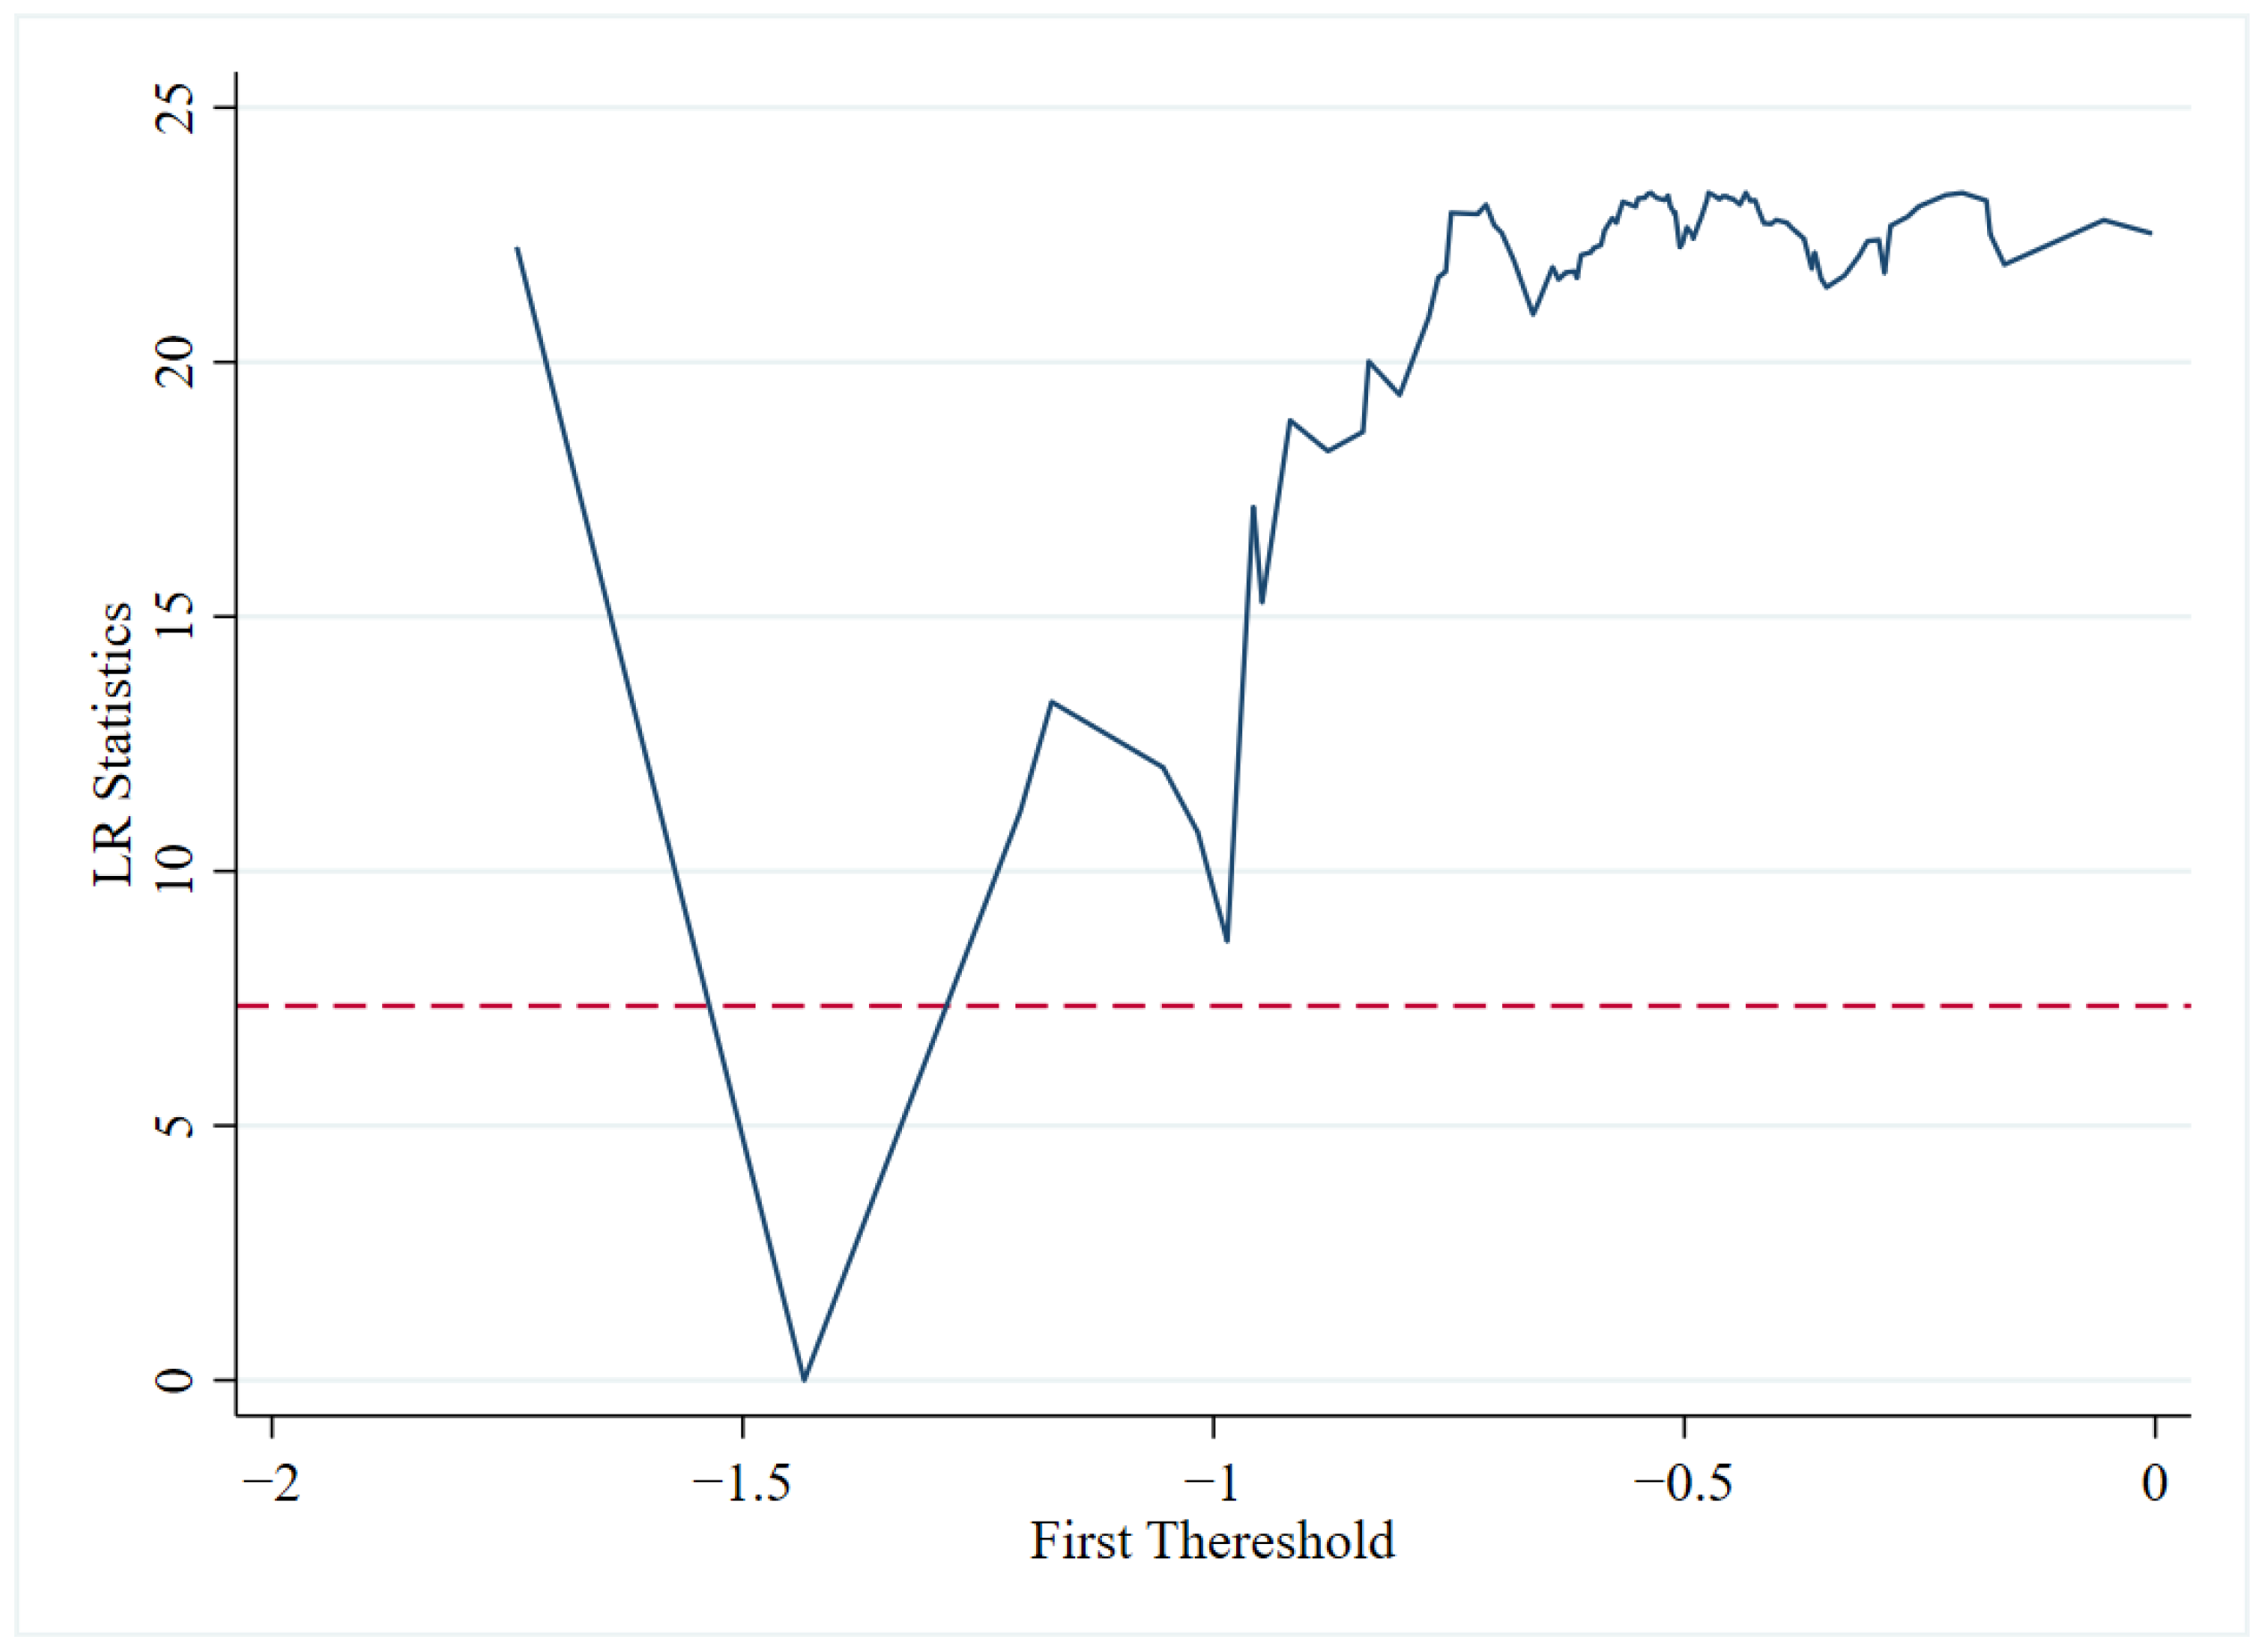
4.3.1. Mechanisms of Maturity Mismatch in Green Finance Carbon Emission Reduction

This study explores the effectiveness of the paths from the standpoint of maturity mismatch in order to analyze the mechanism by which GF encourages carbon reduction, based on Equation (2). The results of the regression are displayed in Column (1) of Table 9. The GMM method is based on the first-order-difference transformation of the original model, and the possible endogeneity problems in the model can be reasonably solved. Hence, we employ the GMM model to re-examine the mechanism of maturity mismatch; the regression outcomes are delineated in Column (2) of Table 9.
In the outcomes of two regression analyses, both the coefficients associated with GF and maturity mismatch exhibit statistically substantial negative values. Furthermore, the interaction terms are also significantly negative. Therefore, the findings both indicate that GF can encourage carbon reduction by mitigating the phenomenon of maturity mismatch in energy-saving and environmental protection firms. Our results validate some viewpoints presented by Wang et al. (2019); based on their research, our study examines the mechanism of maturity mismatch as a GF carbon reduction mechanism based on Wei and Yang’s (2023) evidence that financial resource mismatch increases carbon emissions, so we confirm the validity of Hypothesis 3 [23,87]. The fundamental differences between green enterprises and other enterprises, such as longer investment cycles, higher risks, and uncertain returns, contribute to maturity mismatch in green enterprises, leading to debt crises [22]. Maturity mismatch poses the risk of disrupted funding for energy-saving and environmental protection enterprises. However, under comparable conditions, GF allocates funds towards green enterprises, facilitating investments, addressing maturity mismatch, alleviating debt crises, and permitting the execution of green projects, all of which lead to a reduction in carbon emissions.
To further corroborate our results, we use a threshold model to study the role of the maturity mismatch mechanism. Before estimating the threshold model, the tests show that the threshold variable fails the double and triple-threshold tests but greatly passes the single-threshold test. As shown in Figure 6, the threshold value at the lowest point is −1.4348, and the graph shows an opposite trend around the threshold value, which is significant at the 5% level, passing the single-threshold test. Hence, this study uses a single threshold as an example. Equation (4) displays its model; I (·) is a function that serves as an indicator and accepts the values 1 or 0, satisfying the conditions in parentheses if it is 1, and not if 0; m represents the threshold variable; and we use the maturity mismatch as the threshold variable. Moreover, the other symbols have the same meaning as above. Column (3) of Table 9 displays the regression findings, confirming Hypothesis 3 by showing that the deterrent impact of GF on CO2 emissions is larger when the threshold value is not exceeded.
l n C i , t = λ 0 + λ 1 l n G F i , t × I m i , t γ + λ 2 l n G F i , t × I m i , t > γ + λ 3 l n X i , t +   y e a r t + r e g i o n i + ε i , t  

4.3.2. Mechanisms of Rationalization of Industrial Structure in Green Finance Carbon Emission Reduction

We further explore the mechanism of green finance in reducing carbon emissions. The intervention of green finance provides financial support and services for environmental protection and renewable industries [66], enabling them to gain advantages in market competition. Such support facilitates the growth and expansion of these industries, thereby driving the overall industrial structure towards environmental protection and in a low-carbon direction, reducing the proportion of high-carbon industries. This study explores the effectiveness of the paths from the standpoint of the rationalization of an industrial structure in order to analyze the other mechanism by which GF encourages carbon reduction, based on Equation (6). Moreover, the other symbols have the same meaning as above.
I S R = 1 / T L = 1 / i = 0 n ( Y i / Y ) ln ( Y i / Y L i / L )
l n C i , t = β 0 + β 1 l n G F i , t + β 2 l n G F i , t I S R i , t + β 3 I S R i , t + β 4 l n X i , t + y e a r t + r e g i o n i + ε i . t  
The rationalization of a regional industrial structure is mainly manifested in the enhanced coordination and increased level of inter-relation among industries within the region. Therefore, the measurement of regional industrial structure rationalization generally adopts the structural deviation index. Referring to Hu et al. (2023), this study uses the Theil index to measure the level of industrial structure rationalization ( I S R ) [88]. Equation (5) displays its mode, where Y represents the total output value of each province, L represents the total employment in each province, Y i is the added value of industry i , L i represents employment in industry i , n represents the number of sectors, Y i / Y represents the output structure, and L i / L represents the employment structure. The ratio of output structure to employment structure reflects their coupling. When T L is not zero, it indicates that the industrial structure deviates from the equilibrium.
The findings from the regression analysis are presented in Column (4) of Table 9. Notably, the interaction term coefficient exhibits a statistically significant positive association, whereas the core explanatory variable coefficient exhibits a statistically significant negative association. This indicates that the GF has the potential to mitigate carbon emissions by fostering greater rationalization in the industrial structure. The aforementioned findings substantiate some of Hu et al.’s (2023) perspectives [88]. Furthermore, we also discover that industrial structural rationalization serves as another mechanism through which GF facilitates carbon emission reduction.

4.4. Further Analysis: Whether Green Finance Can Promote Synergies in Reducing Pollution and Carbon

GF, regarded as an innovative financial tool fostering environmental conservation and sustainable development [26], incorporates into it the consideration of negative externalities impacting the environment. It is expected to exert a constraining influence on carbon and other pollutant emissions. To further explore GF’s effect on additional environmental pollutants, our study adopts the methodology proposed by He et al. (2023) and employs PM2.5 and SO2 as proxy variables for atmospheric pollutants, as delineated in Equation (7) [62]. The empirical findings presented in Table 10 corroborate the conclusions drawn by Zhou and Tang (2022) and Zhang et al. (2023), indicating a significant facilitation in the reduction in both pollutants [89,90]. Furthermore, it is plausible to infer that GF can facilitate the mitigation of other pollutants alongside carbon emissions. Additionally, we introduce an interaction term between GF and maturity mismatch, in conjunction with the maturity mismatch variable itself (Equation (8)), to scrutinize whether maturity mismatch plays a role in the abatement of pollutant emissions facilitated by GF. The symbols utilized in Equations (7) and (8) correspond to those in Equations (1) and (2). Regression outcomes reveal that the mechanism of maturity mismatch contributes to the reduction in SO2 emissions promoted by GF, whereas its impact is not statistically significant in the case of PM2.5 reduction. This disparity can be attributed to the persistent prominence of PM2.5 as a critical air pollutant in China [91], stemming from intricate chemical reactions emanating from diverse fuel sources [92]. Consequently, green financing may not fully alleviate the issue of maturity mismatch in advancing PM2.5 reduction. Nevertheless, since SO2 represents a significant byproduct of chemical and fuel plants, it aligns well with GF initiatives aimed at transforming polluting enterprises and upgrading clean energy technologies [93]. Consequently, SO2 is more susceptible to the impacts of GF in mitigating funding mismatches in the short term.
l n P M 2.5   i , t / l n S O 2   i , t = α 0 + α 1 l n G F i , t + α 2 l n X i , t + y e a r t + r e g i o n i + ε i , t  
l n P M 2.5   i , t / l n S O 2   i , t = β 0 + β 1 l n G F i , t + β 2 l n G F i , t l n M i s i , t + β 3 l n M i s i , t + β 4 l n X i , t + y e a r t + r e g i o n i + ε i , t    

5. Conclusion and Policy Implications

5.1. Conclusions

Financial resources are allocated effectively by GF. As a crucial contributor to environmental issues, carbon emissions are also subject to the influence of GF, which provides fresh insights for achieving China’s low-carbon economic transformation. Although significant attempts have been made to investigate the connection between carbon emissions and GF, the literature on the microcosmic mechanisms is noticeably lacking. Therefore, this study intends to close this gap by exploring its intrinsic mechanisms in maturity mismatch.
These are the primary conclusions drawn from this study. Firstly, the results reveal a gradual improvement in GF’s progress from 2010 to 2020, although substantial variations exist among provinces. Secondly, the findings of the benchmark regression show that carbon emissions can be considerably decreased by green financing. This impact remains valid even after conducting 2SLS regressions with diverse instrumental variables, substituting the dependent variable and the explanatory variable, and applying the GMM model for empirical assessment. Thirdly, according to the heterogeneity results, the HGF group and the LEC group have a more marked carbon reduction effect. After that, the mechanism testing demonstrates that GF can reduce the maturity mismatch of green environmental enterprises, and increase the level of industrial structure rationalization, hence reducing carbon emissions. Furthermore, our analysis reveals that GF can significantly promote synergies in reducing pollution and carbon; in particular, the maturity mismatch plays a key role in the reduction in SO2 emissions.

5.2. Policy Implications

Firstly, enhancing the promotion of green finance and increasing public knowledge of it are necessary. As the primary forces advancing GF, financial institutions and enterprises in most countries lack strategic preparation for it. Therefore, promotion departments should take on the main responsibility of developing GF, enabling financial institutions, enterprises, and wider society to fully recognize its significance for development.
Secondly, it is imperative to further facilitate the diversification of financing channels for green firms and strengthen information disclosure to alleviate financing constraints. In the long haul, the funding of green businesses and the growth of green initiatives have been hampered by maturity mismatch. Enhancing the information disclosure mechanism for green enterprises, facilitating their access to a broader range of financing channels, and mitigating the issue of information asymmetry between financial institutions and enterprises are imperative. This will make it possible for green financial instruments to help green businesses overcome obstacles to funding, free up capital, and offer long-term loans that promote the economy’s low-carbon expansion.
Finally, the government’s macroeconomic regulations need to be reinforced in order to optimize the carbon reduction impact of green funding. We discovered that the level to which GF and energy consumption systems are developed can significantly impact the degree to which GF reduces carbon emissions. Consequently, it is essential to maximize the dual function of government action even more. This puts in place clear rules and guidelines with the intention of encouraging investors and financial institutions to put more money into low-carbon technology. Ultimately, the government should promise to a certain degree to safeguard the banks in China that provide financing for green projects, ensuring their ability to maintain sound financial conditions while extending financing to enterprises. Simultaneously, the government should also implement measures to ensure that enterprises can access green project financing across various maturity periods tailored to their needs. In doing so, not only can the development of green projects be facilitated, but also the stability of the financial system can be enhanced, mitigating the issue of mismatched maturity periods for corporate debt.

5.3. Limitations and Future Research

While this study contributes to understanding the mechanisms through which GF promotes carbon reduction in China, there are still unresolved issues that warrant further investigation. Firstly, as a quantitative analysis, this study concludes that GF helps lower carbon emissions. However, it primarily explores the threshold model, leaving other forms of nonlinear analysis largely unexplored. Future studies should examine further the possible nonlinear connections between them. Secondly, this study primarily focuses on panel data from Chinese provinces. So, exploring the discussion at the micro-level for individual enterprises is a promising direction for future research. Investigating the specific impacts of GF on carbon emission reduction within individual enterprises would give a more detailed explanation of the mechanisms at work. Addressing these unresolved issues through further research would improve our comprehension of the intricate interplay between GF and reducing carbon emissions, allowing for more comprehensive and nuanced policy recommendations in the pursuit of sustainability.

Author Contributions

X.L.: Conceptualization, Methodology, Software, Writing—original draft; J.C.: Supervision, Validation, Reviewing, and Editing; Y.W.: Validation, Reviewing, and Editing; X.Y. and J.S.: Software, Reviewing, and Editing; P.G.: Data curation, Visualization. All authors have read and agreed to the published version of the manuscript.

Funding

This research was supported by the National Natural Science Foundation of China (Grant No. 42001257). We also thank the anonymous commentators and editors for their helpful suggestions.

Institutional Review Board Statement

Not applicable.

Informed Consent Statement

Not applicable.

Data Availability Statement

Data are available from the authors upon request.

Conflicts of Interest

The authors declare no conflict of interest.

References

  1. Safiullah, M.; Alam, M.S.; Islam, M.S. Do all institutional investors care about corporate carbon emissions? Energy Econ. 2022, 115, 106376. [Google Scholar] [CrossRef]
  2. Chen, J.; Li, J.; Li, G.; Zhang, J. How to recognize and characterize land use-based carbon emissions within city networks in the Beijing-Tianjin-Hebei region of China. Urban Clim. 2024, 53, 101789. [Google Scholar] [CrossRef]
  3. Shang, W.-L.; Song, X.; Chen, Y.; Yang, X.; Liang, L.; Deveci, M.; Cao, M.; Xiang, Q.; Yu, Q. Congestion and Pollutant Emission Analysis of Urban Road Networks Based on Floating Vehicle Data. Urban Clim. 2024, 53, 101794. [Google Scholar] [CrossRef]
  4. Lee, C.-C.; Lee, C.-C. How does green finance affect green total factor productivity? Evidence from China. Energy Econ. 2022, 107, 105863. [Google Scholar] [CrossRef]
  5. Xu, Y.; Li, S.; Zhou, X.; Shahzad, U.; Zhao, X. How environmental regulations affect the development of green finance: Recent evidence from polluting firms in China. Renew. Energy 2022, 189, 917–926. [Google Scholar] [CrossRef]
  6. Wang, H.; Gu, K.; Sun, H.; Xiao, H. Reconfirmation of the symbiosis on carbon emissions and air pollution: A spatial spillover perspective. Sci. Total Environ. 2023, 858, 159906. [Google Scholar] [CrossRef] [PubMed]
  7. Tian, Y.; Li, L. Will COVID-19 affect China’s peak CO2 emissions in 2030? An analysis based on the systems dynamics model of green finance. J. Clean. Prod. 2022, 356, 131777. [Google Scholar] [CrossRef]
  8. Lv, C.; Bian, B.; Lee, C.-C.; He, Z. Regional gap and the trend of green finance development in China. Energy Econ. 2021, 102, 105476. [Google Scholar] [CrossRef]
  9. Zhang, H.; Geng, C.; Wei, J. Coordinated development between green finance and environmental performance in China: The spatial-temporal difference and driving factors. J. Clean. Prod. 2022, 346, 131150. [Google Scholar] [CrossRef]
  10. Gao, Y.; Sheng, Z.Z. The Carbon Emission Reduction Effect of Green Financial Reform Policies. China Environ. Sci. 2022, 42, 4849–4859. (In Chinese) [Google Scholar] [CrossRef]
  11. He, Y.; Liu, R. The impact of the level of green finance development on corporate debt financing capacity. Financ. Res. Lett. 2023, 52, 103552. [Google Scholar] [CrossRef]
  12. Hepburn, C.; Qi, Y.; Stern, N.; Ward, B.; Xie, C.; Zenghelis, D. Towards carbon neutrality and China’s 14th Five-Year Plan: Clean energy transition, sustainable urban development, and investment priorities. Environ. Sci. Ecotechnol. 2021, 8, 100130. [Google Scholar] [CrossRef] [PubMed]
  13. Huang, J.; An, L.; Peng, W.; Guo, L. Identifying the role of green financial development played in carbon intensity: Evidence from China. J. Clean. Prod. 2023, 408, 136943. [Google Scholar] [CrossRef]
  14. Sun, Y.; Guan, W.; Cao, Y.; Bao, Q. Role of green finance policy in renewable energy deployment for carbon neutrality: Evidence from China. Renew. Energy 2022, 197, 643–653. [Google Scholar] [CrossRef]
  15. Wang, J.; Tian, J.; Kang, Y.; Guo, K. Can green finance development abate carbon emissions: Evidence from China. Int. Rev. Econ. Financ. 2023, 88, 73–91. [Google Scholar] [CrossRef]
  16. Li, S.; Shao, Q. Greening the finance for climate mitigation: An ARDL–ECM approach. Renew. Energy 2022, 199, 1469–1481. [Google Scholar] [CrossRef]
  17. Wang, Y.; Wang, T.; Chen, L. Maturity mismatches of Chinese listed firms. Pac.-Basin Financ. J. 2021, 70, 101680. [Google Scholar] [CrossRef]
  18. Gong, Y.; Wei, X. Asset quality, debt maturity, and market liquidity. Financ. Res. Lett. 2019, 31, 285–293. [Google Scholar] [CrossRef]
  19. Diamond, D.W.; Dybvig, P.H. Bank Runs, Deposit Insurance, and Liquidity. J. Political Econ. 1983, 91, 401–419. [Google Scholar] [CrossRef]
  20. Chen, X.; Chen, Z. Can Green Finance Development Reduce Carbon Emissions? Empirical Evidence from 30 Chinese Provinces. Sustainability 2021, 13, 12137. [Google Scholar] [CrossRef]
  21. Lee, C.-C.; Wang, F.; Lou, R.; Wang, K. How does green finance drive the decarbonization of the economy? Empirical evidence from China. Renew. Energy 2023, 204, 671–684. [Google Scholar] [CrossRef]
  22. Xie, D.; Hu, S. Green Finance, Maturity Mismatch and Green Total Factor Productivity. Soft Sci. 2022, 8, 16. (In Chinese) [Google Scholar] [CrossRef]
  23. Wang, K.; Sun, X.; Wang, F. Green Financial Development, Debt Maturity Structure and Green Corporate Investment. Financ. Forum 2019, 24, 9–19. (In Chinese) [Google Scholar] [CrossRef]
  24. Wu, J.Y.; Opare, S.; Bhuiyan, M.B.U.; Habib, A. Determinants and consequences of debt maturity structure: A systematic review of the international literature. Int. Rev. Financ. Anal. 2022, 84, 102423. [Google Scholar] [CrossRef]
  25. Bhatnagar, S.; Sharma, D. Evolution of green finance and its enablers: A bibliometric analysis. Renew. Sustain. Energy Rev. 2022, 162, 112405. [Google Scholar] [CrossRef]
  26. Lan, J.; Wei, Y.; Guo, J.; Li, Q.; Liu, Z. The effect of green finance on industrial pollution emissions: Evidence from China. Resour. Policy 2023, 80, 103156. [Google Scholar] [CrossRef]
  27. Geng, Q.; Wang, Y.; Wang, X. The impact of natural resource endowment and green finance on green economic efficiency in the context of COP26. Resour. Policy 2023, 80, 103246. [Google Scholar] [CrossRef]
  28. Zhang, D.; Mohsin, M.; Taghizadeh-Hesary, F. Does green finance counteract the climate change mitigation: Asymmetric effect of renewable energy investment and R&D. Energy Econ. 2022, 113, 106183. [Google Scholar] [CrossRef]
  29. Qin, M.; Zhang, X.; Li, Y.; Badarcea, R.M. Blockchain market and green finance: The enablers of carbon neutrality in China. Energy Econ. 2023, 118, 106501. [Google Scholar] [CrossRef]
  30. Pang, L.; Zhu, M.N.; Yu, H. Is green finance really a blessing for green technology and carbon efficiency? Energy Econ. 2022, 114, 106272. [Google Scholar] [CrossRef]
  31. Sun, H.; Chen, F. The impact of green finance on China’s regional energy consumption structure based on system GMM. Resour. Policy 2022, 76, 102588. [Google Scholar] [CrossRef]
  32. Liu, Q.; Tang, L. Research on the accelerating effect of green finance on the transformation of energy consumption in China. Res. Int. Bus. Financ. 2022, 63, 101771. [Google Scholar] [CrossRef]
  33. Wang, R.; Zhao, X.; Zhang, L. Research on the impact of green finance and abundance of natural resources on China’s regional eco-efficiency. Resour. Policy 2022, 76, 102579. [Google Scholar] [CrossRef]
  34. Zhou, H.; Xu, G. Research on the impact of green finance on China’s regional ecological development based on system GMM model. Resour. Policy 2022, 75, 102454. [Google Scholar] [CrossRef]
  35. Wang, Z.; Wang, X. Research on the impact of green finance on energy efficiency in different regions of China based on the DEA-Tobit model. Resour. Policy 2022, 77, 102695. [Google Scholar] [CrossRef]
  36. Wang, F.; Wang, R.; He, Z. The impact of environmental pollution and green finance on the high-quality development of energy based on spatial Dubin model. Resour. Policy 2021, 74, 102451. [Google Scholar] [CrossRef]
  37. Yin, X.; Xu, Z. An empirical analysis of the coupling and coordinative development of China’s green finance and economic growth. Resour. Policy 2022, 75, 102476. [Google Scholar] [CrossRef]
  38. Yang, Y.; Su, X.; Yao, S. Nexus between green finance, fintech, and high-quality economic development: Empirical evidence from China. Resour. Policy 2021, 74, 102445. [Google Scholar] [CrossRef]
  39. Saeed Meo, M.; Karim, M.Z.A. The role of green finance in reducing CO2 emissions: An empirical analysis. Borsa Istanb. Rev. 2022, 22, 169–178. [Google Scholar] [CrossRef]
  40. Bakry, W.; Mallik, G.; Nghiem, X.-H.; Sinha, A.; Vo, X.V. Is green finance really “green”? Examining the long-run relationship between green finance, renewable energy and environmental performance in developing countries. Renew. Energy 2023, 208, 341–355. [Google Scholar] [CrossRef]
  41. Zhou, M.; Li, X. Influence of green finance and renewable energy resources over the sustainable development goal of clean energy in China. Resour. Policy 2022, 78, 102816. [Google Scholar] [CrossRef]
  42. Ren, X.; Shao, Q.; Zhong, R. Nexus between green finance, non-fossil energy use, and carbon intensity: Empirical evidence from China based on a vector error correction model. J. Clean. Prod. 2020, 277, 122844. [Google Scholar] [CrossRef]
  43. Al Mamun, M.; Boubaker, S.; Nguyen, D.K. Green finance and decarbonization: Evidence from around the world. Financ. Res. Lett. 2022, 46, 102807. [Google Scholar] [CrossRef]
  44. Chai, S.; Zhang, K.; Wei, W.; Ma, W.; Abedin, M.Z. The impact of green credit policy on enterprises’ financing behavior: Evidence from Chinese heavily-polluting listed companies. J. Clean. Prod. 2022, 363, 132458. [Google Scholar] [CrossRef]
  45. Irfan, M.; Razzaq, A.; Sharif, A.; Yang, X. Influence mechanism between green finance and green innovation: Exploring regional policy intervention effects in China. Technol. Forecast. Soc. Chang. 2022, 182, 121882. [Google Scholar] [CrossRef]
  46. Huang, Y.; Chen, C.; Lei, L.; Zhang, Y. Impacts of green finance on green innovation: A spatial and nonlinear perspective. J. Clean. Prod. 2022, 365, 132548. [Google Scholar] [CrossRef]
  47. Shui, B. Major risk shocks, financial relief policies and loan maturity for MSMEs: Evidence from China. Financ. Res. Lett. 2023, 55, 103903. [Google Scholar] [CrossRef]
  48. Ee, M.S.; Huang, H.; Cheng, M. Do labor mobility restrictions affect debt maturity? J. Financ. Stab. 2023, 66, 101121. [Google Scholar] [CrossRef]
  49. Li, X.; Su, D. Surges and instability: The maturity shortening channel. J. Int. Econ. 2022, 139, 103679. [Google Scholar] [CrossRef]
  50. Si, D.-K.; Wang, M.; Ding, H. Capital account liberalization and corporate maturity mismatch: The role of bank competition. Pac.-Basin Financ. J. 2023, 82, 102137. [Google Scholar] [CrossRef]
  51. Li, J.; Ye, Y.; Li, J. Performance feedback and corporate maturity mismatch: Evidence from China. Res. Int. Bus. Financ. 2024, 67, 102109. [Google Scholar] [CrossRef]
  52. Wang, X. A macro-financial perspective to analyse maturity mismatch and default. J. Bank. Financ. 2023, 151, 106468. [Google Scholar] [CrossRef]
  53. Hu, Y.; Che, D.; Wu, F.; Chang, X. Corporate maturity mismatch and enterprise digital transformation: Evidence from China. Financ. Res. Lett. 2023, 53, 103677. [Google Scholar] [CrossRef]
  54. Xu, M.; Yang, Z.; Lin, Y.-E.; Li, G. Maturity mismatched investment, digital financial inclusion, and digital orientation: Evidence from China. Int. Rev. Financ. Anal. 2024, 91, 102957. [Google Scholar] [CrossRef]
  55. Zhitao, W.; Xiang, M. Financial mismatch on corporate debt default risk: Evidence from China. Pac.-Basin Financ. J. 2023, 80, 102077. [Google Scholar] [CrossRef]
  56. Luo, R.; Fang, H.; Liu, J.; Zhao, S. Maturity mismatch and incentives: Evidence from bank issued wealth management products in China. J. Bank. Financ. 2019, 107, 105615. [Google Scholar] [CrossRef]
  57. Li, Y.; Yu, C.; Shi, J.; Liu, Y. How does green bond issuance affect total factor productivity? Evidence from Chinese listed enterprises. Energy Econ. 2023, 123, 106755. [Google Scholar] [CrossRef]
  58. Zhang, S.; Wu, Z.; Wang, Y.; Hao, Y. Fostering green development with green finance: An empirical study on the environmental effect of green credit policy in China. J. Environ. Manag. 2021, 296, 113159. [Google Scholar] [CrossRef]
  59. Wang, T.; Liu, X.; Wang, H. Green bonds, financing constraints, and green innovation. J. Clean. Prod. 2022, 381, 135134. [Google Scholar] [CrossRef]
  60. Sheng, C.; Zhang, D.; Wang, G.; Huang, Y. Research on risk mechanism of China’s carbon financial market development from the perspective of ecological civilization. J. Comput. Appl. Math. 2021, 381, 112990. [Google Scholar] [CrossRef]
  61. Ding, Q.; Huang, J.; Chen, J. Does digital finance matter for corporate green investment? Evidence from heavily polluting industries in China. Energy Econ. 2023, 117, 106476. [Google Scholar] [CrossRef]
  62. He, N.; Zeng, S.; Jin, G. Achieving synergy between carbon mitigation and pollution reduction: Does green finance matter? J. Environ. Manag. 2023, 342, 118356. [Google Scholar] [CrossRef] [PubMed]
  63. Xu, J.; Chen, F.; Zhang, W.; Liu, Y.; Li, T. Analysis of the carbon emission reduction effect of Fintech and the transmission channel of green finance. Financ. Res. Lett. 2023, 56, 104127. [Google Scholar] [CrossRef]
  64. Guo, Q.-T.; Dong, Y.; Feng, B.; Zhang, H. Can green finance development promote total-factor energy efficiency? Empirical evidence from China based on a spatial Durbin model. Energy Policy 2023, 177, 113523. [Google Scholar] [CrossRef]
  65. Ma, S.; Peng, Y.; Wu, W.; Zhu, F. Bank liquidity hoarding and corporate maturity mismatch: Evidence from China. Res. Int. Bus. Financ. 2022, 63, 101776. [Google Scholar] [CrossRef]
  66. Madaleno, M.; Dogan, E.; Taskin, D. A step forward on sustainability: The nexus of environmental responsibility, green technology, clean energy and green finance. Energy Econ. 2022, 109, 105945. [Google Scholar] [CrossRef]
  67. Cao, Y.; Zhang, Y.; Yang, L.; Li, R.Y.M.; Crabbe, M.J.C. Green Credit Policy and Maturity Mismatch Risk in Polluting and Non-Polluting Companies. Sustainability 2021, 13, 3615. [Google Scholar] [CrossRef]
  68. Shi, J.; Yu, C.; Li, Y.; Wang, T. Does green financial policy affect debt-financing cost of heavy-polluting enterprises? An empirical evidence based on Chinese pilot zones for green finance reform and innovations. Technol. Forecast. Soc. Chang. 2022, 179, 121678. [Google Scholar] [CrossRef]
  69. Yang, Z.; Gao, W.; Han, Q.; Qi, L.; Cui, Y.; Chen, Y. Digitalization and carbon emissions: How does digital city construction affect China’s carbon emission reduction? Sustain. Cities Soc. 2022, 87, 104201. [Google Scholar] [CrossRef]
  70. Zhang, Z.; Hao, L.; Linghu, Y.; Yi, H. Research on the energy poverty reduction effects of green finance in the context of economic policy uncertainty. J. Clean. Prod. 2023, 410, 137287. [Google Scholar] [CrossRef]
  71. Liu, X.; Liu, Y. Leverage, Short Debt Longevity and Corporate Performance. Econ. Res. 2019, 54, 127–141. (In Chinese) [Google Scholar]
  72. Gu, G.; Zheng, H.; Tong, L.; Dai, Y. Does carbon financial market as an environmental regulation policy tool promote regional energy conservation and emission reduction? Empirical evidence from China. Energy Policy 2022, 163, 112826. [Google Scholar] [CrossRef]
  73. Wan, Q.; Qian, J.; Baghirli, A.; Aghayev, A. Green finance and carbon reduction: Implications for green recovery. Econ. Anal. Policy 2022, 76, 901–913. [Google Scholar] [CrossRef]
  74. Benmelech, E.; Tzur-Ilan, N. The Determinants of Fiscal and Monetary Policies during the COVID19 Crisis; NBER Working Paper No. 27461; National Bureau of Economic Research: Cambridge, MA, USA, 2020. [Google Scholar] [CrossRef]
  75. Cortes, G.S.; Gao, G.P.; Silva, F.B.; Song, Z. Unconventional monetary policy and disaster risk: Evidence from the subprime and COVID-19 crises. J. Int. Money Financ. 2022, 122, 102543. [Google Scholar] [CrossRef] [PubMed]
  76. Li, Z.-Z.; Li, R.Y.M.; Malik, M.Y.; Murshed, M.; Khan, Z.; Umar, M. Determinants of Carbon Emission in China: How Good is Green Investment? Sustain. Prod. Consum. 2021, 27, 392–401. [Google Scholar] [CrossRef]
  77. Shen, Y.; Su, Z.W.; Malik, M.Y.; Umar, M.; Khan, Z.; Khan, M. Does green investment, financial development and natural resources rent limit carbon emissions? A provincial panel analysis of China. Sci. Total Environ. 2021, 755, 142538. [Google Scholar] [CrossRef] [PubMed]
  78. Zhou, K.; Li, Y. Carbon finance and carbon market in China: Progress and challenges. J. Clean. Prod. 2019, 214, 536–549. [Google Scholar] [CrossRef]
  79. Peng, W.; Lu, S.; Lu, W. Green financing for the establishment of renewable resources under carbon emission regulation. Renew. Energy 2022, 199, 1210–1225. [Google Scholar] [CrossRef]
  80. Xu, J.; Wang, J.; Li, R.; Gu, M. Is green finance fostering high-quality energy development in China? A spatial spillover perspective. Energy Strategy Rev. 2023, 50, 101201. [Google Scholar] [CrossRef]
  81. Ran, C.; Zhang, Y. The driving force of carbon emissions reduction in China: Does green finance work. J. Clean. Prod. 2023, 421, 138502. [Google Scholar] [CrossRef]
  82. Yan, X.; Yang, C.; Zhang, R. How does green finance derive the resource efficiency and decarbonization of the economy? Resour. Policy 2023, 85, 103934. [Google Scholar] [CrossRef]
  83. Lee, C.-C.; Wang, F.; Chang, Y.-F. Does green finance promote renewable energy? Evidence from China. Resour. Policy 2023, 82, 103439. [Google Scholar] [CrossRef]
  84. Lee, C.-C.; Wang, F. How does digital inclusive finance affect carbon intensity? Econ. Anal. Policy 2022, 75, 174–190. [Google Scholar] [CrossRef]
  85. Oster, E. Unobservable Selection and Coefficient Stability: Theory and Evidence. J. Bus. Econ. Stat. 2019, 37, 187–204. [Google Scholar] [CrossRef]
  86. Dantas, M.M.; Merkley, K.J.; Silva, F.B.G. Government Guarantees and Banks’ Income Smoothing. J. Financ. Serv. Res. 2023, 63, 123–173. [Google Scholar] [CrossRef]
  87. Wei, L.; Yang, Y. Research on the Impact of Mismatching Financial Resources on Carbon Emissions—Based on the perspective of green credit. J. Northwest Norm. Univ. (Soc. Sci.) 2023, 60, 126–133. (In Chinese) [Google Scholar] [CrossRef]
  88. Hu, L.; Yuan, W.; Jiang, J.; Ma, T.; Zhu, S. Asymmetric effects of industrial structure rationalization on carbon emissions: Evidence from thirty Chinese provinces. J. Clean. Prod. 2023, 428, 139347. [Google Scholar] [CrossRef]
  89. Zhou, X.; Tang, X. Spatiotemporal consistency effect of green finance on pollution emissions and its geographic attenuation process. J. Environ. Manag. 2022, 318, 115537. [Google Scholar] [CrossRef] [PubMed]
  90. Zhang, H.; Duan, Y.; Yang, J.; Han, Z.; Wang, H. Can green finance improve China’s haze pollution reduction? The role of energy efficiency. Environ. Dev. 2023, 45, 100833. [Google Scholar] [CrossRef]
  91. Bi, S.; Hu, J.; Shao, L.; Feng, T.; Appolloni, A. Can public transportation development improve urban air quality? Evidence from China. Urban Clim. 2024, 54, 101825. [Google Scholar] [CrossRef]
  92. Kokkinos, K.; Karayannis, V.; Nathanail, E.; Moustakas, K. A comparative analysis of Statistical and Computational Intelligence methodologies for the prediction of traffic-induced fine particulate matter and NO2. J. Clean. Prod. 2021, 328, 129500. [Google Scholar] [CrossRef]
  93. Zhang, A.; Wang, S.; Liu, B. How to control air pollution with economic means? Exploration of China’s green finance policy. J. Clean. Prod. 2022, 353, 131664. [Google Scholar] [CrossRef]
Figure 1. Research framework.
Sustainability 16 04319 g001
Figure 3. Trends in maturity mismatch among various provinces of China from 2010 to 2020.
Sustainability 16 04319 g003
Figure 4. Three-dimensional plot of trends in explanatory variables.
Sustainability 16 04319 g004
Figure 5. Carbon emission intensity trends of different regions.
Sustainability 16 04319 g005
Figure 6. The threshold regression diagram for maturity mismatch.
Sustainability 16 04319 g006
Table 1. Methodology and indicator system for measuring green finance.
MethodIndex and Representative Scholar
PCAGovernment spending on energy production and environmental protection is divided by total spending [13,28]
SIMGreen bond indices [29,30]; GIV [31]; GC [32,33,34,35]
EMGC, CF, GS, GIS, GIV multi index [27,36,37,38]
Table 2. Indicator system of GF.
Tier 1 IndicatorsSecondary IndicatorsTertiary IndicatorsIndicator Measurement MethodologyIndicator Properties
Green
finance
(GF)
GCThe interest expense ratio of six energy-intensive industries 1Interest expenses incurred by six industries with high energy consumption/interest expenses of industries in the industrial sector-
Amount of loans for environmental companiesAmount of loans for environmental companies+
GSPercentage of environmental firms’ market capitalizationThe sum of the market capitalizations of the A-shares and environmental company enterprises+
The market value of energy-intensive businesses, expressed as a percentageThe total market value of listed companies in six high-energy-consuming industries/total market value of A-shares-
GIVThe proportion of money invested in reducing environmental degradationAmount invested in pollution of the environment/GDP+
Energy saving and environmental protection spending as a percentageTotal financial spending against financial expenditure on the energy-saving and environmental protection business+
GISShare of agricultural insurance scaleTotal insurance costs divided by agricultural insurance costs+
Ratio of insurance payouts for agricultureExpenditures for and earnings from agriculture insurance+
CFCarbon emission loan intensityLoan balance/carbon emissions+
1 As per the “2010 National Economic and Social Development Statistics Report”, the industries with the highest energy consumption are those that manufacture chemical raw materials and products, smelt and roll ferrous and non-ferrous metals, produce non-metallic mineral products, process petroleum, coke, process nuclear fuel, and produce and supply electricity and heat.
Table 3. Descriptive statistics.
Variables(1)
N
(2)
Mean
(3)
Std. Dev.
(4)
Min
(5)
Max
lnC3190.81040.7008−0.89242.4323
lnGF319−1.84560.3653−2.6501−0.5434
lnMis319−0.60770.9285−16.23650.1586
lnPgdp3191.40320.43000.26152.5508
lnEnergy3199.10860.59877.046410.3035
lnStructure3193.74640.24182.76004.0775
lnTrade3193.00000.89801.00435.0637
lnFinancial3191.98330.43580.93593.2458
lnEducation3192.52740.41331.66623.9217
Table 4. Baseline regression results.
Variables(1)(2)(3)(4)(5)(6)
lnClnClnClnClnClnC
lnGF−0.4807 ***
(0.0554)
−0.0931 *
(0.0530)
−0.0879 **
(0.0419)
−0.0953 **
(0.0418)
−0.0953 **
(0.0418)
−0.0701 **
(0.0272)
lnPgdp −1.0022 ***
(0.0674)
−1.1215 ***
(0.1277)
−1.1215 ***−1.3443 ***
(0.1277)(0.0851)
lnEnergy 0.6829 ***
(0.0724)
0.7990 ***
(0.0814)
0.7990 ***0.7403 ***
(0.0814)(0.0553)
lnStructure −0.1805 *
(0.1007)
−0.0125
(0.1344)
−0.01250.1360
(0.1344)(0.0876)
lnTrade 0.0316
(0.0308)
0.0439
(0.0328)
0.04390.0457**
(0.0328)(0.0223)
lnFinancial −0.0532
(0.0472)
0.0077
(0.0538)
0.00770.0728**
(0.0538)(0.0358)
lnEducation 0.0552
(0.0473)
0.0390
(0.0470)
0.03900.0348
(0.0470)(0.0377)
lnasset 0.1172
(0.1072)
Constant−0.0768
(0.1632)
0.8589 ***
(0.1060)
−3.6181 ***
(0.7458)
−5.2901 ***
(0.8505)
7.0131 ***−5.1526 ***
(1.7589)(0.5746)
Individual fixationNoYesNoYesYesYes
Fixed timeNoYesNoYesYes
319
Yes
N319319319319290
0.8855
R20.20440.55070.71150.73670.7367
Note: values in parentheses are standard errors, and ***, **, and * denote significance at 1%, 5%, and 10% significance levels, respectively.
Table 5. Regression results of instrumental variables.
Variables(1)(2)(3)
lnGFlnClnGFlnClnGFlnC
GF1−0.0037 ***
(0.0009)
−0.0025 ***
(0.0009)
GF2 0.3894 ***
(0.0571)
0.3568 ***
(0.0576)
lnGF −0.3195 *
(0.1871)
−0.2590 **
(0.1175)
−0.2740 **
(0.1098)
Control variablesyesyesyesyesyesyes
Individual fixationyesyesyesyesyesyes
Fixed timeyesyesyesyesyesyes
N319319290290290290
Phase I F-statistic15.9400 46.5500 27.6000
LM test value 17.6020 46.3030 53.5000
(p) 0.0000 0.0000 0.0000
Note: values in parentheses are standard errors, and ***, **, and * denote significance at 1%, 5%, and 10% significance levels, respectively.
Table 6. Other robustness tests.
Variables(1)(2)(3)
lnGF−0.0953 **
(0.0418)
−0.0967 **
(0.0405)
gfzone −0.1022 ***
(0.0361)
lnC1 0.5336 **
(0.2327)
AR (1) 0.0090
AR (2) 0.3510
Hansen test 1.000
Control variablesyesyesyes
Constant−5.2901 ***
(0.8505)
−5.8595 ***
(0.8767)
−1.2180
(2.8780)
Individual fixationyesyesyes
Fixed timeyesyesyes
N319319290
R20.43690.7393
Note: values in parentheses are standard errors, and ***, ** denote significance at 1%, 5% significance levels, respectively.
Table 7. Bounds for robustness of proportional selection of unobservables.
Simple OLS without City-Level Controls to DID with All Controls
Simplified ModelAll OLS Controls R m a x 2 Bounding Values
Outcome
OLS coefficient
β ˙
−0.0931
R ˙ 2
0.5507
β ~
−0.0953
R ~ 2
0.7367
Π = 1.3
0.9577
Π = 2.0
1.0000
β Π = 1.3 *
−0.1001
β Π = 2.0 *
−0.1006
Table 8. Heterogeneity analysis.
Variables(1)(2)(3)(4)
lnGF−0.1697 ***
(0.0571)
−0.1021
(0.0787)
0.0370
(0.0623)
−0.1335 ***
(0.0418)
Control variablesyesyesyesyes
Constant−3.5419 ***
(1.0013)
−5.5562 ***
(1.4252)
−4.2836 ***
(1.4109)
−1.1506
(0.8192)
Individual fixationyesyesyesyes
Fixed timeyesyesyesyes
N131188202117
R20.83330.68190.67990.9205
Note: values in parentheses are standard errors, and *** denotes significance at 1% significance levels, respectively. (1)–(4) represent provinces with HGF, LGF, HEC, and LEC, respectively.
Table 9. Mechanism analysis.
Variables(1)(2)(3)(4)
lnGF−0.1818 ***
(0.0628)
−0.6689 ***
(0.2427)
−0.1015 **
(0.0412)
lnMis−0.3178 *
(0.1724)
−1.9455 ***
(0.6831)
lnGF × lnMis−0.1672 *
(0.0909)
−0.9907 ***
(0.3368)
ISR −0.4156 *
(0.2514)
lnGF × ISR 0.5873 **
(0.2820)
lnC1 0.2966 *
(0.1477)
Threshold value −1.4348
ln G F × I ( m γ ) −0.2145 ***
(0.0487)
ln G F × I ( m > γ ) −0.0913 **
(0.0395)
AR (1) 0.0030
AR (2) 0.7280
Hansen test 1.0000
Control variablesyesyesyesyes
Constant−5.5704 ***
(0.8649)
1.1473
(2.2232)
−4.2878 ***
(0.7504)
−4.6139 ***
(0.8630)
yes
Individual fixationyes
Fixed timeyes yes
N319319319319
R20.7400 0.7474
Note: values in parentheses are standard errors, and ***, **, and * denote significance at 1%, 5%, and 10% significance levels, respectively.
Table 10. Further analysis.
VariableslnPM2.5lnPM2.5lnSO2lnSO2
lnGF−0.0730 **
(0.03)
−0.0869 **
(0.04)
−0.4726 ***
(0.11)
−0.7001 ***
(0.17)
lnMis −0.0621
(0.12)
−0.8559 *
(0.47)
lnGF × lnMis −0.0384
(0.06)
−0.4602 *
(0.25)
Control variablesyesyesyesyes
Constant2.1956 ***
(0.59)
2.0376 ***
(0.60)
−11.5150 ***
(2.30)
−12.4497 ***
(2.34)
Individual fixationyesyesyesyes
Fixed timeyesyesyesyes
N319319319319
R20.83510.83800.90160.9031
Note: values in parentheses are standard errors, and ***, **, and * denote significance at 1%, 5%, and 10% significance levels, respectively.
Disclaimer/Publisher’s Note: The statements, opinions and data contained in all publications are solely those of the individual author(s) and contributor(s) and not of MDPI and/or the editor(s). MDPI and/or the editor(s) disclaim responsibility for any injury to people or property resulting from any ideas, methods, instructions or products referred to in the content.

