Article

Application of Cotton Stalk as an Adsorbent for Copper(II) Ions in Sustainable Wastewater Treatment

by
Mary Triny Beleño Cabarcas
1,
Ricardo Torres Ramos
1,*,
Benjamín Valdez Salas
2,
Daniel González Mendoza
1,
Aurelia Mendoza Gómez
1,
Mario Alberto Curiel Álvarez
2 and
Jonathan Rafael Castillo Sáenz
2,*
1
Instituto de Ciencias Agrícolas, Universidad Autónoma de Baja California, Mexicali 21705, Baja California, Mexico
2
Instituto de Ingeniería, Universidad Autónoma de Baja California, Mexicali 21280, Baja California, Mexico
*
Authors to whom correspondence should be addressed.
Sustainability 2024, 16(10), 4291; https://doi.org/10.3390/su16104291
Submission received: 5 April 2024 / Revised: 2 May 2024 / Accepted: 14 May 2024 / Published: 19 May 2024

Abstract

:
The capacity of untreated cotton stalk to remove and adsorb Cu2+ ions in synthetic and natural aqueous solutions was evaluated. The influence of three sensitive parameters of the adsorption process—solution pH, adsorbent dosage, and contact time—on the percentage of Cu2+ removal in agricultural wastewater, livestock wastewater, and synthetic samples was studied. Physicochemical and morphological properties were studied using thermogravimetry, Fourier infrared spectrophotometry, and scanning electron microscopy. The elemental composition, proximal composition, zero charge point, and acid–base sites were determined. In addition, kinetic studies were performed, and the adsorption equilibrium was analyzed. The optimum conditions for Cu2+ adsorption were the following: solution pH = 5.5, adsorbent dosage of 0.6 g, and contact time of 60 min. Under these conditions, the percentage of Cu2+ removal in synthetic samples was 66.5% when the initial copper concentration was 50 mg/L. The removal percentage in agricultural and livestock wastewater samples was 87.60% and 85.05%, respectively, when the initial copper concentration was 25 mg/L. The adsorption data are consistent with the Freundlich isotherm model, which achieved a quadratic fit of 0.991 compared to 0.5542 for the Langmuir model. The experimental results indicate that the adsorption adequately fits the pseudo-second-order kinetic model. The results suggest that cotton stalks are a promising adsorbent for the ecological and economical removal of Cu2+ in wastewater. This research, therefore, provides relevant information that contributes to the sustainable management of agricultural waste and instills hope for a reduction in water pollution from heavy metals derived from agricultural activities.

1. Introduction

Rapid population growth and escalating global food demands are placing unprecedented strain on water resources, particularly freshwater reserves. The excessive use of this natural resource generates large amounts of wastewater that must be treated to prevent the environmental deterioration of receiving bodies and aquatic ecosystems. Closing the disparity between freshwater supply and demand is crucial to ensure society’s essential activities [1]. One strategy to alleviate pressure on water resources involves applying appropriate and cost-effective treatment to wastewater to improve its quality. Efficiently treated wastewater could be reused in agricultural activities and replenishing freshwater supplies, especially in arid or semi-arid regions [2].
Reusing wastewater presents significant challenges, particularly in removing potentially harmful contaminants like heavy metals [3]. These pollutants stem from various industrial processes, including mining, electroplating, metal processing, textile manufacturing, battery production, pesticide application, and photography [4]. Common heavy metals in wastewater include Pb, Cr, Cd, Ni, Cu, As, Zn, and Hg [4]. Additionally, agricultural activities contribute significantly to water pollution from heavy metals. The overuse of fertilizers and agrochemicals can result in the buildup of heavy metals in soils, which are eventually washed into irrigation water [2].
One of the elements frequently found in agricultural wastewater is copper. Although it is an essential micronutrient for living beings, it can be considerably toxic in high concentrations. Previous studies indicate that approximately 939,000 tons of copper are discharged into the environment annually worldwide [5]. Due to the potential negative impact of high copper concentrations on the environment and public health, strict standards have been established to regulate the copper content in discharge wastewater. According to the Mexican standard NOM-001-1996, the concentration of copper in agricultural, domestic, and industrial wastewater must not exceed 4.0 mg/L before being discharged into receiving bodies of water, including rivers, streams, and lagoons [6].
Various physicochemical and biological processes have been employed for copper removal from wastewater. Traditionally, techniques such as ion exchange, chemical precipitation, membrane filtration, and photocatalysis have been utilized [7,8]. However, these methods pose certain drawbacks, particularly in efficiency and cost-effectiveness, especially when dealing with metal ions at concentrations below 100 mg/L [9,10,11]. Another approach for removing contaminants in aqueous media involves adsorption processes using porous solids as adsorbents. Among these, activated carbon is one of the most commonly used materials, demonstrating high efficacy in heavy metal removal [12]. Nonetheless, its production involves high energy consumption and is considered an expensive material [13].
Recently, new adsorbent materials of biological origin have been proposed, characterized by their low cost, high availability, and capacity to remove heavy metals and organic pollutants from aqueous solutions [14,15]. A significant fraction of these bioadsorbents comes from agricultural residues, such as olive seeds [16], sunflower petals [10], oak sawdust (Quercus coccifera) [17], pomegranate peels [9], grapefruit peels [18], cotton bolls [19], and date palms [3]. Specifically, cotton stalks have proven to be effective adsorbents in heavy metal removal. Li et al. (2014) studied the adsorption properties of cotton stalks modified with ammonia [20]. They reported an adsorption capacity of 1.29 and 2.8 mg/g for Ni and Cu metals, respectively. Other studies, such as those by Kahraman et al. (2008), demonstrated copper removal rates close to 80% using cotton stalks as an adsorbent, with a dose of 1.0 g and an initial concentration of 50 mg/L [21]. Ma et al. (2019) also highlighted that magnetic biochar derived from cotton stalks exhibits a maximum adsorption capacity of 20.05 mg/g for Cr(VI) [22]. Likewise, Nagy et al. (2023) reported that the maximum adsorption capacity of cotton stalks for metals Cd, Pb, and Zn was 2.67, 2.88, and 2.19 mg/g, respectively [3]. These findings suggest that cotton stalks have notable properties as adsorbents for removing copper and other heavy metals in aqueous solutions.
Using cotton stalks as an adsorbent material for removing copper from aqueous solutions is important in the Baja California region of Mexico. The region cultivates approximately 31,080 ha of cotton, which produces 137 million tons of cotton stalks [23]. Currently, these stalks are disposed of through open-air incineration, which causes pollution and public health issues. Additionally, the intensive agricultural practices in Baja California require large amounts of agrochemicals and fertilizers, introducing pollutants into the wastewater. Moreover, Baja California is in a desert with low rainfall, arid or semi-arid soils, and minimal and overused water resources [24].
Outstanding work has been published on the adsorption of contaminants using biosorbents. However, studies on the adsorption of copper ions in aqueous solutions using cotton stalks without chemical or thermal modifications are very scarce, and further analysis of the physical and chemical parameters involved in adsorption is required. In addition, little information is available regarding the copper adsorption capacity of cotton stalks in complex matrices such as agricultural and livestock wastewater. Moreover, Baja California needs to have information that allows for better water and agricultural waste management to reduce the current impacts on health from agricultural burns and address the water scarcity facing the state. This research aimed to assess the potential of cotton stalk as a Cu2+ ion adsorbent in synthetic and natural aqueous solutions, with the ultimate goal of utilizing it in water filtration. The adsorbent underwent a thorough characterization process, and various factors such as the solution’s pH, contact time, and adsorbent dosage were examined to determine their impact on the percentage of Cu2+ removal. Furthermore, kinetic and equilibrium adsorption studies were conducted using the Langmuir and Frenhidch models.

2. Materials and Methods

2.1. Materials

A stock solution with a Cu2+ ion concentration of 1000 mg/L was prepared by adding 3.9296 g of copper sulfate pentahydrate (CuSO4·5H2O) (Sigma-Aldrich, St. Louis, MO, USA) in deionized water. This solution presented an initial pH of 3.27. From the stock solution, several dilutions were prepared with deionized water to perform the adsorption tests. The pH of the solutions was adjusted using 0.1 M NaOH and HCl solutions. CuSO4·5H2O, NaOH, and HCl were purchased from Sigma Aldrich and Spectrum Chemical (New Brunswick, NJ, USA). The concentration of Cu2+ ions in the aqueous solutions was confirmed by visible spectrophotometry. The methodology for evaluating the ability of cotton stalk to adsorb Cu2+ ions in solution is summarized in Figure 1.

2.2. Preparation and Characterization of Adsorbent Material

The samples of cotton stalks were collected from agricultural fields in the Mexicali Valley, Baja California, Mexico. The samples were cut to approximately 5 cm in length and washed with deionized water to remove any dust particles. After that, the material was left to dry at room temperature for five days. Then, the samples were ground using a GM 300 blade mill (Retsch®, Haan, Germany) and sieved to separate particles with a size of 0.30 and 0.50 mm. The samples were dried in an F6010 muffle oven (Thermo Scientific™, Waltham, MA, USA) at 105 °C for 24 h. After drying, the samples were allowed to cool in a desiccator and stored in airtight bags, becoming the adsorbent material to be used in the experiments. Figure 2 shows the dried, ground, and sieved cotton stalk samples.

2.2.1. Elemental and Proximate Analysis

Elemental analysis was used to determine the adsorbent’s elemental composition as a function of carbon, hydrogen, oxygen, nitrogen, and sulfur concentration. An elemental analyzer, Flash 2000 CHNS/O (Thermo Scientific™, Waltham, MA, USA), was used following ATSM E777-08 [25].
The proximate analysis included determining moisture content, volatile matter, ash, and fixed carbon. Gravimetric methods were used to perform this analysis, according to ASTM E870-82 [26]. The moisture percentage was determined using the ASTM E871-82 [27] standard.

2.2.2. Zero Loading Point (pHPZC)

The pHPZC of the adsorbent was determined by adding 50 mL of distilled water in 8 flasks with a capacity of 100 mL. Then, acidic (HCl 0.1 mol/L) and basic (NaOH 0.1 mol/L) solutions were added to each flask to adjust the pH to the following values: 3, 4, 5, 6, 7, 8, 9, and 10. Then, 0.5 g of the cotton stalk adsorbent was added to each flask that were capped and continuously agitated with a magnetic stirrer (150 rpm) at a constant temperature of 25 °C for 24 h. After this period, the contents of each flask were filtered, and the final pH of the samples was measured with a HI98129 pH meter (Hanna®, Smithfield, RI, USA). A curve of the initial pH vs. the final pH was plotted to obtain the pHPZC from the point where a diagonal line intercepts the pH curve [28].

2.2.3. Acid and Basic Sites

The acid and basic sites of the adsorbent were determined by using Boehm’s (2001) method using acid–base titrations [29]. In this procedure, two flat-bottom flasks were used. In the first one, 50 mL of 0.1 mol/L NaOH solution was added; in the second, 50 mL of 0.1 mol/L HCl solution was added. Then, 0.5 g of adsorbent was added to both solutions. The flasks were covered and kept under constant agitation in the magnetic stirrer for five days at 25 °C. After this period, 10 mL aliquots of the solutions were taken and titrated with standard 0.1 mol/L NaOH or HCl solutions. The values of acidic and basic sites were calculated by applying Equations (1) and (2), respectively.
M a s = V b C b V e q H C l C H C l V b V a l i q u o t , b m
where Mas is the number of moles of acid functional groups on the surface of the adsorbent reacted with the NaOH during mixing, Cb is the concentration of the base that will react with the adsorbent in the mixture, Vb is the volume of the base, Valiquot,b is the volume of the aliquot, CHCl is the concentration of the acid (HCl, titrating agent) added to the aliquot taken from the original sample, VeqHCl is the volume of HCl at which the equivalence point occurs, and m is the mass in grams of the adsorbent.
M b s = V a ( C a ) V e q N a O H ( C N a O H ) V a V a l i c u t a , a m  
where Mbs is the number of moles of the basic functional groups on the surface of the adsorbent that reacted with HCl during mixing, Ca is the concentration of the acid that will react with the adsorbent in the mixture, Va is the volume of the acid, Valiquot,a is the volume of the aliquot, CNaOH is the concentration of NaOH (titrating agent) added to the aliquot taken from the original sample, Veq NaOH is the volume of the acid (titrating agent) at which the equivalence point occurs, and m is the mass in grams of the adsorbent.

2.2.4. Fourier Transform Infrared Analysis (FTIR)

Identifying the functional groups in the adsorbent structure is essential to understanding the interactions between the adsorbate and adsorbent. FTIR analysis was performed on a SpectrumTM One spectrophotometer (PerkinElmer, Waltham, MA, USA), which assisted with an attenuated total reflection (ATR) device.

2.2.5. Energy Dispersive X-ray Fluorescence Analysis (EDX)

The chemical profile of cotton stalk samples before and after adsorption was determined by EDX spectroscopy using an EDX-7200 spectrometer (Shimadzu, Kyoto, Japan).

2.2.6. Microscopic Analysis

Adsorbent material samples were examined with a scanning electron microscope, a JEOL JSM-6010LA. The analysis was performed with an accelerating voltage of 15 kV, and a low vacuum was operated at 50 Pa.

2.2.7. Thermogravimetric Analysis

Thermal analysis included thermogravimetric analysis (TGA) and differential scanning thermogravimetric analysis (DTG). This analysis was performed on an STA 6000 simultaneous thermal analyzer (PerkinElmer, Waltham, MA, USA). A 10 °C/min heating ramp from 25 to 700 °C was used with a 100 mL/min nitrogen gas flow rate.

2.3. Copper Concentration in Aqueous Solutions

The concentration of Cu2+ ions in aqueous solution was determined with a visible spectrophotometer, “Iris” HI801 (Hanna®, instruments), using the bicinchoninic acid method [30]. The bicinchoninic reagent is added to the solution, which reacts with Cu2+ ions, producing a purple-colored complex. The intensity of the color is proportional to the concentration of copper ions in the solution.

2.4. Determination of Optimum Adsorption Conditions

2.4.1. Batch Adsorption Tests

Batch adsorption studies were conducted by contacting the cotton stalk adsorbent with a solution of 50 mg/L of Cu2+ ions in a 250 mL Erlenmeyer flask. The mixtures were consistently agitated at 150 rpm and maintained at 25 °C using a magnetic stirrer during the experiments. Three experiments were conducted to evaluate the effects of solution pH, adsorbent dosage, and contact time on Cu2+ ion removal. At the end of each test, the samples were filtered with a Whatman No. 2 filter paper, and the residual concentration of Cu2+ ions in the filtrate was determined. To distinguish between possible metal precipitation and actual metal adsorption, control (blank) samples without adsorbent materials were prepared.
The residual concentration of Cu2+ ions after adsorption was measured using visible spectrophotometry, and the amount of adsorption at equilibrium, qe (mg/g), was calculated using Equation (3) [31].
q e = ( C o C e ) V M  
Co and Ce are the liquid phase concentrations of Cu2+ at initial time and equilibrium concentration (mg/L), respectively. V is the solution volume in liters, and M is the mass of dry adsorbent in grams. The percentage removal of Cu2+ (r) was calculated using Equation (4).
r = C o C e C o × 100 %  

2.4.2. pH Variation

Adsorption of Cu2+ metal ions was studied using 0.30 g of adsorbent at various pH levels from 2 to 7.5. Adsorption studies were performed using 100 mL Cu2+ solution with an initial 50 mg/L concentration. The mixtures were stirred using a magnetic stirrer at 150 rpm for 1 h at 25 °C. After the stirring period, the contents of each flask were filtered, and the residual concentration of Cu2+ was determined by visible spectrophotometry. Finally, the amount of adsorbed metal ions was calculated from the difference between the final and initial amounts of Cu2+ in the aqueous solution. On the other hand, the optimum pH found in this experiment was utilized as a reference pH for the tests of variation for adsorbent dosage and contact time variation.

2.4.3. Variation of Adsorbent Dosage

Adsorption of Cu2+ ions was studied using various amounts of adsorbent. Adsorption tests were performed by adding 0.15, 0.30, and 0.60 g of adsorbent into 3 separate flasks containing 100 mL of a Cu2+ ion solution with an initial 50 mg/L concentration. The mixtures were stirred uniformly using a magnetic stirrer and kept at 25 °C for one hour. At the end of each test, the contents of each flask were filtered, and the residual concentrations of the metal ions in the filtrates were determined by visible spectrophotometry. Finally, the amount of adsorbed metal ions was calculated as the difference between the final and initial amounts of Cu2+ in the aqueous solution.

2.4.4. Variation of the Contact Time

The adsorption of metal ions was studied at various time intervals: 20, 40, 60, 80, 100, and 120 min. For the adsorption tests, 0.30 g of adsorbent was added in 3 flasks containing 100 mL of a Cu2+ ion solution of initial 50 mg/L concentration. The mixtures were maintained at temperature (25 °C) and constant agitation (150 rpm). After the contact time had elapsed, the contents of each flask were filtered, and the concentration of metal ions in the filtrates was determined. Finally, the amount of adsorbed metal ions was calculated as the difference between the final and initial amounts of copper ions in the aqueous solution.

2.5. Biosorbent Testing with Wastewater Samples

Agricultural wastewater samples and livestock wastewater samples were utilized for the adsorption studies. The agricultural wastewater samples were collected from a drainage outlet at latitude 32.445038 and longitude −115.183913. Meanwhile, the livestock wastewater samples were collected from the wastewater treatment plant at the Institute of Agricultural Sciences of the Universidad Autónoma de Baja California. First, the initial copper concentration in the wastewater samples was determined. The copper concentration in the samples was increased to 25 mg/L to evaluate the removal efficiency of the biosorbent. This procedure has been used in previous investigations to evaluate the adsorption of biosorbents [32]. The adsorption tests were performed in 250 mL flasks, adding 0.6 g of biosorbent and 100 mL of the copper-enriched wastewater sample. The pH of the solution was adjusted to 5.5 units, and it was kept under constant stirring using a magnetic stirrer at 150 rpm for 60 min at room temperature. Subsequently, the residual copper (II) concentration was measured, and the removal percentage was determined. In addition, other physicochemical analyses were performed to determine the wastewater’s properties, such as pH, electrical conductivity (EC), total dissolved solids (TDS), and total hardness. These parameters were evaluated before and after adsorption treatment, performed three times, and subsequently considered producible when the error was less than 3%.

2.6. Adsorption Isotherms

Adsorption isotherms describe the behavior of the interaction between adsorbent and adsorbate. In addition, adsorption isotherms allow the adsorption capacity of adsorbent materials to be determined. [33]. This work evaluated the equilibrium adsorption of copper ions in an aqueous solution using the cotton stalk as an adsorbent. The experiments were carried out in six 100 mL flasks, mixing 0.05, 0.1, 0.1, 0.2, 0.3, 0.4, and 0.5 g of adsorbent with 50 mL of 50 mg/L Cu (II) solution. Then, the flasks were stirred using a magnetic stirrer at 150 rpm for the equilibration time of 2 h. Adsorption isotherm studies were performed at pH 4.6, corresponding to the solution’s pH after the adsorbent was added. After the equilibrium time, the mixtures were filtered using 0.22 µm Whatman filters, and the residual concentration of copper (Ce) was determined by visible spectrophotometry. The adsorbed amount of copper (qe) was calculated by Equation (3). Experimental data obtained were fitted to two widely known adsorption isotherm models: the Langmuir model [34] and the Freundlich model [35].

2.6.1. Langmuir Model

The Langmuir model describes the adsorption equilibrium on homogeneous surfaces and allows determining the maximum adsorption capacity under the following assumptions: the adsorbent surface has homogeneous energetic sites; only one molecule can be adsorbed on a site, and the adsorption generates the formation of monomolecular layers on the adsorbent surfaces; there is no interaction between the adsorbed molecules [34]. The simplified and linearized Langmuir isotherm models are presented in Equations (5) and (6), respectively.
q e = q m K L C e 1 + K L C e  
C e q e = C e q m + 1 q m K L  
where qe is the concentration of copper (II) adsorbed per weight unit of sorbent at equilibrium (mg/g), qm is the theoretical maximum adsorption capacity (mg/g), Ce is the concentration of copper (II) at equilibrium (mg/L), and KL is the Langmuir constant (L/mg). The numerical values of the qm, KL constants, and the regression coefficients for the Langmuir isotherm are evaluated from a plot of Ce/qe versus Ce.

2.6.2. Freundlich Model

The Freundlich model describes adsorption at equilibrium on heterogeneous surfaces under the following assumptions: the active adsorption sites are first occupied by strong bonds, and the bond strength decreases with increasing adsorption site occupancy; the molecules are adsorbed as multilayers on the heterogeneous adsorbent surface; there is interaction between the adsorbed molecules [35]. The simplified and linearized forms of the Freundlich models are described in Equations (7) and (8), respectively.
q e = K f C e 1 / n f
L n q e = L n K f + 1 n f L n C e
where qe is the concentration of copper (II) adsorbed per weight of the adsorbent at equilibrium (mg/g), Kf is the Freundlich constant, which indicates the adsorption capacity of the liquid phase (mg/L), nf is a heterogeneity factor that provides information on the binding energies between the adsorbent and the Cu (II) ions, and Ce is the concentration of copper (II) at equilibrium (mg/L). The plot of Ln qe versus Ln Ce is a straight line defined by a slope 1/nf and intercept Ln Kf.

2.7. Adsorption Kinetics

With adsorption kinetics experiments, it is possible to estimate the rate at which a contaminant is removed from aqueous solutions and provide data that facilitate understanding of the adsorption mechanism [36,37]. Adsorption kinetics experiments were carried out by adding 0.3 g of adsorbent in an Erlenmeyer flask with 50 mL of Cu2+ solution at a 50 mg/L concentration. The flasks were stirred using a magnetic stirrer, and samples were taken at 5, 10, 15, 20, 25, 25, 30, 45, 60, 90, 120, and 180 min. The samples were filtered, and the residual copper (II) concentration was analyzed using a visible spectrophotometer. Pseudo-first-order and pseudo-second-order kinetic models were used to evaluate the experimental data obtained with the Cu (II) ion.

2.7.1. Pseudo-First-Order Model

The pseudo-first-order model assumes that the limiting step of an adsorption process is the mass transfer of the metal ion from the solution sink to the adsorbent surface [7,38,39]. The pseudo-first-order model and its linearized form are presented in Equations (9) and (10), respectively.
d q t d t = k 1 q e q t
L n ( q e q t ) = L n q e k 1 t
where qe is the equilibrium concentration of copper on the adsorbent, and qt is the copper concentration at time t (mg/g). k1 is the rate constant of pseudo-first-order model adsorption (min−1), and t is the contact time (min). The plot of Ln(qeqt) versus t calculates k1 and qe from the slope and intercept plots, respectively.

2.7.2. Pseudo-Second-Order Model

The pseudo-second-order model assumes that the rate-limiting step in the overall reaction is chemisorption. The adsorbate interacts with the adsorbent surface by establishing a covalent bond [9,40]. The pseudo-second-order model and its linearized form are presented in Equations (11) and (12), respectively [41].
d q t d t = k 2 ( q e q t ) 2
t q t = 1 k 2 q e 2 + 1 q e t
where qe is the adsorbed amount of copper at equilibrium, and qt is the adsorbed amount of Cu2+ at time t (mg/g). k2 is the adsorption rate constant of the second-order model adsorption (g/mg·min), and t is the contact time (min).

3. Results and Discussion

3.1. Adsorbent Characterization

3.1.1. Proximate and Elemental Analysis

The results of the proximate and elemental analysis are shown in Table 1. The cotton stalk used in this study had 6.15% moisture, 72.35% volatile materials, 22.88% fixed carbon, and 5.15% ash. Wang et al. (2011) said cotton stalks have an equivalent fixed carbon content of 19.19%, while the volatile matter and ash contents were 76.92% and 2.70%, respectively [42]. It can be observed that cotton stalks from the Mexicali Valley present a relatively high fixed carbon content that can contribute to improving the adsorption properties.
On the other hand, elemental analysis made it possible to determine the concentration of the major elements in the cotton stalk. Elemental carbon comprised 47.91%, hydrogen comprised 5.66%, and oxygen comprised 45.57%. In contrast, sulfur and nitrogen reached a percentage equivalent to 0.75% and 0.11%, respectively. The high percentage of oxygen verifies the presence of volatile compounds in the biomass structure [43]. Previous research has reported a percentage of elemental carbon around 46.43% for cotton stalks, with hydrogen at 6.18% and oxygen at 42.62% [42]. The results of the elemental composition analysis show slight variations concerning the data reported in the literature. These variations can be attributed to factors affecting plant development, such as the climate, soil type, and crop variety [44].

3.1.2. pHPZC

The pHPZC corresponds to the pH where the concentrations of cations (H+) and anions (OH) retained on the surface of an adsorbent are equalized. In other words, the pHPZC is reached when the net charge on the surface of the adsorbent is equal to zero. Determining this parameter is fundamental because it establishes the optimum pH range to achieve maximum adsorption of contaminants of anionic or cationic nature in a solution [28]. Figure 3 shows the behavior of the charge distribution on the adsorbent surface when the pH of the solution ranged between 3.0 and 10.0.
It can be seen that the pHPZC value for the cotton stalk adsorbent was 5.1. This indicates that the surface of the cotton stalk will be positively charged when the pH of the aqueous solution reaches values less than 5.1. Excess positive charges on the adsorbent surface could decrease Cu2+ ion removal efficiency due to repulsive forces between the positive charges on the adsorbent surface and the positive charge of the Cu2+ ion. On the other hand, when the pH of the aqueous solution reaches values above 5.1, the surface of the cotton stalk will be negatively charged. Therefore, the adsorption process is expected to be favored due to the electrostatic attraction forces between the Cu2+ ions and the adsorbent surface. Previous research has reported increased removal efficiency of cationic species when the solution pH exceeded pHPZC [9].

3.1.3. Acidic–Basic Sites

Boehm’s (2001) titration was used to determine the concentration of oxygenated functional groups that can either yield or accept protons, referred to as acidic sites and basic sites [29]. Figure 4 shows the equivalent volume for acidic and basic sites, which were 4 mL and 7.5 mL, respectively. These values are used in Equations (1) and (2) to determine the moles of basic and acidic groups. The concentration of acid sites at the surface was 6.0 meq/g, while the concentration of basic sites was 2.5 meq/g. This indicates that the surface of the cotton stalk is dominated by acidic groups, which explains why the pHPZC is less than pH 7.

3.1.4. FTIR Analysis

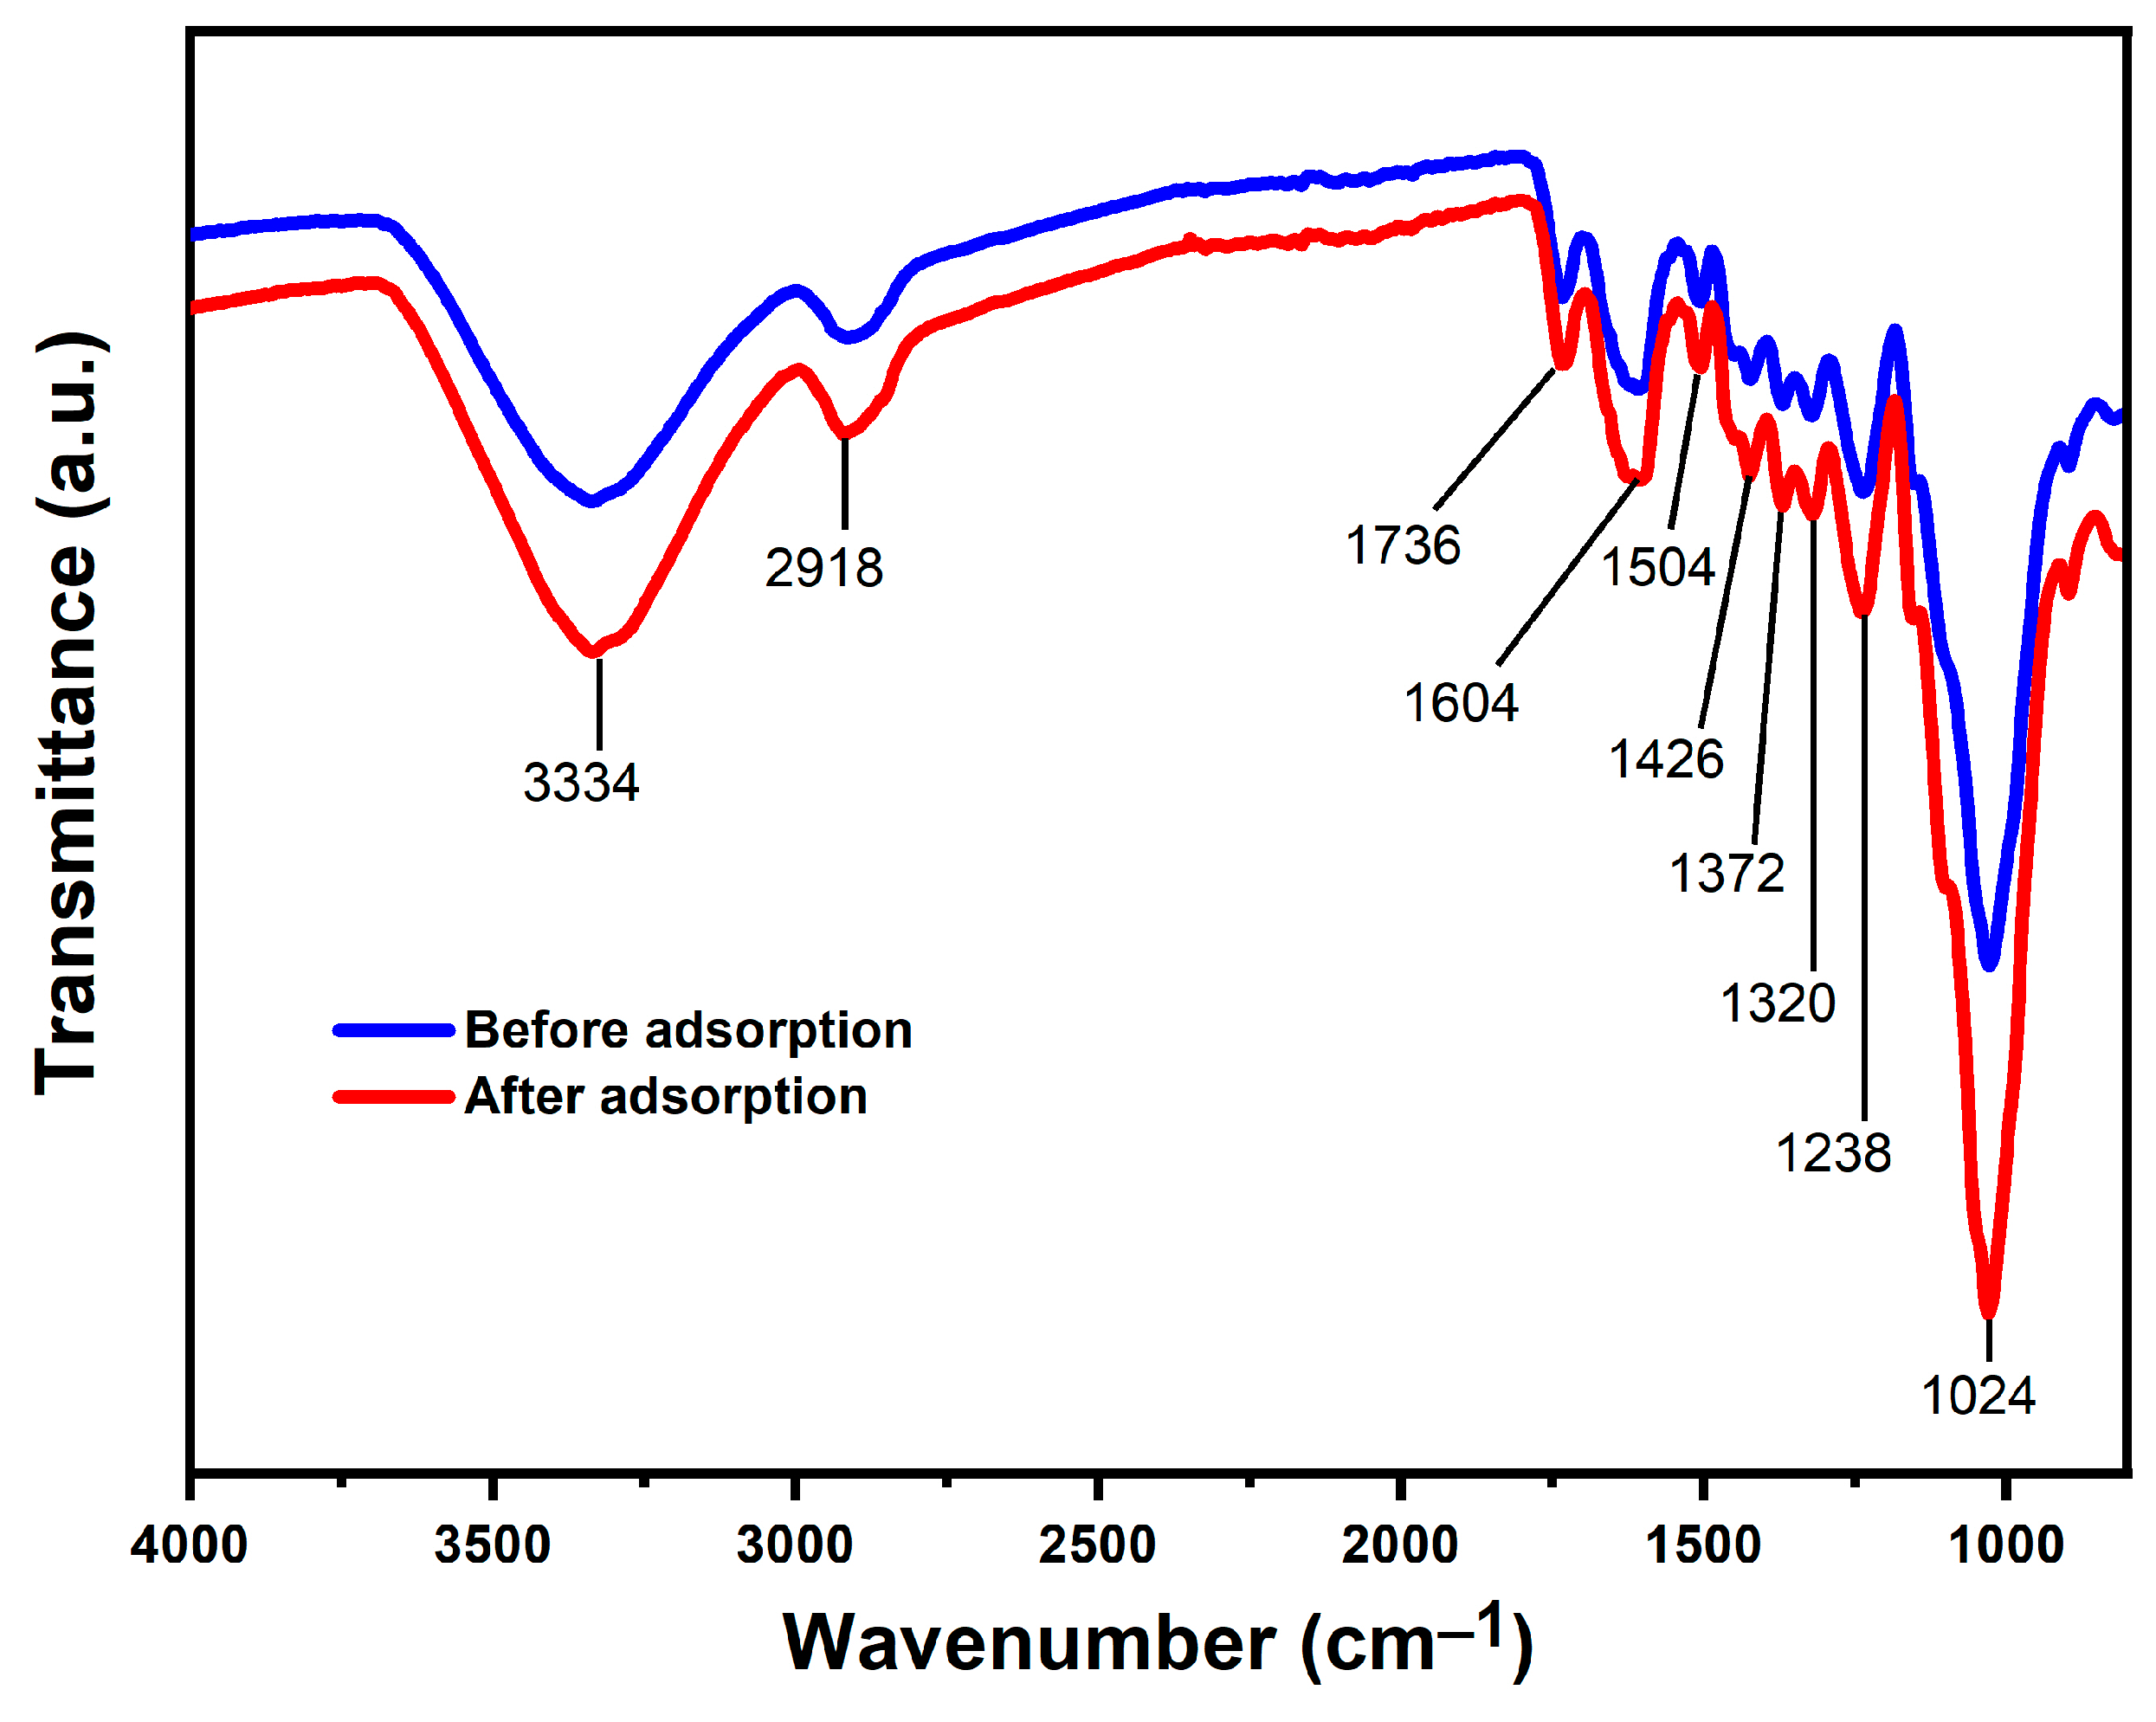
The FTIR technique was used to identify the functional groups that could be involved in copper (II) adsorption on the adsorbent surface. Figure 5 shows the absorption spectrum collected between 800 and 4000 cm−1. The spectrum reveals an absorption band between 3000 and 3500 cm−1, corresponding to hydroxyl groups (OH) of carboxylic acids, phenols, or alcohols. The absorption band observed between 2950 and 2850 cm−1 is attributed to symmetric or asymmetric stretching vibrations of aliphatic (C-H) groups. The peak observed around 1728 and 1738 cm−1 corresponds to the stretching vibrations of the carbonyl bond (C=O) of carboxylic acids.
Additionally, asymmetric and symmetric vibrations of the carboxylate ion (R-COO-) were observed, appearing at 1600–1612 cm−1 and 1500–1516 cm−1, respectively. A high-intensity absorption band appears in the spectrum around 1020 cm−1, which can be assigned to the stretching vibration of the C-OH bond of the alcoholic and carboxylic acid groups. Another peak observed between 1220 and 1240 cm−1 corresponds to the stretching vibrations of the C-O-C bond. Previous investigations have reported that proton-donor functional groups such as hydroxyl and carboxyl groups are involved in the coordination and adsorption of ionic metals such as Cu2+. However, in the infrared spectra obtained, no significant shifts of these absorption bands of the hydroxyl and carboxyl groups after the adsorption of Cu2+ [18,45] can be seen. The observed shifts in the absorption bands involving R-COO ion bonds are less than 10 cm−1. However, a significant increase in the intensity of the absorption bands was observed in the IR spectrum of the adsorbent after Cu2+ adsorption.

3.1.5. EDX Analysis

Figure 6 presents the EDX spectrum and elemental chemical profile of the cotton stalk adsorbent before and after copper adsorption. In the EDX spectrum of the adsorbent before adsorption, low-intensity peaks for copper are observed. However, following adsorption, the adsorbent exhibited two peaks at 8.04 KeV and 8.92 KeV in the EDX spectrum, corresponding to the Kα and Kβ lines of copper X-ray fluorescence emission. Notably, the CuKα signal is the most pronounced, confirming a high copper content in the sample. Tables reflecting the elemental profile indicate that copper in the sample before adsorption was 0.9% and increased to 54.8% after the adsorption. These findings confirm the cotton stalk’s ability to adsorb copper.

3.1.6. SEM Analysis

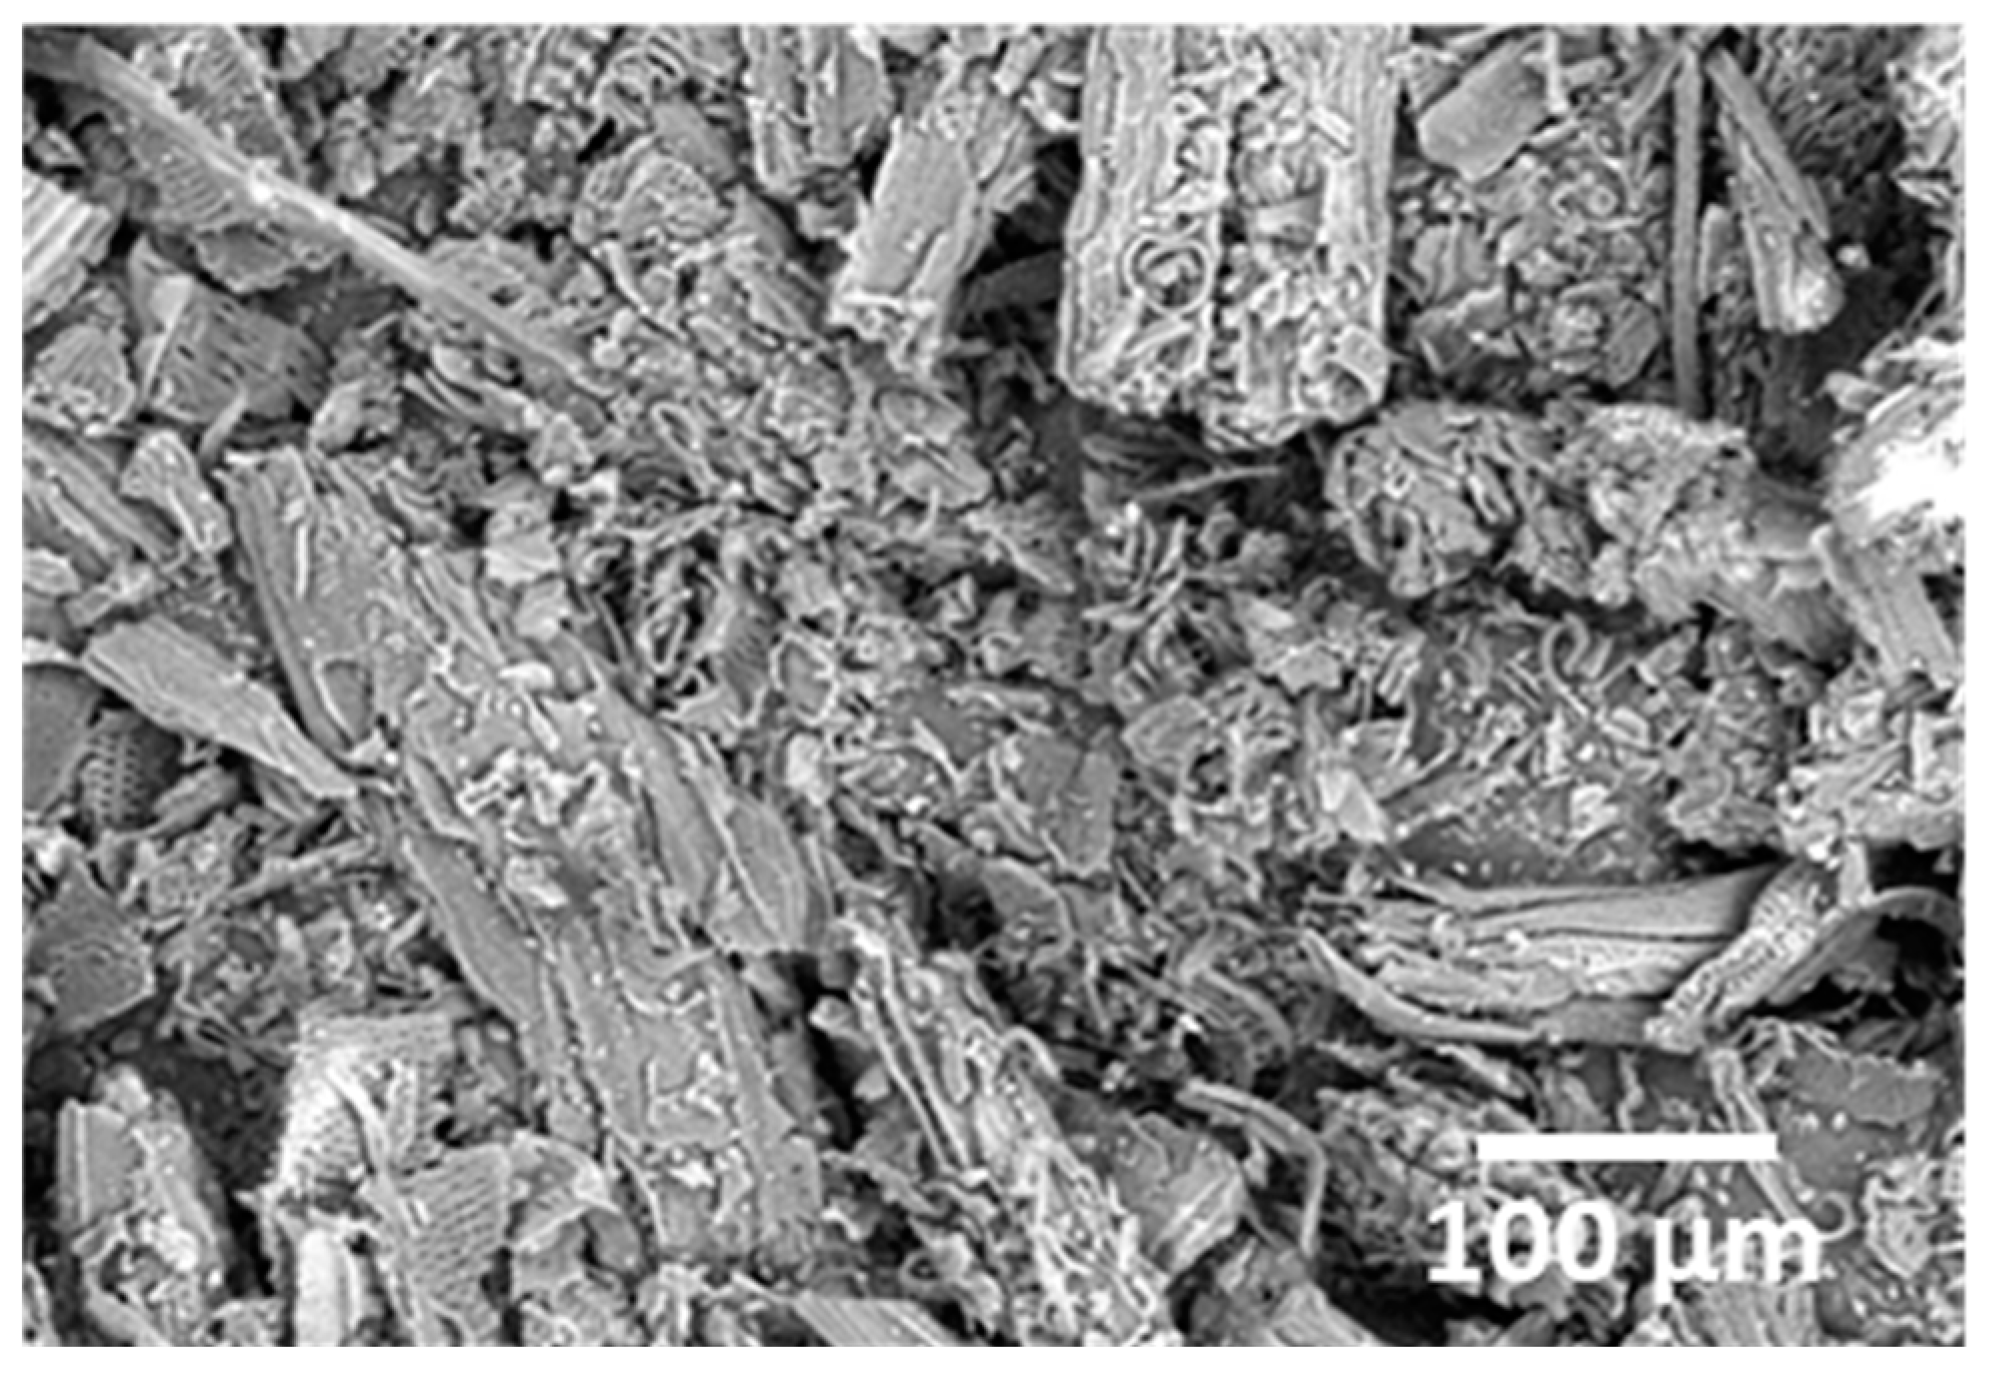
The morphological properties of the cotton stalk were determined by SEM. Figure 7 shows a fibrous structure with numerous cracks and irregular cavities. The adsorbent’s structure also shows pores of different sizes. This porous structure facilitates the diffusion of metal ions inside the adsorbent. In addition, it provides a large specific surface area and many active sites that favor the adsorption of Cu2+ [46].

3.1.7. Thermogravimetric Analysis

Thermal analysis was performed to study the behavior of the adsorbent when subjected to a temperature-controlled program. Figure 8a presents the TGA profile for the thermal decomposition of the ground and screened cotton stalk. The first significant mass loss occurs up to 250 °C due to evaporation of water molecules and volatile compounds, causing a reduction in weight equivalent to 9.6% [47]. A second mass loss of more than 27% was observed between 250 and 310 °C, attributed to the depolymerization and volatilization of hemicellulose [48]. Thermal decomposition continued until the cellulose decomposition temperature reached 325 °C, causing a mass loss of 55.2%. Lignin decomposition was observed in the temperature range between 350 °C and 450 °C. After reaching 450 °C, the TGA curve entered a zone of slow thermal decomposition until 650 °C was reached. In this zone, the carbon material formed in previous stages decomposed.
The DTA curve in Figure 8b shows the temperatures where mass losses or significant thermal decompositions occur. When the temperature fluctuated between 50 and 110 °C, an endothermic transformation attributed to the evaporation of free water was observed. In this temperature range, no chemical changes occurred in the sample [49]. The temperature continued to increase until it reached 325 °C, where the peak of maximum decomposition occurred. This peak corresponded to an exothermic transformation caused by breaking cellulose bonds. Finally, a small peak was observed around 425 °C corresponding to the depolymerization of lignin. Lignin has been reported to exhibit a wide decomposition temperature range (200–450 °C) [50]. However, its decomposition becomes evident at temperatures above 400 °C. Lignin decomposes at higher temperatures than cellulose, indicating higher thermal stability. The results obtained from this analysis agree with the DTA curves reported for other lignocellulosic agricultural residues [50].

3.2. Optimization of Factors Affecting Adsorption

3.2.1. Effect of pH

Figure 9 shows the effect of the pH on the percentage removal of Cu2+ ions in aqueous media. A significant increase in the percentage of removal of Cu2+ ions is observed as the pH increases. This increase reaches its maximum value, equivalent to 47.98%, when the pH of the solution is 5.5. This value agrees with the results obtained in the pHPZC analysis, which showed that the surface becomes negatively charged at a pH higher than 5.1. Therefore, it was considered that pH = 5.5 is the optimum value for the adsorption of Cu2+ ions using cotton stalk as absorbent. In very acidic conditions (pH < 5), the adsorbent removal capacity is substantially reduced, which may be associated with competition between the protons (H+) and the metal ions for binding sites. In addition, a decrease in the percentage removal of Cu2+ ions was observed when the pH reached values above 6. This decrease in Cu2+ adsorption is attributed to the disappearance of the Cu2+ form and the formation of hydroxylated complexes. It has been reported that soluble hydroxylated complexes such as Cu(OH)+; Cu(OH)2; Cu(OH)3 can compete for active sites, reducing the percentage of removal [51].

3.2.2. Effect of Adsorbent Dosage

Figure 10 shows the effect of the adsorbent dosage versus the percentage removal of Cu2+ ions. The adsorption of Cu2+ ions increases with an increasing adsorbent dosage. The adsorption of Cu2+ increased from 32.58 to 46.16% as the adsorbent dosage increased from 0.15 g to 0.30 g, respectively. The maximum percentage removal was 54.95% at an adsorbent dosage of 0.60 g. This behavior is attributed to more active sites available for the adsorption of Cu2+ ions when the amount of adsorbent is increased. Therefore, 0.60 g cotton stalk adsorbent was selected in this study to evaluate the contact time in the subsequent adsorption tests. Similar results using other agricultural residues have been reported. Altameemi et al. (2013) used dried leaves of Conocarpus erectus [52], and Ben-Ali et al. (2017) used combinations of agricultural residues such as Trifolium alexandrinum, Arachis hypogea, and Eucalyptus cameldulensi [9].

3.2.3. Effect of Contact Time

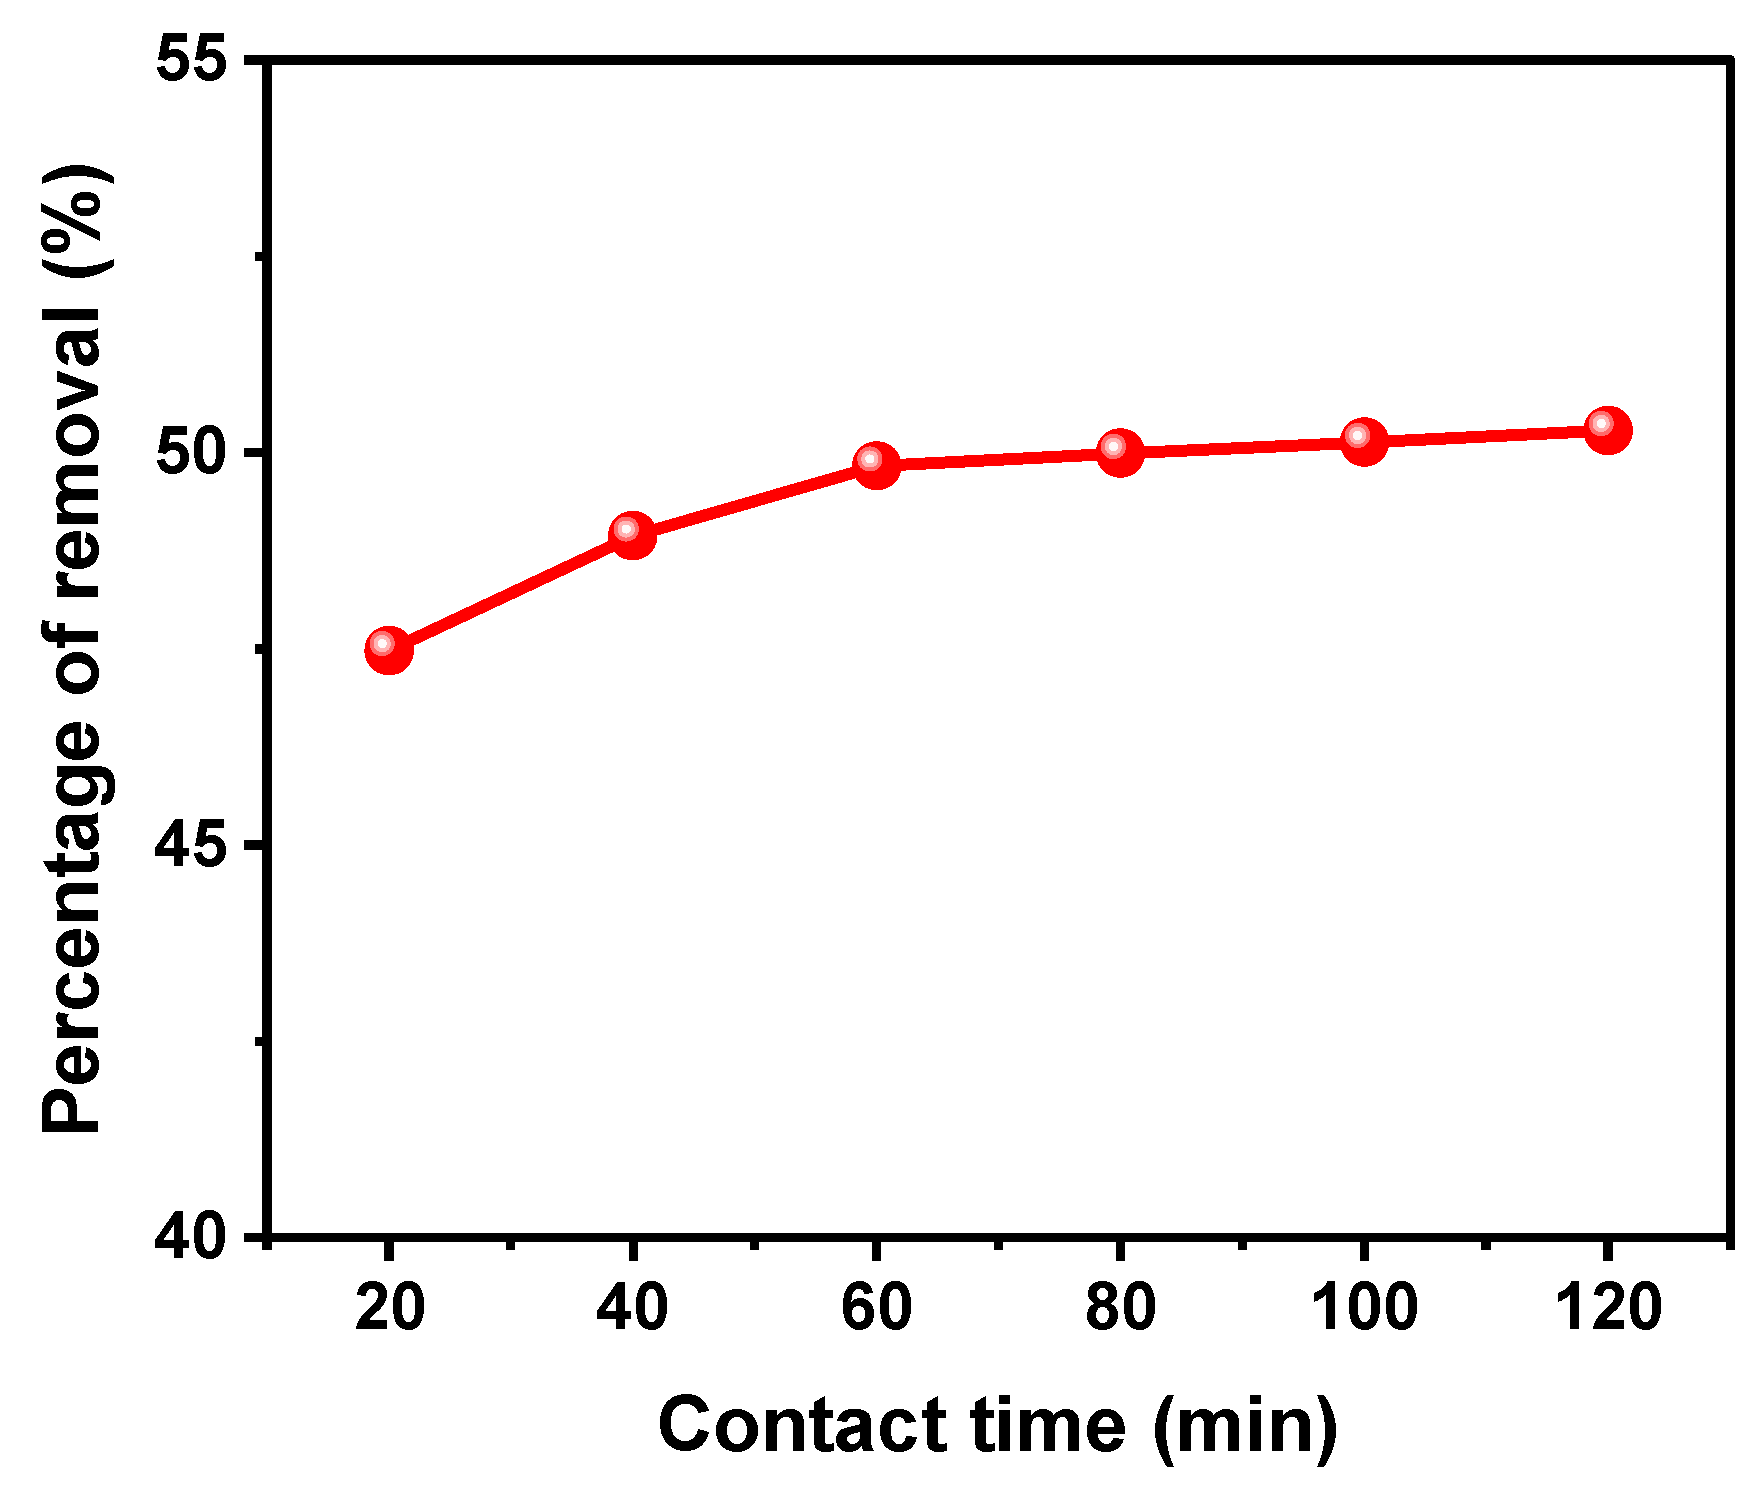
Figure 11 shows the effect of contact time on the percentage removal of Cu2+ ions in an aqueous solution using the cotton stalk adsorbent. The removal rate of Cu2+ ions grows rapidly during the first 20 min, reaching a removal rate of 47.48%. Subsequently, the Cu ion removal rate increases until it reaches a contact time of 60 min, corresponding to a removal rate of 49.83%.
After 60 min, no significant increase in the adsorption rate was observed, which reached a maximum of 50.28% at 120 min. The decrease in adsorption rate for contact times longer than 60 min can be attributed to increased repulsive forces between the cations trapped on the adsorbent surface and the free cations in the solution. These forces inhibit the access of cations in solution to the adsorbent surface and increase the resistance to mass transfer [53,54]. Considering the evolution of the removal percentage over time and the adsorbent saturation at 120 min, 60 min was selected as the optimal contact time in this work.

3.3. Optimal Adsorption Conditions

The Cu2+ adsorption tests were conducted under optimal experimental conditions: pH 5.5, adsorbent dosage 0.60 g, and 60 min contact time. It was found that the cotton stalk adsorbent presents an adsorption capacity of Cu2+ ions equal to qe = 5.56 mg/g and a removal percentage of 66.50% in synthetic solutions of Cu2+ 50 mg/L. The results reveal that this material presents a relatively high Cu2+ ion adsorption capacity compared to the values reported for some natural adsorbents, as shown in Table 2. This adsorption capacity could be related to the presence of carboxyl and hydroxyl groups in the active sites of the lignocellulosic material [55]. These groups provide negative surfaces that favor electrostatic interaction with Cu2+ ions, contributing to the retention and removal of Cu2+ in aqueous solutions.

3.4. Application of the Biosorbent on Wastewater Samples

The biosorbent was used to adsorbate Cu2+ ions on wastewater samples. The concentrations of copper ions in the agricultural wastewater and treated livestock wastewater samples were 0.23 mg/L and 0.07 mg/L, respectively. The values found can be considered low since they do not exceed the permissible limits for copper in wastewater discharge. However, these values show strong fluctuations during the agricultural cycle, which depend on the type of crops, irrigation stages, the presence of pests, and the types of agrochemicals used. Therefore, to evaluate the efficiency of the adsorbent in wastewater samples, the samples were filtered and spiked with copper at a concentration of 25.0 mg/L. This concentration corresponds to a concentration midway through the working concentration range used with synthetic samples and could be considered the concentration point of most excellent accuracy. Considering the adsorption capacity of the adsorbent, a copper removal close to 100% is expected.
Table 3 presents the results obtained from the adsorption experiments with wastewater samples. The percentage of copper removal for the agricultural wastewater and treated livestock wastewater samples was 87.60% and 85.05%, respectively. The removal percentage achieved by the adsorbent was high, considering that the wastewater presents a complex matrix with organic matter and dissolved ions competing for the adsorbent binding sites. In addition, the selectivity of adsorption is affected by ionic strength factors, the ionic species involved, and the pH of the solution, among other factors [11]. Therefore, cotton stalks are an adsorbent that can reduce the concentration of copper ions in wastewater from 25 mg/L to permissible values according to current Mexican standards, whose limit value for discharge water is less than 4.0 mg/L.
The findings of this research highlight the great potential of cotton stalks to remove copper in natural and synthetic aqueous solutions. This adsorbent could be used in tertiary wastewater treatment through packed bed filters or Bach-type agitation tanks to remove copper ions.

3.5. Adsorption Isotherms

The experimental data were fitted using the Langmuir and Freundlich models. The adsorption isotherms for each model are shown in Figure 12, and the values calculated from the isotherm equations are shown in Table 4. The results indicate that the equilibrium adsorption of copper (II) ions on cotton stalk best fits the Freundlich isotherm. The linear regression coefficient for the Freundlich model is considerably higher compared to the Langmuir model. Therefore, this suggests that the molecules adsorb as a multilayer on the heterogeneous surface of the adsorbent.
According to the Langmuir model, the maximum adsorption capacity in the monolayer (qm) for the studied conditions oscillates around 41.49 mg/g. Furthermore, the RL value in the Langmuir isotherm is between 0 and 1. This value suggests a favorable adsorption of copper ions on the cotton stalk adsorbent. However, the results obtained from the Langmuir model are inconclusive due to its poor fit. On the other hand, the Freundlich isotherm presented a value n, corresponding to the adsorption capacity less than unity. This value indicates that the pH conditions in which the process was carried out did not favor adsorption. This behavior was expected because the pH of the solution was not adjusted to the optimum pH, as mentioned in Section 2.6. However, the results were adequately adjusted to the Freundlich model, achieving the characterization of the adsorption process (multilayer) [35].

3.6. Adsorption Kinetics

The pseudo-first-order and pseudo-second-order models were used to study the copper (II) adsorption kinetic process on a cotton stalk adsorbent (Figure 13). Table 5 shows the parameters obtained from the plots for each kinetic model. The fit effect of the pseudo-first-order dynamics was low, with a correlation coefficient (R2) of 0.2549. On the other hand, the pseudo-second-order model has the highest regression coefficient (0.999). Therefore, the adsorption of copper on the cotton stalk adsorbent follows the pseudo-second-order model. This indicates that the process is controlled by chemical adsorption involving valence attraction forces or possible electron exchange between adsorbate and adsorbent [60]. This result agrees with the investigations of Phuengphai et al., 2021 and Ben-Ali et al., 2017 for the adsorption of Cu(II) in an aqueous solution using modified and unmodified biomass. The authors found that adsorption follows the pseudo-second-order mechanism [9,11].

4. Conclusions

Cotton stalk is an abundant agricultural waste in the Mexicali Valley, and its final disposal generally becomes a problem of environmental contamination. Therefore, it is essential to conduct research that contributes to the search for alternatives to improve its final disposal and reintegrate it into production processes. This work evaluated the capacity of cotton stalks to remove and eliminate copper from agricultural and livestock wastewater. The effect of the pH, adsorption effect of the pH, adsorbent dosage, and contact time on the equilibrium removal rate were investigated. It was found that the optimum adsorption conditions were a solution pH equal to 5.5, an adsorbent dosage equal to 0.6 g, and a contact time equal to 60 min. These adsorption conditions enabled a copper removal percentage of around 66.5% when synthetic samples of initial concentration equivalent to 50 mg/L of copper were used.
In the agricultural wastewater and treated livestock wastewater samples, the removal of copper ions reached a percentage of 87.60% and 85.05%, respectively, when the initial concentration was 25 mg/L of copper. The adsorption equilibrium data were adequately adjusted to the Freundlich isotherm model, with an R2 of 0.999. On the other hand, adsorption kinetics studies show that the adsorption process of copper on cotton stalk follows pseudo-second-order kinetics, suggesting that chemical sorption is the mechanism governing adsorption. The physicochemical, morphological, structural, and adsorption studies reveal the relevant potential of cotton stalk as an adsorbent in removing copper from agricultural and livestock wastewater.

Author Contributions

Conceptualization, M.T.B.C. and R.T.R.; methodology, J.R.C.S. and M.A.C.Á.; software, R.T.R. and A.M.G.; validation, M.T.B.C., D.G.M. and B.V.S.; formal analysis, M.T.B.C. and B.V.S.; investigation, R.T.R. and M.T.B.C.; resources, J.R.C.S. and M.A.C.Á.; data curation, A.M.G. and M.A.C.Á.; writing—original draft preparation, M.T.B.C., R.T.R. and M.A.C.Á.; writing—review and editing, B.V.S., A.M.G., R.T.R. and D.G.M. visualization, R.T.R. and J.R.C.S.; supervision, A.M.G., R.T.R., D.G.M. and M.T.B.C.; project administration, M.T.B.C., B.V.S. and D.G.M. All authors have read and agreed to the published version of the manuscript.

Funding

This research received no external funding.

Institutional Review Board Statement

Not applicable.

Informed Consent Statement

Not applicable.

Data Availability Statement

Data is contained within the article.

Conflicts of Interest

The authors declare no conflicts of interest.

References

  1. Abdelfatah, A.M.; El-Maghrabi, N.; Mahmoud, A.E.D.; Fawzy, M. Synergetic effect of green synthesized reduced graphene oxide and nano-zero valent iron composite for the removal of doxycycline antibiotic from water. Sci. Rep. 2022, 12, 19372. [Google Scholar] [CrossRef] [PubMed]
  2. Chaoua, S.; Boussaa, S.; El Gharmali, A.; Boumezzough, A. Impact of irrigation with wastewater on accumulation of heavy metals in soil and crops in the region of Marrakech in Morocco. J. Saudi Soc. Agric. Sci. 2019, 18, 429–436. [Google Scholar] [CrossRef]
  3. Nagy, H.; Fawzy, M.; Hafez, E.; Mahmoud, A.E.D. Potentials of mono-and multi-metal ion removal from water with cotton stalks and date palm stone residuals. Environ. Sci. Pollut. Res. 2023, 1, 1–17. [Google Scholar] [CrossRef]
  4. Moosavi, S.G.; Seghatoleslami, M.J. Phytoremediation: A review. Adv. Agri. Biol. 2013, 1, 5–11. Available online: www.pscipub.com/AAB (accessed on 4 April 2024).
  5. Safardastgerdi, M.; Ardejani, F.D.; Mahmoodi, N.M. Lignocellulosic biomass functionalized with EDTA dianhydride for removing Cu (II) and dye from wastewater: Batch and fixed-bed column adsorption. Miner. Eng. 2023, 204, 108423. [Google Scholar] [CrossRef]
  6. NOM-001-SEMARNAT-1996; Que Establece los Límites Máximos Permisibles de Contaminantes en las Descargas de Aguas Residuales en Aguas y Bienes Nacionales. SEMARNAT, Secretaría de Medio Ambiente y Recursos Naturales: Mexico City, Mexico, 1996.
  7. Semerjian, L. Removal of heavy metals (Cu, Pb) from aqueous solutions using pine (Pinus halepensis) sawdust: Equilibrium, kinetic, and thermodynamic studies. Environ. Technol. Innov. 2018, 12, 91–103. [Google Scholar] [CrossRef]
  8. Abdolali, A.; Ngo, H.H.; Guo, W.; Zhou, J.L.; Du, B.; Wei, Q.; Nguyen, P.D. Characterization of a multi-metal binding biosorbent: Chemical modification and desorption studies. Bioresour. Technol. 2015, 193, 477–487. [Google Scholar] [CrossRef] [PubMed]
  9. Ben-Ali, S.; Jaouali, I.; Souissi-Najar, S.; Ouederni, A. Characterization and adsorption capacity of raw pomegranate peel biosorbent for copper removal. J. Clean. Prod. 2017, 142, 3809–3821. [Google Scholar] [CrossRef]
  10. Benaissa, H.; Elouchdi, M.A. Removal of copper ions from aqueous solutions by dried sunflower leaves. Chem. Eng. Process. 2007, 46, 614–622. [Google Scholar] [CrossRef]
  11. Phuengphai, P.; Singjanusong, T.; Kheangkhun, N.; Wattanakornsiri, A. Removal of copper(II) from aqueous solution using chemically modified fruit peels as efficient low-cost biosorbents. Appl. Water Sci. 2021, 14, 286–294. [Google Scholar] [CrossRef]
  12. Tong, K.S.; Kassim, M.J.; Azraa, A. Adsorption of copper ion from its aqueous solution by a novel biosorbent Uncaria gambir: Equilibrium, kinetics, and thermodynamic studies. J. Chem. Eng. 2011, 170, 145–153. [Google Scholar] [CrossRef]
  13. Rubio, D.I.C.; Calderón, R.A.M.; Gualtero, A.P.; Acosta, D.R.; Sandoval, J. Treatments for Removal of Heavy Metals Commonly Found in Industrial Wastewater. A Review. Ing. Y Región. 2015, 13, 73–90. Available online: https://dialnet.unirioja.es/servlet/articulo?codigo=5432290 (accessed on 4 April 2024).
  14. Bhatnagar, A.; Sillanpää, M.; Witek-Krowiak, A. Agricultural waste peels as versatile biomass for water purification–A review. J. Chem. Eng. 2015, 270, 244–271. [Google Scholar] [CrossRef]
  15. Akperov, E.O.; Akperov, O.H. The wastage of the cotton stalks (Gossypium hirsutum L.) as low-cost adsorbent for removal of the Basic Green 5 dye from aqueous solutions. Appl. Water Sci. 2019, 9, 175–183. [Google Scholar] [CrossRef]
  16. Bohli, T.; Ouederni, A.; Fiol, N.; Villaescusa, I. Evaluation of an activated carbon from olive stones used as an adsorbent for heavy metal removal from aqueous phases. Comptes Rendus Chim. 2015, 18, 88–99. [Google Scholar] [CrossRef]
  17. Argun, M.E.; Dursun, S.; Ozdemir, C.; Karatas, M. Heavy metal adsorption by modified oak sawdust: Thermodynamics and kinetics. J. Hazard. Mater. 2007, 141, 77–85. [Google Scholar] [CrossRef] [PubMed]
  18. Tasaso, P. Adsorption of copper using pomelo peel and depectinated pomelo peel. J. Clean. Energy Technol. 2014, 2, 154–157. [Google Scholar] [CrossRef]
  19. Ozsoy, H.D.; Kumbur, H. Adsorption of Cu (II) ions on cotton boll. J. Hazard. Mater. 2006, 136, 911–916. [Google Scholar] [CrossRef] [PubMed]
  20. Li, J.; Jia, D.M.; Li, C.H.; Yu, B.Q. Adsorption Removal of Copper and Nickel Ions from Wastewater by Ammonia Modified Cotton Stalks. Adv. Mater. Res. 2014, 955, 2440–2443. [Google Scholar] [CrossRef]
  21. Kahraman, S.; Dogan, N.; Erdemoglu, S. Use of various agricultural wastes for the removal of heavy metal ions. IJEP 2008, 34, 275–284. [Google Scholar] [CrossRef]
  22. Ma, F.; Zhao, B.; Diao, J. Synthesis of magnetic biochar derived from cotton stalks for the removal of Cr (VI) from aqueous solution. Water Sci. Technol. 2019, 79, 2106–2115. [Google Scholar] [CrossRef] [PubMed]
  23. SIAP, Servicio de Información Agroalimentaria y Pesquera. Producción Agrícola: Resumen Nacional por Estado. Available online: https://www.gob.mx/siap (accessed on 10 July 2023).
  24. Gallardo, T.M.F.; Cortez, L.A.A. Failed Water Governance Processes in the Mexicali Region. The Socio-environmental Conflict over the Constellation Brands Beer Plant. Norteamérica 2022, 17, 1–20. Available online: https://www.scielo.org.mx/scielo.php?pid=S1870-35502022000100011&script=sci_abstract&tlng=en (accessed on 4 April 2024).
  25. ASTM E777–08; Standard Test Method for Carbon and Hydrogen in the Analysis Sample of Refuse Derived Fuel. ASTM International: West Conshohocken, PA, USA, 2008.
  26. ASTM E870-82; Standard Test Methods for Analysis of Wood Fuels. ASTM International: West Conshohocken, PA, USA, 2006.
  27. ASTM E871-82; Standard Test Method for Moisture Analysis of Particulate Wood Fuels. ASTM International: West Conshohocken, PA, USA, 2006.
  28. Amaringo, V.F.A.; Hormaza, A.A. Determination of the point of zero charge and isoelectric point of two agricultural wastes and their application in the removal of colorants. Rev. De Investig. Agrar. Y Ambient. 2013, 4, 27–37. Available online: https://dialnet.unirioja.es/servlet/articulo?codigo=5344979 (accessed on 4 April 2024).
  29. Boehm, H.P. Surface oxides on carbon and their analysis: A critical assessment. Carbon 2002, 40, 145–149. [Google Scholar] [CrossRef]
  30. Method 3500 Cu; Standard Methods for the Examination of Water & Wastewater, 21st ed. APHA, AWWA, WPCF: Washington, DC, USA, 2005.
  31. Chaiyaraksa, C.; Jaipong, T.; Tamnao, P.; Imjai, A. Durian and mangosteen shell-derived biochar amendment on the removal of zinc, lead and cadmium. STA 2017, 22, 87–97. [Google Scholar] [CrossRef]
  32. Engates, K.E.; Shipley, H.J. Adsorption of Pb, Cd, Cu, Zn, and Ni to titanium dioxide nanoparticles: Effect of particle size, solid concentration, and exhaustion. Environ. Sci. Pollut. Res. 2011, 18, 386–395. [Google Scholar] [CrossRef] [PubMed]
  33. Foo, K.Y.; Hameed, B.H. Insights into the modeling of adsorption isotherm systems. J. Chem. Eng. 2010, 156, 2–10. [Google Scholar] [CrossRef]
  34. Langmuir, I. The adsorption of gases on plane surfaces of glass, mica and platinum. J. Am. Chem. Soc. 1918, 40, 1361–1403. [Google Scholar] [CrossRef]
  35. Freundlich, H. Ueber Thixotropie. Colloid. Polym. Sci. 1928, 46, 289–299. [Google Scholar] [CrossRef]
  36. Benavente, M. Adsorption of Metallic Ions onto Chitosan: Equilibrium and Kinetic Studies. Ph.D. Dissertation, Royal Institute of Technology (KTH), Stockholm, Sweden, 2008. Available online: https://www.diva-portal.org/smash/record.jsf?pid=diva2%3A13755&dswid=-283 (accessed on 14 December 2023).
  37. Bozbaş, S.K.; Boz, Y. Low-cost biosorbent: Anadara inaequivalvis shells for removal of Pb(II) and Cu(II) from aqueous solution. Process Saf. Environ. Prot. 2016, 103, 144–152. [Google Scholar] [CrossRef]
  38. Lagergren, S. About the theory of so-called adsorption of soluble substances. K. Sven. Vetenskapsakademiens Handl. 1898, 24, 1–39. Available online: https://sid.ir/paper/563615/en (accessed on 17 December 2023).
  39. Ho, Y.S.; McKay, G.A. Comparaison of chemisorption kinetic models applied to pollutant removals on various sorbents. Process Saf. Environ. Prot. 1998, 76, 332. [Google Scholar] [CrossRef]
  40. Ho, Y.S.; McKay, G. The kinetics of sorption of divalent metal ions onto sphagnum moss peat. Water Res. 2000, 34, 735–742. [Google Scholar] [CrossRef]
  41. Ho, Y.S.; McKay, G. Pseudo-second order model for sorption processes. Process Biochem. 1999, 34, 451–465. [Google Scholar] [CrossRef]
  42. Wang, G.; Luo, Y.; Deng, J.; Kuang, J.; Zhang, Y. Pretreatment of biomass by torrefaction. Chin. Sci. Bull. 2011, 56, 1442–1448. [Google Scholar] [CrossRef]
  43. Chen, W.H.; Peng, J.; Bi, X.T. A state-of-the-art review of biomass torrefaction, densification and applications. Renew. Sustain. Energy Rev. 2015, 44, 847–866. [Google Scholar] [CrossRef]
  44. Hatfield, J.L.; Prueger, J.H. Temperature extremes: Effect on plant growth and development. Weather Clim. Extrem. 2015, 10, 4–10. [Google Scholar] [CrossRef]
  45. Zhou, L.; Shao, J.Z.; Feng, X.X.; Chen, J.Y. Effect of high-temperature degumming on the constituents and structure of cotton stalk bark fibers. J. Appl. Polym. Sci. 2012, 125, 573–579. [Google Scholar] [CrossRef]
  46. Torres, R.; Valdez, B.; Beleño, M.T.; Coronado, M.A.; Stoytcheva, M.; García, C.; Rojano, B.A.; Montero, G. Char production with high-energy value and standardized properties from two types of biomass. Biomass Convers. Biorefin. 2021, 13, 4831–4847. [Google Scholar] [CrossRef]
  47. Tan, I.A.W.; Shafee, N.M.; Abdullah, M.O.; Lim, L.L.P. Synthesis and characterization of biocoal from Cymbopogon citrates residue using microwave-induced torrefaction. Environ. Technol. Innov. 2017, 8, 431–440. [Google Scholar] [CrossRef]
  48. Nam, H.; Capareda, S. Experimental investigation of torrefaction of two agricultural wastes of different composition using RSM (response surface methodology). Energy 2015, 91, 507–516. [Google Scholar] [CrossRef]
  49. Liu, X.; Yuan, L.; Yang, X. Evolution of chemical functional groups during torrefaction of rice straw. Bioresour. Technol. 2021, 320, 124328. [Google Scholar] [CrossRef] [PubMed]
  50. Manatura, K. Inert torrefaction of sugarcane bagasse to improve its fuel properties. Case Stud. Therm. Eng. 2020, 19, 100623. [Google Scholar] [CrossRef]
  51. Wang, X.; Liang, X.; Wang, Y.; Wang, X.; Liu, M.; Yin, D.; Zhang, Y. Adsorption of Copper (II) onto activated carbons from sewage sludge by microwave-induced phosphoric acid and zinc chloride activation. Desalination 2011, 278, 231–237. [Google Scholar] [CrossRef] [PubMed]
  52. Altameemi, I.A.; Thuraya, M.A.; Tarikak, N. A new simple method for the treatment of wastewater containing Cu (II) and Zn (II) Ions using adsorption on dried Conocarpus erectus leaves. Basra J. Vet. Res. 2013, 39, 125–136. [Google Scholar]
  53. El-Ashtoukhy, E.S.; Amin, N.K.; Abdelwahab, O. Removal of lead (II) and copper (II) from aqueous solution using pomegranate peel as a new adsorbent. Desalination 2008, 223, 162–173. [Google Scholar] [CrossRef]
  54. Fiol, N.; Villaescusa, I.; Martínez, M.; Miralles, N.; Poch, J.; Serarols, J. Sorption of Pb (II), Ni (II), Cu (II) and Cd (II) from aqueous solution by olive stone waste. Sep. Purif. Technol. 2006, 50, 132–140. [Google Scholar] [CrossRef]
  55. Abdolali, A.; Guo, W.S.; Ngo, H.H.; Chen, S.S.; Nguyen, N.C.; Tung, K.L. Typical lignocellulosic wastes and by-products for biosorption process in water and wastewater treatment: A critical review. Bioresour. Technol. 2014, 160, 57–66. [Google Scholar] [CrossRef] [PubMed]
  56. Aman, T.; Kazi, A.A.; Sabri, M.U.; Bano, Q. Potato peels as solid waste for the removal of heavy metal copper (II) from waste water/industrial effluent. Colloids Surf. B Biointerfaces 2008, 63, 116–121. [Google Scholar] [CrossRef] [PubMed]
  57. Annadurai, G.; Juang, R.S.; Lee, D.J. Adsorption of heavy metals from water using banana and orange peels. Water Sci. Technol. 2003, 47, 185–190. [Google Scholar] [CrossRef]
  58. Grimm, A.; Zanzi, R.; Björnbom, E.; Cukierman, A.L. Comparison of different types of biomasses for copper biosorption. Bioresour. Technol. 2008, 99, 2559–2565. [Google Scholar] [CrossRef] [PubMed]
  59. Hansen, H.K.; Arancibia, F.; Gutiérrez, C. Adsorption of copper onto agriculture waste materials. J. Hazard. Mater. 2010, 180, 442–448. [Google Scholar] [CrossRef] [PubMed]
  60. Keawkim, K.; Khamthip, N. Removal of Pb2+ ion from industrial wastewater by new efficient biosorbents of Oyster plant (Tradescantia spathacea Steam) and Negkassar leaf (Mammea siamensis T. Anderson). Chiang Mai J. Sci. 2018, 45, 369–379. Available online: https://epg.science.cmu.ac.th/ejournal/search-journal.php?aid=1345 (accessed on 6 January 2024).
Figure 1. The sequences of activities used to evaluate the performance of cotton stalk as a copper (II) adsorbent.
Sustainability 16 04291 g001
Figure 2. The cotton stalk (a) and cotton stalk adsorbent dried, ground, and sieved (b).
Sustainability 16 04291 g002
Figure 3. pHPZC of adsorbent.
Sustainability 16 04291 g003
Figure 4. Obtaining equivalence volume for acidic (a) and basic (b) groups of the adsorbent.
Sustainability 16 04291 g004
Figure 5. FTIR spectrum of cotton stalk adsorbent before and after adsorption.
Sustainability 16 04291 g005
Figure 6. EDX spectrum and chemical profile of adsorbent before (a) and after adsorption (b).
Sustainability 16 04291 g006
Figure 7. SEM image of biosorbent of cotton stalk.
Sustainability 16 04291 g007
Figure 8. TGA (a) and DTA (b) analysis of the cotton stalk adsorbent.
Sustainability 16 04291 g008
Figure 9. Effect of pH on Cu2+ percentage of removal.
Sustainability 16 04291 g009
Figure 10. Effect of dosage on Cu2+ removal percentage.
Sustainability 16 04291 g010
Figure 11. Effect of contact time on Cu2+ removal percentage.
Sustainability 16 04291 g011
Figure 12. Langmuir and Freundlich isotherm models for Cu(II) adsorption using cotton stalk absorbents.
Sustainability 16 04291 g012
Figure 13. Kinetic adsorption models for Cu(II) adsorption using cotton stalk absorbents.
Sustainability 16 04291 g013
Table 1. Proximal and elemental analysis of adsorbent.
AnalysisContentWeight (%)
HumidityWater6.15
ProximalFixed carbon22.88
Volatile material72.35
Ash5.15
ElementalCarbon (C)47.91
Hydrogen (H)5.66
Oxygen (O)45.57
Nitrogen (N)0.75
Sulfur (S)0.11
Table 2. Natural adsorbents of copper (II) in aqueous solution.
Natural Adsorbent MaterialpH q e (mg/g) Ref.Ref.
Potato peels6.00.38Aman et al. (2008) [56]
Oak sawdust (Quercus coccifera)43.60Argun et al. (2007)[17]
Orange peel5.93.65Annadurai et al. (2003)[57]
Birchwood (Betula sp.)5.54.90Grimm et al. (2008)[58]
Ammonia Modified Cotton Stalks51.88Li et al. (2014)[20]
Cotton Stalk5.55.56This study
Banana peel5.95.75Annadurai et al. (2003)[57]
Uncaria gambir5.09.95Tong et al. (2011)[12]
Peach stones/and pine sawdust˂710.0/15.0Hanse et al. (2010)[59]
Pitahaya peel5.021.33Phuengphai et al. (2021)[11]
Pomegranate peel5.830.12Ben-Ali et al. (2017)[9]
Table 3. Comparison of analysis results of contaminated water samples before and after adsorption treatment.
ParameterAgricultural WastewaterTreated Livestock Wastewater
UntreatedTreated% RemovedUntreatedTreated% Removed
pH7.865.5-7.815.5-
C.E (dS/m)1.511.27-1.851.64-
TDS (mg/L)76065014.479308409.67
Cu2+ (mg/L) *0.07--0.16--
Cu2+ (mg/L) **25.973.2287.6025.163.7685.05
* Cu2+ in water samples; ** Cu2+ added to water samples.
Table 4. Langmuir and Freundlich isotherm parameters for Cu(II) adsorption using cotton stalk absorbents.
Isotherm ModelsIsotherm Parameters
Langmuir Modelqm (mg/g)KL (L/mg)RLR2
Absorbent41.490.00390.830.5542
Freundlich modelKFnf1/nfR2
Absorbent0.11440.87711.14010.9910
Table 5. Kinetic parameters for Cu(II) adsorption onto cotton stalk adsorbents.
Kinetic ModelsKinetic Parameters
Co
(mg/L)
qe
(mg/g)
k1
(min−1)
k2
(g/(mg∙min))
R2
Pseudo-first order501.23190.9971-0.2549
Pseudo-second order504.6210-0.33690.9999
Disclaimer/Publisher’s Note: The statements, opinions and data contained in all publications are solely those of the individual author(s) and contributor(s) and not of MDPI and/or the editor(s). MDPI and/or the editor(s) disclaim responsibility for any injury to people or property resulting from any ideas, methods, instructions or products referred to in the content.