1. Introduction
With rising environmental pollution and frequent natural disasters like El Niño and forest fires, governments globally are increasingly leaning towards implementing environmental regulations (ER), urging companies to conserve energy and lower emissions. For instance, The Paris Agreement encourages countries to adopt the carbon emissions trading system to achieve a low-carbon economic development transition (Lian et al., 2022) [
1]. Environmental regulations can bring additional compliance cost on entities and, thus, destroy firms’ performance. To avoid the negative impact of ER on firm performance, enterprises may choose to conduct green innovation activities (Lian et al., 2022) [
1]. Green innovation, also known as green technology innovation or sustainable innovation, was first proposed by Braun and Wield (1994) [
2]. It refers to innovations in technology associated with ecological environment improving, energy saving, waste recycling, and emissions reduction (Carrion-Flores and Innes, 2010 [
3]; Bai et al., 2019 [
4]).
Research on green innovation predominantly adopts an optimistic attitude. Chen (2011) [
5] proposed that green innovation encompasses specific aspects within actual production processes, including waste treatment, recycling, and the manufacturing of green products, among others. As economic development progresses and there is a growing national emphasis on environmental protection, the concept of green innovation is continually evolving and broadening. Some scholars have adopted broader interpretations of green innovation, also referring to it as environmental or ecological innovation. They contend that over the long term, green innovation has the potential to not only alleviate adverse environmental effects but also yield economic advantages by optimizing the utilization of limited resources, while promoting social cohesion (Fu et al., 2016 [
6]).
Su, He, and Yin (2009) [
7], from a corporate standpoint, define corporate green innovation as the process of increasing innovation’s economic benefits while considering long-term economic and environmental gains. Besides core green technological innovation, innovation in green systems also holds significance and has guiding and supportive roles, with both aspects complementing each other (Chen and Feng, 2020 [
8]). Given the increasingly pivotal role of green innovation, it is worthwhile to explore strategies for stimulating enterprises’ green innovation practices.
Several factors may influence the extent of corporate green innovation. Among these, institutional investors wield considerable influence on firms, as they provide financing. Green investors, a subset of institutional investors particularly focused on environmental protection, deserve closer examination. Previous studies on the impact of institutional investors on technological innovations have generally treated them as a collective entity, without distinguishing between different types of investors based on their motivations. This paper aims to address this gap by specifically investigating the impact of the presence of green investors on enterprises’ green innovation initiatives.
In line with previous research (e.g., Jiang, Lu, and Li, 2021 [
9]), we define green investors as funds that specifically target and invest in sectors related to green initiatives, environmental preservation, renewable energy, and ecological sustainability. Despite the fact that China’s socially responsible fund market is still in its nascent stages, these funds demonstrate distinct objectives compared to traditional investment funds, incorporating economic, environmental, and social considerations (Zhang, 2021 [
10]). Drawing from stakeholder theory, which posits that enterprises have a responsibility to fulfill the needs of various stakeholders, we anticipate that the presence of green investors will incentivize firms to engage in green innovation.
Variations in institutional frameworks play a significant role in shaping differences in innovation activity and performance among nations (Choi, Lee, and Williams, 2011 [
11]). For example, the Anglo-American model is characterized by widely dispersed ownership, reliance on equity-based financing systems, and a market-centric approach to corporate oversight. The German–Japanese stakeholder model emphasizes long-term and bank-centric finance, ownership concentration by large blockholders, and control mechanisms rooted in insider influence (e.g., La Porta et al., 1996 [
12]; Hall and Soskice, 2001 [
13]; Aguilera and Jackson, 2003 [
14]). However, due to substantial institutional diversity, many countries do not neatly fit into these established models (Aguilera and Jackson, 2003 [
14]).
Chinese corporations, for instance, demonstrate distinctive corporate governance characteristics, including concentrated ownership structures (Choi et al., 2011 [
11]), ownership by families and insiders (Filatotchev et al., 2007 [
15]), state ownership, and an increasing presence of institutional and foreign investors (Chang, Chung, and Mahmood, 2006 [
16]). Given the transitioning nature of the Chinese economy, exploring green innovation within Chinese listed entities offers valuable insights into the literature on this topic.
Furthermore, we examine how state ownership affect the influence of green investors. State-owned enterprises (SOEs), known for their political significance, are utilized by governments as a means to engage in the market. We contend that due to the alignment between the environmentally beneficial nature of green innovation and the inherently public nature of SOEs, these enterprises will exhibit increased enthusiasm and effectiveness in pursuing green technological innovation.
Regarding the relationship between environmental regulation and enterprises’ innovation practices, three main perspectives emerge. The first perspective, known as the “Porter Hypothesis”, initially introduced by Porter (1991) [
17], proposing that economic development and environmental protection are not mutually exclusive but rather mutually reinforcing. From a corporate standpoint, adherence to appropriate environmental regulations can enhance a company’s enthusiasm and capabilities for innovation, optimize resource utilization, and ultimately strengthen its competitive edge (Porter, 1991 [
17]). Porter and Van der Linde (1995) [
18] further refined this hypothesis, arguing that well-designed environmental regulations enforced by governments or pressures from other stakeholders can stimulate businesses to actively innovate. Despite the substantial resources and costs required for research and development efforts, the eventual benefits of innovation outweigh the associated costs and yield additional returns, a phenomenon known as the “innovation-offset effect” (Porter and Van der Linde, 1995 [
18]). While this effect may not be immediately evident in the short term and may only partially offset costs, in the long run, environmental regulations contribute to a company’s competitiveness and operational efficiency, enabling it to fulfill its social responsibility for both environmental protection and economic development.
The second perspective presents an opposing argument, asserting that environmental regulations impose burdens on enterprises, leading to a reduction in technological investments and consequently harming innovation (Song, Zhang, and Zhang, 2021 [
19]). Conversely, the third perspective suggests uncertainty regarding the relationship between environmental regulation and corporate innovation activities, proposing the potential for a non-linear correlation between the two (Huang et al., 2022 [
20]).
We aim to investigate whether the Porter hypothesis holds true by analyzing the influence of state ownership on the implementation of green innovation practices. Ownership structure can significantly impact the adoption of green technology innovation. Theoretical research on innovation within state-owned enterprises (SOEs) typically explores managerial, political, and resource-based perspectives. From a managerial standpoint, the principal-agent problem suggests that SOEs, facing governance challenges, may exhibit conservatism, leading to limited enthusiasm for green innovation. The political perspective argues that government control over SOEs can hinder efficiency due to political influences on decision-making processes. However, the resource perspective suggests that SOEs, with their access to abundant resources, are well-positioned for green innovation initiatives. Moreover, the close alignment between SOEs and the government can reduce information asymmetry, thereby enhancing innovation efficiency.
Using a sample of 10,100 firm-year observations of Shanghai and Shenzhen A-share listed companies from 2010 to 2019, we investigate whether green investors’ holdings can effectively promote corporate green technological innovation, as well as the moderating role of state-owned enterprises in the relationship between green investors and green technological innovation. We conduct fixed effect regression analysis to test our hypotheses. According to the existing literature, we expect that the entry of green investors will positively affect corporate green innovation. In addition, we expect more pronounced results in state-owned enterprises. Empirical results support our hypotheses, suggesting that the presence of green investors encourage enterprises’ green innovation activities. We also find that this positive effect of green investors on green innovation is more pronounced among state-owned enterprises, indicating the nation’s relatively sound environmental regulations (ER) system and strong regulation. Our finding provide support for the Porter hypothesis. Our findings are robust to instrumental analysis, propensity score matching analysis, multi-time-point difference-in-differences analysis, and alternative measurement tests.
Our research makes several significant contributions to the existing literature. Firstly, we distinguish between green investors and general institutional investors, demonstrating the positive influence of environmentally focused investors on corporate innovation. Secondly, we separate green innovation from general technological innovation, allowing for a precise assessment of how green investors impact environmental innovation within enterprises. Thirdly, our findings highlight the facilitative role of state ownership in promoting green innovation. Through an examination of the green innovation activities of state-owned enterprises, we provide empirical support for the Porter hypothesis, suggesting that the benefits and profits derived from green innovation outweigh the compliance costs associated with environmental regulations. Our study expands the body of literature on green investors and green innovation while offering insights specific to the Chinese market.
The remainder of this article is organized as follows:
Section 2 provides a review of the relevant literature and develops hypotheses;
Section 3 outlines our research methodology;
Section 4 presents the empirical findings; and
Section 5 concludes and offers further discussion.
2. Literature Review and Hypothesis Development
Green innovation, also referred to as environmental innovation, encompasses the advancement of eco-friendly production methods and the application of new or adapted knowledge and technologies to mitigate environmental damage (e.g., Brunnermeier and Cohen, 2003 [
21]; Roh, Lee, and Yang, 2021 [
22]). Green innovation, compare to other forms of innovation, exerts more externality as it helps to create a safer and cleaner world (Berrone et al., 2013 [
23]). Green innovation is different from conventional technological innovation due to its “double externality”. The first externality of corporate green innovation involves the “knowledge spillover externality”. Due to inadequate intellectual property protection, companies achieving advancements in green technology innovation may find their achievements replicated by other firms (Xiang, Liu, and Yang, 2022 [
24]). Consequently, the overall benefits of green innovation may vary significantly, reducing businesses’ incentive for further green innovation.
The second externality of corporate green innovation concerns the “environmental spillover externality”. Companies committed to social responsibility incorporate environmental protection considerations into their production and operations, engaging in relevant green innovations such as novel production processes aimed at reducing or even ameliorating environmental pollution during product manufacturing [
24]. This conduct contributes to environmental conservation and ecosystem enhancement, benefiting the entire industry and society. However, businesses do not receive compensation for these actions, significantly impacting their motivation for green innovation.
Friedman (2007) [
25] posits that investments in environmental protection that provides advantages to external stakeholders at the cost of shareholders will decrease firm value and firm profitability, which is against the development of corporations. With enlarged amounts of research examining green innovation and green investment, it is now widely recognized that green innovation holds significant importance for both businesses and society. Prior studies have revealed positive correlations between green innovation and firm performance, covering both environmental and economic indicators (e.g., Berrone et al., 2013 [
23]; Chen et al., 2006 [
26]). Research findings (e.g., Shrivastava, 1995 [
27]; Qiu et al., 2020 [
28]) suggest that green innovation effectively minimizes waste and costs through enhancements in energy and fuel efficiency, mitigation of carbon emissions, and recycling-based waste reduction, thereby enhancing environmental performance. Implementing green innovation can result in increased productivity, ultimately contributing to enhanced long-term economic performance for firms (Ma, Hou, and Xin, 2017 [
29]), with the profits generated from corporate environmental protection endeavors expected to be sustainable (Zhou and Jin, 2023 [
30]).
Green innovation provides solutions for increasing resource productivity and reducing cost and emissions, which improves both industry performance and environmental performance (Pujari, 2006 [
31]). Regarded as a management framework, green innovation promotes environmentally conscious practices, aiding firms in conforming to international environmental reporting standards and carbon tax regulations (Adams et al., 2016 [
32]; Wang and Jiang, 2021 [
33]). Examining both conventional innovation and green innovation, Khalil and Nimmanunta (2023) [
34] find that both measures of innovation lead to increases in firm value, yet conventional innovation benefits firm valuation sacrificing environmental quality while green innovation improves either type of firm performance.
Corporate green innovation is a part of corporate governance, yet it diverges from traditional governance initiatives due to the high uncertainty and complexity inherent in research and development projects (Huang et al., 2022 [
20]). Corporate innovation, functioning as a strategic action, might be driven by various incentives such as advancing technological advancements, maintaining competitiveness, and obtaining additional benefits like addressing stakeholders’ needs and regulatory compliance (Lian, Xu, and Zhu, 2022 [
1]). These motivations substantially influence the quality of innovation. The existing literature often examines environmental regulation and innovation intensity without distinguishing between green innovation and broader technological advancements (Lian et al., 2022 [
1]). We aim to fill this gap by separating green innovation from general technological innovations.
2.1. Green Investors and Enterprise Green Innovation
The factors influencing the adoption of green innovations have been of particular interest to scholars, especially from the perspective of stakeholders. Investors are a significant component of external stakeholders, among whom institutional investors are fundamental due to their size and influence. Institutional investors play not only the role of investors in the financial market, but also participate in corporate decision-making and governance through various means, exerting a certain influence on corporate behavior (Cai and Rao, 2015 [
35]). Barnea, Heinkel, and Kraus (2005) [
36] found that, to some extent, institutional investors function similarly to external creditors, prompting companies to alter their financing structures, adopt low-leverage financing arrangements, and correspondingly reduce their reliance on debt financing. Institutional investors assume a supervisory role, making them indispensable participants in corporate governance. Among institutional investors, green investment has attracted increasing attention from scholars and has been closely scrutinized.
The past literature has touched upon green investors (e.g., Barnea et al., 2005 [
36]), but research on China’s green financial system and green investors is scarce. This study fills the gap in this area. Upon reviewing the existing literature, it is evident that scholars primarily approach the definition and study of green investors from two perspectives. The first method for defining green investors is by analyzing stock investment details and fund entity information provided by the CSMAR database. Funds that target and invest in green, environmental, renewable energy, and ecological sectors are identified and defined as green investors (Jiang et al., 2021 [
9]). The second approach to defining green investors views socially responsible investment funds as green funds or green investors.
Between the two prevailing definitions of green investors, this study ultimately adopts the first. The rationale is as follows: Firstly, although socially responsible investment (SRI) is an essential contemporary investment philosophy, and has gradually focused on the social, environmental, and governance (ESG) dimensions since the 21st century, China’s SRI is comparatively nascent compared to the West, resulting in a limited depth of SRI and ESG research. Secondly, even when considering green investments from the perspective of the second definition, i.e., socially responsible investment funds or ESG investments, some scholars’ research methods share similarities with the first definition. For instance, Zhang (2021) [
10] defines socially responsible investment funds by utilizing CSMAR databases to identify funds related to “green investment, SRI, or ESG.” Thirdly, although green investors are the primary and significant participants in socially responsible investments, they are not synonymous with socially responsible investors. In comparison, socially responsible investments encompass a broader scope and more comprehensive concept, while green investors tend to focus primarily on environmental aspects.
Green investors embody the principles of socially responsible investing (SRI), diverging from conventional investors by holistically considering financial, social, environmental, and ethical standards during investment decision-making. These investors predominantly support enterprises that align with sustainable development ideals, thereby promoting corporate social responsibility (Peng and Peng, 2017 [
37]). Despite past skepticism from scholars such as Friedman, the SRI sector has experienced rapid growth in recent decades. Green finance and SRI share numerous similarities and could be considered branches of the same tree. The majority of domestic research on SRI often adopts a green finance perspective. Ma (2015) [
38] demonstrated that green finance can enhance the returns on green innovation projects through efficient market resource allocation while concurrently mitigating the impact of heavily polluting projects. Consequently, a greater proportion of social funds can be directed towards green financial industries. Thus, the successful construction of a green financial system is of vital importance for China’s incremental economic growth. Li (2002) [
39] also found that social, environmental, and financial performance are not mutually exclusive (Zhou and Jin, 2023 [
30]), and socially responsible funds can effectively achieve a balance between the three.
Enterprises’ green practice mainly affect external stakeholders, yet not all stakeholders will necessarily support green innovation. Stakeholders with long horizons who recognize the value of green innovation will support corporate green innovation activities and stakeholders who might benefit from environmental practice will also vote for green innovation, whereas some stakeholders may believe that the high financial investment in preparatory work for green innovation and the significant time lag in terms of outcomes increase short-term pressure on firms and, thus, they do not advocate for green innovation. Stakeholder theory suggests that, as a crucial part of external stakeholders, institutional investors may play a fundamental role in influencing enterprises’ green innovation (Zhao et al., 2023 [
40]). Green investors, as a distinct group of institutional investors, embody the concept of socially responsible investing. They prioritize environmental concerns and integrate economic and social factors when investing in socially responsible companies. These investors guide businesses to emphasize ecological preservation in their operations to ensure sustainable development, ultimately achieving both economic and social value. Corporate green innovation also possesses a “green” attribute, often reflecting a company’s environmental consciousness and sense of social responsibility.
Since green investors do not provide financing for environmental polluting corporations, we expect there to be a positive correlation between the engagement of green investors on enterprises green innovation. Therefore, we posit the following hypothesis:
H1. Green investor holdings promote corporate enthusiasm for green technological innovation.
2.2. State Ownership and Enterprise Green Innovation
Regulatory environment can also affect the level of corporate green technology innovation: talent level, regional openness, government guidance, and environmental regulations all influence green innovation based on provincial data. Zou, Hu, and Yao (2019) [
41] find differences in market competition intensity, company size, capital deepening, and foreign capital introduction levels contribute to varying green innovation performance across industries. Li, Tang, and Pan (2015) [
42], through an empirical study of over 200 companies, discovered that improvements in green innovation can be achieved by policy orientation, market orientation, and increased environmental awareness among managers. Given the substantial funding required and the considerable uncertainty and lengthy development cycles associated with green innovation, a relatively stable and sophisticated regulation environment can be crucial. Therefore, the role of government in green innovation should not be overlooked.
The government can bring greater and more direct pressure on enterprises (Bi, Peng, and Zuo, 2012 [
43]). It is believed that the greatest pressure firms face comes from government regulations (Zeng et al., 2019 [
44]). The Chinese government is vigorously advancing green finance and implementing a series of policy guidance measures. The Chinese government has prioritized the advancement of ecological civilization and sustainable development infrastructure, pledging to encourage environmentally friendly practices among businesses by emphasizing energy conservation and emissions reduction (Wang, Sun, and Guo, 2019 [
45]). For enterprises, green investments like energy efficiency improvements and carbon footprint reduction have become essential focal points (Wang et al., 2019 [
45]). Due to the governmental regulation’s influence on corporate green practice, we investigate the impact of government through the role of state-ownership in the relationship between green investors and corporate green innovation, for the reason that government shareholding is a direct link between corporations and green environment.
Until the late 20th century, the prevailing belief was that stringent environmental regulations would increase the cost of environmentally damaging actions, imposing operational burdens on corporations and consequently diminishing their competitiveness (Yu et al., 2023 [
46]). Porter and Van der Linde (1995) [
18] were pioneers in proposing that environmental goals and industrial competitiveness were not mutually exclusive. They argued that “well-designed environmental standards can stimulate innovation, potentially offsetting compliance costs” (Porter and Van der Linde, 1995 [
18]), a concept known as the “Porter Hypothesis”. They discuss how the impact of environmental regulations on enterprise technological innovation depends on the balance between compliance costs and innovation incentives. It highlights that stricter regulations increase compliance costs but also stimulate innovation in export industries. However, when regulations are weak, enterprises prioritize profit maximization and often resort to end-of-pipe treatments, hindering innovation (Ma and Li, 2019 [
47]). As environmental regulations improve and intensify, enterprises are encouraged to innovate, gaining competitive advantages and reducing reliance on regulation substitutions. Thus, when innovation incentives outweigh compliance costs, environmental regulations can drive technological innovation in enterprises.
Empirical studies on the Porter hypothesis have yielded varied results in the scholarly literature. Chen et al. (2006) [
26] examined companies incorporated in Taiwan and discovered that environmental regulations stimulate increased investment in research and development while also enhancing industrial productivity. Qiu et al. (2018) [
28] found that the Porter hypothesis holds true for firms with high innovation capabilities but not for others. They illustrate that for such firms, the additional benefits from investing in innovation can offset the increased compliance costs through enhanced operational efficiency. Conversely, firms with low innovation capabilities struggle to manage compliance costs, thereby reducing their incentive to invest in innovation (Qiu et al., 2018 [
28]). Albrizio et al. (2017) [
48] investigated a panel of Organization for Economic Co-operation and Development (OECD) countries and found no support for the Porter hypothesis. They argued that the costs of environmental regulation on corporations outweigh its benefits, resulting in a negative impact on firms’ productivity (Zhang, 2021 [
10]). Meanwhile, there are scholars suggest there being a non-linear correlation between environmental regulation and innovation, addressing an either “U-shaped” or “reversed U-shaped”, or a “threshold effect” between them (Ma and Li, 2021 [
47]).
State-owned enterprises, in comparison to private enterprises, exhibit a heightened sense of social responsibility and shoulder the crucial responsibility of executing these policies. The government, as the actual controller of state-owned enterprises, can intervene moderately in their business activities and development decisions to achieve policy objectives (Qi, Lin, and Cui, 2018 [
49]). From a resource perspective, green technology innovation requires a greater resource supply compared to ordinary innovation. A critical factor determining whether a company can successfully pursue green technology innovation and the enthusiasm for doing so is the availability of corporate resources. In regions where the institutional environment is weak and government officials do not act, corporate managers may use their political connections to obtain government support to obtain undeserved resources and advantages while avoiding corporate environmental responsibility (CER) (Zeng et al., 2019 [
44]). Excessive government intervention can disrupt the allocation of resources in the market and results in low producing efficiency (You, Zhang, and Yuan, 2019 [
50]). On the contrary, in environments with more sophisticated laws and regulations and more comprehensive green-encouraging systems, enterprises can obtain financial support through fair competition (Zeng et al., 2019 [
44]). Besides, a good regulation environment makes environmental-friendly companies more competitive [
44]. Our examination of the state-owned enterprises will provide evidence for the situation of Chinese green environment during our sample period.
Previous research holds mixed opinion concerning the impact of state-ownership on corporate green innovation. Some studies (e.g., Choi, 2011 [
11]) support that principal-agent problems are more likely to occur in state-owned enterprises, leading to ambiguity in ultimate ownership and conservative corporate decision-making, particularly regarding green innovation with significant uncertainty in return rates. Fan et al. (2007) [
51] found that corporations with political connections tend to show inadequate growth and underperform their counterparts. They argue that the probable explanation is that the government can extract rent from these firms since their politically connected CEOs pay more attention to their political career, which harms the firms’ long-term performance (Wang et al., 2019 [
45]; Fan et al., 2007 [
51]). This stream of research supports that non-state-owned enterprises may exhibit more active green innovation and higher innovation efficiency (Choi, 2011 [
11]).
Other scholars hold opposite opinions, as state-owned enterprises possess advantages over private enterprises, such as more resources, technology, and financial subsidies. Niessen and Ruenzi (2010) [
52] analyze firms in Germany and find that listed firms with political connections outperform unconnected firms in both accounting performance and market performance. Considering the long cycle and high risk associated with green technology innovation projects, achieving performance through market-oriented approaches is challenging, especially in the short term. Hence, companies, particularly private enterprises, face various difficulties in green technology innovation. State-owned enterprises have stronger ties with the government and state-owned banks, giving them an absolute advantage in financing, financial subsidies, and technical aspects compared to private enterprises. Chinese state-owned enterprises have more abundant resources and higher research and development investments in technological innovation, as they can more easily obtain tax incentives and national policy subsidies [
45].
This paper aim to examine the application of Porter hypothesis in the Chinese A-share market through investigating the role of state ownership in the relationship between green investors and enterprises green innovation. If the Porter hypothesis holds, we should observe more significant investor–innovation correlation among state-owned firms. Otherwise, there should be no significant difference or the opposite result. Therefore, we construct the following hypothesis:
H2. The presence of green investor holdings has a stronger positive effect on green technological innovation in state-owned enterprises.
4. Empirical Results and Analysis
4.1. Correlation Analysis
Table 3 displays the Pearson correlation coefficient matrix, illustrating the correlation between pairs of variables and providing insight into their associations. The Pearson correlation coefficient assesses the linear relationship between two variables, ranging from −1 to 1. Values between −1 and 0 signify a negative linear relationship, while values between 0 and 1 denote a positive relationship. The magnitude of the coefficient indicates the strength of the correlation.
Upon analyzing the correlation coefficients, it is observed that absolute values are generally below 0.5, suggesting moderate correlations between different variables. Notably, the correlation coefficient between green investors (GI) and green innovation (gpg) stands out, exhibiting a significant positive correlation at a 1% significance level, with a coefficient value of 0.178. This result aligns with Hypothesis 1, indicating that the presence of green investors is associated with stronger green innovation efforts.
Additionally, among the control variables, firm size (size) and green innovation (gpg) demonstrate a significant positive correlation at a 1% significance level, implying that larger firms tend to possess more robust green innovation capabilities. Furthermore, other control variables such as ownership structure, debt level, board size, and the proportion of independent directors also show positive correlations with green technology innovation, highlighting significant interrelationships among them.
Table 4 presents the variance inflation factors (VIF) for each variable. In order to conduct a thorough analysis of the correlation among the chosen variables and identify any potential issues of multicollinearity, we perform a multicollinearity test. The results reported in the table indicate that the VIF for each variable pertaining to factors influencing green innovation in A-share listed manufacturing firms is below 1.58, with an average VIF of 1.27. Given that the VIF is below 10, it can be concluded that multicollinearity is not an issue among the variables in this study.
4.2. Main Regression Analysis
Table 5 displays the ordinary least squares (OLS) regression results for regression Equation (1). Column (1) reports the empirical results without control variables and column (2) presents results with control variables. The regression outcomes reveal a statistically significant positive correlation between green investors’ ownership (GI) and green innovation (gpg) within Chinese A-share listed manufacturing firms.
Specifically, in the absence of control variables, the coefficients for GI and gpg are 0.158, demonstrating a significant positive correlation at a 1% significance level. Upon incorporating control variables, the coefficients become 0.149, still exhibiting a significant positive correlation at a 1% significance level. Although the explanatory power of the single variable experiences a slight decline after introducing control variables, this difference is not statistically significant.
These results indicate that the ownership of green investors plays a constructive role in fostering green innovation among manufacturing companies. The results support our hypothesis 1.
4.3. The Role of State Ownership
The empirical findings above affirm Hypothesis 1, suggesting that green investor ownership bolsters the inclination towards green technological innovation in manufacturing firms. Nonetheless, given the diversity in ownership structures among companies, particularly the distinct attributes of state-owned enterprises with their common property and stronger political ties, attitudes towards innovation, especially those with “green” attributes, are expected to vary.
Thus, this study delves deeper into the similarities and discrepancies of Hypothesis 1 between state-owned and non-state-owned enterprises. Drawing on the existing literature studies (e.g., Jiang et al., 2021 [
9]), this paper introduces an interaction term between ownership form (type) and green investor presence (GI), denoted as Type_GI, and proceeds with a heterogeneity analysis, as outlined in
Table 6. Column (1) showcases the outcomes utilizing gpg as the metric for green innovation, while column (2) employs an alternative measure of green innovation denoted as gpa. Further details regarding this alternative measurement will be explained in
Section 4.4.4.
The outcomes of the heterogeneity analysis reveal significant positive coefficients for both the variables GI (green investors’ ownership) and type (ownership form) at the 1% significance level, validating the premise of heterogeneity testing. Notably, the interaction term (Type_GI) between state-owned enterprises (SOEs) and green investors’ ownership (GI) exhibits a significant positive association.
When employing green innovation authorization (gpg) as the dependent variable, the coefficient for the GI variable stands at 0.461, significant at the 1% level. Additionally, the coefficient for the interaction term (Type_GI) is 0.170, significant at the 5% level. The consistent sign of these two coefficients indicates that the impact of green investors’ ownership on fostering green technology innovation in manufacturing enterprises is more pronounced in SOEs.
Similarly, when utilizing green innovation application (gpa) as the dependent variable, the coefficient for the GI variable is 0.717, significant at the 1% level. Moreover, the coefficient for the interaction term (Type_GI) is 0.448, significant at the 1% level. Again, the consistent sign of these coefficients underscores that in SOEs, the influence of green investors’ ownership on promoting green technology innovation in manufacturing enterprises is stronger.
These results support Hypothesis 2 of the study, affirming that the impact of green investors’ ownership on green technological innovation in manufacturing enterprises is more pronounced in state-owned enterprises.
4.4. Further Analysis
The central concern in this study lies in the intricate relationship between companies and investors. Given the inherent influence that companies and investors exert on each other, the impact of green investors on companies may encounter endogeneity challenges. From the perspective of the company itself, a firm with a strong commitment to social responsibility, prioritizing environmental considerations in its development, and showcasing proactive green innovation efforts, is likely to attract a greater number of green investors. Furthermore, endogeneity issues such as sample selection bias and omitted variables need to be taken into account.
To address these concerns, the study employs various methodologies, including the substitution of variables, utilization of instrumental variables, and implementation of propensity score matching (PSM) for robustness checks. These approaches aim to mitigate potential biases and enhance the reliability of the findings.
4.4.1. Instrumental Variable Method
The influence of green investors’ shareholdings on driving corporate green innovation may entail endogeneity issues, particularly reverse causality. On one hand, companies exhibiting greater proactivity and advantages in green innovation are likely to attract more green investors. Conversely, green investors might be influenced by certain unobservable factors associated with green innovation, leading to bidirectional causality, selection bias, omitted variables, and other endogeneity concerns.
To address these issues, this study adopts two instrumental variables: Industry_GI and Province_GI. The first instrumental variable, Industry_GI, represents the average green investor shareholding ratio of other companies in the same industry during the current period. The second instrumental variable, Province_GI, denotes the average green investor shareholding ratio of other companies in the same province as the focal company (Jiang et al., 2021 [
9]; Xie et al., 2009 [
55]). Companies within the same industry or province inherently confront similar external macro environments, such as the impact of certain policies on the entire industry. Consequently, the green investor shareholding ratio of other companies in the same industry or province exhibits a certain correlation with the green investor variable.
Empirical results show no evidence indicating that the green investor shareholding ratio of other companies in the same industry or province affects a company’s engagement in green innovation. Hence, the investment scenario of other companies can be deemed exogenous concerning a company’s level of green innovation. The results estimated using the instrumental variable method are presented in
Table 7.
Table 7 presents the regression results from the instrumental variable approach, alongside the corresponding overidentification test, weak instrument test, and Hausman test outcomes. Column (2) displays the OLS regression results, column (3) shows the 2SLS regression results, and column (4) exhibits the Liml regression results, all utilizing robust standard errors.
From column (1), it is evident that the estimated coefficient of Industry_GI is significantly positive at the 1% level of significance. Similarly, the estimated coefficient of Province_GI is significantly positive at the 5% level of significance. The overidentification test yields a p-value of 0.1170, indicating that the chosen instruments, Industry_GI and Province_GI, are strongly exogenous. The weak instrument test indicates an F-value of 1130.3, which exceeds 10, signifying the absence of weak instruments. Furthermore, the Liml regression is conducted, and its results align with the 2SLS results.
Given that the use of instrumental variables assumes the presence of an endogenous explanatory variable, the Hausman test is conducted to assess endogeneity. The Hausman test result (p-value = 0.0078) confirms that the explanatory variable GI is indeed endogenous in the equation.
After addressing endogeneity concerns, the coefficient of GI remains significantly positive at the 1% level of significance. This indicates that the conclusion of this study remains robust even after accounting for endogeneity.
4.4.2. Propensity Score Matching (PSM) Analysis
To mitigate potential issues like self-selection and selection bias, this study employs a counterfactual framework by categorizing companies with green investors as the treatment group and those without as the control group. Propensity score matching (PSM) is then utilized to validate the hypothesis, leveraging four matching methods: Mahalanobis distance matching, k-nearest neighbor matching, caliper matching, and kernel matching. Each method serves to bolster the robustness of the research conclusions.
Mahalanobis distance measures the distance between a point and a distribution, with Mahalanobis distance matching calculating the distance between each treated and control unit in a multidimensional space defined by covariates. In k-nearest neighbor matching, each treated unit is paired with its k nearest neighbors from the control group based on propensity score or observed covariates. Caliper matching restricts potential matches for each treated unit based on a specified caliper, representing the maximum allowable distance or difference in propensity scores or covariates between matched pairs. Kernel matching assigns weights to control units based on their distance from treated units in a kernel function.
The selection of matching method depends on the data’s specific characteristics and the research question, as each method has its strengths and limitations. The overarching goal of these methods is to create balanced treated and control groups, reducing bias and enhancing the validity of causal inference in observational studies.
Following PSM implementation, the study conducts balance tests to ensure minimal differences in covariates between matched treated and control groups, except for the presence of green investors. The results indicate successful matching, with a maximum sample loss of 51 samples. Standardized bias of most variables significantly reduces after PSM, with all variables exhibiting a standardized bias of less than 10%. Additionally, most
t-test results fail to reject the null hypothesis, indicating no systematic difference between the control and treatment groups. These balance test outcomes are presented in
Table 8.
The balancing test outcomes reveal a substantial reduction in standardized biases of explanatory variables post-PSM application. Prior to matching, the standardized biases stood at 17.5%, decreasing notably to 2.2% and 4.5% after matching, both below the 20% threshold. Additionally, the LR statistic experiences a considerable decline from 2229.18 pre-matching to 19.44 and 26.69 post-matching. Furthermore, the pseudo R-squared value exhibits a notable drop from 0.167 before matching to 0.002 and 0.003 after matching.
These results collectively indicate that the four matching methods employed in this study effectively mitigate covariate distribution disparities between the treatment and control groups. Consequently, they successfully address potential estimation biases stemming from sample self-selection, bolstering the validity and reliability of the study’s findings.
Table 9 demonstrates that the research outcomes remain consistent across the four distinct matching methods utilized in this study. Following counterfactual estimation, the presence of green investor shareholding continues to exhibit a significant positive effect on the green innovation performance of manufacturing firms. This reaffirms the validity of Hypothesis H1.
4.4.3. Multiple Time-Point DID (Difference-in-Differences)
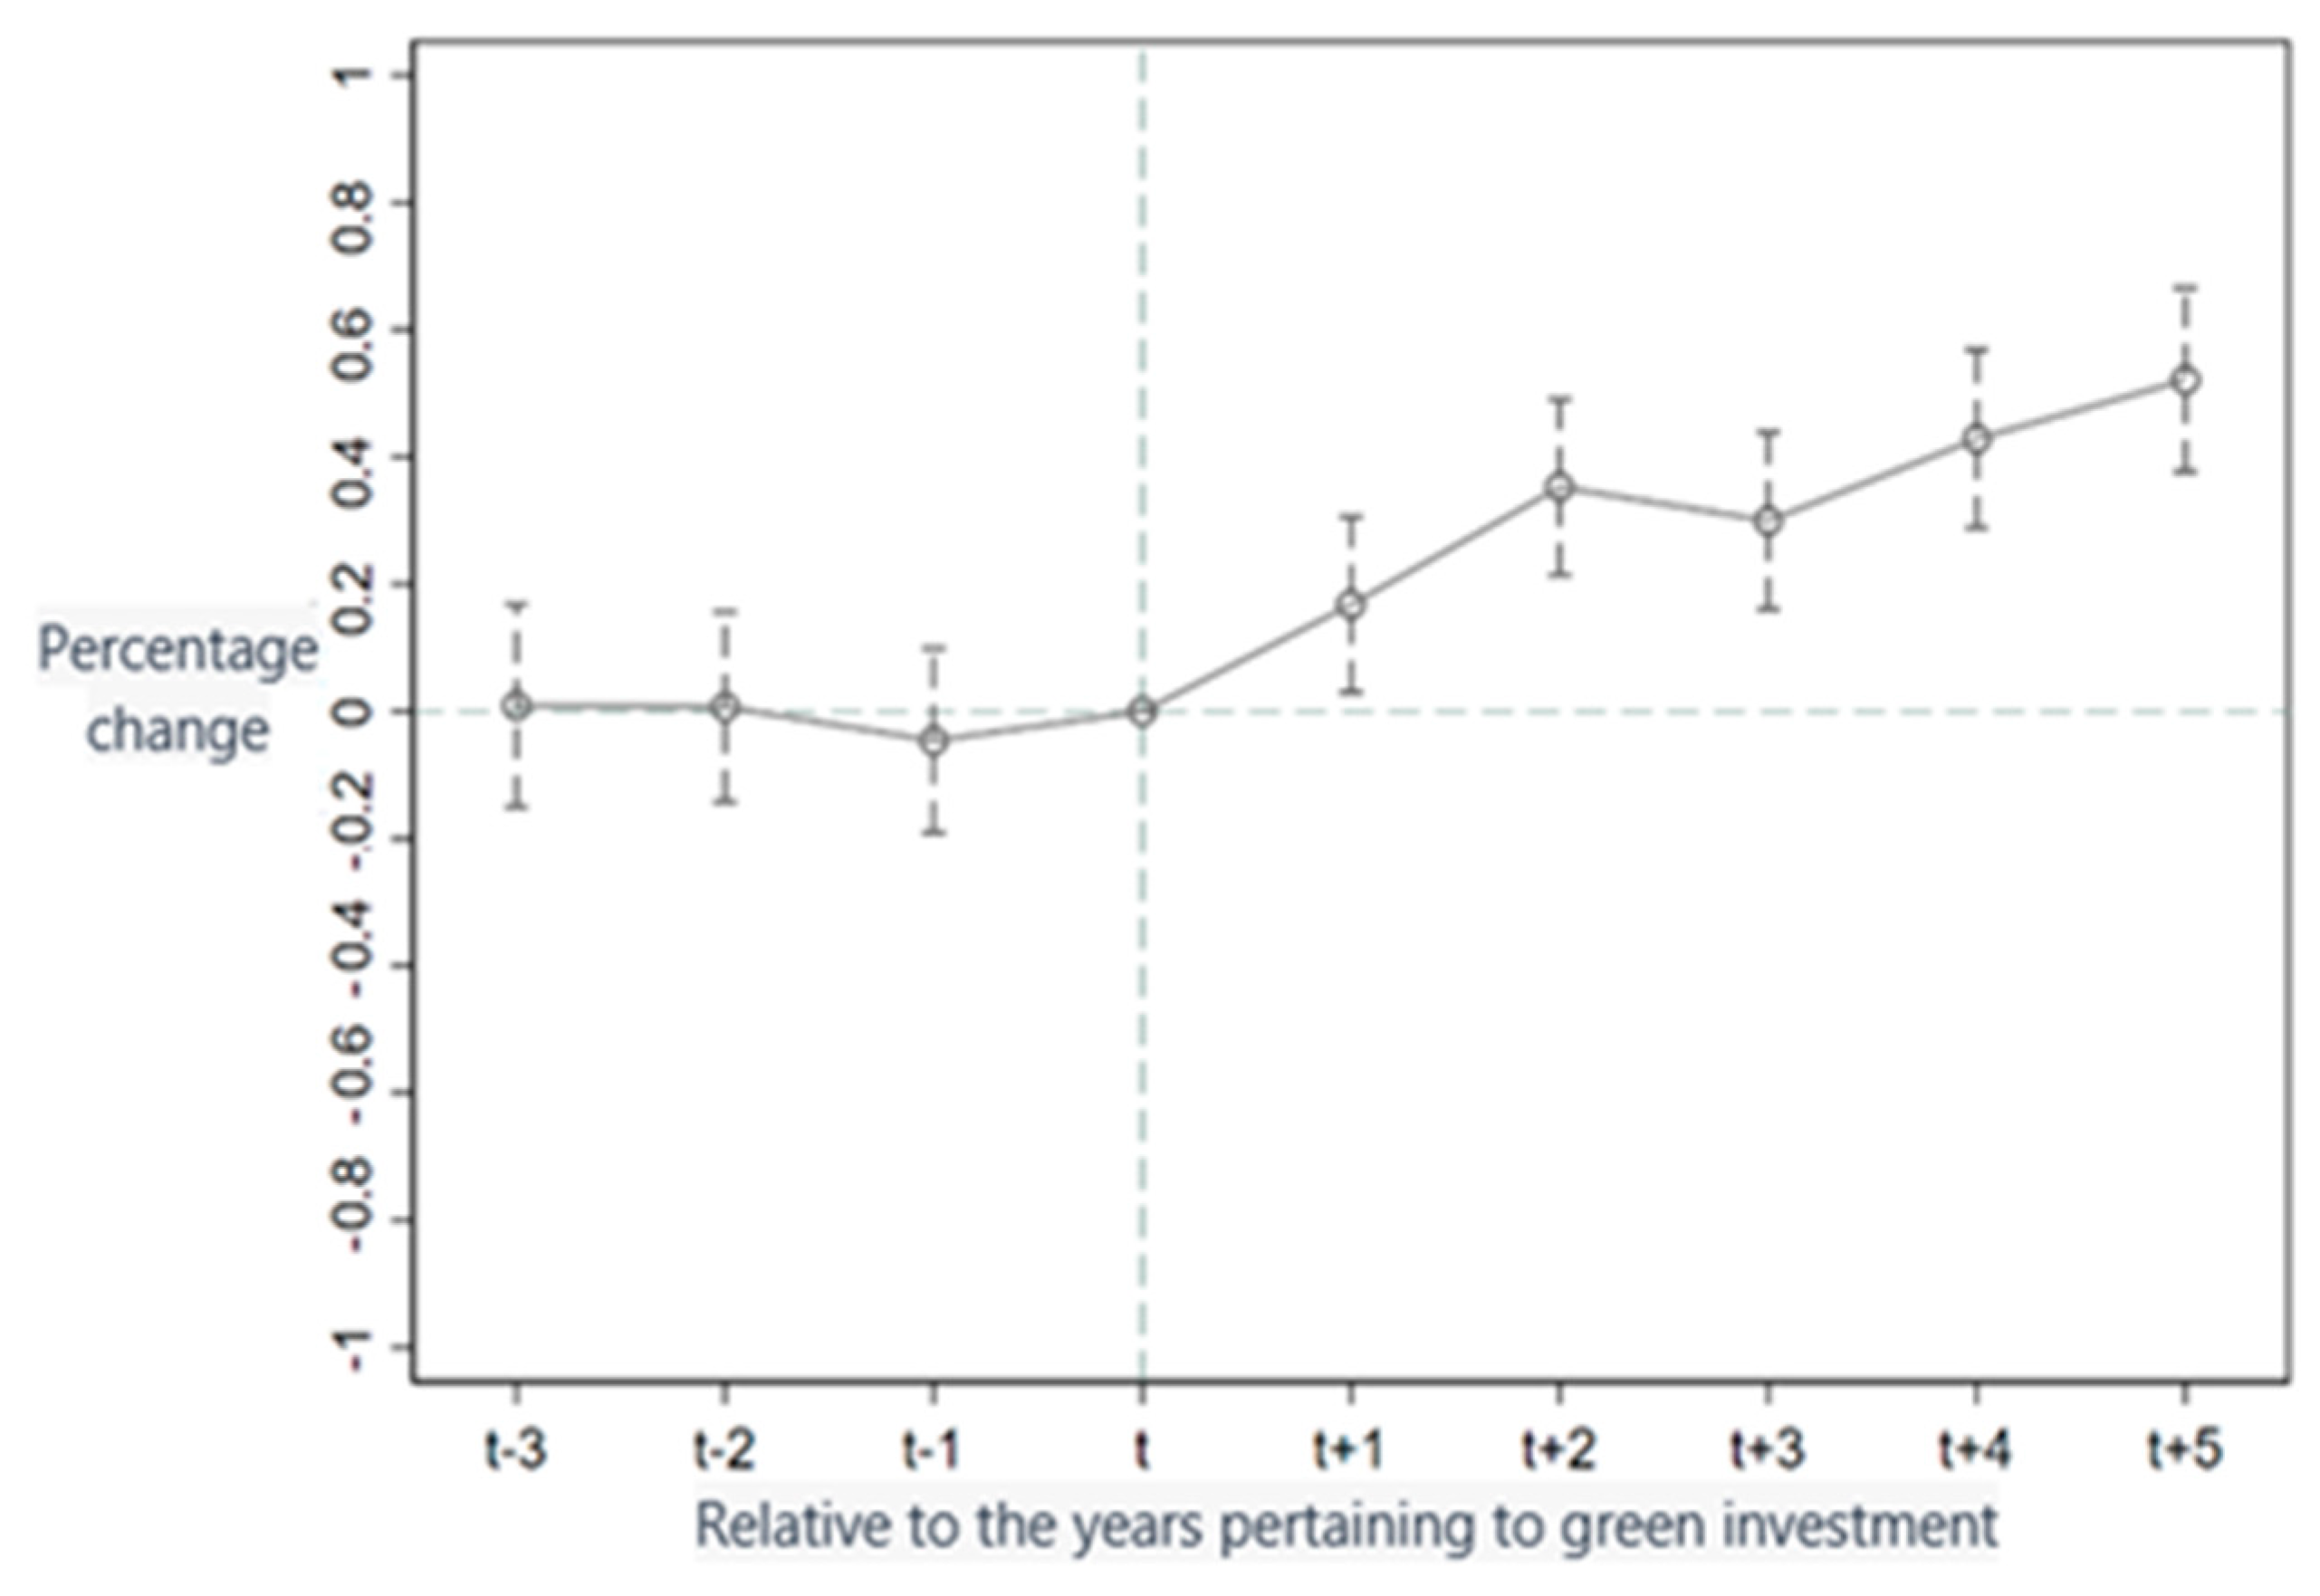
To further analyze the data, this study conducted a multi-period difference-in-differences (DID) regression on the matched samples obtained using different PSM methods. Before conducting the multi-period DID, it is necessary to perform a balance trend test on the sample, as shown in
Figure 1.
Figure 1 presents the balanced trend test results. The year when green investors first invest in a firm is time t. This study examines the three years before (t − 1, t − 2, t − 3) and five years after (t + 1, t + 2, t + 3, t + 4, t + 5) the initial investment.
Figure 1 shows a significant change in the firm’s green technological innovation after green investors’ investment. Moreover, green investor holdings have a significant positive impact on the firm’s green technology innovation level, satisfying the parallel trend assumption.
To ensure the robustness of the research results, we conduct multiple time-point DID regression analyses using samples obtained from different matching methods of PSM propensity score matching. The regression results are shown in
Table 10.
Table 10 presents the PSM–DID empirical results regarding the impact of green investor holdings on the green innovation of manufacturing enterprises. The estimation outcomes indicate that Mahalanobis distance matching does not exclude any samples, while nearest neighbor matching excludes 50 samples, caliper matching excludes 46 samples, and kernel matching excludes 51 samples. Nonetheless, the coefficients for GI are significantly positive at the 1% significance level across all four PSM matching methods. These initial findings lend support to Hypothesis 1, suggesting that green investor holdings notably enhance green technological innovation within enterprises.
4.4.4. Alternative Variable Method
Regarding the measurement of corporate green innovation levels, scholars often utilize data on green patent grants or applications, given the comprehensive nature of green patent data in recent years. In this study, the number of green patent grants (gpg) is adopted as an indicator of corporate green innovation, as it accurately reflects a company’s actual green innovation achievements from an objective standpoint. Conversely, the number of green patent applications (gpa) may better indicate the proactive nature of corporate innovation from a subjective perspective. Therefore, the study substitutes the dependent variable with green patent applications (gpa) to conduct a robustness check.
Within the 1010 listed manufacturing companies analyzed in this study, the range of green patent grants (gpg) varies from a minimum of 0 to a maximum of 9, indicating that not all companies are engaged in green innovation. The volume of green patent grants (gpg) serves as a measure of corporate green innovation from the perspective of specific innovative outcomes. Accordingly, a dummy variable for green patent grants (gpg-dummy) is generated, taking the value of 1 when a company has a green patent grant and 0 if otherwise. This dummy variable assesses corporate green innovation by examining the presence of green patents, thereby investigating the promoting effect of green investors on corporate green innovation and conducting robustness tests.
Table 11 presents the regression results after employing the alternative variable method. It reveals that the coefficients of GI remain significantly positive even after replacing gpg with gpa and gpg-dummy. As such, the conclusions drawn from the analysis remain robust.
5. Conclusions and Discussion
With growing attention to the balanced development of economy and environmental protection, as well as the strong promotion of green financial systems, “green” has become one of the key development concepts. This concept extends not only to enterprises but also to the perspective of investors. Institutional investors are pivotal players in financial markets, exerting significant influence on China’s financial landscape and national economy. Despite the abundance of research on institutional investors, few studies categorize them based on green investment criteria or analyze the impact of green investor holdings on corporate technological innovation. Moreover, the existing literature tends to concentrate on the influence of institutional investors on enterprises or innovation in general, without separating green innovation. This article aims to shed light on the impact of green investors on enterprises green innovation.
Government policies, including those promoting green finance and sustainable development infrastructure, exert direct pressure on enterprises, driving investments in energy efficiency and emissions reduction, highlighting the critical role of government in fostering environmentally friendly practices and innovation within the corporate sector. Given the significant influence of regulatory environments and government policies, we aim to explore how state ownership may moderate the relationship between green investors and corporate green innovation. Our hypothesis posits that green investors stimulate green innovation within companies, with this effect likely being more pronounced in state-owned enterprises.
We hypothesize that green investors foster corporate green innovation activities and expect this positive correlation to be more pronounced in state-owned enterprises. Analyzing 10,100 observations of manufacturing firms listed on Shanghai and Shenzhen A-share market from 2010 to 2019, we conduct fixed effect regression analysis using number of granted green patents of the firm as the proxy for green innovation. We controlled for firm size, ROA, growth rate, debt ratio, board size, shareholding concentration, ownership type, and the proportion of independent directors. Empirical result shows an increase in green innovation with the entry of green investors. In addition, we find that this positive association is more pronounced in state-owned enterprises. Our findings are robust to instrumental analysis, propensity score matching analysis, multi-time-point difference-in-differences (DID) test, and alternative measurement tests.
Our study contributes to the literature on institutional investors’ influence on corporate innovation activities, especially from the perspective of green investors who values environmental performance. Our research separates green innovation from general technological innovation, contributing to the literature on corporate innovation. We propose a stimulating effect of green investors on enterprises’ green innovation, indicating that China has a relatively strong and stable environmental regulation system. This study also contributes to the literature examining the role of state ownership on green innovation. The empirical result provides evidence supporting the Porter hypothesis, indicating that the profitability from green innovation offsets or even excesses the compliance costs associated with environmental regulation.
This paper has certain limitations. For instance, we did not include the phenomenon of greenwashing in our analysis (We thank our reviewer for pointing this out for us.). Greenwashing in environmental, social, and governance (ESG) activity refers to the practice of misleadingly portraying a company or its products as environmentally friendly or socially responsible, when in reality, they may not be (Lee and Raschke, 2023 [
56]). This can involve exaggerated or false claims about the company’s environmental practices, social initiatives, or corporate governance policies. Greenwashing is often used as a marketing tactic to appeal to consumers who prioritize sustainability (Lyon and Montgomery, 2015 [
57]), but it can undermine trust and transparency in ESG reporting and investment decisions [
56]. Future research could explore the impact of greenwashing on green innovation and subsequent firm performance.
This study provides suggestions for the construction of China’s green financial system and the high-quality sustainable development of enterprises: firstly, green investors themselves should be aware of their ability to influence enterprises, and actively conduct research activities and participate in online or offline communications to engage in corporate decision-making. Secondly, enterprises should have a sense of social responsibility, actively engage in relevant green technology innovation, and enhance the long-term value of the enterprise. Finally, the government should pay attention to the guidance of relevant policies, cultivate more green investors, support enterprise green technology innovation, and play the role of state-owned enterprises, actively realizing the dual value of state-owned enterprises.


