Article

Exploring the Evolution Trend of China’s Digital Carbon Footprint: A Simulation Based on System Dynamics Approach

1
School of Software, Jiangxi Normal University, Nanchang 330022, China
2
College of Political Science and Law, Jiangxi Normal University, Nanchang 330022, China
3
Jiangxi Institute of Economic Development, Jiangxi Normal University, Nanchang 330022, China
4
Research Center of Management Decision and Evaluation, Jiangxi Normal University, Nanchang 330022, China
*
Author to whom correspondence should be addressed.
Sustainability 2024, 16(10), 4230; https://doi.org/10.3390/su16104230
Submission received: 21 February 2024 / Revised: 9 May 2024 / Accepted: 10 May 2024 / Published: 17 May 2024

Abstract

:
The rapid growth of the digital economy has heightened concerns over its environmental impacts, particularly in terms of carbon dioxide emissions. In contrast to previous studies that focus on the positive effects of digital technology on reducing carbon emissions, this paper provides a detailed analysis of the various factors that influence digital economy carbon emissions and their interrelationships, using the system dynamics method to simulate and predict China’s future digital economy carbon emission baseline from 2016 to 2046. Four different scenarios were established by adjusting parameters for the percentage of the digital economy, e-waste growth rate, and data center power consumption. The simulation results indicate the following: (1) The baseline scenario shows China’s digital economy carbon emissions peaking at 1.9045 billion tons in 2041 after an initial increase and subsequent decrease. (2) Single-policy simulations indicate that changing the digital economy’s scale and e-waste growth independently leads to peak emissions of 1.9205 billion tons and 1.5525 billion tons, respectively. Adjusting data center power consumption has a greater impact, increasing the peak emissions to 2.1675 billion tons, a 13.82% rise from the baseline. (3) Under the comprehensive regulation scenario, emissions peak in 2040 at 2.0813 billion tons, considering the interactions between the digital economy, data center power, and e-waste. Based on the findings, we recommend fostering innovation in the digital industry, enhancing the e-waste treatment process, strategically developing digital infrastructure, and exploring effective carbon reduction strategies for the digital economy aimed at supporting China in achieving its dual-carbon goals.

1. Introduction

In recent years, countries worldwide have invested resources to promote the development of the digital economy. The rapid evolution and wide application of high-tech technologies, such as big data, artificial intelligence, and 5G, have injected new energy into the economic systems of various countries and led to the upgrading of industrial structures to a higher level [1]. In the current era of the digital economy, the “digital industry” encompasses a wide and diverse range of fields, collectively forming the backbone of the modern economy. Specifically, these areas include the construction and maintenance of information technology infrastructure, the collection, processing, and analysis of big data, the provision of cloud computing services, and the field of cybersecurity [2]. Moreover, the digital industry also involves software development, digital content creation, the development of smart hardware, and e-commerce, among others. These fields not only constitute a system in their own right but also intersect closely with traditional industries such as manufacturing and services. For instance, in manufacturing, the application of digital technology has facilitated the development of smart manufacturing, optimizing and automating production processes through technologies such as the Internet of Things (IoT) and big data analysis [3]. In the realm of services, cloud computing and big data technologies have made personalized services possible, thereby enhancing service efficiency and quality [4]. Additionally, with the emergence of digital payment systems and online trading platforms, e-commerce has become a significant force driving consumer growth. Importantly, this intersection is not limited to the technological level; it also involves shifts in economic models, adjustments in employment structures, and even changes in cultural and social practices. Consequently, the impact of the digital industry extends far beyond its direct economic contribution, as it reshapes the entire socio-economic operation and developmental trajectory. In this process, the integration of the digital industry with other sectors not only provides momentum for the upgrading of traditional industries but also paves new pathways for innovation-driven economic growth. Although the digital economy is thriving, its key components, including information technology infrastructure and large-scale data centers, have the potential to impact the environment during operation and maintenance. Specifically, the rapid growth of the digital economy may result in a surge in energy demand, which is closely linked to carbon emissions. The term “digital carbon footprint” refers to the carbon emissions generated by energy-consuming behaviors when using network technologies, such as storing, moving, transmitting, processing, or analyzing data over the network [5]. Research on digital technology innovation, energy restructuring, and green development models is crucial in promoting sustainable digital development. Hence, analyzing the future trend of China’s digital carbon footprint and promoting carbon emission reduction in the digital economy have become significant concerns for political and academic circles.
However, there is still insufficient comprehensive and systematic discussion and analysis of the trend of digital carbon footprint change by scholars at home and abroad. The current understanding of the digital economy carbon emissions mainly focuses on the impact of digital technology on carbon emissions [6], how digital technology promotes technological innovation to reduce carbon emissions [7], and how the empowerment of digital technology can contribute to green development [8]. These studies generally highlight the positive effects of the digital economy on energy saving and emission reduction. However, they lack in-depth exploration of the environmental impact of the digital economy itself. China is currently experiencing rapid development in the digital economy while also striving to achieve the dual-carbon goal. The significance of the digital economy in reducing carbon emissions cannot be overstated, but it is also important to address the growing carbon emissions of the digital economy itself. Therefore, it is essential to gain a comprehensive understanding of the key factors driving the rapid growth of the digital carbon footprint, identify its evolutionary trends, and propose new solutions for China’s low-carbon sustainable development. This will aid in formulating more targeted policies to promote the sustainable development of the digital economy.
This study aims to simulate and forecast the future trends of China’s digital economy carbon footprint, with a particular focus on quantifying greenhouse gas emissions, especially carbon dioxide emissions. The carbon footprint method was selected due to its focus on and ability to quantify carbon emissions. While the life cycle assessment (LCA) offers a comprehensive evaluation of environmental impacts, it appears too broad and unnecessary for the specific needs of this research. The system dynamics method allows for modeling the interactions and feedback loops within complex systems, making it suitable for addressing the dynamism and uncertainty of the digital economy’s development and its environmental impact [9]. The carbon footprint method can be effectively integrated into the system dynamics model to simulate the changes in specific environmental indicators (such as carbon dioxide emissions) over time, whereas the LCA is typically used for static analysis and struggles to capture this dynamic process. Moreover, this research fully recognizes that the digital economy industry is not just an independent economic field but also closely connected with several other industries with different objectives, forming a complex interaction network. These cross-industry connections not only drive the digital transformation of the economy but also have profound effects on energy consumption and carbon emissions. Therefore, this paper employs a systemic approach and utilizes the system dynamics methodology to construct a model of China’s digital economy carbon footprint. In the process of constructing the system dynamics model, this study not only focuses on the dynamic changes within the digital industry but also emphasizes the interaction between the digital industry and other elements and their impact on environmental indicators. Special consideration is given to key environmental indicators related to the digital industry, such as the percentage of the digital economy, the growth rate of electronic waste, and the percentage of electricity consumption by data centers, and how these indicators interact with the carbon emission indicators of other industries. More specifically, by simulating adjustments in the digital economy’s proportion, electronic waste disposal methods, and the energy efficiency improvements of data centers, as well as how these factors are influenced by technological innovations and policy changes in other industries, we can identify the complex feedback loops existing between the digitalization process and other industries and evaluate how these loops collectively shape the future of China’s digital carbon footprint. The contributions of this paper are mainly reflected in the following aspects: (1) In terms of theoretical contributions, the definition of digital carbon footprint is systematically elaborated, and its conceptual theory is enriched. By systematically analyzing the emission sources of digital carbon footprint, it provides an in-depth reference for the research of subsequent scholars. (2) In terms of practical significance, the system dynamics modeling method is adopted to analyze the interrelationships among the factors within the carbon dioxide emissions of the digital economy from an overall perspective. On this basis, different scenarios are set to predict the future digital economy carbon emissions, so as to put forward corresponding policy suggestions for the carbon emission reduction of China’s digital economy in the future.

2. Literature Review

This paper applies a system dynamics approach to explore the future evolutionary trend of China’s digital carbon footprint and perform path simulation. This study reviews the relevant literature in three main areas: (1) the concept and significance of digital carbon footprint; (2) path simulation analysis of carbon emissions; and (3) the application of system dynamics in carbon emission forecasting.

2.1. Reviews of Digital Carbon Footprint

The concept of carbon footprint originated from the idea of ecological footprint, which was developed by Prof. William Rees and his student Mathis Wackernagel at Columbia University [10], which is used to estimate the amount of nature that humans utilize for their own subsistence and to assess their ecological impacts. Carbon footprint research analyzes direct and indirect carbon emissions based on the life cycle of products, processes, and related activities [11]. In academia, however, scholars have not yet agreed on a definition of a digital carbon footprint. Qu Shenning et al. [12] pointed out that from the perspective of measuring digital economy carbon emissions, digital carbon footprint includes carbon emissions generated in the production process of digital products or equipment but also involves the carbon emissions generated in the use or operation stage. Jens Malmodin et al., in their study on the measurement of the carbon footprint of the global ICT industry, pointed out that the carbon footprint should be defined as the full life-cycle carbon-equivalent emissions and impacts of all products and services related to the global ICT and electron-mechanical industry [13]. Fuchs defines the digital carbon footprint as the amount of carbon dioxide released into the atmosphere as a result of the activities of individuals, organizations, or communities, especially those related to the use of ICT [14]. Taken together, the existing literature not only focuses on the carbon footprint of digital devices but also examines the impact of individual activities on the carbon footprint.

2.2. Reviews of Pathway Simulation of Carbon Emissions

To effectively predict future trends in digital economy carbon emissions and understand how the carbon footprint of the digital economy develops under different scenarios, path simulation analysis of carbon emissions can provide comprehensive insights. The existing literature, both domestic and international, primarily employs comprehensive evaluation models such as AIM, GCAM, IMAGE, MESSAGE, REMIND, and WITCH [15]. In addition to the aforementioned models, some scholars have utilized comprehensive carbon emission models [16] or simplified models [17] for specific regions in China to simulate and analyze China’s carbon emission pathways. For instance, Lei et al. utilized GDIM to examine the effect of carbon dioxide emissions on the operational phases of Chinese public buildings. They also predicted the future trajectory of the carbon neutrality of Chinese public buildings under the shared socio-economic pathway [18]. Zhang et al. simulated a scenario of carbon peaking in Chinese public buildings using the constructed LEAP system model to explore the optimal energy-saving and emission reduction pathway [19]. Additionally, there is literature analyzing the impact of various factors, such as economic growth [20], industrial structure [21], and carbon emission intensity [22], on carbon emissions and proposing corresponding reduction paths. These studies have partially confirmed the usefulness of path simulation in predicting carbon emissions, providing valuable references for this paper’s research.

2.3. Reviews of Carbon Emission Prediction Based on SD Model

To study carbon emission pathways accurately, it is necessary to adopt a methodology that integrates the interaction of multiple variables. Multivariate analysis methods, such as system dynamics modeling or structural equation modeling, can provide a more comprehensive perspective on carbon emission pathways. In recent years, system dynamics modeling has been widely used to simulate carbon emission pathways. This approach considers the relationship between multiple factors and provides a better understanding of the complexity of carbon emission changes. Tiago et al. studied the impact of electric-car-sharing programs on carbon emissions and the adoption of electric vehicles using a system dynamics model [23]. Meanwhile, Mohammad et al. constructed a water–energy–carbon nexus model based on a system dynamics model to quantify the carbon footprints of industrial water use and make simulation predictions [24]. Some scholars have also used this method to simulate the evolution of carbon emissions from marine fishing. Chen et al. defined various development scenarios based on the driving factors that influence carbon emissions from marine fishing and combined the system dynamics model with dynamic simulations to explore the future trend of carbon emissions from Chinese marine fishing [25].
In summary, although the existing literature has mainly studied the basic concept of digital carbon footprint and traditional carbon emission path modeling, there is no modeling prediction for the digital economy carbon emissions itself. Based on existing studies, this paper analyzes the interactions between the emission factors of digital economy carbon emissions. A system dynamics model of digital carbon footprint is constructed to simulate and predict the future trend of China’s digital economy carbon emissions. By adjusting the variable parameters, the impacts of carbon emissions of digital economy under different scenarios are predicted. Thus, the future evolution trend of the digital carbon footprint of China’s digital economy under different scenarios is comprehensively analyzed.

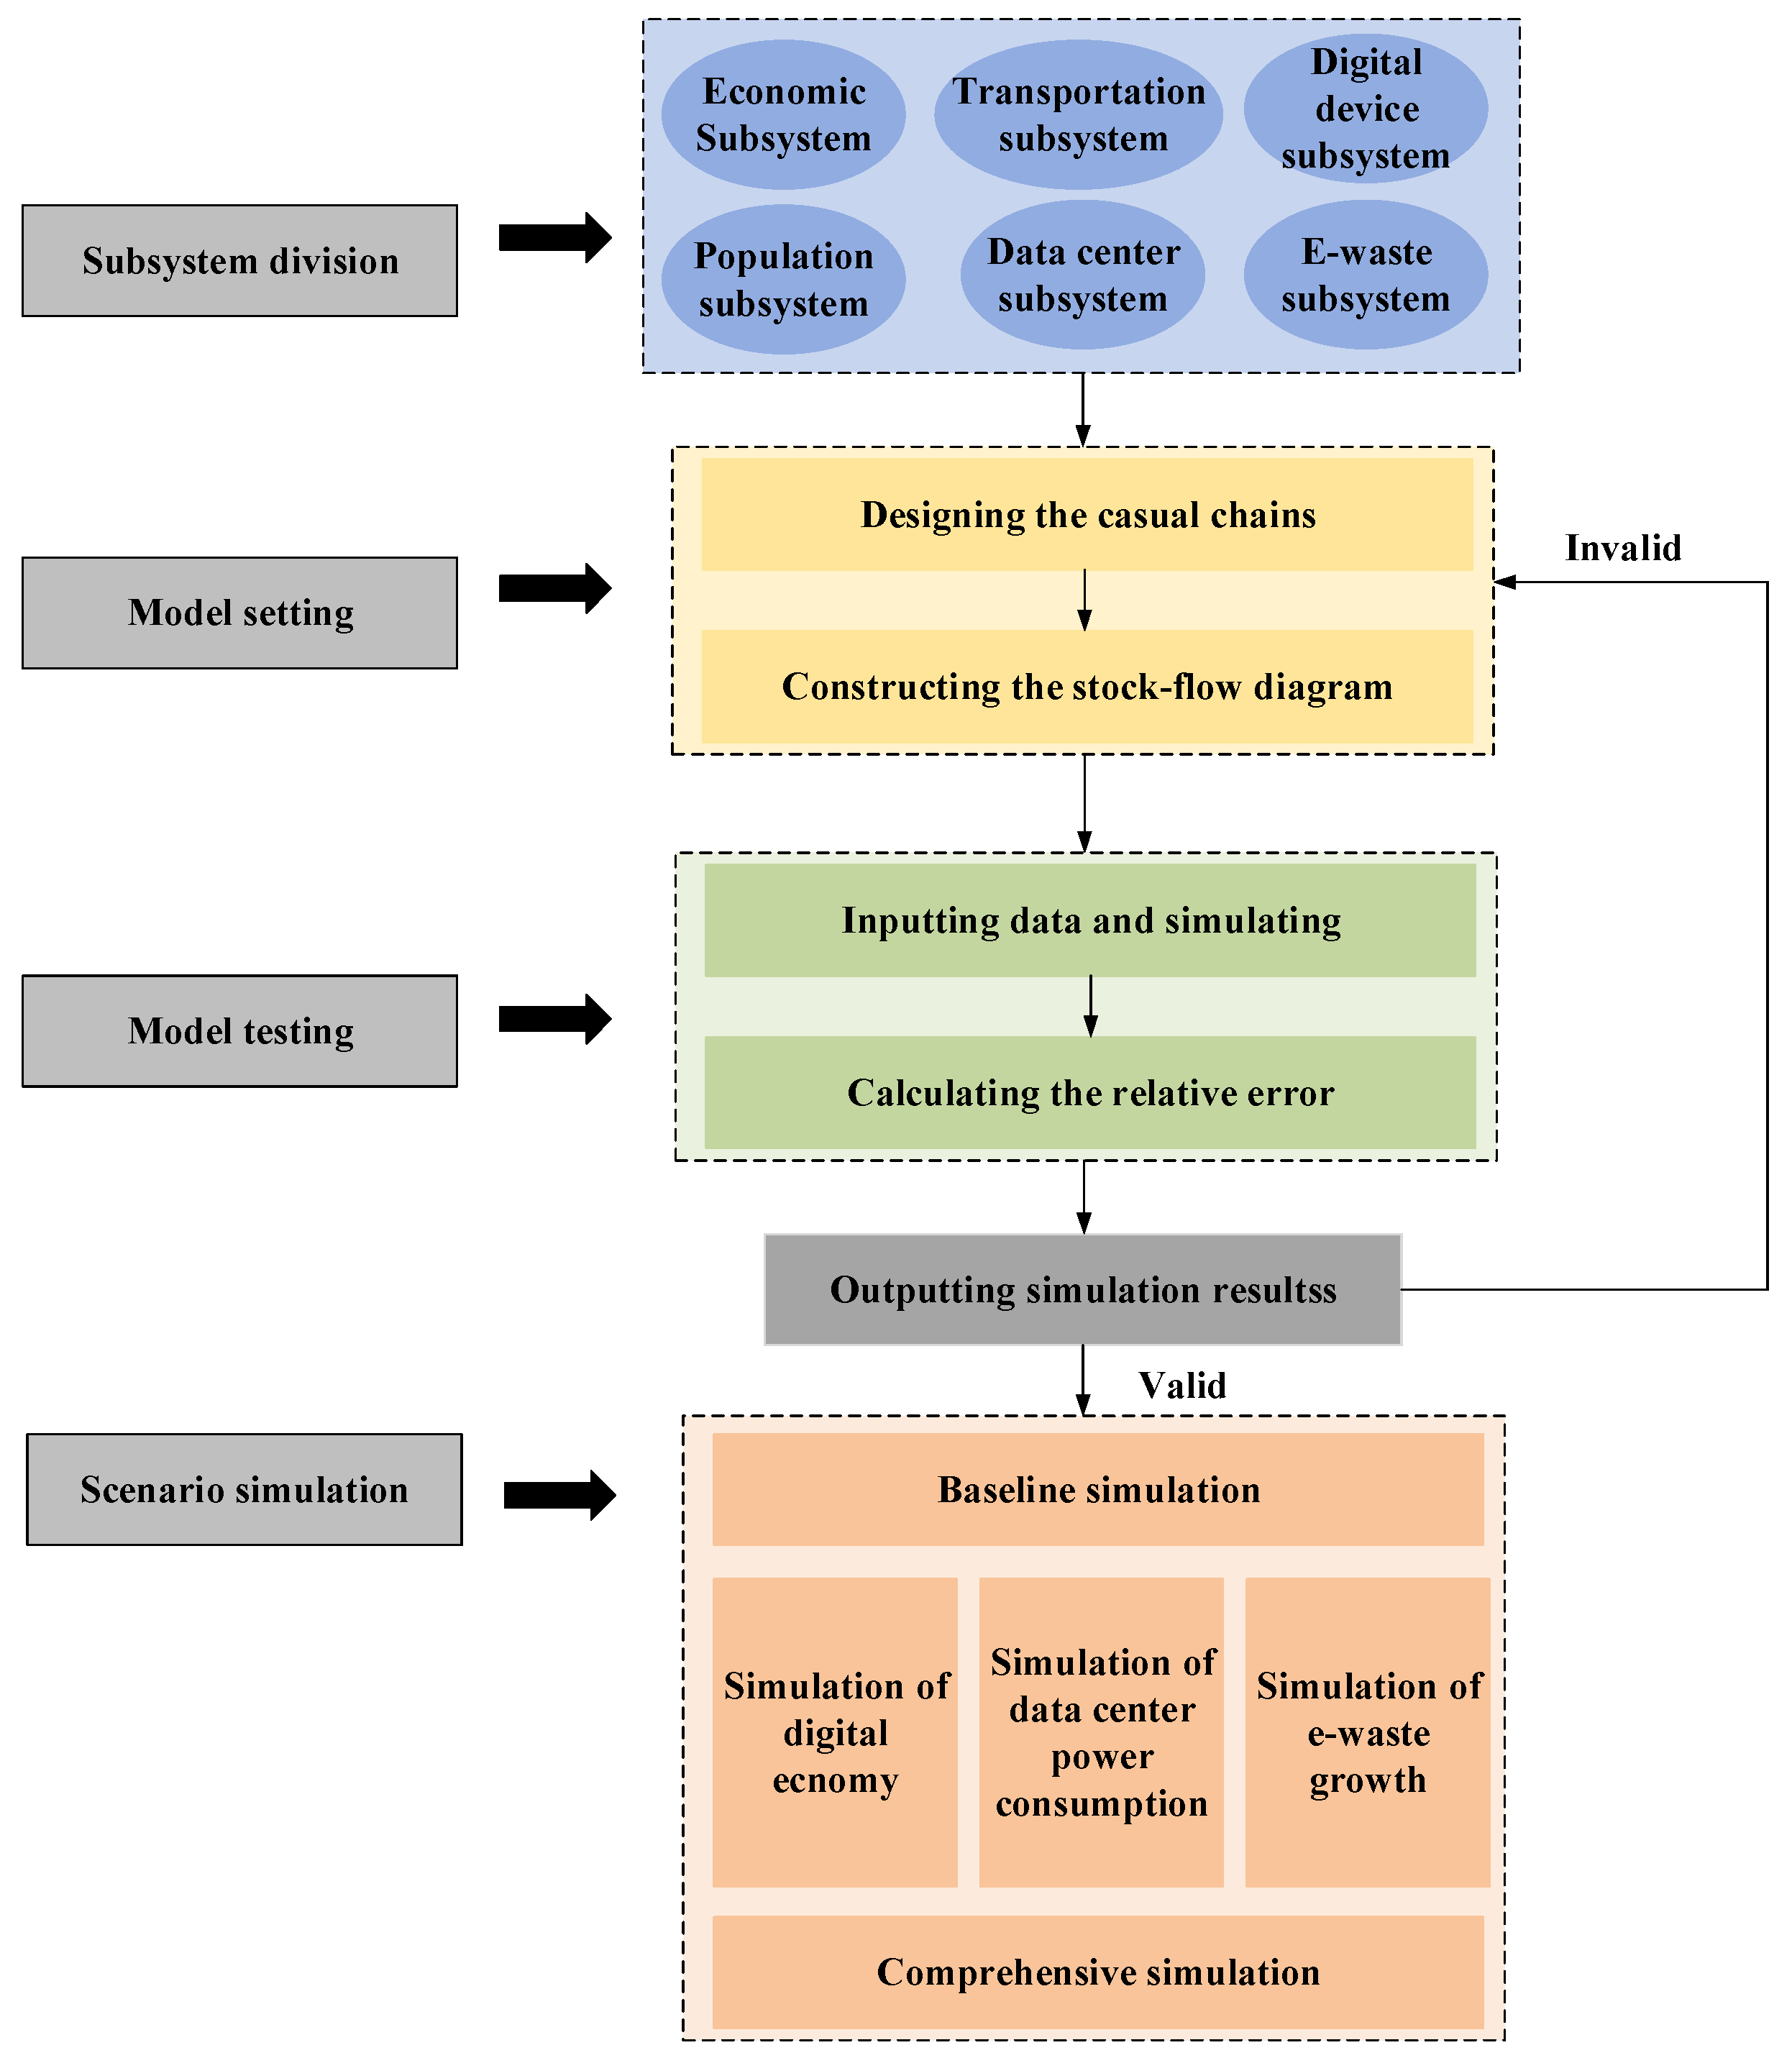
3. Research Methodology

System dynamics, a modeling methodology pioneered by Professor Forrester, initiates with qualitative insights supported by quantitative analysis. This synergistic approach deepens iteratively to address practical challenges effectively [26]. This model excels in analyzing complex socio-economic–environmental systems, evident in its broad application across economic [27], energy [28], and environmental studies [29]. As Figure 1 depicts, this paper’s system dynamics modeling framework comprises four key steps: subsystem division, model construction, model validation, and simulation. The first step is the division into subsystems. Given that a system dynamics model can cover many factors, potentially expanding the system indefinitely, a systemic perspective is necessary for a comprehensive analysis to define system boundaries. This ensures that variables critical and closely related to the research objectives are included while excluding irrelevant factors. Therefore, subsystem division is crucial for defining system boundaries, dividing them into six subsystems: economic development subsystem, transportation subsystem, digital device energy consumption subsystem, population subsystem, data center energy consumption subsystem, and e-waste discharge subsystem. The second step involves model construction, where the system structure is described, defining hierarchies and loops, including feedback relationships between them, and drafting causal loop diagrams and stock-and-flow diagrams. On this basis, a mathematical model is constructed, and equations defining the relationships between variables are developed. The next step, model validation, involves verifying the model’s effectiveness through the calculation of relative errors of related variables. Should the calculated relative errors be substantial, adjustments to parameter values or the selection of model variables might be necessary. Based on simulation results, the model is optimized to enhance its credibility and applicative value. Finally, simulation is conducted using Vensim PLE 7.3.5 software to emulate system operations over time. By adjusting the parameters of key variables, the dynamic evolution of the system under specific scenarios is simulated to obtain corresponding outcomes. We designed a baseline scenario to simulate and predict the system’s developmental trends, analyzing the evolution of digital economy carbon emissions. Additionally, scenarios adjusting the digital economy’s proportion, the growth rate of electronic waste, and the power consumption ratio of data centers were created to explore their impact on the digital economy’s carbon emissions. Lastly, comprehensive policy scenario controls were applied, allowing for an in-depth analysis of the system’s behavior under various scenarios and providing a diverse scientific basis for decision-making.

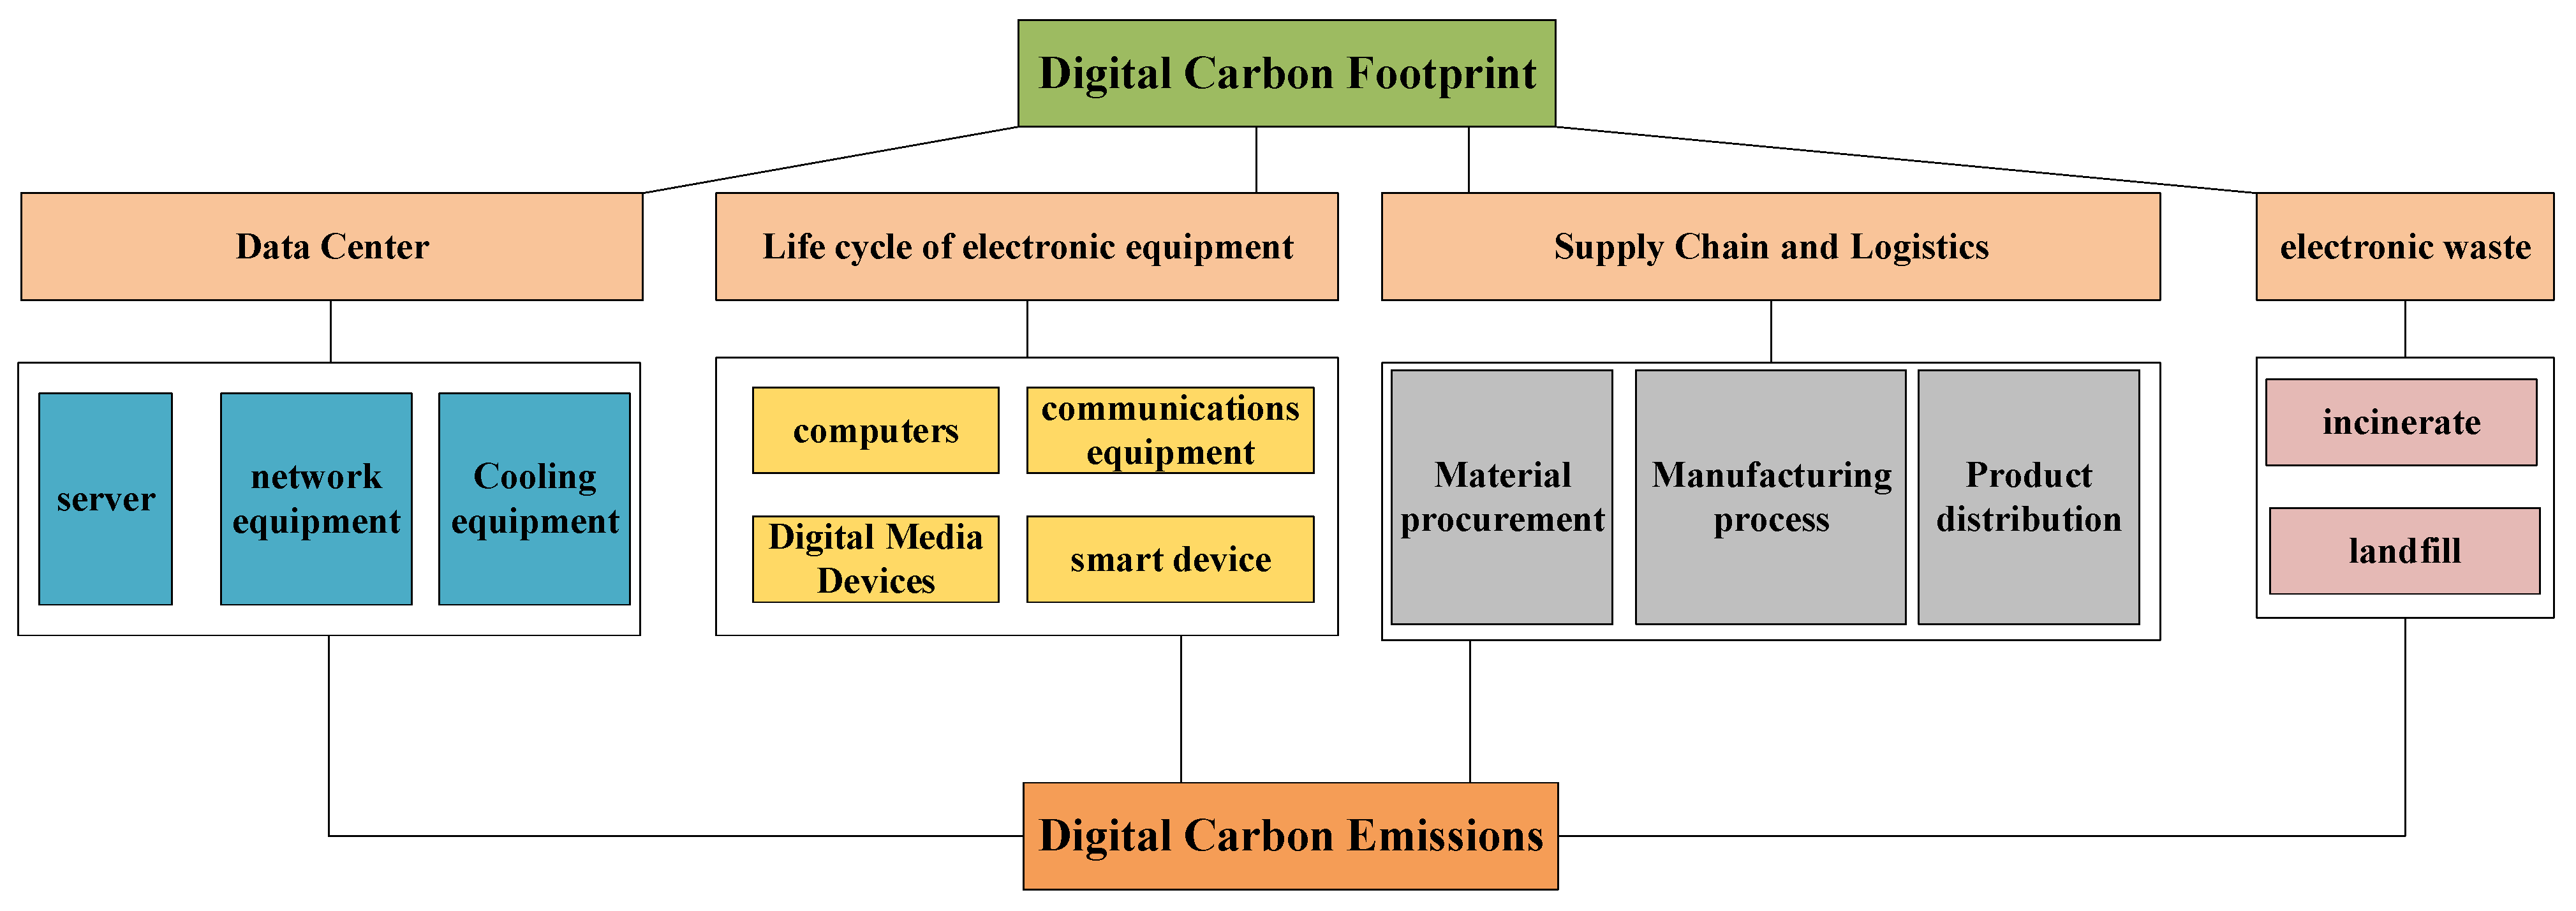
3.1. System Boundaries and Model Assumption

Defining a clear system boundary constitutes the initial phase of constructing a model. The digital economy’s carbon emissions present a worldwide environmental challenge, affecting the global ecosystem. Digital economy carbon emissions originate from various sources, such as industrial production, energy generation, transportation, land use, and extensive Internet activities. The factors interact and exert influence upon each other, collectively constituting a complex system. Collectively, they establish the boundaries of the entire system dynamics model, as depicted in Figure 2. Specifically, China’s digital economy carbon emissions primarily stem from data center operations, electronic device usage, logistics in the digital product supply chain, and electronic waste processing. In 2022, national data centers consumed 937 billion kWh of electricity, leading to approximately 78.3 million tons of carbon emissions [30]. Data centers, crucial infrastructure in the digital era, are witnessing escalating market size and energy consumption due to the industry’s swift growth [31]. The digital economy’s carbon emissions arise from various sources, including electronic devices and hardware like computers, communication gear, digital media, and smart devices. Their manufacturing consumes significant energy and materials, notably fossil fuels and electricity. These energy sources emit carbon dioxide and other greenhouse gases, adversely affecting the environment. Furthermore, smart device transportation and logistics contribute to carbon emissions. Transporting goods from factories to consumers, whether by air, land, or sea, significantly emits carbon dioxide due to fuel consumption [32]. Moreover, China is in a peak phase of electronic waste disposal. The “Regulations on the Recycling and Disposal Management of Waste Electrical and Electronic Equipment” have significantly advanced electronic waste treatment in China, impacting its life cycle and resource recovery. Carbon emissions during resource recovery include both direct emissions from the process and indirect emissions from producing raw materials and energy [33].
Therefore, this research develops a system dynamics model to assess the digital carbon footprint, integrating elements such as the digital economy, electronic waste, logistics, transportation, energy consumption, and the usage of electronic devices. The model’s design reflects system dynamics principles, aims at predicting carbon emissions within the digital economy, and takes into account the representativeness and availability of data, as well as the system’s overarching architecture. In particular, considering that in 2016, the G20 Hangzhou Summit made the digital economy one of the four major actions of the G20 Blueprint for Innovative Growth and emphasized the measurement of the digital economy and its impact on the macroeconomy and other important policies [34], we choose 2016 as the year to develop a system dynamics model of digital carbon footprint. Adding the related literature, 2016 is chosen as the base year of the model, and the simulation time boundary is set between 2016 and 2046 to simulate the carbon emission path of China’s digital economy. Within this boundary, 2016 to 2020 is taken as the modeling time period to verify the degree of compliance between the model’s performance in the past and the actual situation. The period from 2021 to 2046 is used as the time boundary for scenario simulation and prediction, to predict the development trend and change rule of digital economy carbon emissions in the future by simulating different scenarios and policy measures.
On the basis of clarifying the research purpose and the system boundary, ensuring the objectivity and feasibility of the system, while better visualizing the abstract macro-reality system and eliminating the secondary factors that are not related to the research object, this study puts forward the following basic assumptions:
H1: 
The smooth development of China’s digital economy is a continuous and gradual process.
H2: 
During the running of the model, this study will ignore the impact of force majeure, the external environment, and other major changes.
H3: 
Only the carbon emissions generated with the development of the digital economy system will be considered, and sources of carbon emissions outside the system will be ignored.
Based on the above assumptions, this study aims to establish a comprehensive system dynamics model to scientifically analyze and predict the future trend and evolution of China’s digital economy carbon emissions.

3.2. Subsystem Division

From the above system boundaries of the digital carbon footprint and the sources of digital economy carbon emissions, and in conjunction with the relevant results in the existing literature [33,35,36,37,38,39], the digital carbon footprint is divided into six subsystems: economic development subsystem, transportation subsystem, digital device energy subsystem, population subsystem, data center energy consumption subsystem, and e-waste discharge subsystem. These subsystems interact with each other and form a feedback relationship. For example, digital economy carbon emissions will be affected by the combined effect of data center energy consumption, ownership of oil vehicles, and population size. Energy efficiency is influenced by both economic development and energy consumption. GDP, as an important factor in the economic development system, affects investment in science and technology as well as financial revenue. Table 1 below shows the subsystems and their main variables.
The subsystems considered in this study are as follows:
(1) Economic development subsystem: Digitalization within the economic development subsystem represents not just technological innovation but also a crucial component closely associated with economic growth. High-quality economic development not only underpins the extensive use of digital technologies but increasingly drives global economic growth [40]. Digital technology application significantly impacts various fields, notably in lowering overall carbon dioxide emissions. However, though technological progress reduces per-unit emissions, escalating economic output may also increase overall carbon dioxide emissions. This increase is primarily due to the surge in energy consumption spurred by economic growth [41]. Consequently, our study incorporates variables such as GDP, economic growth volume and rate, fiscal revenue, technology investment ratio, and investment amount, offering a comprehensive portrayal of economic development’s complexity within the subsystem.
(2) Transportation subsystem: The sale of digital devices requires diverse transportation methods, presenting both conveniences and challenges. As digital technology rapidly evolves, the global demand for digital devices surges, resulting in increased transportation activities. However, the carbon emissions from these transportation activities pose significant environmental challenges. The combustion of fuels in transportation modes like aviation, land, and maritime significantly increases carbon dioxide emissions, aggravating climate change and pollution [42]. Thus, transportation is deemed a crucial contributor to the digital economy’s carbon footprint. This subsystem encompasses indicators like oil-vehicle production and stock and vehicle disposal volumes and rates, as well as carbon emission factors from vehicles and different transport modes, illustrating the process.
(3) Digital device energy consumption subsystem: The digital device energy consumption subsystem acts as an intermediary, critically managing energy use across the device life cycle. Specifically, the digital economy’s impact on CO2 emissions largely stems from the energy used by digital devices [43]. This subsystem evaluates key indicators like digital device energy consumption growth and its rate to illustrate energy use dynamics. Additionally, digital device energy consumption volume quantifies the total energy used by these devices in a given period. Energy efficiency, a key measure, indicates how effectively digital devices use energy [44,45]. Therefore, our study includes indicators like the energy consumption growth, rate of this growth, consumption volume, energy efficiency, device carbon emissions, and energy carbon emission coefficient in this subsystem for a comprehensive analysis of digital devices’ energy impact.
(4) Population subsystem: Population dynamics significantly impact the digital economy’s carbon emissions, influencing demand for Internet devices, data transmission, and cloud services [46]. Population growth fuels a surge in demand for Internet devices, escalating digital activities like data transmission and streaming, which in turn increases the energy demand for servers and network infrastructure. Given this context, the subsystem incorporates indicators like population size, growth, decline, birth and death rates, digital economy carbon emissions per capita, and Internet penetration rate. The population size and growth rate indicate demographic trends, directly affecting digital device and Internet service demand. Indicators such as birth and death rates and natural population growth reveal demographic shifts, crucial for understanding the digital economy’s long-term evolution. Additionally, residential digital economy carbon emissions highlight the populace’s impact on the digital economy’s carbon footprint, and the Internet penetration rate gauges digital service demand.
(5) Data center subsystem: As crucial pillars of the digital economy, data centers supply the infrastructure essential for operating and supporting digital devices, facilitating data processing and device functionality [47]. Data centers are responsible for storing, processing, and transmitting extensive digital data, utilizing servers, network gear, and storage units. Maintaining these facilities demands significant electricity to ensure digital services’ stability and user satisfaction. However, the electricity for these operations mainly derives from fossil-fuel power plants, adding to carbon emissions amid digital demand fulfillment. This subsystem focuses on indicators like electricity consumption growth and rate, data center carbon emissions, their electricity use share, power generation’s carbon intensity, and overall energy use. The increase in electricity use and its growth rate indicate data centers’ evolving energy needs over time. Data center carbon emissions and their electricity consumption share directly assess their contribution to overall carbon emissions and energy use in the digital economy. The carbon intensity of power generation, a key metric, quantifies carbon emissions during energy use, influencing data centers’ emission totals. Data center energy use, a holistic indicator, reflects the aggregate energy consumption scenario of these facilities.
(6) E-Waste discharge subsystem: Electronic waste in the digital economy ecosystem contributes directly to carbon dioxide emissions during disposal and processing. Each stage in the life cycle of electronic devices, from manufacturing to disposal, produces carbon emissions [45]. For instance, producing electronic devices consumes considerable energy and materials, resulting in carbon emissions. The usage phase of electronic devices demands significant electricity, often from coal and other fossil fuels, thus producing carbon emissions. Moreover, disposing and processing electronic devices at their life cycle’s end also leads to carbon emissions. Carbon dioxide from incinerating waste equipment and methane from decomposing organic landfill materials are significant greenhouse gases emitted during electronic waste disposal. These emissions impact the environment directly and destabilize the climate system. Therefore, to assess this subsystem, we include indicators like average carbon emissions, processing volume, carbon emissions from electronic waste, and electronic waste growth rate.

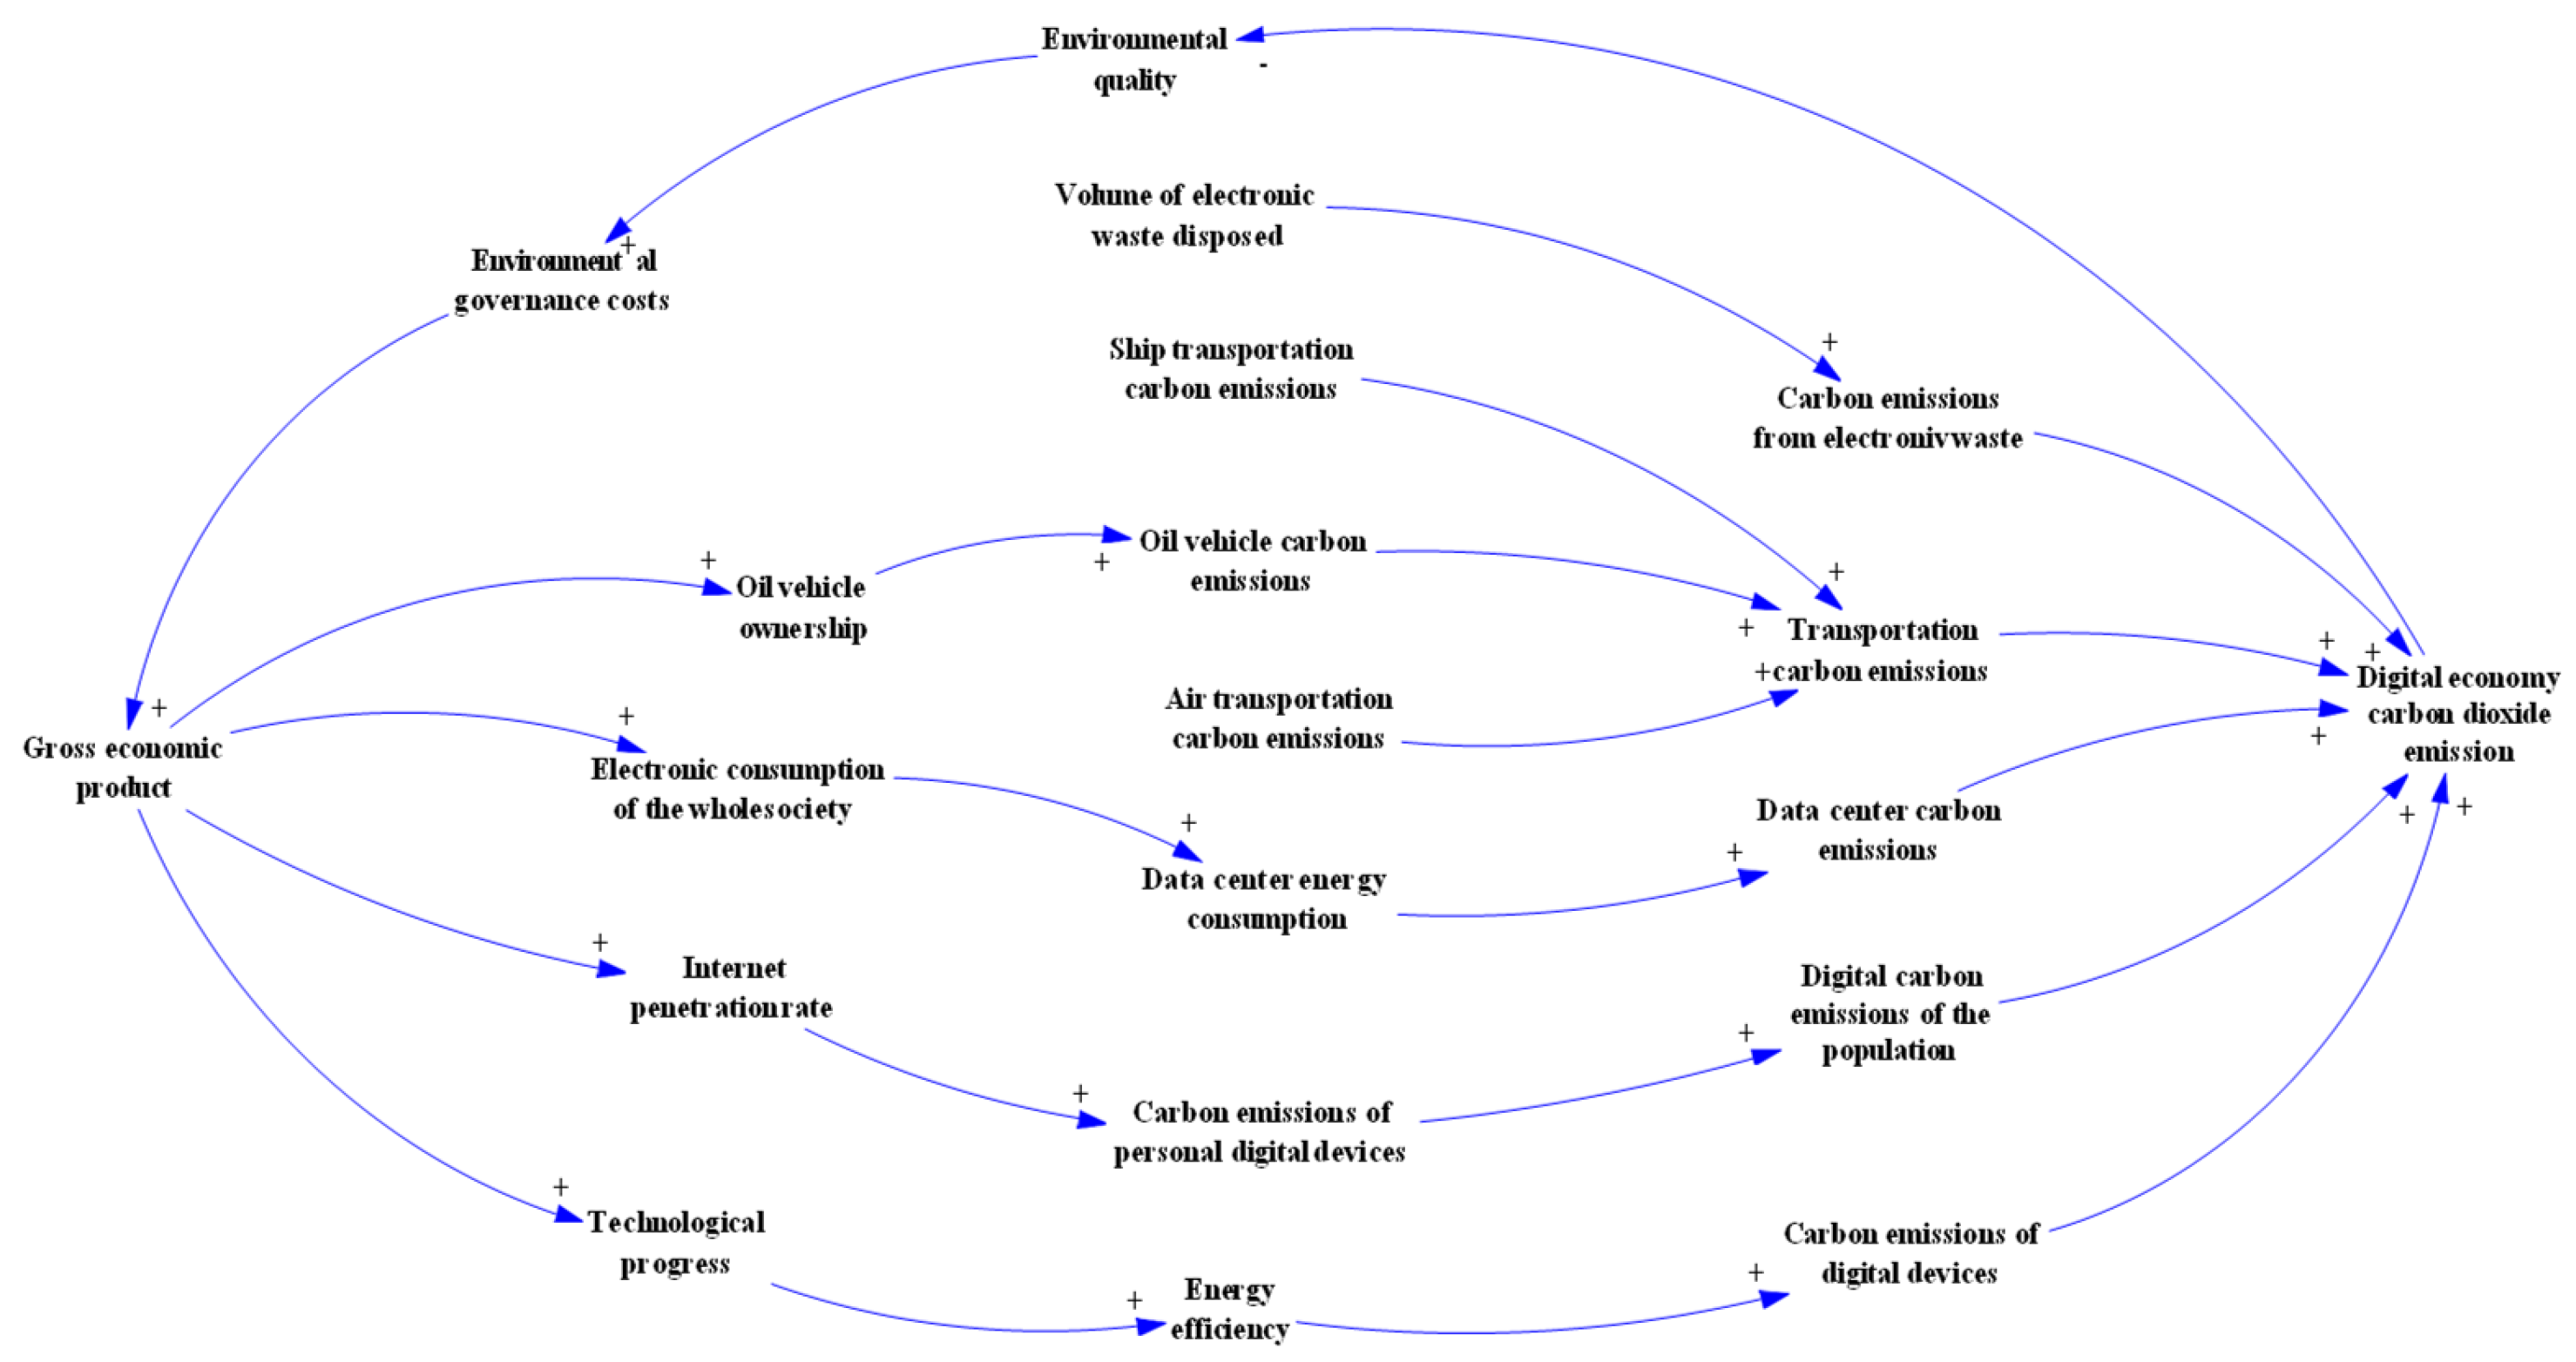
3.3. Digital Carbon Footprint SD Model Construction

3.3.1. Digital Carbon Footprint Causality Analysis

The variables and their relationships in the economic development, transportation, digital device, e-waste, population, and data center subsystems involved in the digital carbon footprint were sorted out and summarized, and a causality diagram of digital economy carbon emissions was obtained (Figure 3). Since the digital carbon footprint is influenced by many factors, this paper focuses on analyzing the main causal loops.
The main causal loops considered in this study are as follows:
(1) GDP → electricity consumption of the whole society → energy consumption of data centers → carbon emissions from data centers → digital economy carbon dioxide emissions → environmental quality → environmental governance costs → GDP.
GDP growth and faster societal development not only enhance economic activity but also significantly boost society’s total electricity use. Data centers, vital to the information technology infrastructure, also experience a notable surge in energy use, becoming key contributors to the digital economy’s carbon emissions. This escalation in carbon emissions directly degrades environmental quality, imposing greater strains on ecosystems. It compels governments and businesses to allocate more resources towards environmental management and the creation of sustainable technologies to lessen carbon emissions’ adverse effects. Consequently, the rising environmental management costs may impact GDP growth as investments shift from economic activities to addressing environmental challenges. This situation creates a complex interplay between GDP growth and environmental governance, underscoring the need to balance economic advancement with environmental conservation.
(2) Internet penetration rate → personal digital economy carbon emissions → residential digital economy carbon emissions → digital economy carbon dioxide emissions → environmental quality → environmental governance costs → GDP → Internet penetration rate.
The rapid adoption of Internet technology has substantially driven the digital economy’s growth, with a rising number of Internet users directly enhancing digital economic activities, including online shopping and cloud computing services. These activities consistently increase individuals’ digital carbon footprints. The accumulation of personal carbon emissions leads to an increase in the digital economy’s total carbon emissions, significantly affecting environmental quality. Environmental deterioration escalates governance costs, imposing financial pressure on governments and potentially indirectly impacting GDP growth through measures like higher taxes or reduced public investments. Economic impacts could further affect investments in and the adoption rate of Internet infrastructure.
(3) Technological progress → energy efficiency → carbon emissions of digital devices → digital economy carbon emissions → environmental quality → environmental governance costs → GDP → technological progress.
Advancements in the industrial Internet and associated technologies have markedly enhanced energy efficiency, leading to lower energy consumption per device. Nevertheless, the proliferation and increased quantity of digital devices have not completely counterbalanced the surge in total energy consumption and carbon emissions attributed to the digital economy’s expansion. With the continuous rise in digital economy carbon emissions, the strain on environmental quality and ecosystems worsens, leading to escalated costs in environmental governance. Consequently, this increase in costs affects GDP growth, heightening the urgency for technological innovation to attain greater energy efficiency and reduce carbon emissions.

3.3.2. Digital Carbon Footprint Stock–Flow Diagram

According to the interaction relationship between the main sources and emission factors of digital carbon footprint, this paper uses Vensim PLE 7.3.5 software to draw the causality diagram of digital economy carbon emissions, in accordance with the basic notation of the stock–flow diagram in system dynamics. In this process, the complex interrelationships between the various elements of the digital economy’s carbon emissions are deeply explored, leading to a more comprehensive understanding of the mechanism of the digital economy’s impact on carbon dioxide emissions. This illustration provides an intuitive and detailed visual representation that helps to delve into the dynamic relationship between the sustainable development of the digital economy and its environmental impact. Figure 4 illustrates this stock–flow diagram.

3.4. Data Sources and Parameter Setting

The system dynamics of digital economy carbon emissions contain many variables, such as population, transportation, economy, data center, and e-waste data. The demographic data, such as population size, population growth rate, birth rate, and death rate, and the economic data, such as gross domestic product (GDP), GDP growth rate, and fiscal revenue, are mainly from the China Statistical Yearbook. E-waste data such as the average carbon emissions of e-waste from the “China’s comprehensive environmental management of e-waste (2012–2021) report”, e-waste disposal growth rate data from the “e-waste and children’s health report” and other statistical data, and the model are constantly simulation-test-derived. The parameters of each variable of the digital economy carbon emission system are mainly calculated by the following methods:
(1) Ratio analysis method: This quantitative analysis tool utilizes the proportional relationships between different variables to explore and explain phenomena within economic, technological, or environmental systems. By analyzing related variables, this method can reveal the intrinsic connections and interactions between them, providing a basis for decision-making. For example, technological investment = digital economy proportion * fiscal revenue. Analyzing the relationship between the proportion of the digital economy and fiscal revenue allows for the construction of a model on how the digital economy impacts technological investments, further studying how increased investments affect carbon emissions.
(2) Table function method: This method enables models to capture the nonlinear trends and patterns of variables over time. Researchers can build more accurate and flexible models based on historical or forecasted data to analyze and predict future trends. For instance, variables like GDP growth rate, growth rate of oil-vehicle production, birth rate, and mortality rate can be represented through table functions to show their changing trends over time, providing a foundation for constructing digital economy carbon emission models. Taking Internet penetration as an example, Internet penetration = with lookup ([(0,0)–(20,10)], (0,0.503), (1,0.532), (2,0.558), (3,0.596), (4,0.645), (5,0.704), (6,0.73), (10,0.8), (20,0.85)). Each pair of numbers within the brackets represents a specific time point (year) and the Internet penetration rate for that year. For example, (0,0.503) indicates that in the base year (year 0), the Internet penetration rate was 50.3%, (1,0.532) indicates that in the first year, the Internet penetration rate was 53.2%, and so on. In this manner, the formula provides a time series describing the expected change in Internet penetration rates from year 0 to year 20. This model can help researchers understand and predict the growth trends of Internet penetration rates over time.
(3) Literature reference method: Faced with insufficient data or uncertain model parameters, this method identifies the necessary model parameters or estimates by systematically reviewing and analyzing the related published literature. Not only can it provide a reliable source of parameters for research, but it also enhances the scientific rigor and credibility of the study. For example, the average carbon emissions from air and water transportation, the carbon emission factor for power generation, and the carbon emission coefficient for automobiles can be identified through the literature review.
(4) Function equation method: This approach uses specific mathematical functions to describe the relationships between variables. It allows researchers to precisely express how variables change in relation to one another, which is especially suitable for relationships that can be clearly defined by mathematical expressions. For instance, regional GDP = INTEG (economic growth, 688,858.2), where the formula calculates the regional GDP at any given point by integrating the economic growth from a baseline year. This calculation method enables researchers to understand and predict how regional GDP changes over time. Similarly, carbon emissions from personal digital devices = carbon emissions from personal computers + carbon emissions from personal communication devices + carbon emissions from personal digital media + carbon emissions from personal smart devices. This formula calculates the total carbon emissions from personal digital devices by summing the emissions produced by various personal digital devices throughout their life cycle.
The combination of these methods can help construct a more accurate and comprehensive system dynamics model of digital economy carbon emissions. By accurately describing the quantitative relationships between variables and changes in parameters, the future trend in digital economy carbon emissions can be better predicted, providing a scientific basis for the development of effective carbon emission reduction policies and responses to climate change. As can be seen from the stock–flow diagram, a total of 65 variables are selected in this system, including 10 state variables, 11 rate variables, and 44 auxiliary variables. The specific parameter settings of the main variables and equations in Figure 4 are shown in Table A1 of Appendix A.

3.5. Model Validity Test

Since whether a model can be used in practice depends on its validity, it is necessary to check the validity of the established system dynamics model before conducting simulation experiments, so as to confirm the reasonableness and accuracy of the established model. According to the digital carbon footprint stock–flow diagram and the corresponding parameter settings, Vensim PLE 7.5.3 software is used to test the validity of the model by historical simulation. In the digital carbon footprint system dynamics model, the simulation interval is set from 2016 to 2020, and the simulation step is 1 year, which can be used to check the validity of the model. By comparing with the actual values, if the error between the results of model runs and the actual values is small, it means that the design of the model is more reasonable and can better reflect the past development trend of the system.
The validity test can also help to verify the validity of the stock–flow diagram of the digital carbon footprint system. By comparing the simulated predicted values of each stock and flow in the stock–flow diagram with the actual observed values, we can understand the performance of the model in describing the relationship between different stocks and the change in flows. If the model’s stock–flow diagram can predict the actual situation better, it means that the model is reasonable in describing the dynamic process of the digital economy carbon emission system. To perform a relative error test on the variables in the system, excluding constants, the relative error can be calculated from actual and simulated values using Equation (1). In this equation, F t represents the simulated value for year t, H t represents the historical or actual value for year t, and et is the relative error for year t. A smaller et indicates a better fit of the SD model [48].
e t = F t H t H t × 100 %

3.6. Digital Carbon Footprint Scenario Designs

Scenario simulation is a quantitative analysis method of system dynamics, which is used to study and predict the behavior and performance of a system and to assess the impact of future development paths on system problems under different scenarios. Based on the system dynamics model, the evolution and response of the system under different scenarios are observed by simulating the interactions and feedback mechanisms among the variables in the system. In system dynamics, it is a necessary function and advantage to change a key variable to study the impact of the scenario on the final outcome of the system. Due to the uncertainty of the future direction of the digital carbon footprint, different scenarios are set up to analyze the digital carbon footprint by numerical simulation. Under the goal of carbon peak, this paper selects the percentage of digital economy, the percentage of data center power consumption, and the growth rate of e-waste as the regulating variables and adjusts the parameters of the above variables in the initial scenario to establish four scenarios for simulation. After model validation, according to the research objectives, different research scenarios could be designed to output the corresponding simulation results. The specific programs are shown in Table 2.
We set up the following scenarios:
(1) Baseline scenario: The baseline scenario simulation of the system dynamics model was performed for digital economy carbon emissions, assuming no policy restrictions and basing all parameters on historical trends and some available research results. The specific parameter settings and forecast for each variable under the baseline scenario are shown in Table A1 of Appendix A. According to the simulation of the baseline scenario, the future trend of the system could be analyzed.
(2) Different percentage of digital economy scenario (DPDE): The digital economy is the main economic form after agricultural economy and industrial economy, with data resources as the key element, modern information network as the main carrier, and the integration and application of information and communication technology and the digital transformation of all elements as the important driving force to promote a new economic form that is more unified in terms of equity and efficiency. Based on the “14th Five-Year Plan for the Development of Digital Economy”, this scenario regulates the parameters of “Digital Economy Percentage” and adjusts the parameters of “Digital Economy Percentage” with reference to the initial program. On the basis of the initial scenario, the development scenarios of different periods are designed, and policy simulation experiments are conducted to simulate the trend of digital economy carbon emissions under different economic ratios. The adjusted scheme is shown in Table 3 below.
(3) Different percentage of data center power consumption scenario (DPDCPC): With the deep development of digitalization, the scale and number of data centers are increasing, triggering their huge energy demand. Applications such as high-performance computing, cloud computing, and big data processing put higher power requirements on data centers. In order to maintain the normal operation of equipment, data centers not only need a large amount of power supply but also need to consume additional power to maintain appropriate temperature and humidity to prevent hardware overheating. In view of this, according to the “14th Five-Year Plan”, we adjusted the parameter of “Data Center Power Consumption Percentage” and simulated the trend of carbon emissions in digital economy under different data center power consumption percentages by referring to the initial scenario, and the adjustment scenario is shown in the following Table 4.
(4) Different e-waste growth rate scenario (DEGR): The information and technology revolution has led to a wider use of electronic devices in various fields while also generating more and more waste products, with e-waste being one of the fastest growing waste streams. According to the report “China E-Waste Industry Overview 2022: Recovering the Sleeping Municipal Vein”, the amount of e-waste recovered through formal recycling channels is expected to enter a period of decline in 2021–2023 or enter a slow recovery period after 2024. Therefore, the “e-waste growth rate” parameter was adjusted to simulate the trend of carbon emissions in the digital economy under different e-waste growth rates, and the comprehensive adjustment scheme is shown in Table 5 below.
(5) Comprehensive adjustment scenario: This scenario is built on the basis of the previous three scenarios and takes into account the changes in the digital economy, data center power consumption, and e-waste to comprehensively regulate the digital economy carbon system. In this comprehensive regulation scheme, we simultaneously consider the changes in the key parameters of the digital economy share, data center power consumption share, and e-waste growth rate, in order to comprehensively grasp the complex influencing factors of the digital economy carbon emissions. The adjusted scheme is shown in Table 6 below.

4. Digital Carbon Footprint Simulation Results Analysis

This study employs a system dynamics approach to model and analyze the specified problem. Initially, we defined a range of variables within the model, including both independent and dependent variables. These were identified based on prior research or hypotheses, and their roles and interrelationships within the system were thoroughly elucidated. Subsequently, leveraging theoretical analysis and empirical data, we developed system dynamics equations to describe the interactions among these variables. These equations were formulated to precisely capture the dynamic interconnections between the variables. Using the parameter values of these variables as initial inputs, we conducted simulations with Vensim PLE 7.5.3 software. We carefully selected appropriate time steps and the total duration for the simulations to effectively model the system’s behavior and the temporal evolution of the variables. Upon completing the simulations, we undertook a comprehensive analysis of the output data. This involved verifying the model’s accuracy by comparing its results with historical data, thus ensuring the scientific validity and reliability of our findings.

4.1. Result of Model Validity Test

Due to the length of this article, only the GDP indicator of economic development, the indicator of electricity consumption of the whole society that can affect the carbon emissions of the data center, and the indicator of population size that reflects the population growth are listed. The model simulates the simulated values, real values, and error rates of the three indicators, and the results are shown in Table 7.
As can be seen from the results in the table, the error rate between the simulated and real values of the variables of the digital carbon footprint system model, such as gross economic product (GDP), electricity consumption of society as a whole, and population size, is within 5 percent. It can be concluded that the errors of the running results of the model are all within the error range of 5%, and the errors between the simulated values and the real values are small, and the model is set up well, with a high degree of fit, and passes the validity test of the system. Therefore, the system dynamics model and parameter settings of digital economy carbon emissions are effective and feasible, and the model can be used for the prediction of future digital economy carbon emissions.

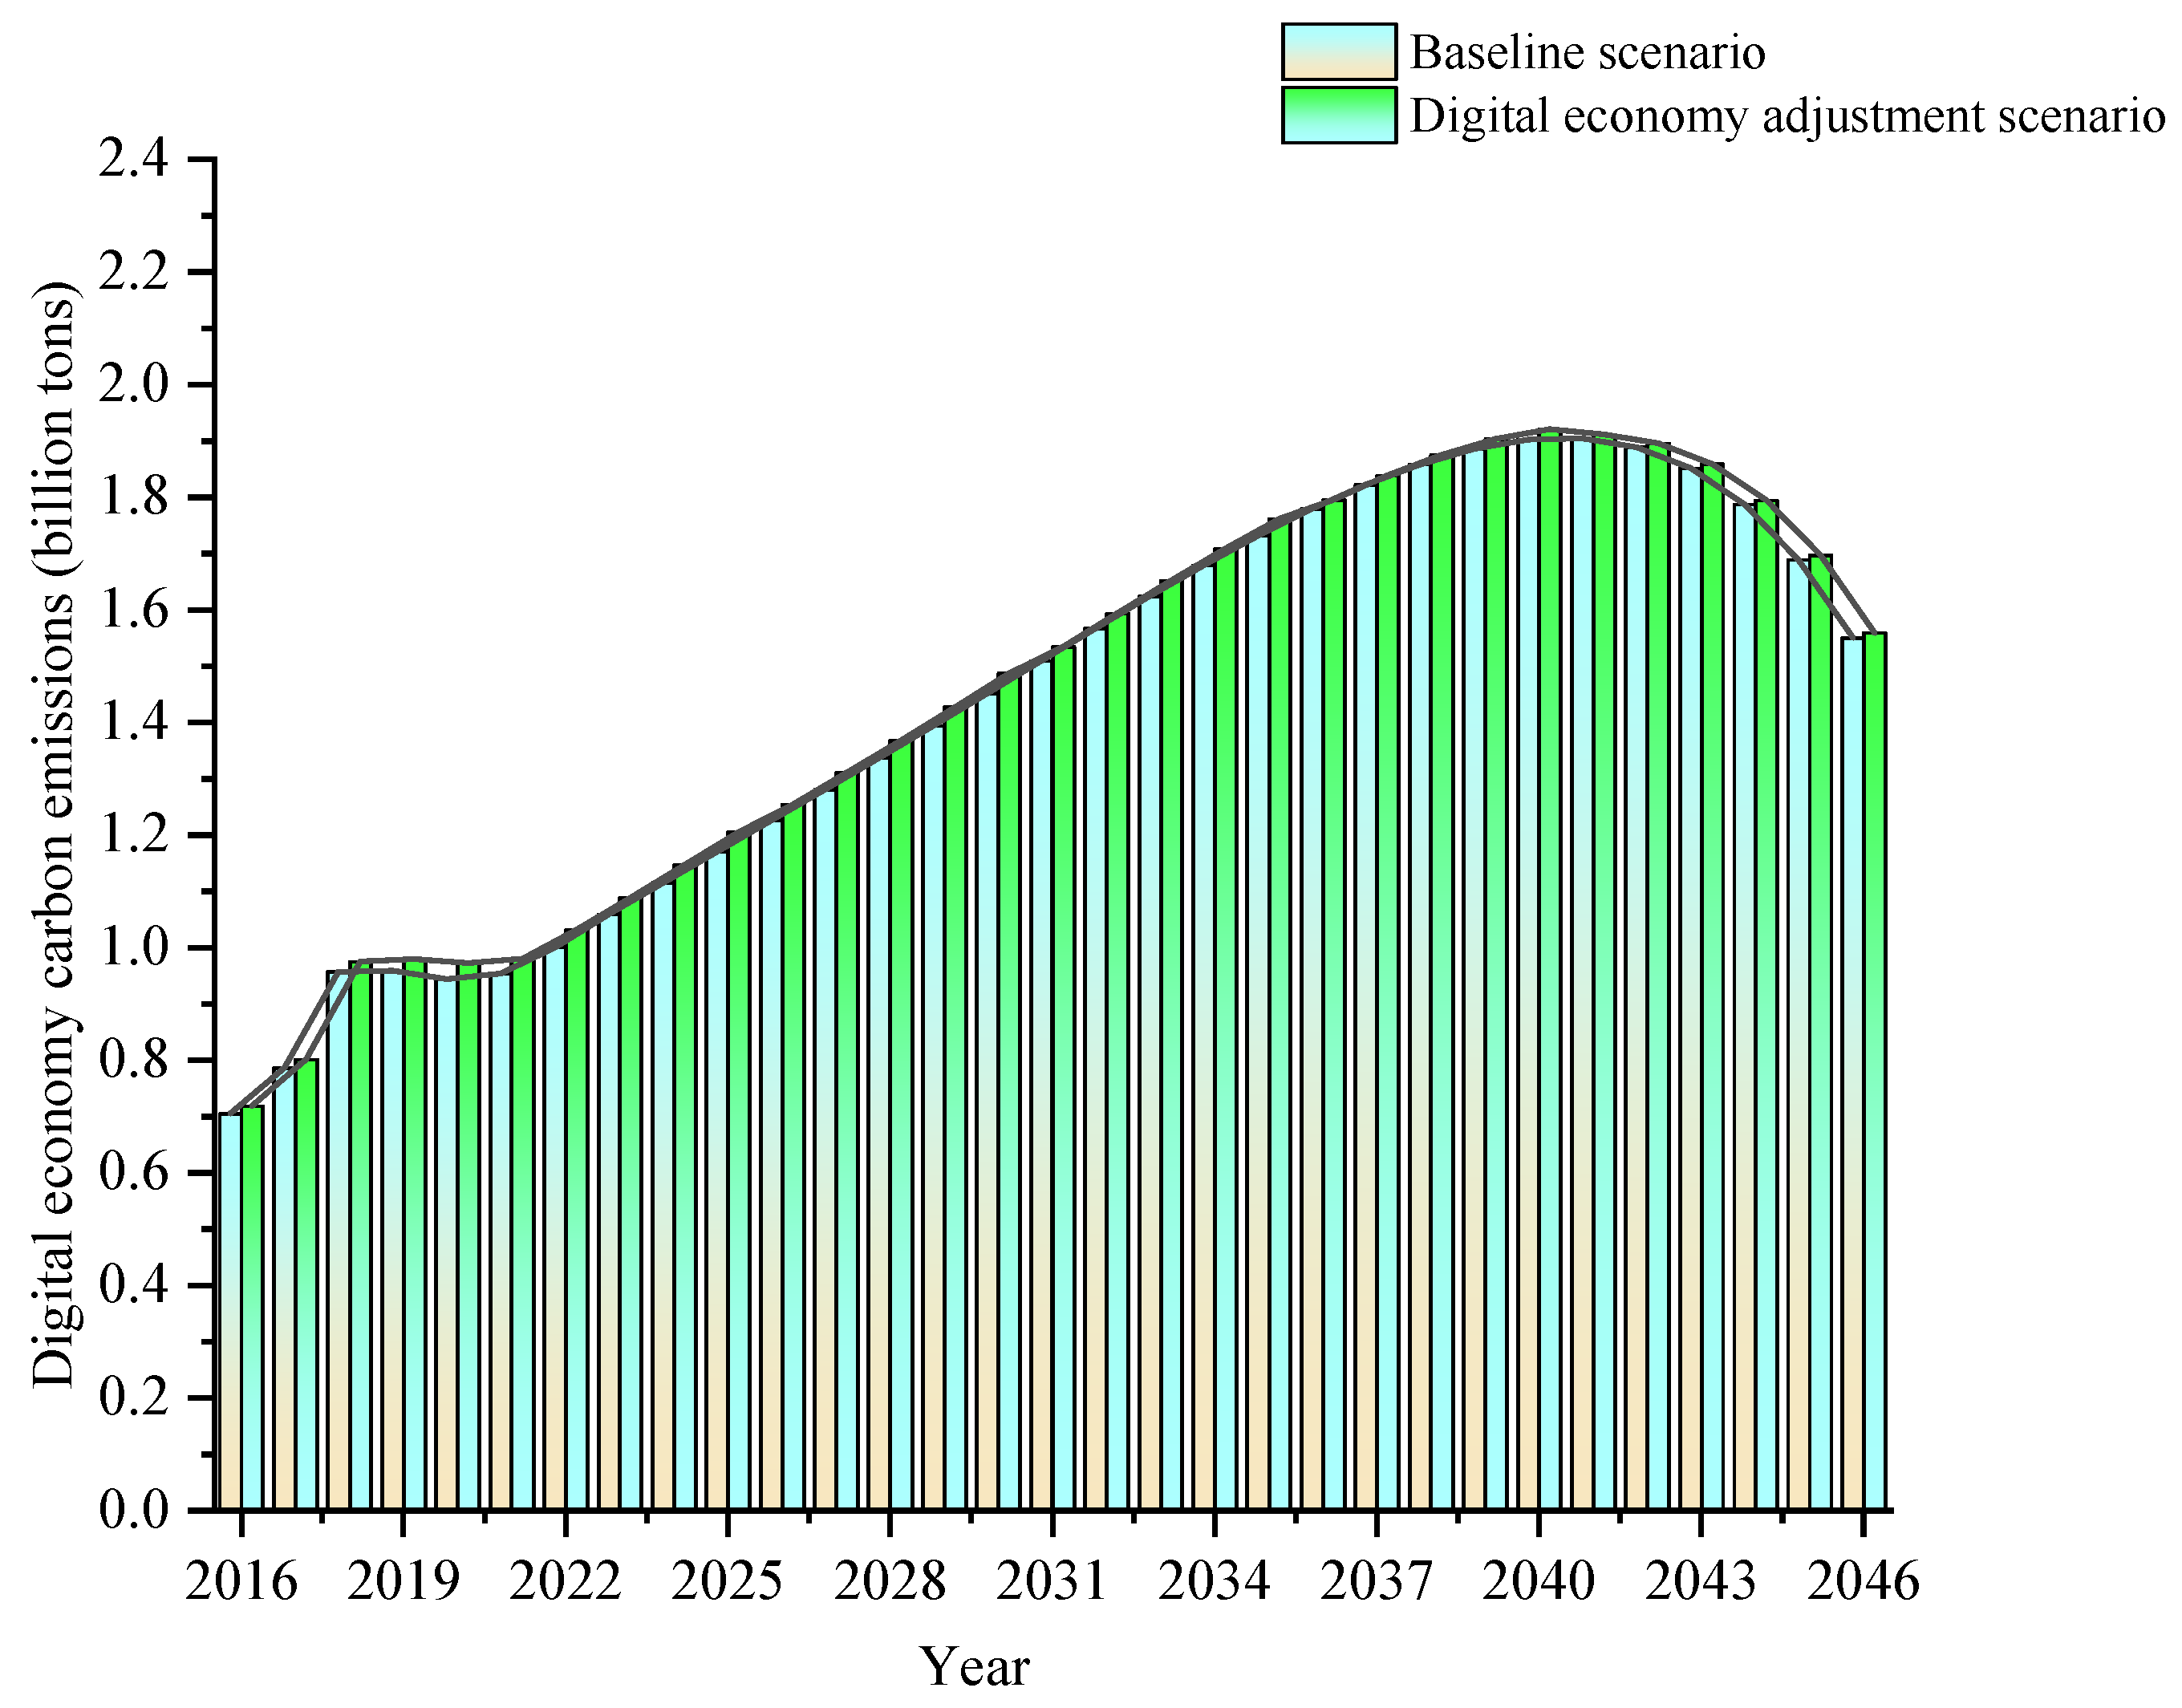
4.2. Analysis of the Development Trend under the Different Scenarios

4.2.1. Analysis of the Result of Baseline Scenario

This approach produced simulated forecast data and trends for carbon emissions related to the digital economy between 2016 and 2046, as illustrated in Figure 5. The simulation results indicate that digital economy carbon emissions grew from 0.7052 million tons in 2016 to 1.55041 billion tons in 2046, with an average annual growth rate of 3.99%. However, carbon emissions did not peak in 2030 as anticipated but continued to rise until 2041. This continued increase is attributed to the sustained growth of the digital economy, which led to an ongoing increase in digital demands, thereby spurring the use of more digital devices and Internet services and, consequently, increased energy consumption and carbon emissions. Additionally, the impact of the global COVID-19 pandemic on digital economy carbon emissions is a significant factor. In 2020, the outbreak led to the implementation of lockdown measures worldwide, slowing economic activities and decreasing energy demand, which in turn led to a temporary reduction in digital economy carbon emission. However, as the economy gradually recovered, digital economic activities and carbon emissions began to rise again. The reason for the continued increase in digital economy carbon emissions after 2030 may be due to the ongoing development of the digital economy and the insufficiently rapid transition of energy structures. Despite some carbon reduction policies and measures adopted by governments and regions, the proportion of clean energy remains low on a national scale, leaving considerable room for development. Over time, as the impact of the 2020 pandemic gradually diminishes and the global emphasis on and measures for carbon reduction strengthen, digital economy carbon emissions begin to decline after reaching a peak in 2041. This trend may result from the implementation of more carbon reduction measures by governments and digital economy companies, including improving energy efficiency and promoting clean energy. Furthermore, as technology progresses and innovation advances, the carbon emissions associated with digital economic activities are expected to decrease gradually.

4.2.2. Analysis of the Result of DPDE Scenario

Adjustments to system variable parameters yielded simulation results as depicted in Figure 6. Based on the data from Figure 6, it is evident that the percentage of the digital economy has a significant impact on its carbon emissions. In the scenarios set for analysis, the digital carbon footprint is projected to peak in 2040, with emissions reaching 1.9205 billion tons. This phenomenon indicates that an increase in the digital economy’s share leads to a rise in the production and usage of digital services and products. This often involves the extensive utilization of data centers and cloud computing resources, as well as widespread deployment of the Internet of Things (IoT) and smart devices, all of which are energy-intensive activities, and as the digital economy expands, the corresponding energy consumption and carbon emissions also increase. Despite ongoing progress in the information technology sector towards improved energy efficiency and attempts to use more renewable energy sources, the technological improvements and energy transition are likely insufficient to offset the increased energy demand brought about by the growth of the digital economy before 2040. Additionally, the rapid growth of the digital economy necessitates supporting infrastructure, such as the construction and updating of data centers, which produce significant carbon emissions during their construction and operational processes. Moreover, the cycle of upgrading old facilities and the diffusion of new technologies require time, leading to a peak in carbon emissions in the short term. After reaching this peak, the digital economy carbon emissions begin to decrease, amounting to 1.55873 billion tons in 2046, which is a 0.54% increase compared to the initial scenario. Although there is a slight reduction in 2046, the decrease is minimal, indicating that the rapid development of the digital economy continues to have an impact on carbon emissions. This may be due to the current reliance on traditional high-carbon energy sources for digital economy development, with effective carbon reduction measures not being realized before 2046. This suggests that the key to reducing future carbon emissions lies not only in improving technological efficiency and adopting green energy but also in finding a balance within the rapid development of the digital economy to achieve sustainable development.

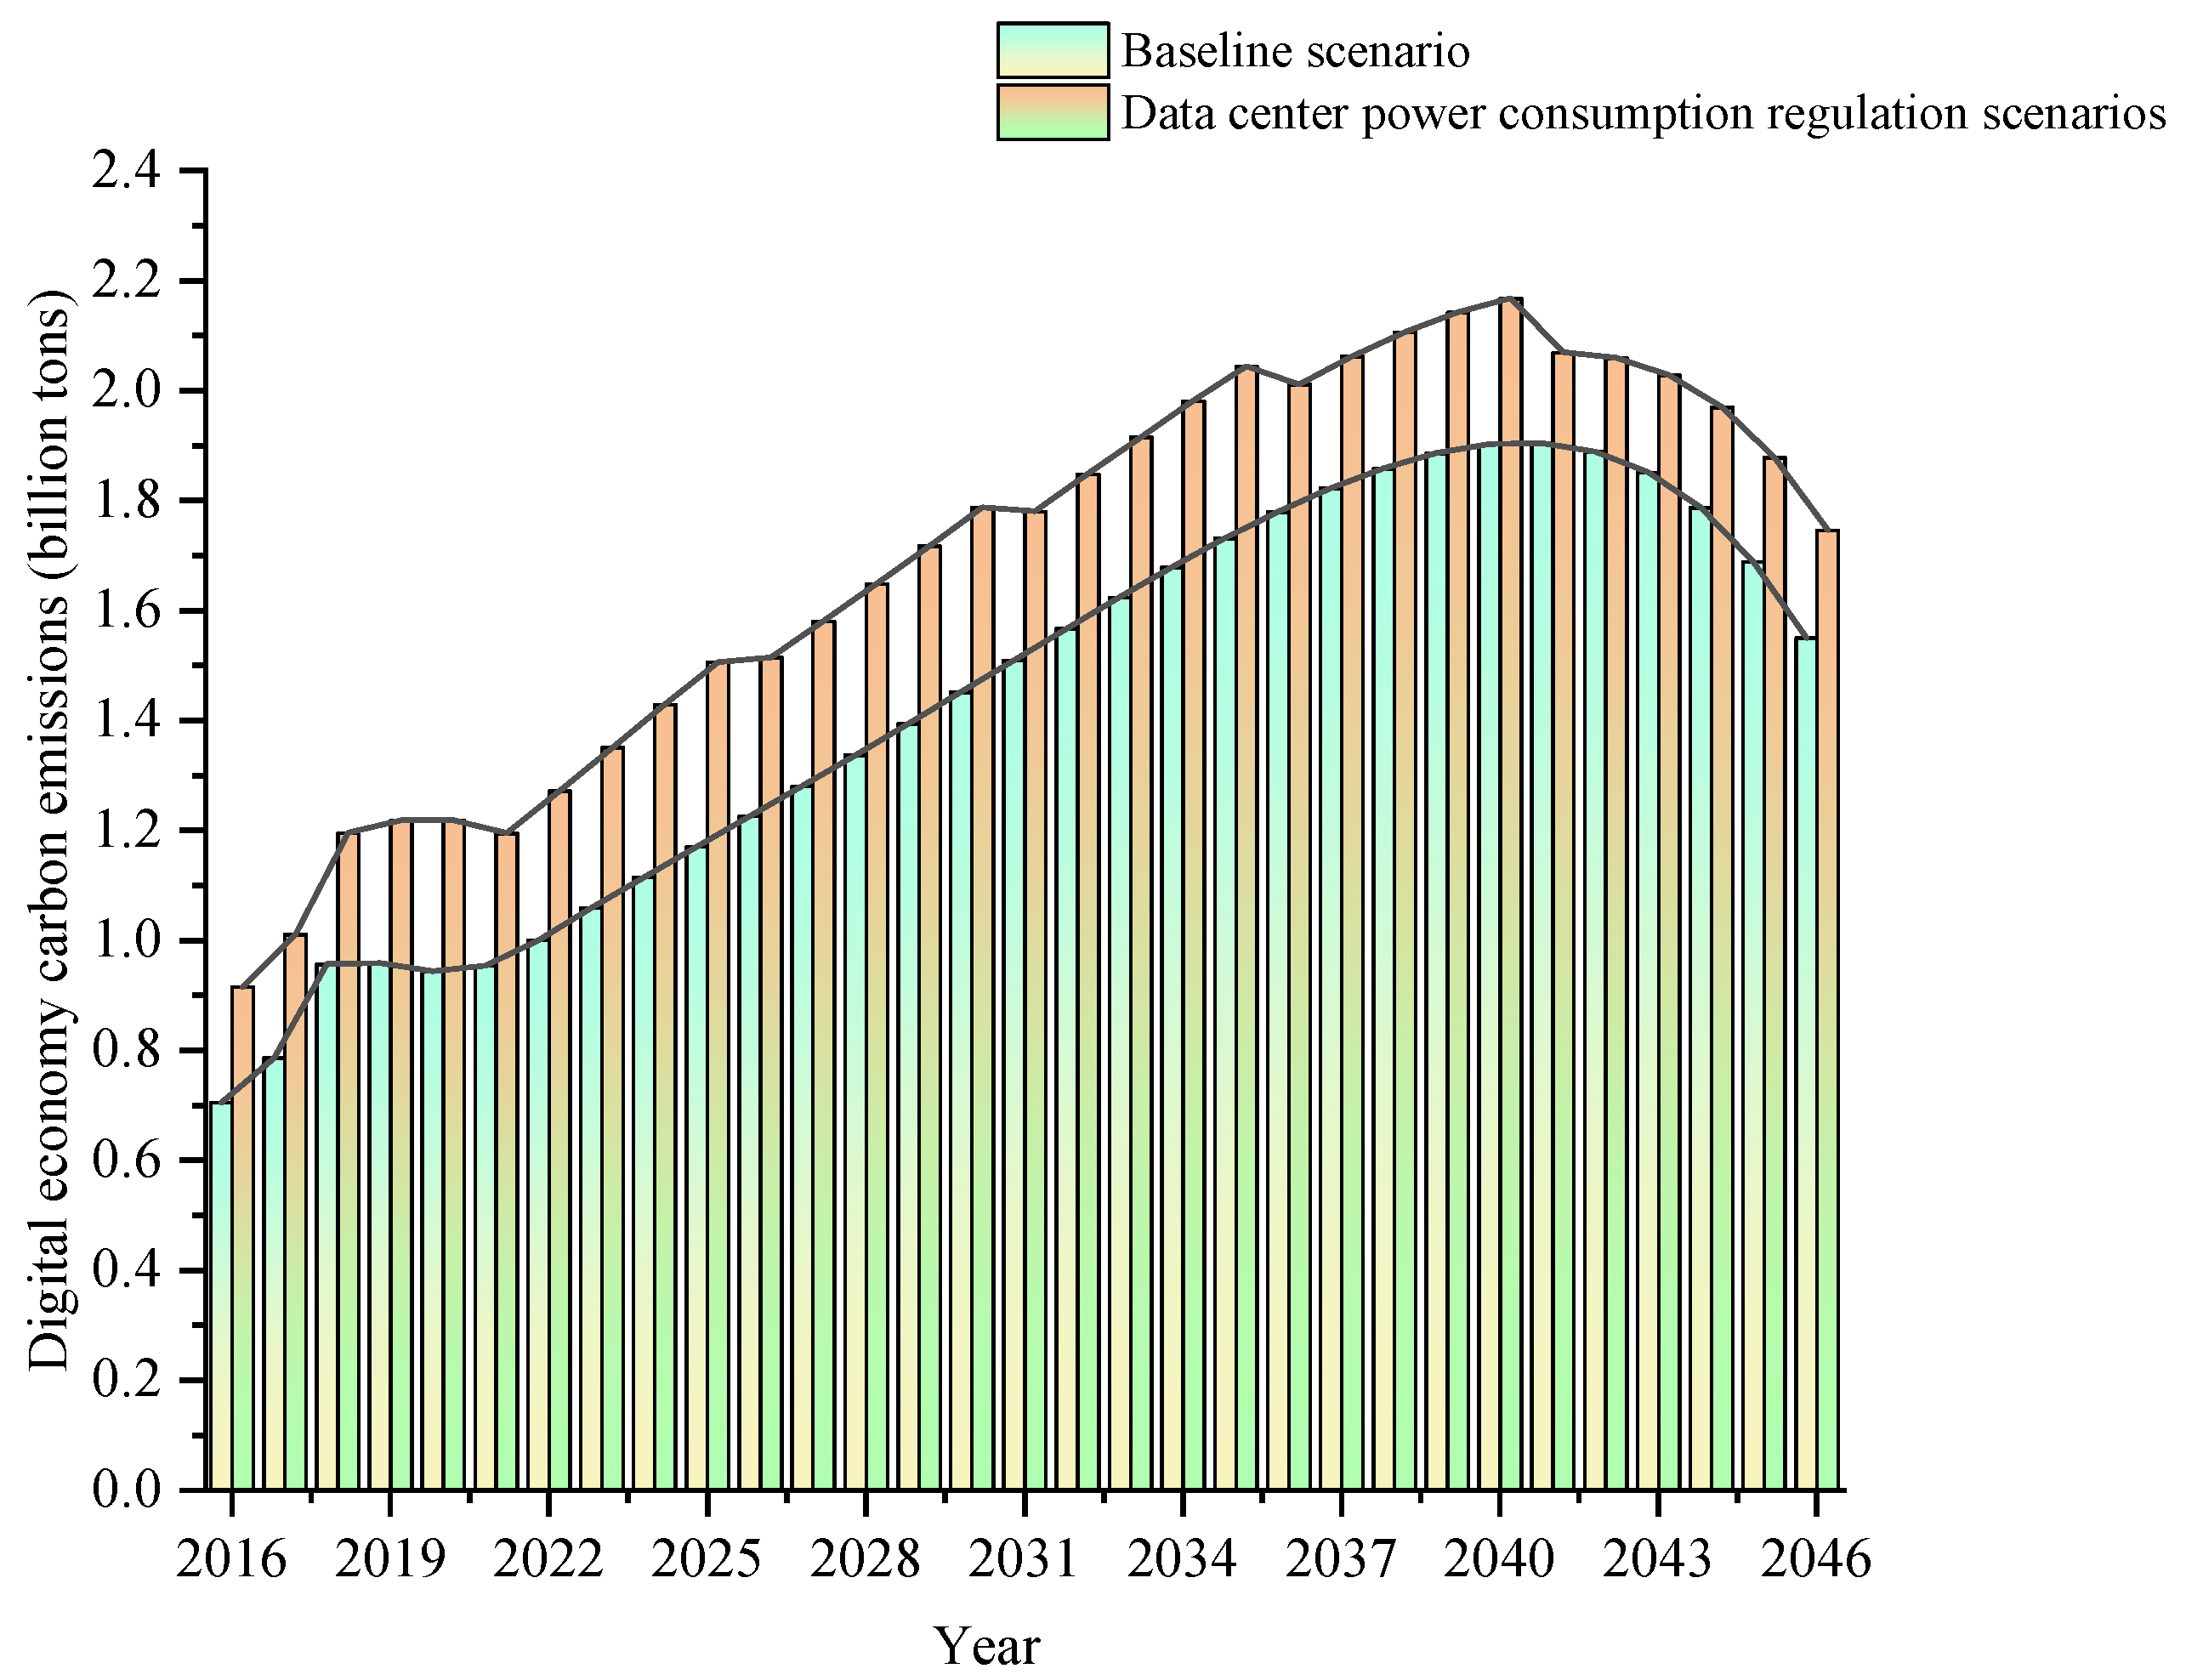
4.2.3. Analysis of the Result of DPDCPC Scenario

Simulation experiments on the impact of different data center power consumption ratios on the digital economy carbon emissions, as depicted in Figure 7, demonstrate that the percentage of data center power consumption significantly affects the digital economy carbon emissions. Specifically, compared to the baseline scenario, digital economy carbon emissions have experienced substantial growth, with an average annual growth rate of 3.02%. By 2026, digital economy carbon emissions reach 1.51504 billion tons, showing a rapid upward trend. This phenomenon is attributed to the pivotal role of data centers in the digital economy, where the rising demand for digital services and cloud computing leads to an increase in the energy consumption ratio of data centers, reflecting the actual growth in energy usage. Data centers require substantial electricity to operate, including server operation, data storage, network transmission, and cooling systems. As a result, this leads to a significant increase in energy demand across the digital economy sector. By 2040, digital economy carbon emissions reach their peak, one year ahead of the baseline scenario, with emissions increasing to 2.16756 billion tons, an increase of 136.73%. This simulation result further validates that, as the infrastructure supporting the development of the digital economy, the operational electricity demand of data centers has increased correspondingly. They require electricity not only to keep servers and other hardware operational but also need substantial energy for cooling systems to prevent hardware overheating. The growth in this demand further exacerbates digital economy carbon emissions. However, post-2040, with ongoing technological advancements, the energy efficiency of data centers improves. This includes the adoption of more efficient processor technologies, energy-optimized storage solutions, and more advanced cooling systems, all contributing to reducing the energy consumption per unit of computation. Additionally, the optimization of software and algorithms can lower energy requirements, for example, through smarter workload distribution and energy management to reduce unnecessary energy consumption. At the same time, data centers are likely to increasingly utilize renewable energy sources, such as wind and solar power, as their electricity supply. With the continuing decline in costs and improvement in the efficiency of renewable energy technologies, coupled with increasing policy support, data center operators have stronger motivation and capability to transition to low-carbon energy solutions, thereby achieving a reduction in digital economy carbon emissions.

4.2.4. Analysis of the Result of DEGR Scenario

Adjusting the growth rate parameter of e-waste in the system and conducting further simulation yields the results shown in Figure 8. From the results, it can be observed that adjustments to the e-waste growth rate led to a slight increase in the trend of digital economy carbon emissions. Specifically, compared to the initial scenario, digital economy carbon emissions increased from 705.2 million tons to 1.5525 billion tons, an increase of 20.9 million tons, corresponding to a growth rate of 2.09%, peaking in 2041. This phenomenon reflects the accelerated usage and replacement frequency of electronic products under the thriving development of the digital economy, thereby leading to a significant increase in electronic waste. This covers a wide range of consumer electronics, such as mobile phones and computers, as well as infrastructure equipment supporting the backbone of the digital economy, like servers and networking devices. The growing demand for electronic waste management means more resources are needed to process these wastes, each stage accompanied by an increase in energy consumption. Particularly in the recycling and resource recovery stages, a substantial amount of energy is invested to extract valuable materials like gold, silver, copper, and other precious metals and rare elements. Moreover, if the efficiency of electronic waste processing is low, it could lead to increased energy consumption and loss of recyclable materials. Inefficient processing methods, such as direct landfilling or incineration, not only waste valuable resources but also generate significant greenhouse gas emissions. As digital economy carbon emissions begin to decline after peaking in 2041, the main reasons could be, firstly, that electronic product designs are gradually shifting towards more energy-efficient and recyclable directions. This transformation not only reduces waste generation at the end of the life cycle but also enhances the efficiency of product reuse and resource recovery, thereby lowering the energy consumption and corresponding carbon emissions needed to process these wastes. At the same time, public concern for environmental protection is increasing, prompting consumers to prefer eco-friendly electronic products and actively participate in recycling programs. This change in consumer behavior encourages companies to adopt more environmentally friendly production and recycling measures, thereby reducing overall carbon emissions. Furthermore, continuous advancements in electronic waste processing technology, such as more efficient material recovery methods and more eco-friendly waste treatment technologies, have also improved the energy efficiency of the processing, effectively controlling carbon emissions.

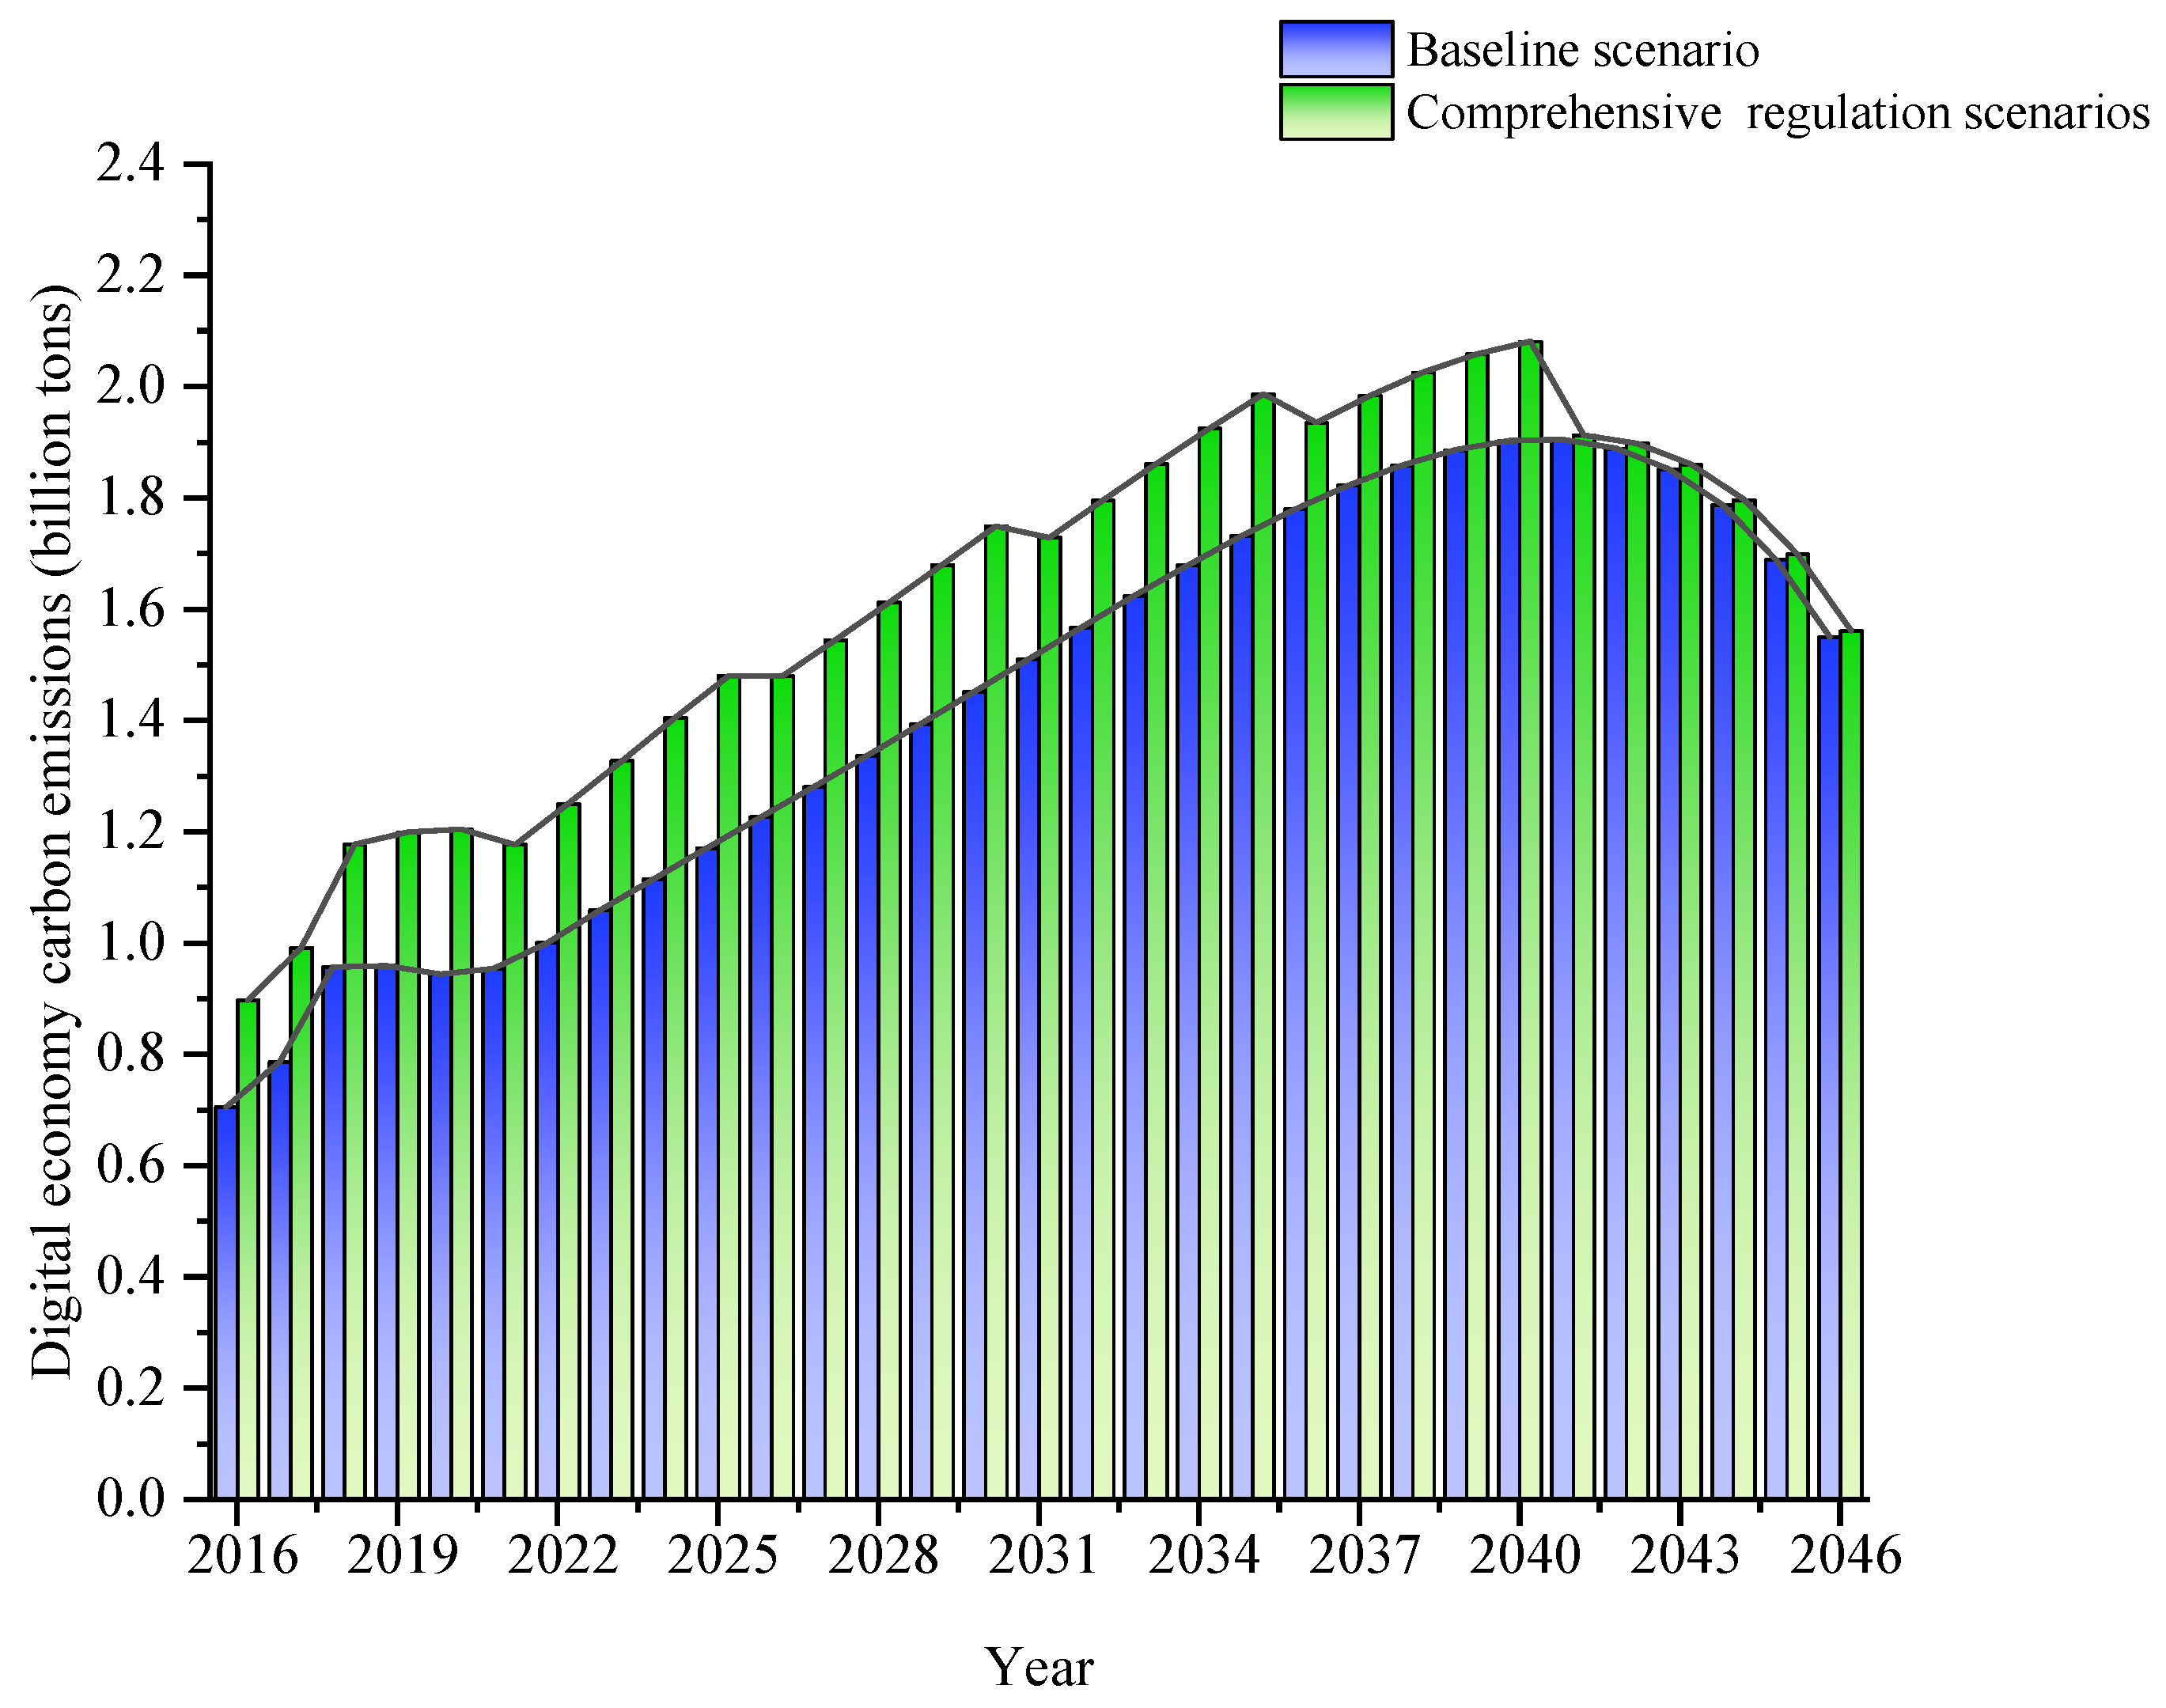
4.2.5. Analysis of the Result of Comprehensive Adjustment Scenario

Simulation conducted based on the set scenarios yields the results for the comprehensive control strategy on digital economy carbon emissions, as shown in Figure 9. The simulation results clearly show that under comprehensive control, carbon emissions exhibit a yearly increasing trend, steadily rising from 0.8971 million tons in 2016 to 1.56082 billion tons in 2046, with a peak reached in 2040 followed by a yearly decline. Compared to the baseline scenario, the comprehensive control strategy resulted in an increase of 176.83 million tons of carbon dioxide during the peak emission period. The initial increase in digital economy carbon emissions under comprehensive control is primarily due to the rapid expansion of the digital economy driving increased demand for data centers and energy, while the pace of improvement in energy use efficiency and the substitution with green energy sources could not keep up with this growth rate. Moreover, support for low-carbon transition and the raising of social awareness might lag, and the effective management of electronic waste could not sufficiently alleviate environmental pressure. These factors together contribute to an increase in digital economy carbon emissions over a certain period. However, as technological innovations continue and the energy structure transitions towards greener alternatives, along with the societal demand for sustainable development, more data centers and digital economy infrastructure switch to using renewable energy sources such as wind and solar energy. At the same time, the recycling and processing procedures of electronic waste are improved and the recycling rate of resources increases, effectively reducing the demand for resources and energy for new production activities, thereby gradually reducing the digital economy carbon emissions.

5. Discussion

The findings of this study indicate that the rapid development of the digital economy has led to a significant amount of carbon emissions, creating a notable digital carbon footprint. This trend primarily stems from the swift advancement of the digital economy, which has accelerated technological innovations, especially when the energy driven by technology predominantly comes from non-renewable sources. For instance, Jiaming Ke et al., in a study sampling 77 developing countries, found that the interaction between Information and Communication Technology (ICT) and financial development increased carbon emissions, a viewpoint that is validated by the existing literature [49]. Similarly, Feng Dong et al., using national-level panel data from 2008 to 2018, verified through a mediation effect model that the development of the digital economy promotes an increase in per capita carbon emissions [50]. Furthermore, Bassam et al., based on data from BRICS countries from 2011 to 2021 and considering the digital economy as one of the key variables, conducted an empirical test using the STIRPAT model and discovered that the digital economy has a promotional effect on carbon emissions [51]. These research conclusions align with the results of this paper.
However, some differences still exist. First, the aforementioned studies did not delve into the specific factors affecting the digital economy carbon emissions, merely treating it as one of the key variables to explore its relationship with carbon emissions. This paper fills this gap by employing a systematic approach to integrate and analyze the factors affecting the digital carbon footprint, such as the energy consumption of digital devices and electricity consumption of data centers, using the system dynamics method. This quantitative approach explores the future trends of carbon emissions from China’s digital economy, breaking through the limitations of primarily qualitative discussions of their relationship. Specifically, our simulation results predict that digital economy carbon emissions are expected to peak in 2040, reaching a total of 1.9044 billion tons.
Moreover, this study further explores the impact of the digital economy’s proportion, the growth rate of electronic waste, and the power consumption ratio of data centers on China’s digital economy carbon emissions under different scenarios. We found that an increase in the digital economy’s proportion, the growth of electronic waste, and the rise in data center power consumption all contribute to an increase in digital economy carbon emissions, consistent with the existing literature findings [9,52,53]. On the policy level, the government can effectively regulate future carbon reduction in the digital economy by implementing appropriate constraints. However, this research also reveals differences in the sensitivity of digital economy carbon emissions to these three factors. Specifically, the impact of data center power consumption on the rise in digital economy carbon emissions is more significant due to the extensive electricity required to maintain their operation and cooling systems. As the digital economy grows, the number and scale of data centers also increase, leading to a larger scale of electricity demand and exacerbating the problem of carbon emissions [53]. Therefore, the energy consumption of data centers can be considered a crucial indicator for future carbon reduction in China’s digital economy.
While this paper enriches the research on digital economy carbon emissions, it still has certain limitations. In terms of data, we used national-level data from China for our study. Future research could delve into regional-, provincial-, and city-level analyses to further explore the evolutionary trends of digital economy carbon emissions. This would help identify differences between regions and the regional sensitivity to specific policies affecting digital economy carbon emissions, thereby formulating more targeted emission reduction measures. Additionally, the selection of indicator variables and impact relationships in the model setup involves a degree of subjectivity. Therefore, future research needs to further optimize the model to better understand the internal logic of digital economy carbon emissions. At the same time, the parameter setting may involve some uncertainties, and the factors affecting digital economy carbon emissions vary, which may lead to inaccurate predictions of carbon emissions. Therefore, it is necessary to further explore better methods to handle this uncertainty. Lastly, this study focuses on assessing the environmental carbon footprint of the digital economy, but we recognize that social dimensions are equally important. As emphasized by Di Cesare et al. and Cartone and Postiglione, social life cycle assessment (S-LCA) provides a framework for systematically assessing the social and socio-economic impacts of products and services throughout their life cycle [54,55]. Future research will investigate how digitalization affects social welfare, including labor conditions, human rights, and community well-being, as well as studies on digital inequality and the impact of the proliferation of digital technologies on different population groups. We hope to provide a more comprehensive perspective on the sustainability of the digital economy by integrating environmental and social life cycle assessments. Finally, future efforts will consider adopting an interdisciplinary approach, combining knowledge from environmental science, sociology, economics, and other fields, to fully assess the sustainability of the digital economy and provide evidence-based recommendations for policymaking.

6. Conclusions and Policy Implications

6.1. Conclusions

Drawing upon considerations of the digital carbon footprint, this paper meticulously examines the interplay among its diverse elements and delves into the intricacies of its emission trajectory. Taking into consideration the developmental dynamics of China’s economy, transportation sector, energy consumption from digital devices, population size, energy utilization in data centers, and electronic waste, the principles and methodologies of system dynamics are employed. Models and simulation experiments for the digital carbon footprint are established using the Vensim PLE 7.5.3 simulation software. Concurrently, four distinct scenarios are formulated to dynamically simulate the trend changes in China’s digital economy carbon emissions spanning the years from 2016 to 2046. This is achieved by adjusting parameters related to the percentage of the digital economy, the share of power consumption attributed to data centers, and the growth rate of e-waste. Based on the simulation results, the following conclusions were drawn:
(1) The baseline scenario simulation reveals an initial increase followed by a decrease in carbon emissions from China’s digital economy. From 2016 to 2046, the digital economy carbon emissions increased from 0.7052 billion tons to 1.54041 billion tons, peaking in 2041, before gradually decreasing. This trend underscores the substantial impact of the digital economy’s rapid development on energy consumption and carbon emissions. However, widespread adoption of energy efficiency improvements and green technologies leads to a post-peak decline in emissions, signaling the potential for future low-carbon development.
(2) The single-scenario simulation results indicate that the development of the digital economy, the growth of electronic waste, and the electricity consumption of data centers each significantly impact the digital economy carbon emissions. Initially, when a single variable of the digital economy is independently adjusted, carbon emissions peak in 2040 at 1.92051 billion tons. Following this peak, emissions begin to decline, reaching 1.55873 billion tons in 2046, a 0.54% increase from the baseline scenario. Despite a slight decrease in 2046, the modest reduction suggests that the rapid development of the digital economy continues to have a long-term impact on carbon emissions. Additionally, adjusting the growth rate of electronic waste shows that digital economy carbon emissions increase from 705.2 million tons to 1.5525 billion tons, an increase of 20.9 million tons or a 2.09% growth rate, peaking in 2041 before declining. Among these factors, the percentage of electricity consumption in data centers significantly affects the digital economy carbon emissions. Carbon emissions reach a peak of 2.16756 billion tons during the peak carbon period. Analyzing the timing of reaching peak carbon emissions according to individual control measures, the sequence from earliest to latest is as follows: digital economy = electricity consumption of data centers > electronic waste. Thus, both the digital economy and the electricity consumption of data centers reach their peak carbon emissions in 2040, while the peak for electronic waste control occurs in 2041.
(3) The results of the comprehensive scenario simulation show a steady increase in digital economy carbon emissions, from 897.06 million tons in 2016 to 1.56082 billion tons in 2046, peaking in 2040 before gradually declining each year. Compared to the baseline scenario, the comprehensive control strategy resulted in an additional 176.83 million tons of carbon dioxide emissions during the peak period. This scenario, which incorporates a variety of control measures, more closely reflects real-world conditions. The economy, data centers, and electronic waste management are likely at a critical stage of development. During this period, guiding and regulating industry development towards more environmentally friendly and sustainable practices can reduce carbon emission levels. Leveraging this period of opportunity to formulate policies that support low-carbon technological innovation and green development will encourage the digital economy sector to more actively engage in carbon reduction efforts.

6.2. Policy Implications

This paper’s findings suggest three policy implications for reducing China’s digital economy carbon emissions:
Firstly, it is necessary to promote digital industry innovation to reduce energy consumption. With the rapid development of the digital industry, China urgently needs to adjust its development structure, empowering downstream technological innovation in the digital industry, improving resource efficiency, and reducing energy consumption in equipment manufacturing and operation, thereby reducing digital economy carbon emissions. Meanwhile, financial support and R&D subsidies should be provided to promote the innovation and application of green digital technologies. It is necessary to integrate digital with green, accelerating industry transformation, and to deeply integrate emerging technologies such as 5G, artificial intelligence, big data, and cloud computing to promote the coordinated development of digitalization and green low-carbon industries. Seizing the opportunities of a new round of technological revolution and industrial transformation, taking control of future development is a crucial initiative. China urgently needs to deeply integrate emerging technologies such as 5G, AI, big data, and cloud computing with the green low-carbon industry, attract and aggregate global digital and green technological innovation elements, accelerate the coordinated transformation of industrial digitalization and greening, seize new opportunities, explore new fields, and win new races in international competition, securing a strategic initiative in building a modern industrial system.
Secondly, the aim should be the circular use of digital devices, focusing on building a complete electronic waste treatment industry chain. It is necessary to increase R&D investment in electronic waste treatment technology and promote related technological innovation and application, thereby improving treatment efficiency and resource recovery rate. This includes enhancing waste classification, disassembly, recycling, reuse, and disposal technology levels and developing new environmentally friendly materials and processes. At the same time, an electronic waste recycling network covering all urban and rural areas of China should be established. This measure can be realized by setting up recycling points and establishing recycling channels and logistics systems, allowing the public to recycle discarded digital devices. In addition, it emphasizes that governments, businesses, and social organizations should strengthen cooperation to jointly promote the construction and improvement of the electronic waste treatment industry chain. Through industry alliances, platforms, or cooperation mechanisms, resources, technologies, and experiences can be shared to solve various problems in electronic waste treatment. The organic combination of these measures will lay a solid foundation for the sustainable recycling of digital devices, making a positive contribution to the sustainable development of the digital industry.
Additionally, the construction of digital industry infrastructure should be planned, improving the efficiency of digital hardware usage. By conducting a comprehensive assessment of resources in specific areas, including energy supply, water resources, and land use, the sustainability of infrastructure layout and construction can be ensured, thereby reducing resource waste and negative environmental impacts. At the same time, it is necessary to deeply analyze the technical demands of the local digital industry and precisely configure infrastructure such as network bandwidth and data center capacity, to not only meet the use needs of different digital devices but also improve the utilization efficiency and stability of digital hardware. Introducing intelligent technologies, promoting the application of green energy, and optimizing data center designs further enhance the sustainability and energy efficiency of digital hardware, promoting the green development of the digital industry. In addition, to respond to the ever-changing market demands and technological innovations, infrastructure design should be flexible and equipped with comprehensive monitoring and management systems. This enables timely adjustments to infrastructure layout and operation plans, ensuring the continuous development of the digital industry and efficient use of digital hardware.
Finally, digital carbon footprint education and promotion activities should be actively carried out. The government and educational organizations should jointly carry out themed education on digital carbon footprints, raise public awareness of digital economy carbon emissions, and provide practical suggestions for digital lifestyles and carbon reduction, encouraging individuals and families to reduce unnecessary digital activities and energy consumption to mitigate the negative impact of the digital economy on the environment. In the future, the government and educational institutions should further cooperate, incorporating low-carbon digital technology and environmental protection awareness into the educational curriculum. Through educational system reform, more talents with sustainable development awareness and skills can be cultivated for the digital age, injecting new vitality into the development of China’s digital economy. This comprehensive educational strategy not only helps reduce the overall digital carbon footprint of society but also cultivates more citizens actively participating in sustainable development, laying a solid foundation for building a green, low-carbon digital society.

Author Contributions

All authors contributed to the conceptualization and design of this study. The topic selection, methodology design, data collection, and modeling analysis were carried out by K.J., Z.Y., C.W. and Y.X., respectively. The first draft of this manuscript was written by R.X. and all authors commented on previous versions of this manuscript. All authors have read and agreed to the published version of the manuscript.

Funding

This work was supported by the National Social Science Foundation of China under the project “Research on the Potential of Reducing China’s Digital Carbon Footprint and Offsetting Mechanisms under the “Dual-Carbon” Goal”, Project Approval No. [22BJY139].

Institutional Review Board Statement

Not applicable.

Informed Consent Statement

Not applicable.

Data Availability Statement

Data are contained within the article.

Conflicts of Interest

The authors have no relevant financial or non-financial interests to disclose.

Appendix A

Table A1. Values and equations of factors in the SD model.
ParametersParameter Value/EquationUnitParameter Sources
GDP growth rate[(0,0)-(60,10)], (0,0.0835),(1,0.1147),
(2,0.1048),(3,0.1049),(4,0.0731),(5,0.0874),(6,0.13385),(10,0.1),(15,0.09),(20,0.08),(35,0.07),(45,0.02)
%Table function
Growth rate in electricity consumption[(0,0)-(15,10)],(0,0.066),(1,0.0655),(2,0.085),
(3,0.056),(4,0.0395),(5,0.1067),(6,0.039),(7,0.038),(10,0.035),(15,0.03)
%Table function
Oil-vehicle production growth rate[(0,−0.2)-(20,10)],(0,0.027),(1,0.131),
(2,0.032),(3,−0.038),(4,−0.08),(5,−0.014),(10,−0.01),(20,−0.005)
%Table function
Oil-vehicle scrapping growth rate[(0,−0.05)-(20,10)],(0,−0.04055),(1,0.0317),
(2,0.1435),(3,0.1526),(4,0.1637),
(10,0.17),(20,0.18)
%Table function
Growth rate of energy consumption of digital devices[(0,0)-(20,10)],(0,0.06098),(1,0.0724),
(2,0.0843),(3,0.2637),(4,0.0795),(5,0.01829),
(10,0.02829),(20,0.029)
%Table function
Growth rate of energy consumption[(0,0)-(20,10)],(0,0.0169),(1,0.03246),
(2,0.0353),(3,0.03297),(4,0.0222),(5,0.0515),
(10,0.06),(20,0.065)
%Table function
Birth rate0.07%Statistic book
Internet penetration[(0,0)-(20,10)],(0,0.503), (1,0.532), (2,0.558), (3,0.596), (4,0.645), (5,0.704), (6,0.73), (10,0.8), (20,0.85)%Table function
Electrical waste growth rate0.035%The literature [56]
Average growth rate of aviation carbon emissions0.0968%The literature [57]
Average growth rate of ship carbon emissions0.02767%The literature [57]
Electricity carbon emissions factor2.79DMNLThe literature [58]
Oil-vehicle carbon emissions factor0.00397DMNLThe literature [59]
Percentage of data centers’ power consumption0.01%The literature [60]
Gross domestic product (GDP)INTEG (economic growth, 688,858.2)billion YuanFunction equation method
Population sizeINTEG (population growth—population decline, 137,462)10,000 peopleFunction equation method
Oil-vehicle ownershipINTEG (vehicles production—vehicles scrapping, 2296.7)10,000 vehiclesFunction equation method
Digital economy carbon dioxide emissionsCarbon emissions from electronic waste + transportation carbon emissions + carbon emissions of digital devices + digital carbon emissions of the population + data center carbon emissions10,000 tonsFunction equation method
Growth in economyGDP × GDP growth rate10,000 yuanRatio analysis method
Carbon emissions of personal digital devicesCarbon emissions of personal computers + carbon emissions of personal communication devices + carbon emissions of personal digital media + carbon emissions of personal smart devices10,000 tonsFunction equation method
The volume of e-waste disposedINTEG (growth in electrical waste volume, 348)10,000 tonsFunction equation method
Transportation carbon emissionsOwnership of oil vehicles × oil-vehicle carbon emissions factor10,000 tonsRatio analysis method
Population growthPopulation size × (birth rate + natural population growth rate)10,000 peopleRatio analysis method
Population declinePopulation size × death rate10,000 peopleRatio analysis method
Data center carbon emissionsData center energy consumption × electricity carbon emissions factor10,000 tonsRatio analysis method
Digital carbon emissions of the populationPopulation size × carbon emissions of personal digital devices10,000 tonsRatio analysis method
Transportation carbon emissionsShip transportation carbon emissions + air transportation carbon emissions + carbon emissions from oil vehicles10,000 tonsFunction equation method
Carbon emissions of digital devicesEnergy consumption of digital devices × energy carbon emissions factor × energy efficiency10,000 tonsRatio analysis method
Fiscal revenueGDP × 0.4410,000 yuanRatio analysis method
Technology investmentPercentage of digital economy × financial revenue10,000 yuanRatio analysis method
Growth in electricity consumptionElectricity consumption of the whole society × growth rate of electricity consumptionbillion kWhRatio analysis method
Energy consumption of digital deviceINTEG (growth in energy consumption of digital devices, 3149)10,000 tonsFunction equation method

References

  1. Zhu, M.; Huang, H.; Ma, W. Transformation of natural resource use: Moving towards sustainability through ICT-based improvements in green total factor energy efficiency. Resour. Policy 2023, 80, 103228. [Google Scholar] [CrossRef]
  2. Rong, K. Research agenda for the digital economy: An IBCDE framework. J. Digit. Econ. 2022, 1, 20–31. [Google Scholar] [CrossRef]
  3. Liu, Y.; Tong, K.; Mao, F.; Yang, J. Research on digital production technology for traditional manufacturing enterprises based on industrial Internet of Things in 5G era. Int. J. Adv. Manuf. Technol. 2019, 107, 1101–1114. [Google Scholar] [CrossRef]
  4. Hashem, I.A.T.; Chang, V.; Anuar, N.B.; Adewole, K.S.; Yaqoob, I.; Gani, A.B.; Ahmed, E.; Chiroma, H. The role of big data in smart city. Int. J. Inf. Manag. 2016, 36, 748–758. [Google Scholar] [CrossRef]
  5. Sharma, P.; Dash, B. The Digital Carbon Footprint: Threat to an Environmentally Sustainable Future. Int. J. Comput. Sci. Inf. Technol. 2022, 14, 19–29. [Google Scholar] [CrossRef]
  6. Liu, J.; Yu, Q.; Chen, Y.-Y.; Liu, J. The impact of digital technology development on carbon emissions: A spatial effect analysis for China. Resour. Conserv. Recycl. 2022, 185, 106445. [Google Scholar] [CrossRef]
  7. Chen, X.-Q.; Mao, S.; Lv, S.; Fang, Z. A Study on the Non-Linear Impact of Digital Technology Innovation on Carbon Emissions in the Transportation Industry. Int. J. Environ. Res. Public Health 2022, 19, 12432. [Google Scholar] [CrossRef] [PubMed]
  8. Popkova, E.G.; De Bernardi, P.; Tyurina, Y.; Sergi, B.S. A theory of digital technology advancement to address the grand challenges of sustainable development. Technol. Soc. 2022, 68, 101831. [Google Scholar] [CrossRef]
  9. Liao, Z.; Ru, S.; Cheng, Y. A Simulation Study on the Impact of the Digital Economy on CO2 Emission Based on the System Dynamics Model. Sustainability 2023, 15, 3368. [Google Scholar] [CrossRef]
  10. Rees, W.E. Ecological footprints and appropriated carrying capacity: What urban economics leaves out. Environ. Urban. 1992, 4, 121–130. [Google Scholar] [CrossRef]
  11. Wang, C.; Wang, L.; Liu, X.; Du, C.; Ding, D.; Jia, J.; Yan, Y.; Wu, G. Carbon footprint of textile throughout its life cycle: A case study of Chinese cotton shirts. J. Clean. Prod. 2015, 108, 464–475. [Google Scholar] [CrossRef]
  12. Qu, s.; Shi, D.; Yang, D. Carbon emission of China’s digital economy: Calculations and trend outlook. China Popul. Resour. Environ. 2022, 32, 11–21. [Google Scholar]
  13. Malmodin, J.; Lundén, D. The Energy and Carbon Footprint of the Global ICT and E&M Sectors 2010–2015. Sustainability 2018, 10, 3027. [Google Scholar]
  14. Fuchs, C. The implications of new information and communication technologies for sustainability. Environ. Dev. Sustain. 2008, 10, 291–309. [Google Scholar] [CrossRef]
  15. Riahi, K.; Vuuren, D.V.; Kriegler, E.; Edmonds, J.; O’Neill, B.C.; Fujimori, S.; Bauer, N.; Calvin, K.V.; Dellink, R.; Fricko, O.; et al. The Shared Socioeconomic Pathways and their energy, land use, and greenhouse gas emissions implications: An overview. Glob. Environ. Change Hum. Policy Dimens. 2017, 42, 153–168. [Google Scholar] [CrossRef]
  16. He, J.; Li, Z.; Zhang, X.; Wang, H.; Dong, W.; Du, E.; Chang, S.; Ou, X.; Guo, S.; Tian, Z.; et al. Towards carbon neutrality: A study on China’s long-term low-carbon transition pathways and strategies. Environ. Sci. Ecotechnology 2021, 9, 100134. [Google Scholar] [CrossRef] [PubMed]
  17. Zhang, F.; Xu, N.; Wu, F. Research on China’s CO2 emissions projections from 2020 to 2100 under the shared socioeconomic pathways. Environ. Sci. Ecotechnology 2021, 41, 9691–9704. [Google Scholar]
  18. Gan, L.; Liu, Y.; Cai, W. Carbon neutral projections of public buildings in China under the shared socioeconomic pathways: A tertiary industry perspective. Environ. Impact Assess. Rev. 2023, 103, 107246. [Google Scholar] [CrossRef]
  19. Zhang, C.; Luo, H. Research on carbon emission peak prediction and path of China’s public buildings: Scenario analysis based on LEAP model. Energy Build. 2023, 289, 113053. [Google Scholar] [CrossRef]
  20. Liu, C.; Sun, W.-Z.; Li, P.; Zhang, L.; Li, M. Differential characteristics of carbon emission efficiency and coordinated emission reduction pathways under different stages of economic development: Evidence from the Yangtze River Delta, China. J. Environ. Manag. 2022, 330, 117018. [Google Scholar] [CrossRef] [PubMed]
  21. Fan, G.; Zhu, A.; Xu, H. Analysis of the Impact of Industrial Structure Upgrading and Energy Structure Optimization on Carbon Emission Reduction. Sustainability 2023, 15, 3489. [Google Scholar] [CrossRef]
  22. Lantz, V.A.; Feng, Q. Assessing income, population, and technology impacts on CO2 emissions in Canada: Where’s the EKC? Ecol. Econ. 2006, 57, 229–238. [Google Scholar] [CrossRef]
  23. Luna, T.F.; Uriona-Maldonado, M.; Silva, M.E.; Vaz, C.R. The influence of e-carsharing schemes on electric vehicle adoption and carbon emissions: An emerging economy study. Transp. Res. Part D-Transp. Environ. 2020, 79, 102226. [Google Scholar] [CrossRef]
  24. Karamouz, M.; Zare, M.H.; Ebrahimi, E. System Dynamics-based Carbon Footprint Assessment of Industrial Water and Energy Use. Water Resour. Manag. 2023, 37, 2039–2062. [Google Scholar] [CrossRef]
  25. Chen, X.; Di, Q.; Hou, Z.; Yu, Z. Measurement of carbon emissions from marine fisheries and system dynamics simulation analysis: China’s northern marine economic zone case. Mar. Policy 2022, 145, 105279. [Google Scholar] [CrossRef]
  26. Forrester, J.W. Counterintuitive behavior of social systems. Theory Decis. 1971, 2, 109–140. [Google Scholar] [CrossRef]
  27. Kozlovskyi, S.; Bilenko, D.; Kuzheliev, M.; Lavrov, R.; Kozlovskyi, V.; Mazur, H.; Taranych, A. The system dynamic model of the labor migrant policy in economic growth affected by COVID-19. Glob. J. Environ. Sci. Manag. 2020, 6, 95–106. [Google Scholar]
  28. Yusaf, T.; Laimon, M.; Alrefae, W.; Kadirgama, K.; Dhahad, H.A.; Ramasamy, D.; Kamarulzaman, M.K.; Yousif, B. Hydrogen Energy Demand Growth Prediction and Assessment (2021–2050) Using a System Thinking and System Dynamics Approach. Appl. Sci. 2022, 12, 781. [Google Scholar] [CrossRef]
  29. Jiang, S.; Li, Y.; Lu, Q.; Hong, Y.; Guan, D.; Xiong, Y.; Wang, S. Policy Assessments for the Carbon Emission Flows and Sustainability of Bitcoin Blockchain Operation in China; Research Square: Durham, NC, USA, 2020. [Google Scholar] [CrossRef]
  30. Open Data Center Council. Data Center Computing Carbon Efficiency White Paper. Available online: http://www.odcc.org.cn/download/24 (accessed on 30 January 2022).
  31. Almalki, F.A.; Alsamhi, S.H.; Sahal, R.; Hassan, J.; Hawbani, A.; Rajput, N.S.; Saif, A.; Morgan, J.; Breslin, J.G. Green IoT for Eco-Friendly and Sustainable Smart Cities: Future Directions and Opportunities. Mob. Netw. Appl. 2021, 28, 178–202. [Google Scholar] [CrossRef]
  32. Godil, D.I.; Yu, Z.; Sharif, A.; Usman, R.; Khan, S.A.R. Investigate the role of technology innovation and renewable energy in reducing transport sector CO2 emission in China: A path toward sustainable development. Sustain. Dev. 2021, 29, 694–707. [Google Scholar] [CrossRef]
  33. Kurniawan, T.A.; Othman, M.H.D.; Liang, X.; Goh, H.; Gikas, P.; Kusworo, T.D.; Anouzla, A.; Chew, K.W. Decarbonization in waste recycling industry using digitalization to promote net-zero emissions and its implications on sustainability. J. Environ. Manag. 2023, 338, 117765. [Google Scholar] [CrossRef] [PubMed]
  34. Kirton, J.J.; Warren, B. G20 Governance of Digitalization. Int. Organ. Res. J. 2018, 13, 17–40. [Google Scholar] [CrossRef]
  35. Akbari, F.; Mahpour, A.; Ahadi, M. Evaluation of Energy Consumption and CO2 Emission Reduction Policies for Urban Transport with System Dynamics Approach. Environ. Model. Assess. 2020, 25, 505–520. [Google Scholar] [CrossRef]
  36. Cao, Z.; Zhou, X.; Hu, H.; Wang, Z.; Wen, Y. Toward a Systematic Survey for Carbon Neutral Data Centers. IEEE Commun. Surv. Tutor. 2021, 24, 895–936. [Google Scholar] [CrossRef]
  37. Mulrow, J.; Gali, M.; Grubert, E. The cyber-consciousness of environmental assessment: How environmental assessments evaluate the impacts of smart, connected, and digital technology. Environ. Res. Lett. 2021, 17, 013001. [Google Scholar] [CrossRef]
  38. Zhang, W.; Zhang, M.; Wu, S.; Liu, F. A complex path model for low-carbon sustainable development of enterprise based on system dynamics. J. Clean. Prod. 2021, 321, 128934. [Google Scholar] [CrossRef]
  39. Ghosh, B.K.; Mekhilef, S.; Ahmad, S.; Ghosh, S.K. A Review on Global Emissions by E-Products Based Waste: Technical Management for Reduced Effects and Achieving Sustainable Development Goals. Sustainability 2022, 14, 4036. [Google Scholar] [CrossRef]
  40. Zhang, W.; Zhao, S.; Wan, X.; Yao, Y. Study on the effect of digital economy on high-quality economic development in China. PLoS ONE 2021, 16, e0257365. [Google Scholar] [CrossRef] [PubMed]
  41. Li, M.; Wang, Q. Will technology advances alleviate climate change? Dual effects of technology change on aggregate carbon dioxide emissions. Energy Sustain. Dev. 2017, 41, 61–68. [Google Scholar] [CrossRef]
  42. Chatti, W. Moving towards environmental sustainability: Information and communication technology (ICT), freight transport, and CO2 emissions. Heliyon 2021, 7, e08190. [Google Scholar] [CrossRef] [PubMed]
  43. Li, Z.; Wang, J. The Dynamic Impact of Digital Economy on Carbon Emission Reduction: Evidence City-level Empirical Data in China. J. Clean. Prod. 2022, 351, 131570. [Google Scholar] [CrossRef]
  44. Sun, J.; Chen, J. Digital Economy, Energy Structure Transformation, and Regional Carbon Dioxide Emissions. Sustainability 2023, 15, 8557. [Google Scholar] [CrossRef]
  45. Słoma, M. Carbon footprint of electronic devices. In Proceedings of the Electron Technology Conference, Ryn, Poland, 25 July 2013. [Google Scholar]
  46. Varjovi, A.E.; Babaie, S. Green Internet of Things (GIoT): Vision, applications and research challenges. Sustain. Comput. Inform. Syst. 2020, 28, 100448. [Google Scholar] [CrossRef]
  47. Lykou, G.; Mentzelioti, D.; Gritzalis, D. A new methodology toward effectively assessing data center sustainability. Comput. Secur. 2017, 76, 327–340. [Google Scholar] [CrossRef]
  48. Li, D.; Huang, G.; Zhu, S.; Chen, L.; Wang, J. How to peak carbon emissions of provincial construction industry? Scenario analysis of Jiangsu Province. Renew. Sustain. Energy Rev. 2021, 144, 110953. [Google Scholar] [CrossRef]
  49. Ke, J.; Jahanger, A.; Yang, B.; Usman, M.; Ren, F. Digitalization, Financial Development, Trade, and Carbon Emissions; Implication of Pollution Haven Hypothesis During Globalization Mode. Front. Environ. Sci. 2022, 10, 873880. [Google Scholar] [CrossRef]
  50. Dong, F.; Hu, M.; Gao, Y.; Liu, Y.; Zhu, J.; Pan, Y. How does digital economy affect carbon emissions? Evidence from global 60 countries. Sci. Total Environ. 2022, 852, 158401. [Google Scholar] [CrossRef] [PubMed]
  51. Karaki, B.A.; Al_kasasbeh, O.; Alassuli, A.; Alzghoul, A. The Impact of the Digital Economy on Carbon Emissions using the STIRPAT Model. Int. J. Energy Econ. Policy 2023, 13, 139–143. [Google Scholar] [CrossRef]
  52. Mangmeechai, A. The life-cycle assessment of greenhouse gas emissions and life-cycle costs of e-waste management in Thailand. Sustain. Environ. Res. 2022, 32, 16. [Google Scholar] [CrossRef]
  53. Rong, H.; Zhang, H.-H.; Xiao, S.; Li, C.; Hu, C. Optimizing energy consumption for data centers. Renew. Sustain. Energy Rev. 2016, 58, 674–691. [Google Scholar] [CrossRef]
  54. Arzoumanidis, I.; Walker, A.M.; Petti, L.; Raggi, A. Life Cycle-Based Sustainability and Circularity Indicators for the Tourism Industry: A Literature Review. Sustainability 2021, 13, 11853. [Google Scholar] [CrossRef]
  55. Di Cesare, S.; Silveri, F.; Sala, S.; Petti, L. Positive impacts in social life cycle assessment: State of the art and the way forward. Int. J. Life Cycle Assess. 2018, 23, 406–421. [Google Scholar] [CrossRef]
  56. WHO. Children and the Digital Garbage Patch: E-Waste Exposure and Children’s Health. Available online: https://www.who.int/zh/publications/i/item/9789240023901 (accessed on 15 June 2022).
  57. Peng, T.; Yuan, Z.; Ren, L. Pathway for China’s Transport Sector Towards Carbon Neutrality Target. CJAE 2022, 12, 351–359. [Google Scholar]
  58. Wang, H.; Xiao, L.; Liao, B. Simulation of China’s carbon emission reduction path based on system dynamics. J. Nat. Resour. 2022, 37, 1352–1369. [Google Scholar] [CrossRef]
  59. Ren, J.; Zhang, B.; Bai, H.; Fang, J. The Full Life-Cycle Carbon Footprint of a Car. Available online: http://epaper.bjnews.com.cn/html/2022-07/20/content_820322.htm (accessed on 20 July 2022).
  60. WWF China. China Data Center Renewable Energy Application Development Report. 2020. Available online: https://www.wwfchina.org/news-detail?id=2033&type=3 (accessed on 7 January 2022).
Figure 1. The research framework.
Sustainability 16 04230 g001
Figure 2. Sources of digital economy carbon emissions.
Sustainability 16 04230 g002
Figure 3. Digital carbon footprint causal chain.
Sustainability 16 04230 g003
Figure 4. Digital carbon footprint stock–flow diagram.
Sustainability 16 04230 g004
Figure 5. Digital economy carbon emissions, 2016–2046.
Sustainability 16 04230 g005
Figure 6. Digital economy carbon emissions under adjusted percentage of the digital economy.
Sustainability 16 04230 g006
Figure 7. Digital economy carbon emissions under adjusted data center power consumption.
Sustainability 16 04230 g007
Figure 8. Digital economy carbon emissions under adjusted e-waste growth rate.
Sustainability 16 04230 g008
Figure 9. Digital economy carbon emissions under comprehensive regulation.
Sustainability 16 04230 g009
Table 1. Subsystems and their main variables.
SubsystemsKey Variables
Economic development subsystemGross domestic product, growth in economy, economic growth rate, financial revenue, percentage of digital economy, and technology investment
Transportation subsystemOil-vehicle production, oil-vehicle growth, oil-vehicle ownership, oil-vehicle scrapping growth, oil-vehicle scrapping growth rate, oil-vehicle carbon emission factor, air transportation carbon emission, ship transportation carbon emission, and aviation carbon emission growth
Digital device energy consumption subsystemEnergy consumption growth of digital devices, energy consumption growth rate of digital devices, energy consumption of digital devices, energy efficiency, carbon emissions of digital devices, and energy carbon emission factor
Population subsystemPopulation size, population growth, population decline, birth rate, natural population growth rate, mortality rate, digital economy carbon emissions of the population, and Internet penetration rate
Data center energy consumption subsystemPower consumption growth, power consumption growth rate, data center carbon emission, data center power consumption percentage, electricity carbon emission factor, and data center energy consumption
E-waste discharge subsystemAverage e-waste carbon emission, e-waste disposal, e-waste carbon emission, and e-waste growth rate
Table 2. Scenario simulation programming.
ScenariosScenarios FeaturesModel Adjustment
Scenario 1No policy restrictionsNo additional adjustments
Scenario 2Digital economy scaling adjustmentControlling the pace of digital economy development and setting different scenarios for digital economy percentage
Scenario 3Data center power consumption adjustmentAdjusting the percentage of power consumption in the data center and setting up different energy consumption scenarios
Scenario 4E-waste growth rate adjustmentAdjusting e-waste growth rates and setting different e-waste growth rates
Scenario 5Comprehensive adjustmentCombined adjustments
Table 3. Digital economy scaling adjustment.
Time Period2016–20202021–20252026–20302031–20352035–20402040–2045
Percentage of digital economy30%35%40%45%50%55%
Table 4. Data center power consumption adjustment.
Time Period2016–20202021–20252026–20302031–20352035–20402040–2045
Percentage of data center power consumption30%35%40%45%50%55%
Table 5. E-waste growth rate adjustment.
Time Period2016–20202021–20252026–20302031–20352035–20402040–2045
E-waste growth rate regulation30%35%40%45%50%55%
Table 6. Comprehensive scenario regulation.
Time Period2016–20202021–20252026–20302031–20352035–20402040–2045
Percentage of digital economy30%35%40%45%50%55%
Percentage of data center power consumption2.1%1.9%1.7%1.5%1.3%1%
E-waste growth rate regulation6.5%6.0%5.5%5.0%4.8%4.5%
Table 7. Actual and simulated values of variables, including error results.
YearGross Economic Product (GDP)Electricity Consumption of the Whole SocietyPopulation Size
Real ValueSimulation ValueError RateActual ValueSimulation ValueError RateActual ValueSimulation ValueError Rate
2016746,395.1746,378.0−0.00261,205.161,849.31.050139,232137,943−0.926
2017832,035.9831,987.0−0.00665,914.065,900.5−0.020140,011138,426−1.132
2018919,281.1919,180.0−0.01171,508.271,502.0−0.008140,541138,910−1.161
2019986,515.21,015,600.02.94074,866.175,506.10.850141,008139,397−1.142
20201,013,567.01,018,940.00.50077,620.278,488.61.120141,212139,884−0.940
Disclaimer/Publisher’s Note: The statements, opinions and data contained in all publications are solely those of the individual author(s) and contributor(s) and not of MDPI and/or the editor(s). MDPI and/or the editor(s) disclaim responsibility for any injury to people or property resulting from any ideas, methods, instructions or products referred to in the content.

